Article

Thermal History and Hydrocarbon Accumulation Stages in Majiagou Formation of Ordovician in the East-Central Ordos Basin

by
Hua Tao
1,
Junping Cui
1,2,*,
Fanfan Zhao
1,
Zhanli Ren
1,2,
Kai Qi
1,
Hao Liu
1 and
Shihao Su
1
1
Department of Geology, Northwest University, Xi’an 710069, China
2
State Key Laboratory of Continental Dynamics, Northwest University, Xi’an 710069, China
*
Author to whom correspondence should be addressed.
Energies 2024, 17(17), 4435; https://doi.org/10.3390/en17174435
Submission received: 30 July 2024 / Revised: 29 August 2024 / Accepted: 31 August 2024 / Published: 4 September 2024

Abstract

The marine carbonates in the Ordovician Majiagou Formation in the Ordos Basin have significant exploration potential. Research has focused on their thermal history and hydrocarbon accumulation stages, as these are essential for guiding the exploration and development of hydrocarbons. In this paper, we study the thermal evolution history of the carbonate reservoirs of the Ordovician Majiagou Formation in the east-central Ordos Basin. Furthermore, petrographic and homogenization temperature studies of fluid inclusions were carried out to further reveal the hydrocarbon accumulation stages. The results demonstrate that the degree of thermal evolution of the Ordovician carbonate reservoirs is predominantly influenced by the deep thermal structure, exhibiting a trend of high to low values from south to north in the central region of the basin. The Fuxian area is located in the center of the Early Cretaceous thermal anomalies, with the maturity degree of the organic matter ranging from 1 to 3.2%, with a maximum value of 3.2%. The present geothermal gradient of the Ordovician Formation exhibits the characteristics of east–high and west–low, with an average of 28.6 °C/km. The average paleo-geotemperature gradient is 54.2 °C/km, the paleoheat flux is 55 mW/m2, and the maximum paleo-geotemperature reaches up to 270 °C. The thermal history recovery indicates that the Ordovician in the central part of the basin underwent three thermal evolution stages: (i) a slow warming stage before the Late Permian; (ii) a rapid warming stage from the end of the Late Permian to the end of the Early Cretaceous; (iii) a cooling stage after the Early Cretaceous, with the hydrocarbon production of hydrocarbon source rocks weakening. In the central part of the basin, the carbonate rock strata of the Majiagou Formation mainly developed asphalt inclusions, natural gas inclusions, and aqueous inclusions. The fluid inclusions can be classified into two stages. The early-stage fluid inclusions are mainly present in dissolution holes. The homogenization temperature is 110–130 °C; this coincides with the hydrocarbon charging period of 210–165 Ma, which corresponds to the end of the Triassic to the end of the Middle Jurassic. The late-stage fluid inclusions are in the dolomite vein or late calcite that filled the gypsum-model pores. The homogenization temperature is 160–170 °C; this coincides with the hydrocarbon charging period of 123–97 Ma, which corresponds to the late Early Cretaceous. Both hydrocarbon charging periods are in the rapid stratigraphic warming stage.

1. Introduction

The Ordos Basin has a long history of oil and gas exploration, and the Ordovician formation has emerged as a significant exploration target in the basin since the 1990s when high-yielding industrial gas flow from Ordovician carbonate reservoirs was achieved at the Shancan 1 well [1]. The Ordovician gas reservoirs are primarily composed of weathering crust dissolution pore reservoirs and dolomite intercrystalline pore reservoirs [2]. The carbonate gas reservoirs in the east-central Ordos Basin primarily develop in the form of weathered crust due to the presence of Carboniferous/Ordovician unconformity. The proven reserves are estimated at approximately 2384.85 × 108 m3 [3]. Ultra-deep marine carbonate formations, with burial depths exceeding 6000 m, have considerable hydrocarbon resource potential and are an important alternative area for hydrocarbon exploration and development [4].
Basin thermal events are closely related to the large-scale generation and accumulation of hydrocarbon reservoirs, and there is often a hydrocarbon accumulation period during the peak hydrocarbon generation period. The current international methods for basin thermal history recovery typically include thermal indicators (such as vitrinite reflectance [5], apatite fission track [6], (U-Th)/He [7], and clumped isotopes [8]) and geodynamic methods (such as the tension model [9,10]). The method of reconstructing thermal evolution history using thermal indicators is also widely employed for carbonate formations abroad. Brock J. Shenton et al. [11] conducted a comprehensive analysis of carbonate samples from the Palmarito and Bird Spring Formations. They constructed a thermal history rearrangement model based on carbonate clumped isotopes, fluid inclusion temperature measurements, fission tracks, and other means and discussed the diagenesis and thermal evolution in detail. The paleotemperature scale method is regarded as a highly precise and practical approach, as it can corroborate simulation outcomes through an analysis of empirical data pertaining to the paleotemperature scale. Using basin thermal history simulation software, we analyzed the sedimentary burial history and thermal evolution history of the basin. In combination with fluid inclusion homogenization temperatures, we were able to determine the period of hydrocarbon charging.
Fluid inclusions are formed in the process of mineral crystallization growth due to defects in the crystals and capture a part of the fluid, which is still preserved in the minerals without the exchange of internal and external media. They are trace fossil records of hydrocarbon migration and charging processes, recording the paleoenvironmental conditions of the old formation [12,13,14].
Fluid inclusions contain rich geological information and are one of the important tools for analyzing the accumulation period of basins with hydrocarbons. They are extensively employed in the study of accumulation chronology [15,16,17]. A laser Raman spectrum is a type of scattering spectrum wherein matter with different chemical structures has different Raman displacement values [18]. Raman spectroscopy is an effective method for obtaining detailed compositional data, and it has been successfully applied to analyze the fluid components of inclusions and determine the inclusion type [19,20].
In this work, based on measured Ro data, the denudation thickness of strata, observations of inclusion thin sections, Raman laser analyses, and measurements of the homogenization temperature of inclusions, we explored the degree of thermal evolution, thermal evolution history, inclusion development type, homogenization temperature distribution characteristics, and hydrocarbon accumulation period.
This investigation not only provides a more detailed characterization of the thermal evolution of the Ordovician strata and the petrography of fluid inclusions but also reveals the hydrocarbon charge history. The results will be invaluable in guiding the future exploration and development of Ordovician natural gas.

2. Regional Geological Background

The Ordos Basin is situated in the western region of the North China Craton, with weak tectonic deformation, polycyclic evolution, and diverse sedimentary types. The basin has an exploration area of 2.5 × 10⁵ km2 [21,22,23], and it is the second largest oil–gas-bearing basin in China, with extremely rich mineral resources [24,25]. The basin is divided into six first-order tectonic units as follows: the Yimeng uplift, the Yishan slope, the Jinxi fault–fold belt, the Weibei uplift, the Tianhuan depression, and the western margin thrust belt [26,27,28] (Figure 1a,b). We selected the east-central part of the Ordos Basin for study. This area is located above the Yishan slope, with less internal fracture development, and the dip angle of the strata is generally less than 1°. The upper and middle Ordovician strata in the central part of the basin have been eroded, resulting in the predominant development of the lower Majiagou Formation. This formation is subdivided into six strata from the bottom up, namely Ma1–Ma6. The Ma5 Member can be further subdivided into ten sub-members [29] (Figure 1c,d).
The study area is characterized by the development of carbonate–gypsum salt assemblages, which are present in thick sedimentary deposits and have a broad distribution [30,31]. The Majiagou Formation consists of three types of subfacies: subtidal, intertidal, and supratidal. The Ma1 Member is mainly dominated by grayish-yellow dolomite. The Ma2 Member mainly contains limestone and dolomite, with a small amount of gypsum in some areas. The Ma3 Member mainly develops a set of combined strata of dolomite, gypsum rock, and salt rock. The Ma4 Member deposits a set of strata of dolomite and limestone, with an extensive development of porphyritic dolomite. The Ma6 Member is mainly an intercalated layer of dolomite, limestone, and gypsum rock. The Ma6 Member is dominated by the deposition of limestone.
The effective source rocks of the Majiagou Formation are primarily concentrated in the upper part of the Ma6 Member, with partial development observed in the Ma3 and Ma1 Members and the lower part of the Ma6 Member. The organic matter types are mainly sapropel or sapropel-prone (kerogen type I) [32]. The maximum total organic carbon content can reach 3.5%, and the Ro is between 1.8 and 3% [33]. The Ma5 Member has well-developed thick gypsum–salt rocks, and it has a good sealing effect on the Majiagou Fm reservoir. In summary, the Majiagou Fm has great resource potential, and it is a favorable exploration area in the Ordos Basin.
Figure 1. Location and geological map of the Ordos Basin. (a) Location of the Ordos Basin, western North China Craton (modified from Yang et al., 2024 [26]; Peng et al., 2023 [31]); (b) geological map of the Ordos Basin and its surroundings (modified from Peng et al., 2024 [31]); (c) stratigraphic column map of Majiagou Formation, Ordos Basin; (d) W-E trending simplified geological profile of the central Ordos Basin.
Energies 17 04435 g001

3. Samples and Analysis Methods

We collected 178 samples from 25 wells in the east-central Ordos Basin, with sample depths of 3000 km or more. Recycled organic matter did not affect sample preparation or testing. Ro values can be used for erosion thickness and tectonic–thermal evolution reconstruction using the Easy% Ro model in PetroMod (Version 2016.2) software. We selected 181 measurement points of 19 samples from 17 wells in the east-central Ordos Basin for analyses of the fluid inclusions’ homogenization temperatures to ensure that the test results reflect the overall characteristics of the study area. The homogenization temperature of fluid inclusion represents the paleotemperature at which fluids were trapped to form the inclusion during geological processes. By combining the inclusions’ homogenization temperatures with the history of thermal evolution, it is possible to infer the age of hydrocarbon formation. The fluid inclusions’ homogenization temperatures were measured using a THMSG600 DM450P cold and hot microplatform (Linknm, Salfords, UK and Leica, Wetzlar, Germany). We collected 5 samples for Raman microprobe analyses using LabRAM Odyssey (Horiba France Sas, Palaiseau, France). Distinctive peaks in the Raman spectra of the diverse material constituents of the inclusions were discerned, thereby facilitating the analysis of the components that comprise the inclusions.
All these experiments were conducted in the State Key Laboratory of Continental Dynamics, Northwest University, Xi’an, China.

4. Results and Discussion

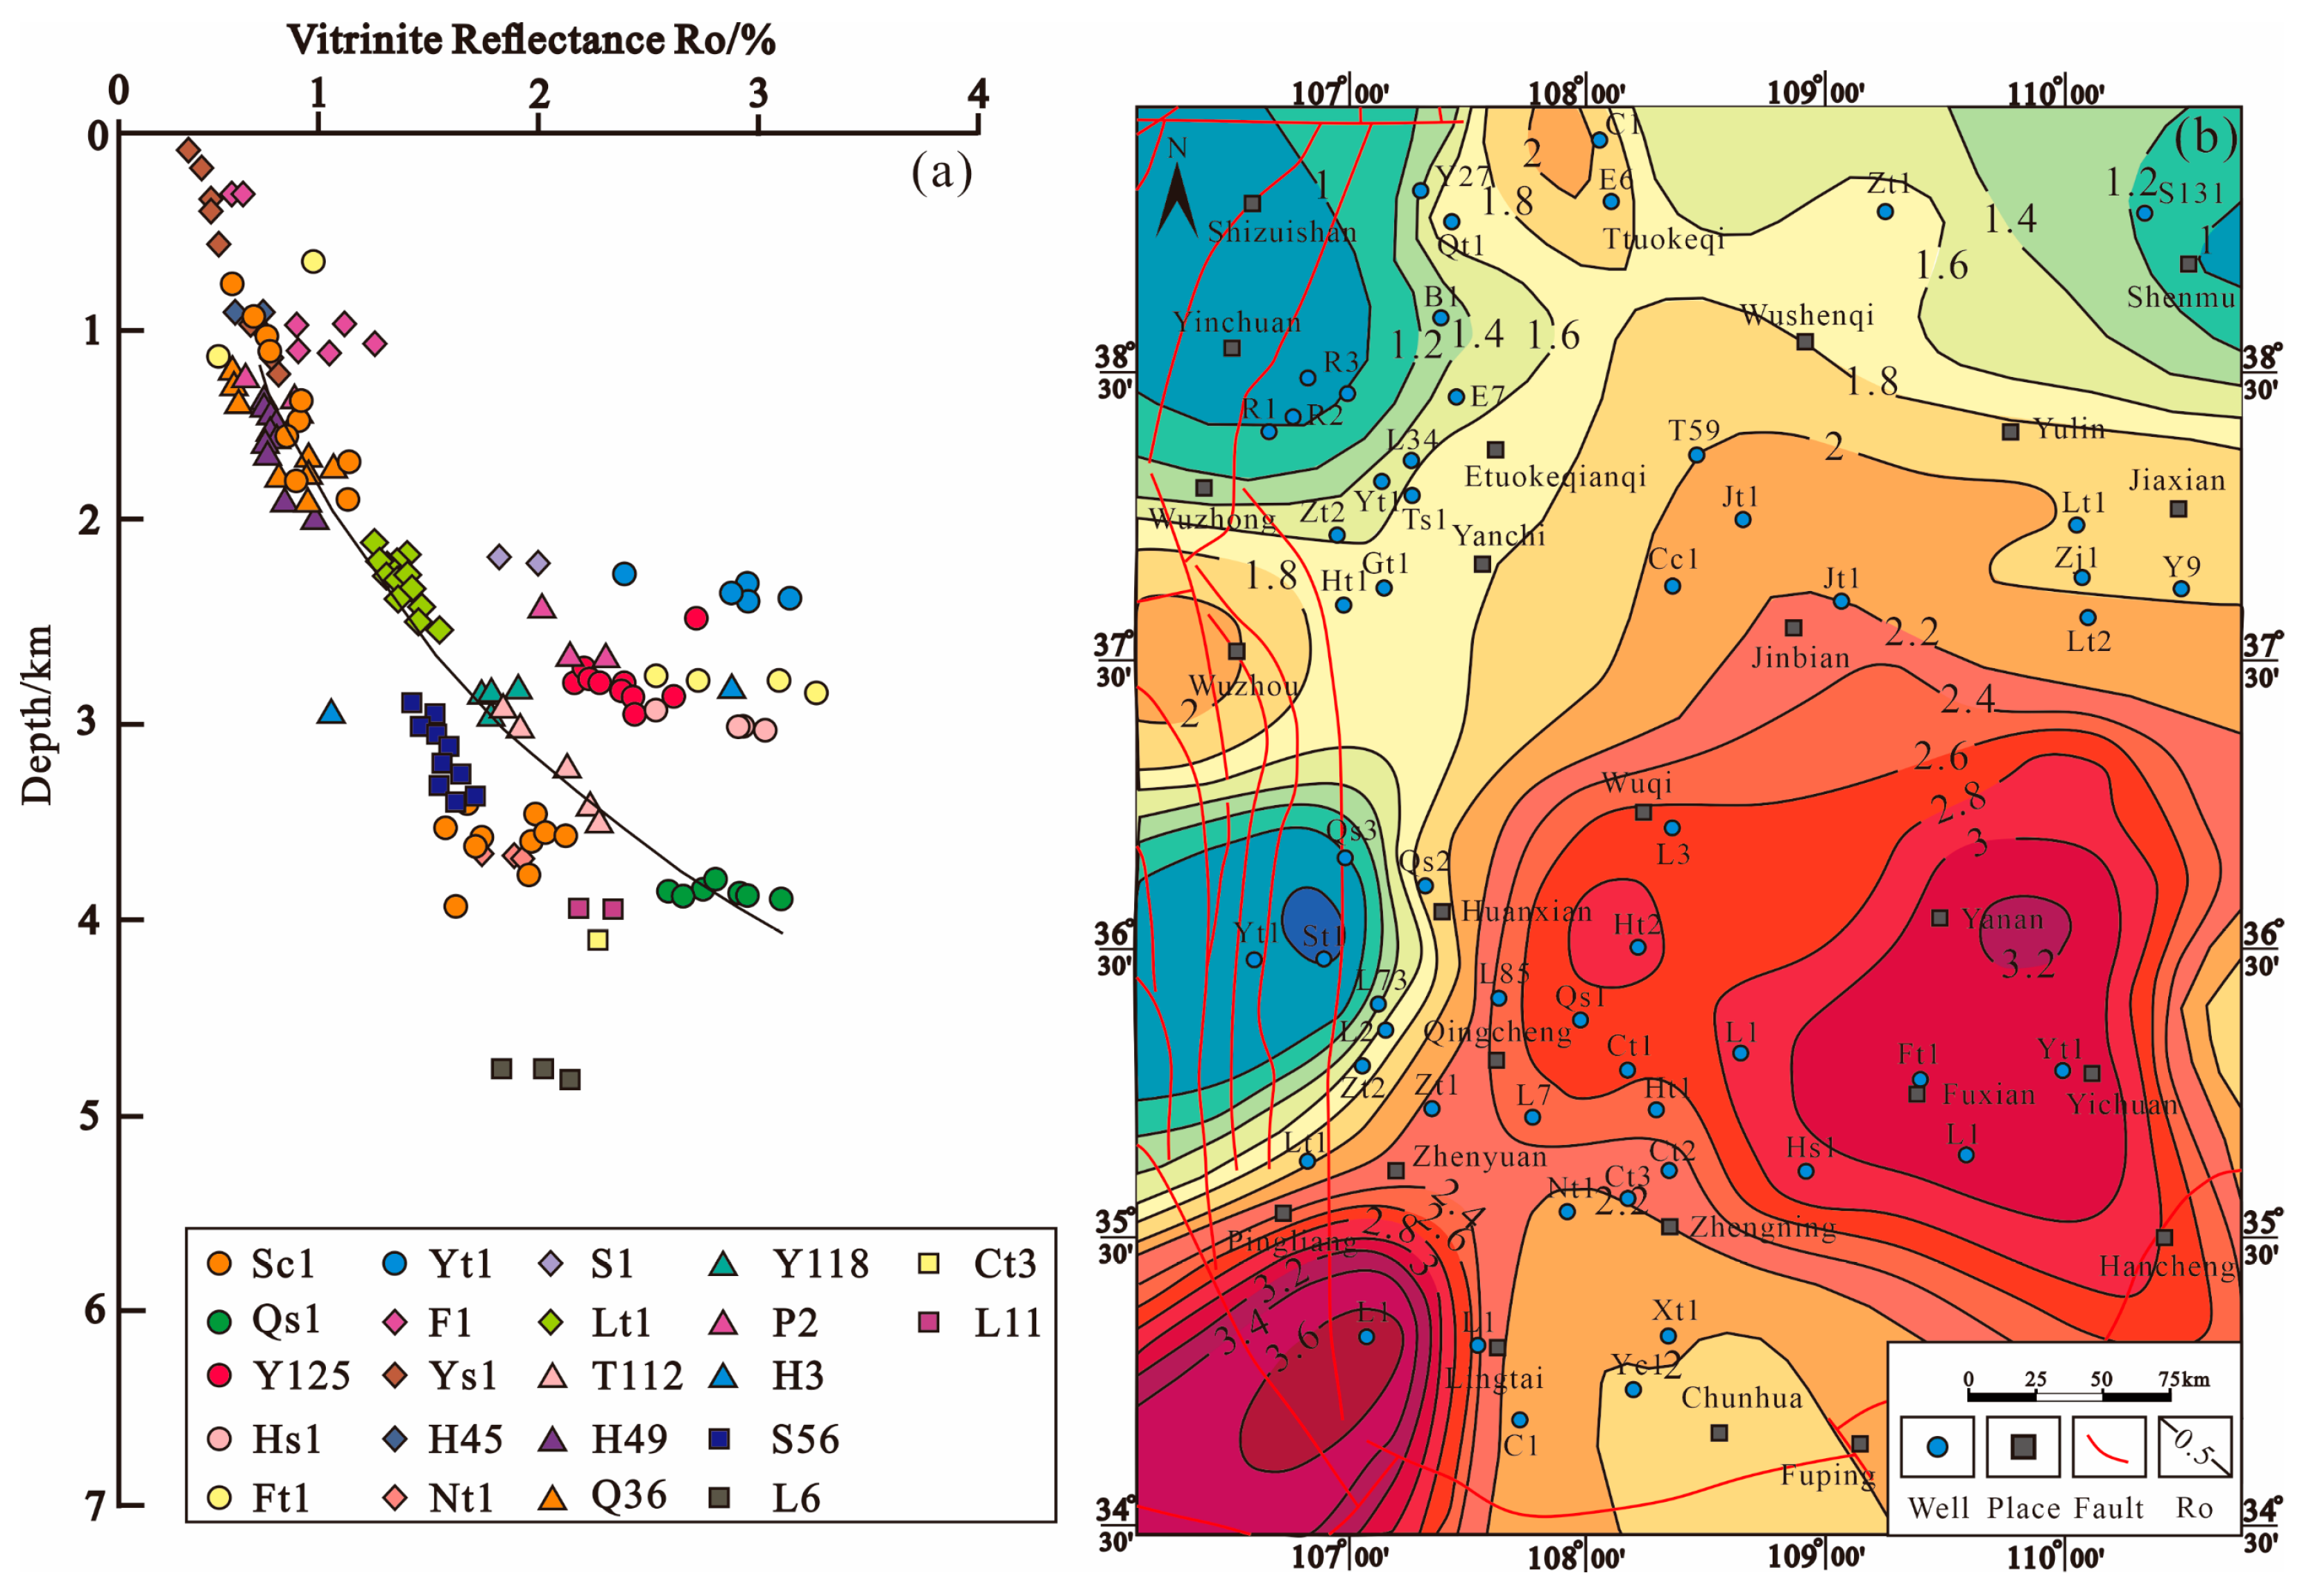
4.1. Degree of Thermal Evolution

The degree of thermal evolution characterizes the degree of conversion of sedimentary organic matter to hydrocarbons. In the evolution process of the hydrocarbon parent material kerogen, changes in the following occur: elemental composition, the structure of functional groups, the free radical content, color and fluorescence, thermogravimetric loss, carbon isotopes, and vitrinite reflectance. Additionally, the pyrolysis products reflect the evolution of the content and composition of soluble organic matter and hydrocarbons, as well as the different stages of thermal evolution. The physicochemical properties and composition of organic matter differ in the different stages of thermal evolution. The vitrinite reflectance records the temperature history of the stratum, and it is one of the best indicators for studying source rock maturity and classifying the maturity stages [34,35,36]. In this study, we mainly used the vitrinite reflectance (Ro) to analyze the degree of thermal evolution of the Lower Paleozoic Ordovician [37,38]. Ro evolution is mainly affected by two factors: time and the organic matter heating temperature [39]. Furthermore, Ro is positively correlated with stratigraphic paleotemperature, exhibiting a stable and irreversible process [40,41,42,43,44,45].
We conducted a study of forty-four wells in the Yishan slope, and the relationship between Ro and depth is shown in Figure 2a. The Ro value is distributed between 0.4% and 3.2% within the depth range of 0~4500 m. Overall, the Ro value increases with the increase in depth, and no obvious discontinuity is observed around the unconformity surface. There is a linear correlation between Ro and depth.
The relationship between Ro and depth differs between the wells. At the same depth in the Yishan slope, the reflectivity varies greatly, with the maximum vitrinite reflectance reaching up to 2.6% at about 2900 m in the Futan 1 well. The Ro at the same depth in the Yitan 1 and Huangshen 1 wells in the eastern part of the Yishan slope is notably higher, whereas the Ro value corresponding to a depth of 3000 m in the Qingshen 1, Ningtan 1, Hua 49, and Long 11 wells is within the range of 1.6–1.8%, exhibiting a relatively low Ro. This is mainly controlled by the depth thermal structure. The southern part of the basin is located in the center of the Early Cretaceous thermal anomaly, and the maximum paleo-geotemperature gradient is high, which corresponds to the stratigraphy having a significantly higher degree of thermal evolution.
Using the vitrinite reflectance data of different wells in the Ordovician and the correlation between vitrinite reflectance and depth, combined with a thermal history simulation, a plane map of the vitrinite reflectance on the top surface of the Ordovician is drawn (Figure 2b). The top surface of the Ordovician exhibits a Ro distribution ranging from 1% to 3.2%. The degree of thermal evolution in the basin is notable, exhibiting a gradual decline towards the surrounding areas.
In the central region of the basin, the Ordovician thermal evolution is the most pronounced, with Ro values exceeding 2.5% and a maximum reflectance of up to 3.2%. This is predominantly influenced by the thermal anomaly event that occurred in the southern Early Cretaceous region, further substantiating the notion that the thermal anomaly is primarily concentrated in the southern part of the basin.
In the south-western part of the basin, in the Lintai–Pingliang area, there is an anomalous elevation in Ro value, with the maximum Ro exceeding 3.6%. The anomalous elevation in this area is primarily associated with the extensive development of volcanic rocks in the Late Triassic–Early Cretaceous period in this region.
The low Ro value is mainly distributed in three areas: One is the north-east edge of the basin around Shenmu, where the Ordovician top surface Ro is generally less than 1.2%. Another is the north-western edge of the basin, east of the Yinchuan Basin; here, the representative wells are Ren 1, Ren 3, and other wells, and the Ro is generally less than 1. The third one is at the western edge of the basin, to the west of Huanxian; here, the representative wells are Yintan 1, Yintan 2, Yintan 3, etc. The low Ro values of these three areas are mainly related to the burial depth and maximum paleotemperature.
Towards the end of the Late Jurassic period, the Yanshan tectonic movement exerted a significant influence on the region, resulting in a pronounced extrusion and tectonic uplift. During the Early Cretaceous period, the stratigraphy was characterized by a relatively shallow depth and a considerable distance from the southern center of thermal anomalies. This led to a notable reduction in Ro values, which is basically the same as the phenomena observed in the field and drilling wells.
The discovery of light oil from the Lower Paleozoic in the eastern margin of the basin suggests that the degree of thermal evolution is relatively low and the basin is in the stage of late hydrocarbon generation or wet natural gas generation.
In the area of the Yintan 1 well in the western margin of the basin, oil reservoirs were found in the Yanghugou Formation of the Upper Paleozoic, indicating that the degree of thermal evolution in this area is also relatively low.
In the north-central part of the western margin of the basin around the Weizhou–Tianhuan depression in the Yanchi and Ertuokeqianqi area, the degree of thermal evolution of the Ordovician is higher, with the Ro ranging from 1.8 to 2.0%. This is mainly related to the greater burial depth in the Early Cretaceous and further indicates that the uplift of this area in the Late Jurassic was relatively minor. Additionally, the differential uplift of the western margin fault zone since the Late Jurassic has had a discernible impact on the maturity of the hydrocarbon source rocks and the thermal evolution process.
The Ordovician hydrocarbon source rocks at the basin margin may be at the peak of oil generation, while those in the basin interior have entered the stage of dry natural gas generation. The Ro contour mainly spreads in the north-east to north-north-east direction in the Yishan slope, and the southern part is an area of high Ro, with a value greater than 2.2%.
In the northern part of the Yishan slope around the Yulin–Wushenqi–Jingbian area, the Ro contour spreads from the north-west to the south-east, with the Ro decreasing from 2.2% to 1.4% from south to north. In the area west of Jingbian to Yanchi, the Ro gradually decreases from 2.2% to 1.8%.
In the southern Weibei uplift, near the center of the Early Cretaceous thermal anomaly, Ro gradually increases from south to north, varying by 2–2.4%. The Ro contour of the fracture zone at the western margin of the basin and the Tianhuan depression spreads in a near north–south direction, with a gradual decrease in Ro from east to west. The lowest values are observed in the Yintan 1 and Yintan 2 wells at the southern margin and in the Ren well area in the north, at less than 1%. In the western margin of the basin, in the Yanchi–Weizhou area, the Ro is relatively high, ranging from 1.8 to 2.0%.

4.2. Thermal History Simulation

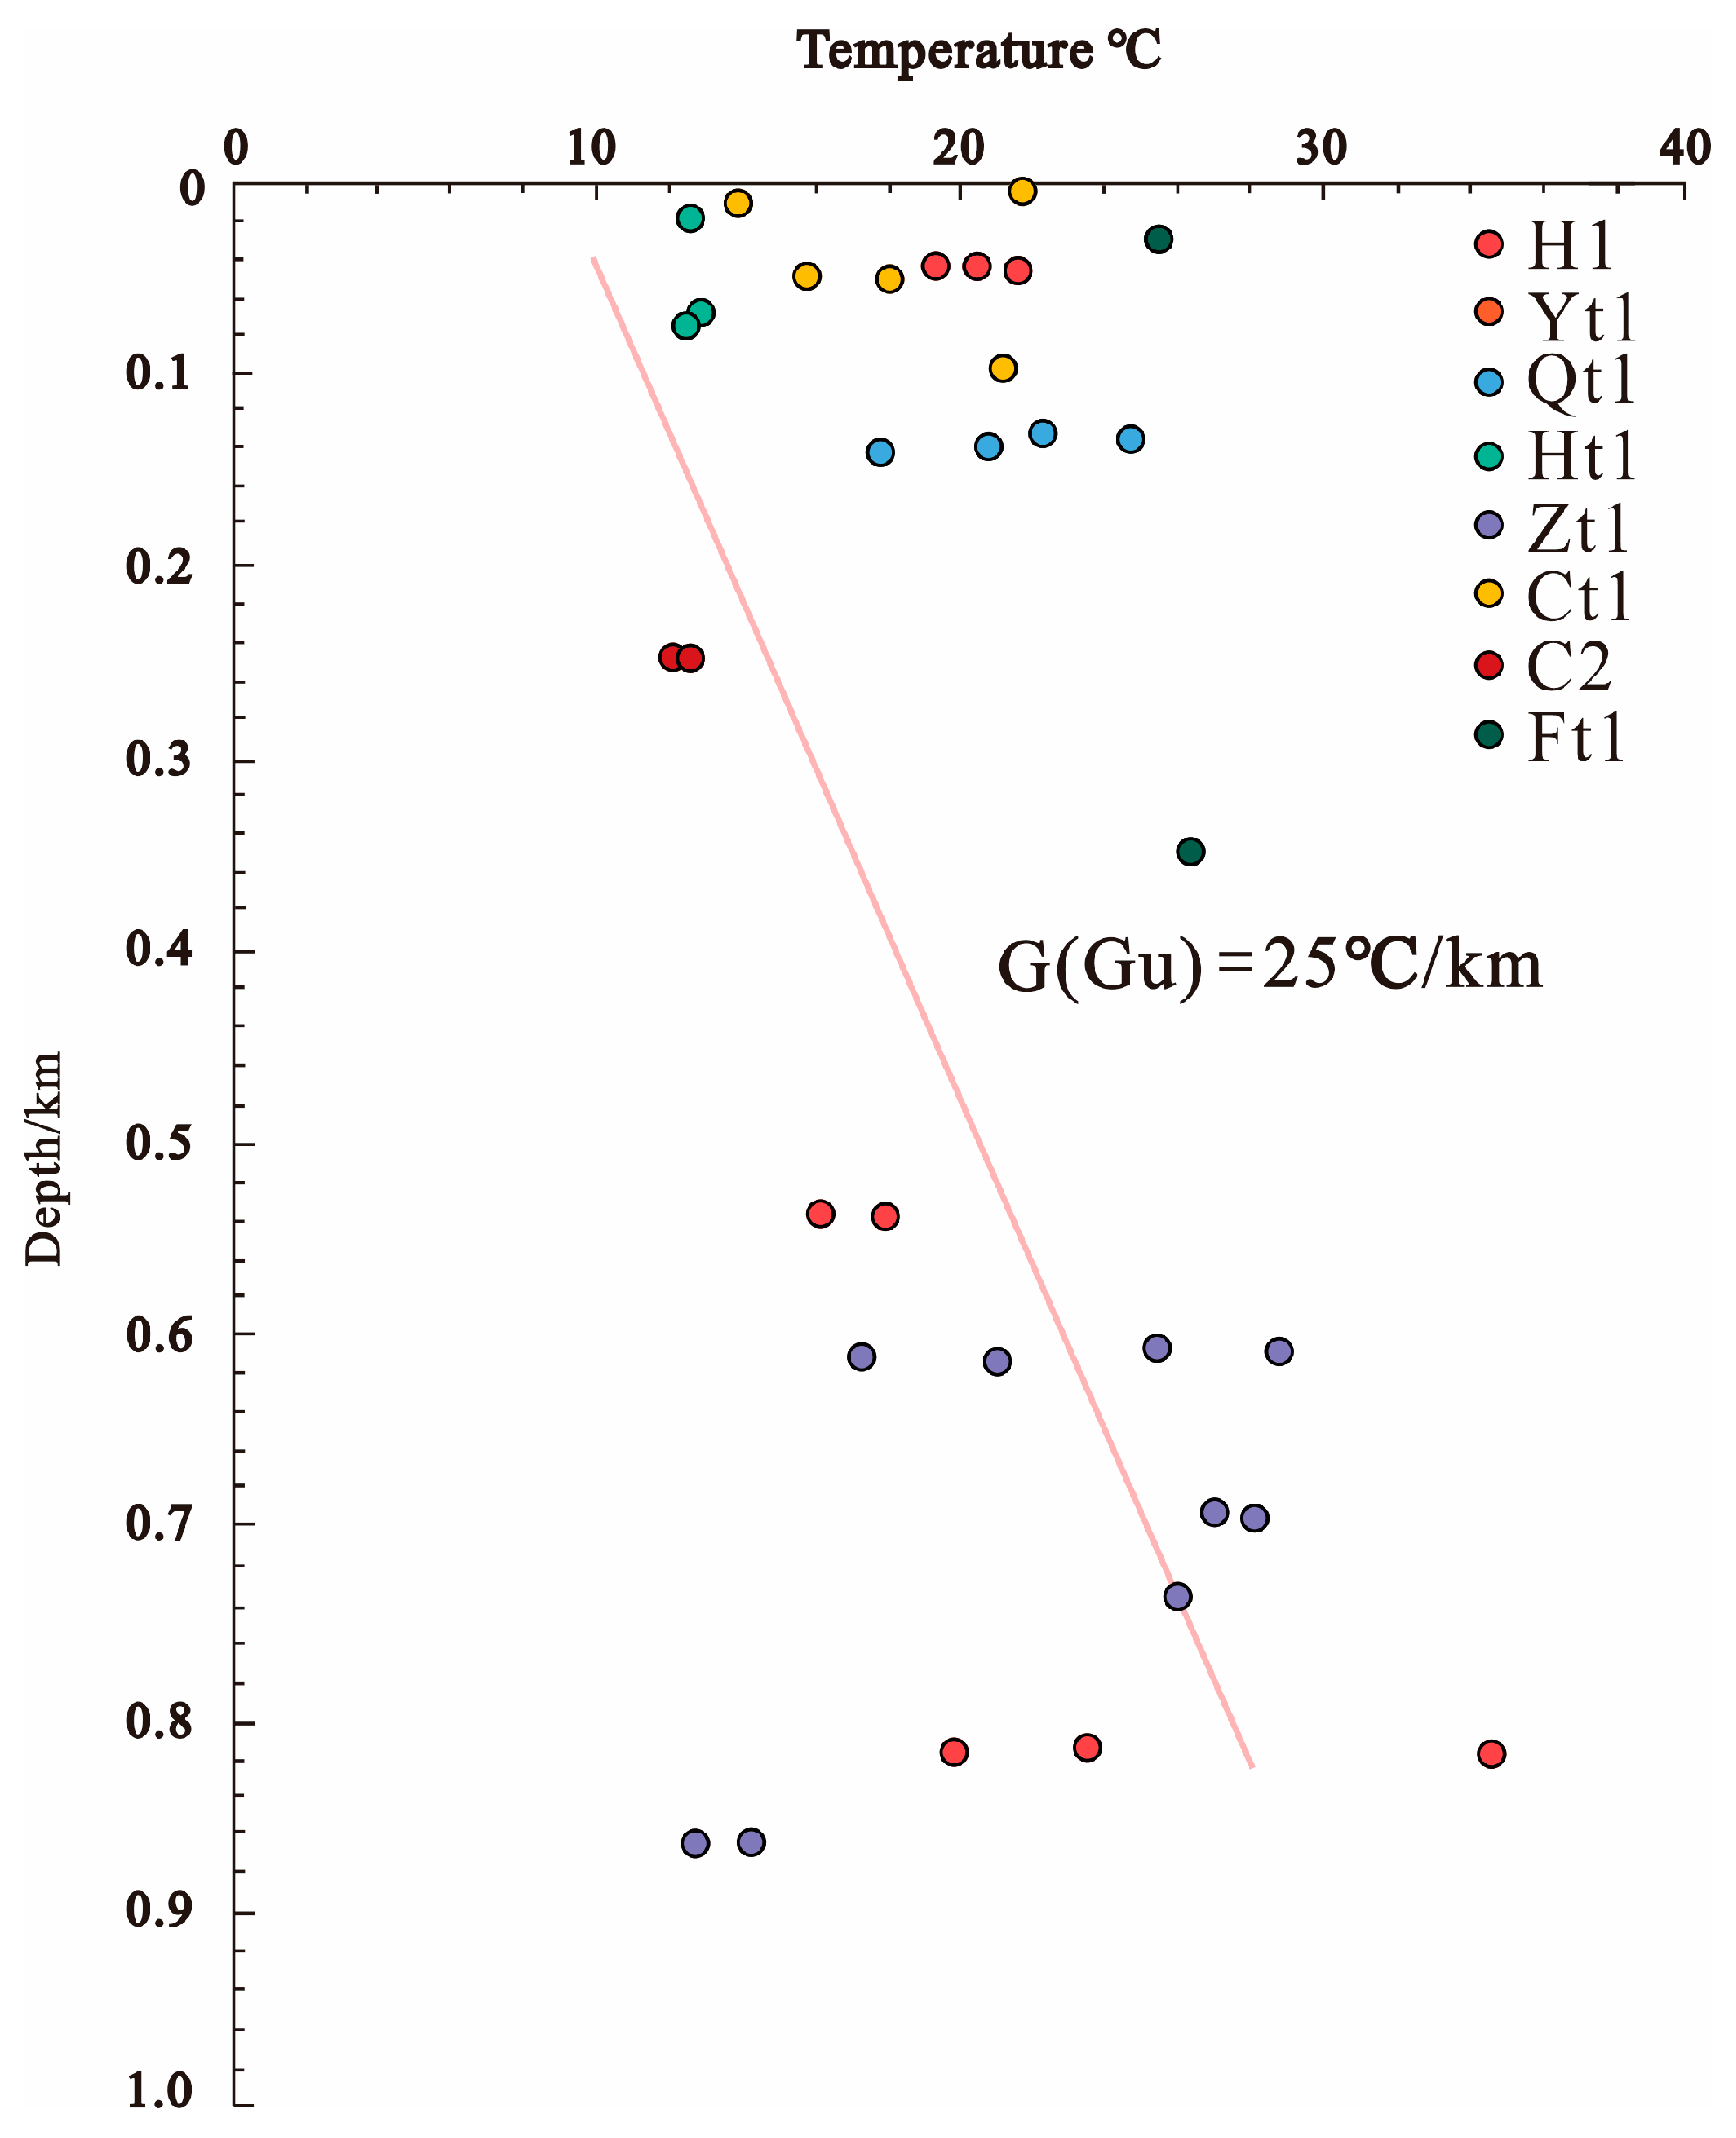
4.2.1. The Present Geothermal Field

The present geothermal field not only represents the present thermal state of the basin but also the last stage of the paleo-geothermal field evolution. Its determination is a prerequisite for the restoration of the thermal history of the basin. The difference in the geothermal gradient in the southern part of the Ordos Basin is obvious, and the distribution of the geothermal gradient ranges from 22 to 36 °C/km, which is generally characterized as being high in the east and low in the west (Figure 3a). The average geothermal gradient of the Yishan slope is 28.6 °C/km, which is close to the present average geothermal gradient value in the basin (Figure 3b).

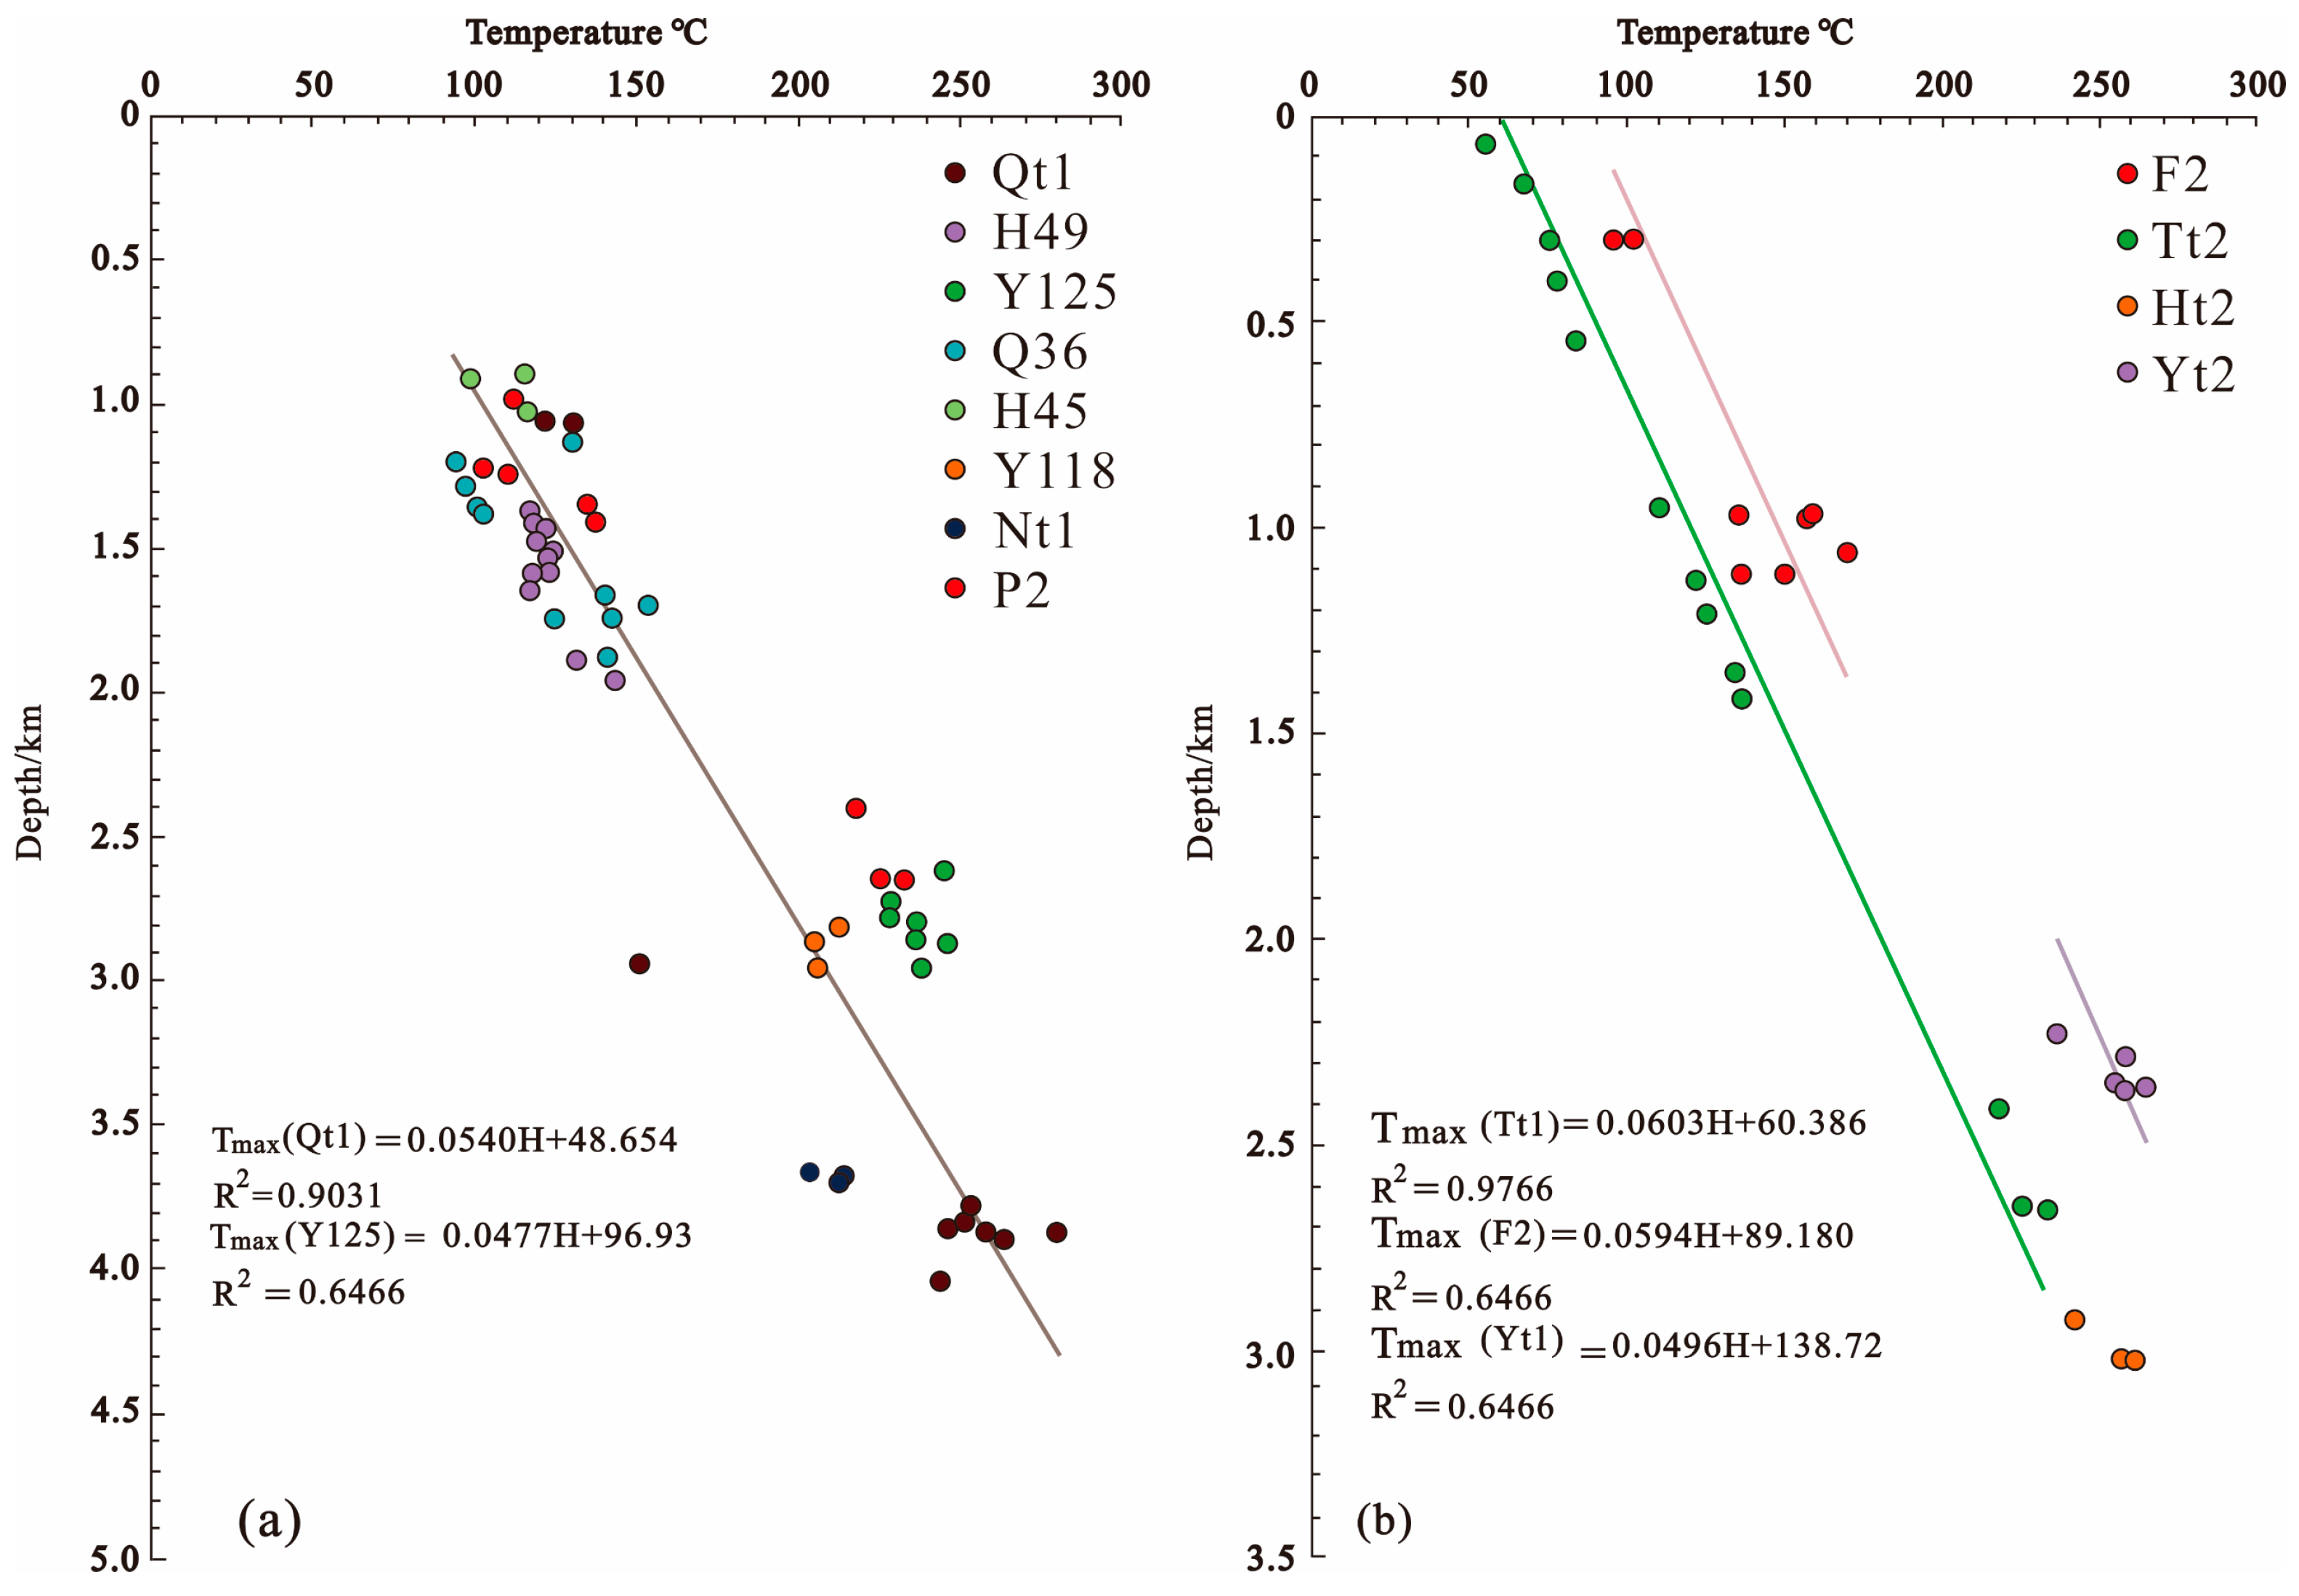
4.2.2. Paleotemperature

In this study, we used the C-O isotopes of carbonate rocks and the homogenization temperature of fluid inclusions and calcite U-Pb to reveal the Early Paleozoic paleotemperature features. The C-O isotope values of carbonate rocks can reflect the salinity characteristics of lake water. Keith and Weber (1964) [48] established a distinction between Jurassic and Pleistocene Z values to classify marine and terrestrial environments by analyzing a large amount of data on the C-O isotopes of marine and terrestrial limestone and fossils. It is generally recognized that a Z value greater than 120 indicates marine carbonate with high salinity and that a Z value of less than 120 indicates freshwater carbonate with low salinity. The average Z value of the Lower Paleozoic sample was 122.7, which indicates that the sample was deposited in a stable marine environment. The correlation between δ 13CVPDB (‰) and Z was used to make further judgment, with an R2 = 0.96, indicating that the accuracy of using the Z value to reflect the change process of paleosalinity at the time of deposition is high.
Based on the principle of the equilibrium exchange reaction of oxygen isotopes between minerals and water, many scholars have established equations for oxygen isotope temperature fractionation between carbonate and water through a large number of experiments and calculations [49]. O’Neil et al. (1969) [50] developed an oxygen isotope temperature fractionation equation for inorganic genesis calcite, T(°C) = 16.9–4.38 (δ18OVPDB sample − δ18OVPDB water) + 0.10 × (δ18OVPDB sample + δ18OVPDB water)2, which is applicable at temperatures between 0 and 500 °C. We used this equation to calculate the paleotemperatures during the depositional stage. The results demonstrated that the maximum paleotemperature obtained from six samples from two wells (Yintan 1 and Qingshen 2) in the Jixian system was 45.84 °C, with the minimum paleotemperature of 4.87 °C and the average paleotemperature of 25 °C. Additionally, the paleotemperature obtained from nine samples from three wells in the Cambrian system ranges from 13.61 °C to 24.66 °C, with an average of 19.8 °C. In the Ordovician system, the paleotemperature obtained from 38 samples from nine wells ranges from −5.3 °C to 34.6 °C, with an average of 17.1 °C. The calculation results indicate that the early diagenetic temperatures of the Jixian system and early Lower Paleozoic are low, mainly distributed between 10 and 40 °C.
We used the calculated diagenetic temperature, combined with the stratigraphic burial depth, and a relation graph was constructed to illustrate the correlation between paleotemperature and depth in the Lower Paleozoic Ordovician (Figure 4). The graph indicates that the overall paleotemperature calculated using carbon and oxygen isotopes increases with the depth. The fitting demonstrates that the paleo-geotemperature gradient at that time was about 25 °C/km. The average thermal conductivity was calculated according to 2.2 W/m·K, which resulted in a paleoheat flux of about 55 mW/m2.
The Ordos Basin is a typical basin with an initial period of slow warming, followed by a phase of accelerated warming in the middle and late stages, and finally, a period of uplift and cooling. The basin has experienced rapid subsidence, buried warming, rapid thinning of the lithosphere, and Early Cretaceous tectono-thermal events since the Mesozoic. The thermal evolution of the main source rocks in the basin reached its maximum degree at the end of the Early Cretaceous.
The correlation between Ro and depth is significant in the Yishan slope. The relationship between the maximum paleotemperature and the depth of multiple wells was determined using the Barker and Pawlewicz method (ln (Ro) = 0.0096Tmax − 1.4) [51] (Figure 5). The maximum paleo-geotemperature gradients at the end of the Early Cretaceous were calculated to be 54 °C/km and 47.7 °C/km for the Qingshen 1 and Yuan 125 wells in the western part of the Yishan slope. The maximum paleo-geotemperature gradients for the Yanshen 1, Fu 2, and Yitan 1 wells in the eastern part of the Yishan slope were 60.3 °C/km, 59.4 °C/km, and 49.6 °C/km. The paleo-geotemperature gradients are evidently larger than the present geothermal gradient.
Figure 4. Ordos Basin Ordovician paleotemperature vs. depth [52].
Energies 17 04435 g004

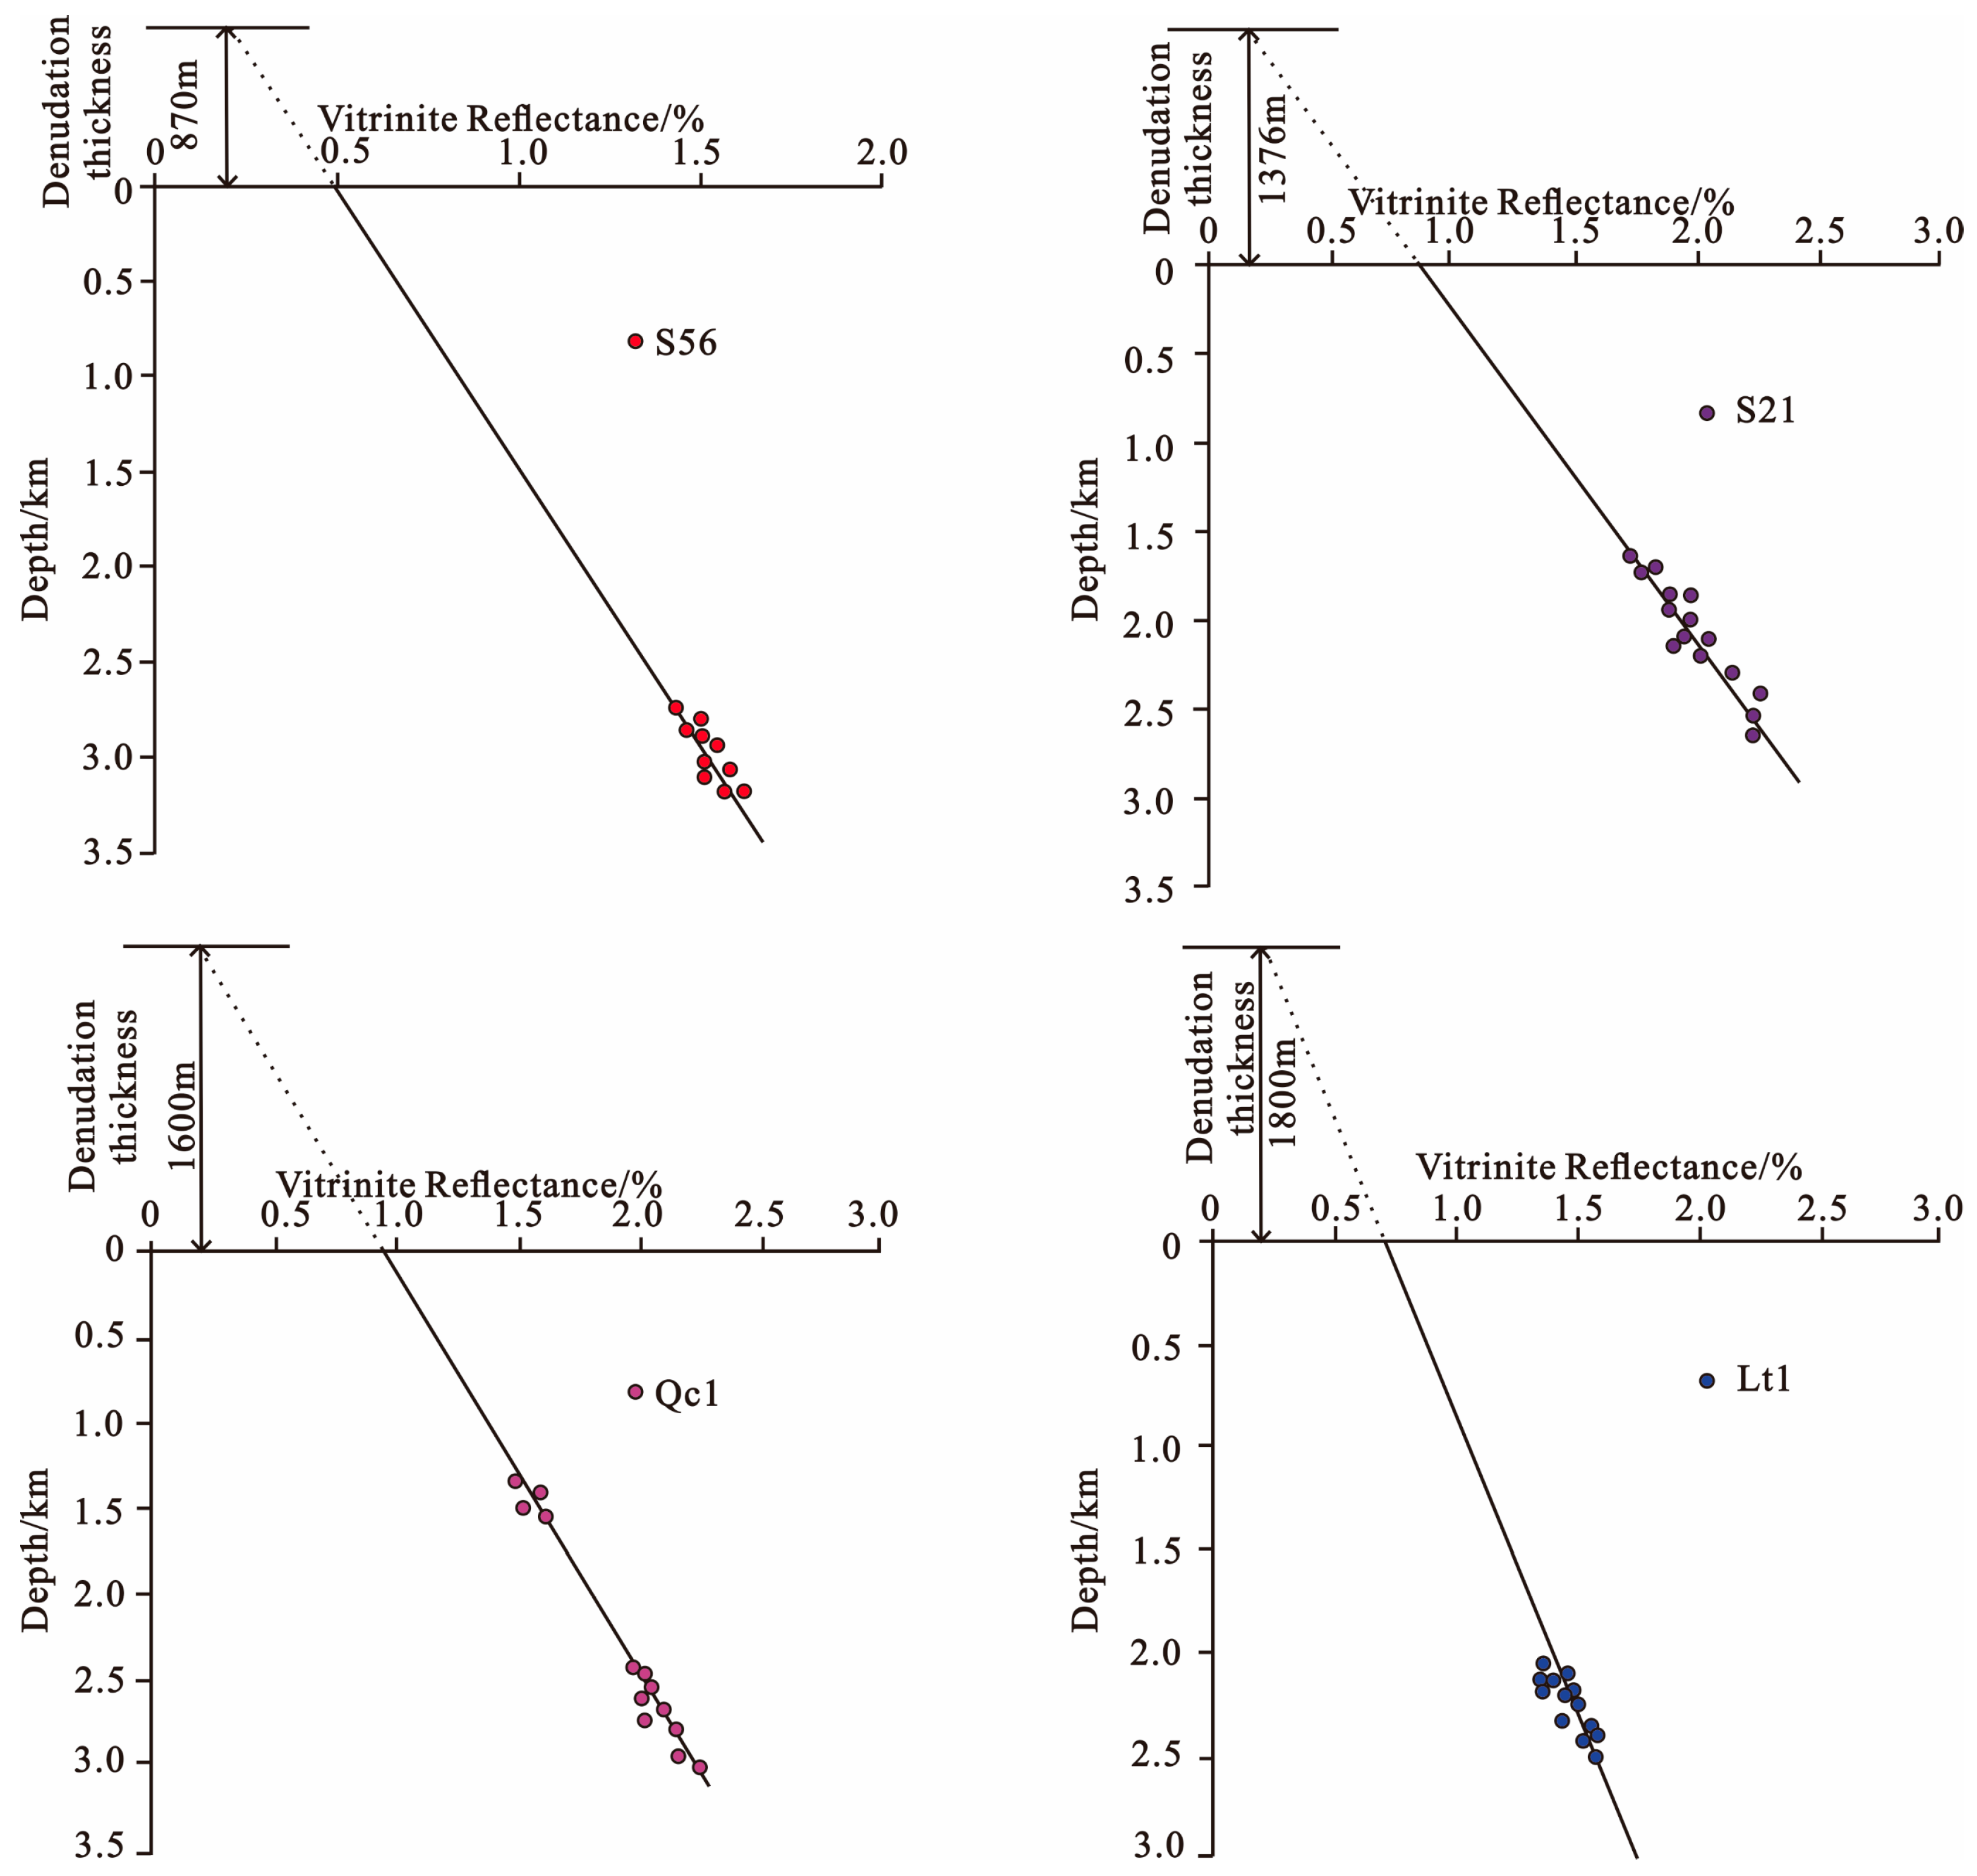
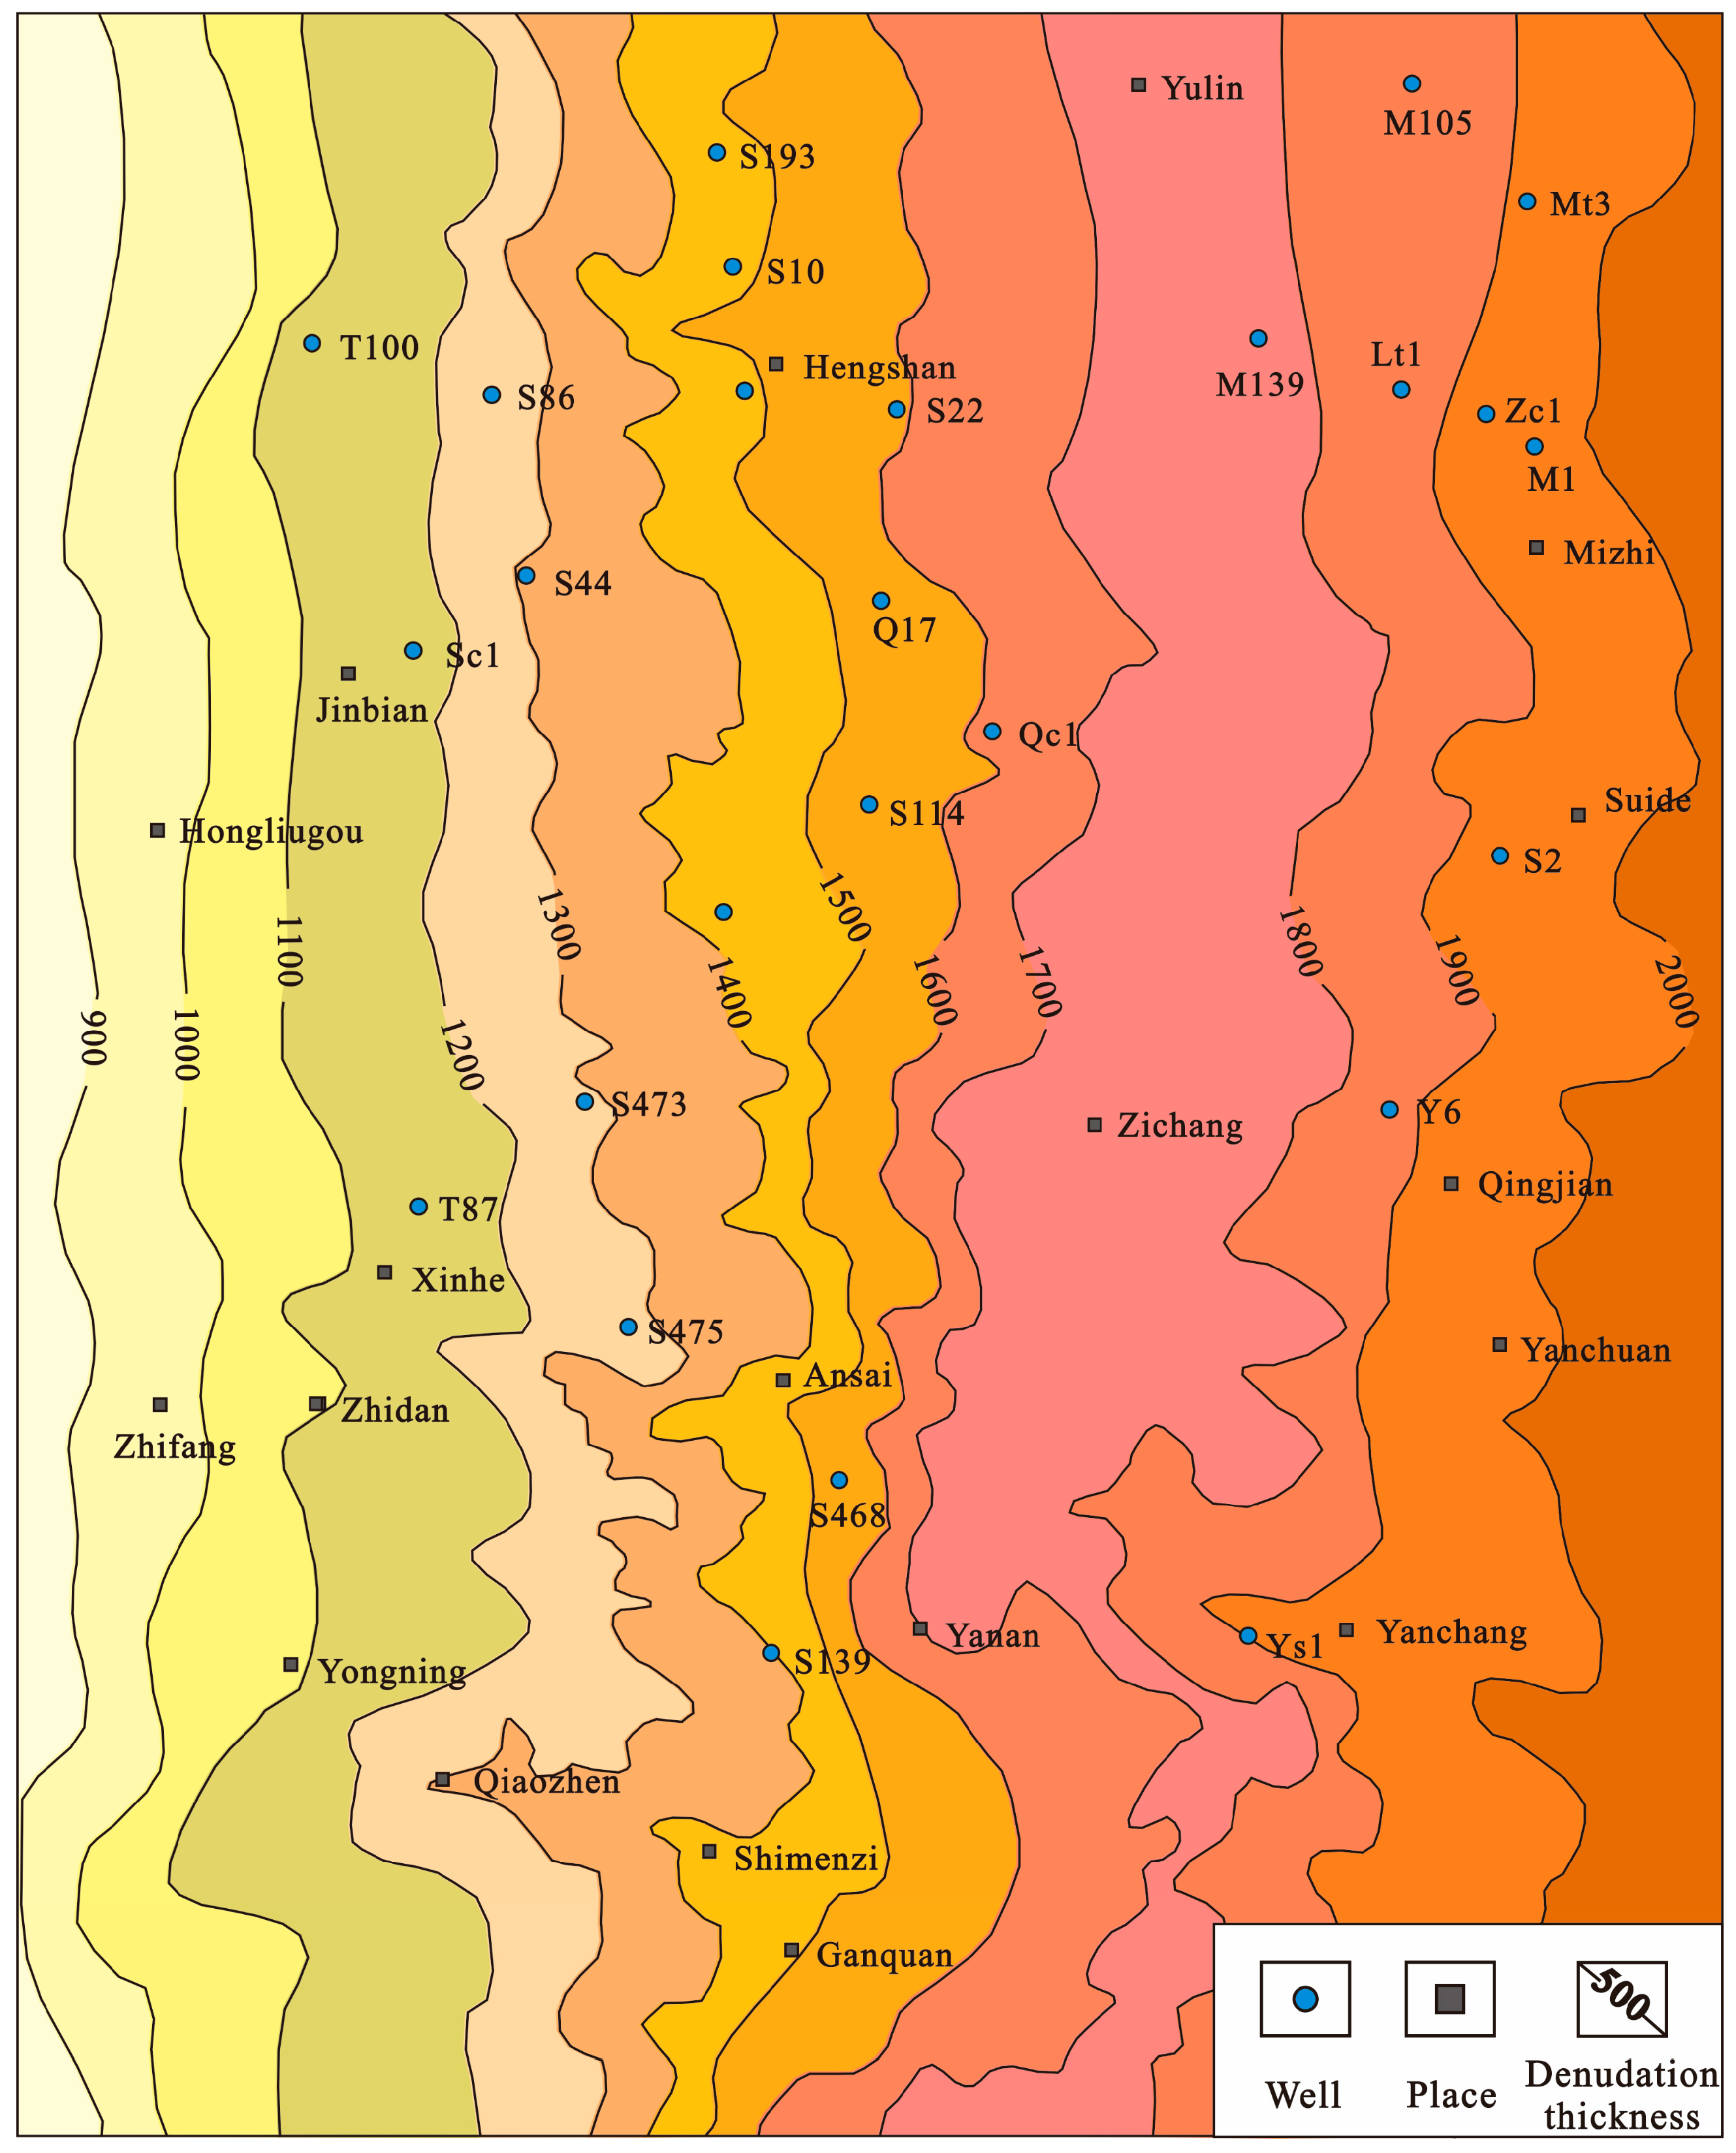
4.2.3. Denudation Thickness Recovery

The Ro method for denudation thickness recovery was proposed by Dow in 1977 [53]. This method's underlying principle can be summarized as follows: the Ro value varies with depth in continuously deposited strata, and when there is denudation in the strata, the Ro value changes abruptly around the denudation surface, resulting in a difference. Therefore, the Ro trendline of the strata below the denudation surface is extended upward through the strata to above the surface so that it intersects the surface Ro (generally taken as 0.2%), and this vertical distance is the denudation thickness [54]. Although this method can be simple and fast in determining the denudation thickness of strata, it has some shortcomings. A discontinuous increase in Ro in strata is not necessarily caused by the denudation of the strata. Other factors, including magmatic intrusion and thermal disturbance of faults, can also cause a discontinuous increase in Ro.
The uplift in the eastern part of the basin has suffered strong denudation since the Early Cretaceous, the compaction curves of the Cretaceous mudstones in the study area are few and short, and the interval transit time method is not applicable. In this study, we mainly used the Ro method to recover the denudation thickness. The Ro data of four wells in the east-central part of the basin were selected, and the amounts of denudation were determined to be 870 m, 1376 m, 1600 m, and 1800 m (Figure 6).
According to the recovered denudation thickness, the denudation thickness increases sequentially from west to east, which coincides with the background that the denudation thickness is greater in the eastern than in the western part of the whole Ordos Basin (Figure 7).

4.2.4. Thermal Evaluation History

PetroMod simulation software (Version 2016.2) was used to model the thermal evolution history of the study area. The simulated Ro values exhibited a high degree of correlation with the measured Ro values, thereby substantiating the credibility of the results. Furthermore, an in-depth analysis was conducted to elucidate the relationship between hydrocarbon source rock temperature and maturity.
The simulation results of the thermal evolution of the Sc1 well indicated that, from the final stage of the Early Ordovician, influenced by tectonic movement, the paleo-geotemperature gradient of the Ordovician strata continued to increase. This resulted in the Ordovician strata reaching the highest historical paleo-geotemperature of 184 °C at the end of the Early Cretaceous. After that, with the uplift of the strata, the paleo-geotemperature gradient slowly decreased, and the present geotemperature was about 113 °C. The simulation results of the thermal evolution history of the Lt1 well exhibited a gradual geotemperature increase with the subsidence of the strata from the end of the Early Ordovician. In the Late Carboniferous, the Ordovician strata began to subside rapidly and alternate between subsidence and small-scale uplift. The paleo-geotemperature gradient gradually increased, reaching a maximum paleo-geotemperature of 192 °C at the end of the Early Cretaceous. Thereafter, during the Late Cretaceous, the Yanshan movement led to extensive denudation of the entire uplifted area, resulting in a gradual reduction in the paleo-geotemperature gradient to its present geotemperature of 86 °C. The results of the simulation of the thermal evolution history of the T112 well indicate that the temperature of the Ordovician strata increased to 45 °C in the final stage of the Middle Ordovician, along with the stratum settlement. The Ordovician strata began to subside rapidly and alternate between subsidence and small-scale uplift in the Late Carboniferous, and the paleo-geotemperature gradient increased. Additionally, the Ordovician strata reached a paleo-geotemperature of 207 °C, the highest in its history, at the end of the Early Cretaceous. Then, under the influence of the Yanshan movement in the final stage of the Early Cretaceous, the temperature started to decrease, and the present geotemperature was 112°C. The simulation results of the thermal evolution of the Y1 well show the same characteristics. The strata reached the highest historical paleo-geotemperature of 186 °C at the end of the Early Cretaceous. Subsequently, under the influence of the Yanshanian movement, the paleo-geotemperature gradient slowly decreased, and the present geotemperature was about 90 °C (Figure 8).
The tectono-thermal evolution of the basin has a pivotal effect on hydrocarbon generation, migration, aggregation, and accumulation, which is a key issue when analyzing the hydrocarbon resource potential and exploration prospects.
The simulation results indicate that the Ordovician hydrocarbon source rock of the Sc1 well achieved the hydrocarbon generation threshold in the Middle Triassic (235 Ma), with a Ro value of 0.5%. Additionally, the final stage of the Middle Triassic–Early Cretaceous (290–95 Ma) belonged to the stage of rapid warming, wherein the source rock further matured and reached its maximum depth burial, with a Ro of up to 2%. In the Late Cretaceous (95 Ma), the basin was subjected to large-scale uplift and denudation, the paleo-geotemperature gradient decreased rapidly, and the Ro no longer increased. The evolutionary stages of the maturation history of the hydrocarbon source rocks in the remaining wells exhibit similar characteristics. The Lt1 well entered the hydrocarbon generation threshold at 250 Ma (end of the Late Permian), the rapid warming stage occurred from the final stage of the Late Permian to the final stage of the Early Cretaceous (275–95 Ma), and the paleo-geotemperature gradient decreased after the Late Cretaceous (95 Ma). The T112 well entered the hydrocarbon generation threshold at 250 Ma (end of the Late Permian), which marks the end of the Early Triassic–Early Cretaceous period (290–90 Ma). This interval is characterized by rapid warming, and the paleo-geotemperature gradient decreased in the Late Cretaceous (90 Ma). The Y1 well reached the hydrocarbon generation threshold at the end of the Late Permian (255 Ma), the Late Triassic–Early Cretaceous (285–95 Ma) belonged to the rapid warming stage, and the paleo-geotemperature gradient decreased in the Late Cretaceous (95 Ma) (Figure 9).
In summary, the geotemperature of the Ordovician strata in the central region increased slowly before the Late Permian and was generally in a relatively low-temperature state. The organic matter evolved slowly and was in an immature stage. The rapid warming stage occurred from the end of the Late Permian to the end of the Early Cretaceous, with an overall average warming rate of 0.78 °C/Ma. The organic matter matured from the end of the Late Cretaceous to the Middle Jurassic, with a Ro value between 0.5 and 1.2%. During this period, liquid hydrocarbons were the primary products. From the Middle Jurassic to the end of the Early Cretaceous, the geotemperature continued to rise with Ro > 1.2%. Organic matter was in a state of high maturity–overmaturity, and the source rocks in this stage were dominated by natural gas generation. The thermal evolution of four boreholes suggests that the Ordovician strata in the east-central Ordos Basin reached the maximum paleotemperature in the Early Cretaceous (~100 Ma) [46,55], with a paleo-geotemperature gradient of up to 45 °C/km, indicating an Early Cretaceous tectono-thermal event possibly related to the thinning of the lithosphere of the North China Craton [56]. Since the Late Cretaceous, the basin has been uplifted and denuded, and the paleo-geotemperature gradient has been declining at an accelerated rate. The mean cooling rate of this period is 0.8 °C/Ma, and hydrocarbon generation has weakened.

4.3. Hydrocarbon Accumulation Period

4.3.1. Fluid Inclusion Components and Characteristics

Ordovician fluid inclusions widely developed in the east-central part of the Ordos Basin. A Leica 4500P multifunctional microscope was used to observe the characteristics of the inclusions, and it was found that the generation type and characteristics of the inclusions are relatively complex. Calcite and dolomite contain fluid inclusions with different sizes and morphologies. The morphology of the fluid inclusions is regular, irregular, round, or triangular. The length of the inclusions is typically less than 10 μm, while the width is generally less than 5 μm. The early-stage fluid inclusions are mainly developed in dissolved pores in the form of sparry calcite and fracture-pore dolomite, mainly being gas–liquid two-phase aqueous inclusions. These types of inclusions typically exhibit a gas–liquid ratio of less than 5% and are characterized by a light color and transparency. A minor proportion of them were trapped in early fractures of recrystallized calcite. The late-stage fluid inclusions are mostly developed in dolomite veins or late calcite filling gypsum-model pores, and a few are developed in the sparry calcites of late fractures.
Intergranular pore natural gas intrusion was observed in the carbonate reservoirs of the Ordovician Majiagou Formation, as well as intergranular pore fluorescence. Some intergranular pores exhibited light yellow-green and light yellow-brown fluorescence (Figure 10a–c). According to the classification scheme of inclusions [57], asphalt inclusions, gas inclusions, and aqueous inclusions are developed in the Ordovician strata. The asphalt inclusions are gray-black with blue fluorescence (Figure 10d–i). In contrast, the gas inclusions are black or gray-black and non-fluorescent (Figure 10j–l). Furthermore, the aqueous inclusions, accompanied by hydrocarbons, are colorless and non-fluorescent. Confocal laser Raman spectrometry was used to test the laser Raman spectra of the thin-section inclusions. Based on the phase and compositional differences in the inclusions at room temperature, the inclusions were further corroborated to be classified into three primary categories: asphalt inclusions, gas inclusions, and aqueous inclusions (Figure 11).

4.3.2. Analysis of Inclusions’ Homogenization Temperature and Period of Accumulation

Hydrocarbon inclusions contain a large amount of organic matter. As the components are not stable enough under heating and pressurization, the measurement results will be affected, resulting in errors. Conversely, the components of aqueous inclusions are more stable, and their homogenization temperature can more accurately reflect the trapped temperature, which is used to represent the strata temperature at the time of hydrocarbon charging [58,59,60].
The specific test data are shown in Table 1. The principles of statistics are applied to arrange the results of the homogenization temperature of the inclusions and produce distribution histograms. The homogenization temperature of the Ordovician carbonate rock inclusion is continuously distributed from 76 °C to 182 °C, indicating that hydrocarbon is accumulated continuously. Additionally, peaks occur in the intervals of 110–130 °C and 160–170 °C, which suggests that the Ordovician Formation in the study area has mainly undergone two stages of hydrocarbon charging (Table 1; Figure 12).
At present, the fluid inclusion homogenization temperature method is a reliable and effective method for determining the period of hydrocarbon accumulation. The experimentally measured fluid inclusion homogenization temperature peak is projected onto the burial–thermal evolution history map to determine the time in geologic history when the corresponding temperature was reached and then to determine the time of hydrocarbon charging [61]. By comparison, we obtained the following results: The early-stage fluid inclusions of Majiagou Formation were formed in the mature stage of source rocks. The Ro value is between 0.7% and 1.0%, and the peak of the inclusions’ homogenization temperature is 110–130 °C. The time of hydrocarbon charging is 210–165 Ma, corresponding to the end of the Late Triassic to the end of the Middle Jurassic. The peak homogenization temperature of the late-stage fluid inclusions is 160–170 °C, indicating that the hydrocarbon charging time is about 123–97 Ma, corresponding to the end of the Early Cretaceous. In this period, Paleozoic source rocks were in the overmature stage (Ro between 1.3% and 2.0%) (Figure 13). Hydrocarbon charging is controlled by thermal evolutionary movements associated with the Early Cretaceous tectono-thermal event. Under the influence of Yanshanian movement, tectonic fractures are formed in the strata, which provide channels for hydrocarbon transport. In addition, the natural gas in the Ordovician strata of the basin, accumulated in karst and weathered crust reservoirs, is also consistent with the Early Cretaceous natural gas formation in the Ordos Basin [62,63].
There is also a great correspondence between the hydrocarbon charging period and the evolutionary stage in the maturation history of the source rock. Both of the hydrocarbon charging periods in the study area are characterized by rapid stratum warming and an increase in the maturity of organic matter. This is evidenced by the strength of hydrocarbon generation and favorable stratum temperature and pressure conditions, which collectively provide a robust foundation for large-scale hydrocarbon charging.

5. Conclusions

  • The Ro distribution of the Ordovician strata in the central part of the basin is between 1% and 3.2%, while the southern part of the basin is situated in the center of the Early Cretaceous thermal anomaly. This region exhibits a high maximum paleo-geotemperature gradient and a markedly elevated degree of thermal evolution. The present geothermal gradient is 28.6 °C/km, the average paleo-geotemperature gradient of the Ordovician is about 54.2 °C/km, and the paleoheat flux is about 55 mW/m2. The paleo-geotemperature gradient is larger than the present geothermal gradient.
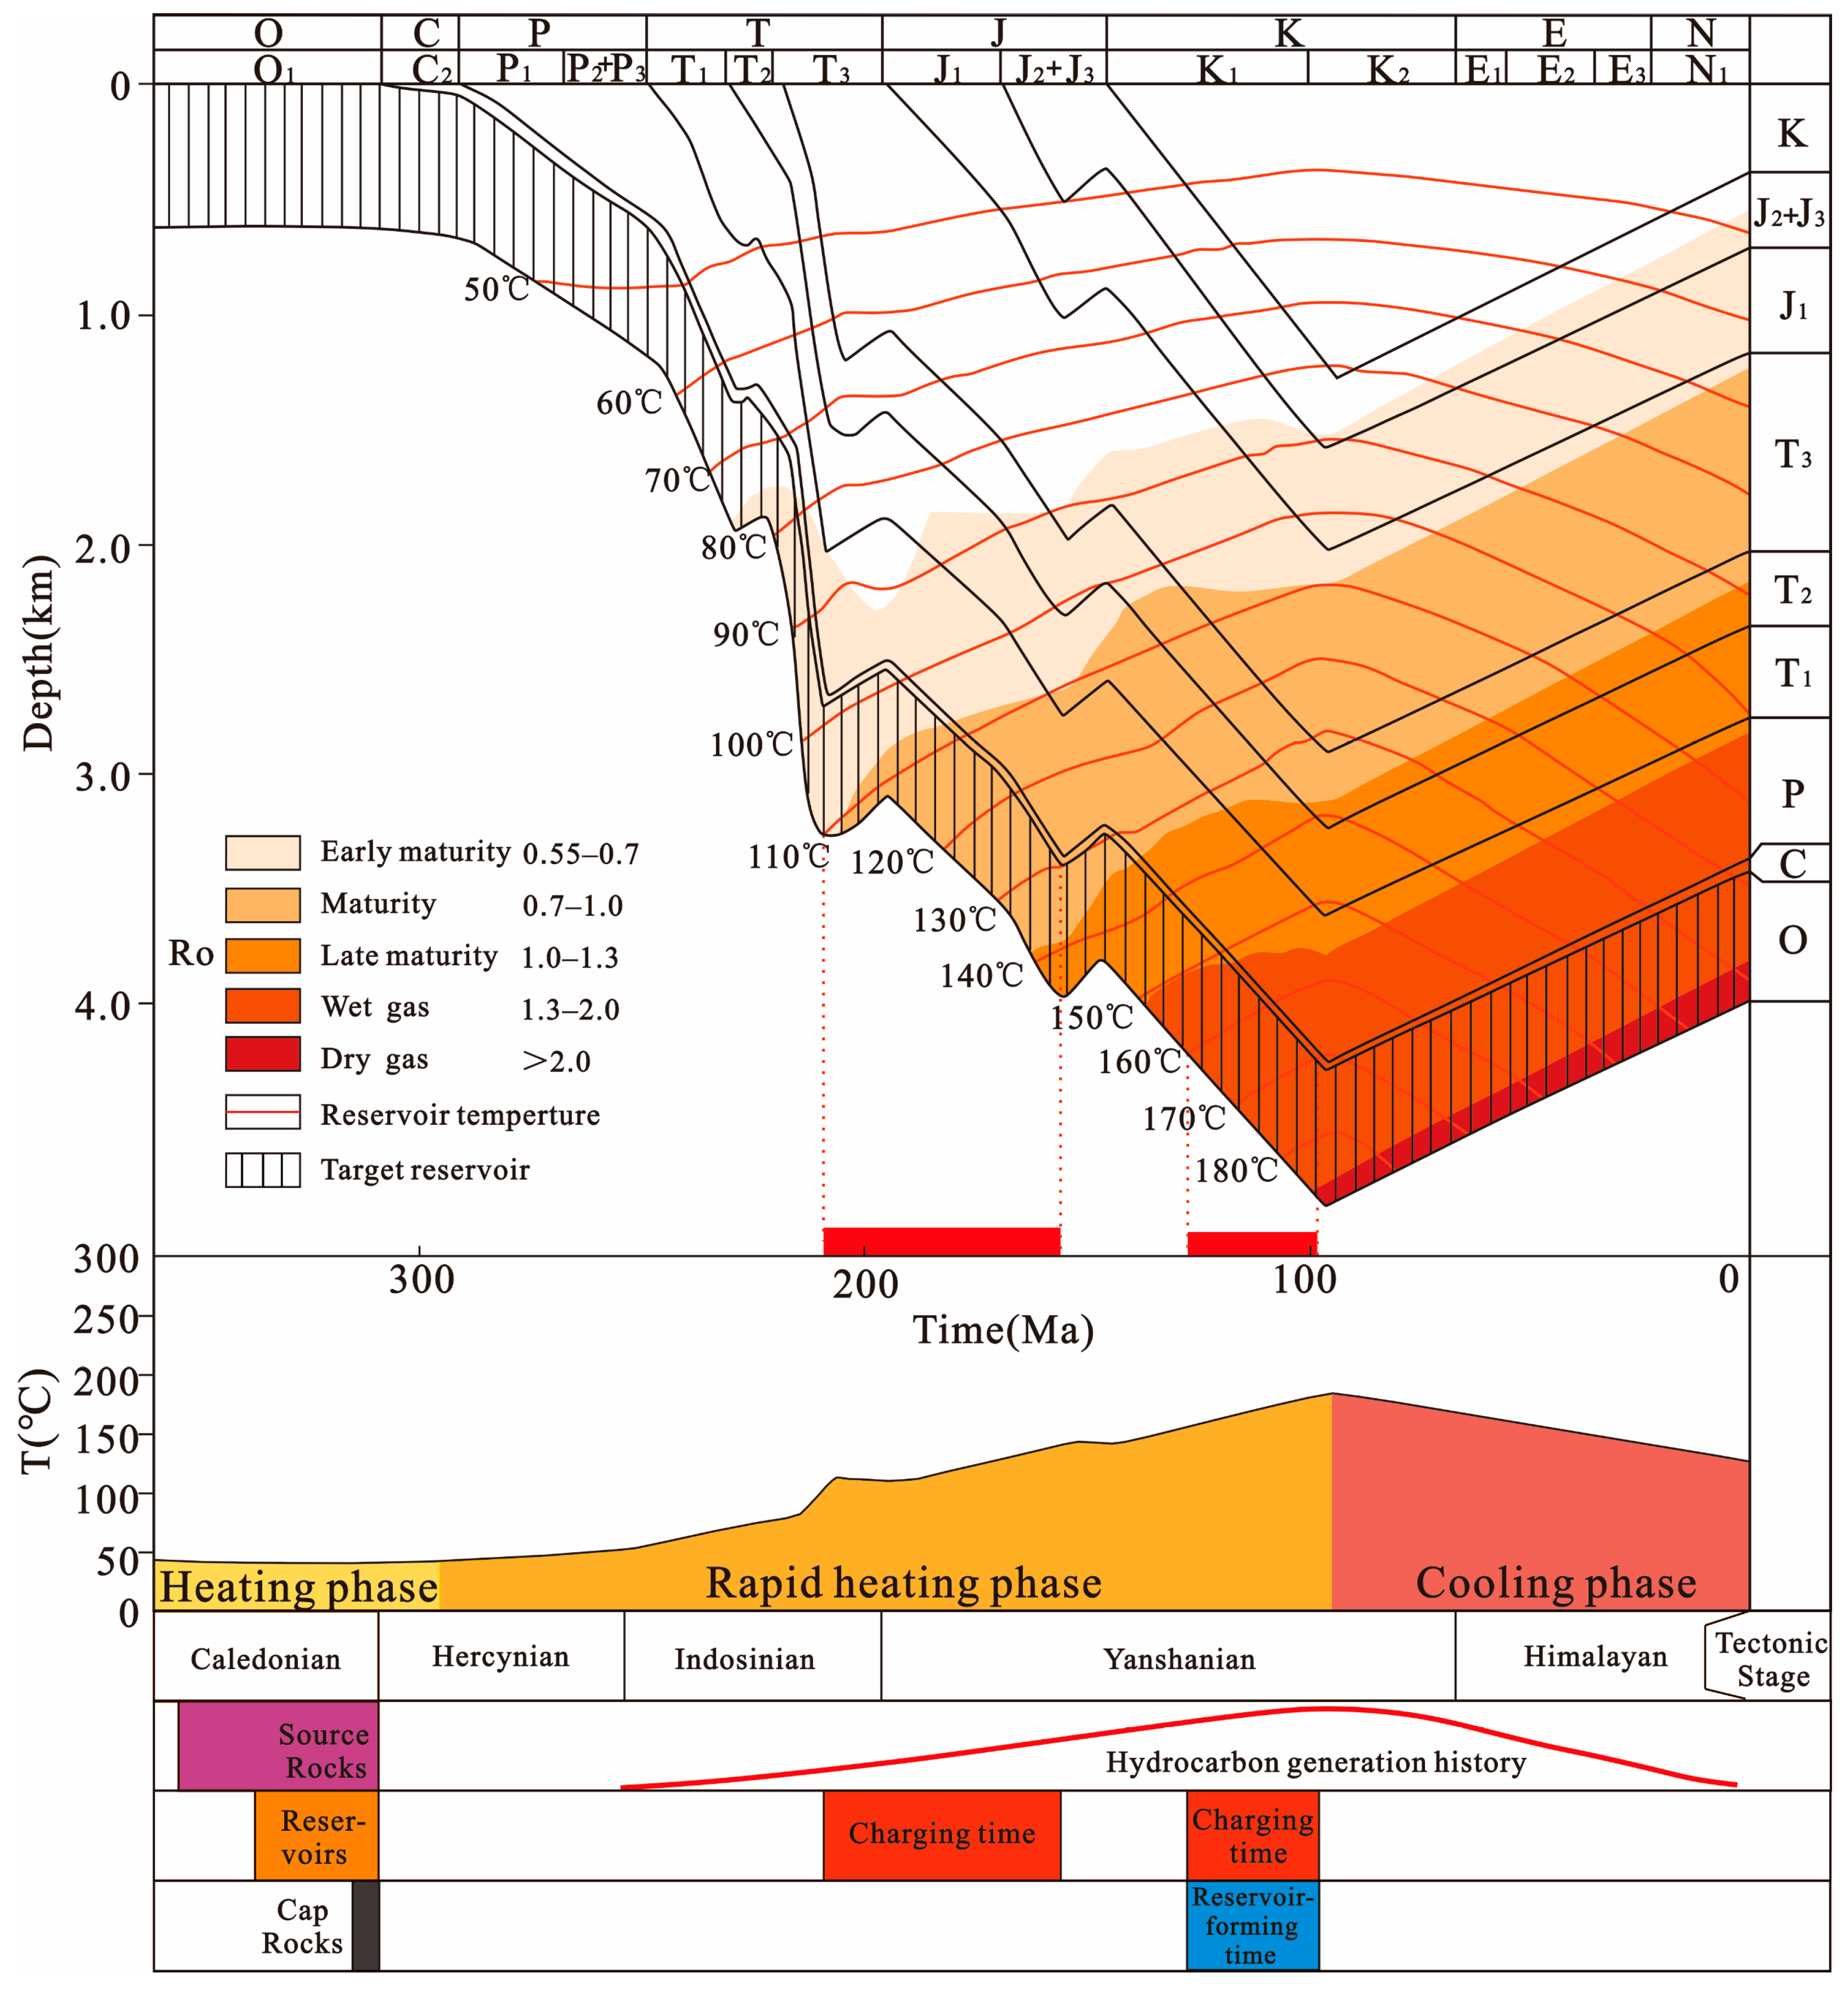
  • The Ordovician strata in the study area have undergone three significant thermal evolution stages: (i) The slow warming stage before the Late Permian, from the Middle and Late Ordovician to the Permian. This stage consisted of shallow stratigraphic depths, low thermal evolution, and immature organic matter. (ii) The rapid warming stage from the Late Permian to the Late Cretaceous. In this stage, the strata again subsided. Additionally, as a result of the Early Cretaceous tectono-thermal event, the organic matter reached maturity or even overmaturity, and a large number of hydrocarbons were produced, with a warming rate of 0.78 °C/Ma. (iii) The rapid cooling stage at the end of the Early Cretaceous. In this stage, the basin was subjected to the Yanshanian and Himalayan movements, and the strata were uplifted and denuded. Additionally, the geotemperature dropped rapidly, with a cooling rate of 0.8 °C/Ma, and the generation of hydrocarbons was weakened.
  • The Ordovician strata in the study area develop carbonate–gypsum salt assemblages. Asphalt inclusions, gas inclusions, and accompanying aqueous inclusions are mainly distributed in fracture-pore dolomite, dolomite veins, fracture-pore calcite, and the calcite veins of carbonatite reservoirs.
  • The homogenization temperature of the Ordovician fluid inclusions in the central region of the basin is between 76 °C and 182 °C, with a distinctive distribution characterized by two peaks. The peak homogenization temperature of the early-stage fluid inclusions is 110–130 °C, with a hydrocarbon charging time of 210–165 Ma, corresponding to the end of the Late Triassic to the end of the Middle Jurassic. The peak homogenization temperature of the late-stage fluid inclusions is 160–170 °C, with a hydrocarbon charging time of 123–97 Ma, corresponding to the end of the Early Cretaceous. The two periods of hydrocarbon charging occurred during the rapid stratigraphic warming stage associated with the Early Cretaceous tectono-thermal event, in addition to an increase in stratigraphic tectonic fracturing caused by the Yanshan movement, which also favored hydrocarbon charging.

Author Contributions

Conceptualization, Z.R.; methodology, K.Q.; software, H.L.; formal analysis, S.S.; investigation, H.T.; resources, J.C.; data curation, F.Z.; writing—original draft preparation, H.T.; writing—review and editing, J.C. All authors have read and agreed to the published version of the manuscript.

Funding

The research was supported by the National Natural Science Foundation of China (Project no. 41630312), National Key R&D Projects (Project no. 2017YFC0603106) and Major Science and Technology Project of PetroChina Changqing Oilfield Company (Project no. ZDZX2021).

Data Availability Statement

The data used to support the findings of this study are available from the first author upon request (first author: H.T. thua@stumail.nwu.edu.cn).

Conflicts of Interest

The authors declare no conflicts of interest.

References

  1. Li, W.; Tu, J.; Zhang, J.; Zhang, B. Accumulation and Potential Analysis of Self-Sourced Natural Gas in the Ordovician Majiagou Formation of Ordos Basin, NW China. Shiyou Kantan Yu Kaifa/Pet. Explor. Dev. 2017, 44, 552–562. [Google Scholar] [CrossRef]
  2. Fu, J.; Bai, H.; Sun, L.; Ma, Z. Types and Characteristics of the Ordovician Carbonate Reservoirs in Ordos Basin, China. Shiyou Xuebao/Acta Pet. Sin. 2012, 33, 110–117. [Google Scholar]
  3. Cai, C.; Hu, G.; He, H.; Li, J.; Li, J.; Wu, Y. Geochemical Characteristics and Origin of Natural Gas and Thermochemical Sulphate Reduction in Ordovician Carbonates in The Ordos Basin, China. J. Pet. Sci. Eng. 2005, 48, 209–226. [Google Scholar] [CrossRef]
  4. Yang, S.; Wu, G.; Zhu, Y.; Zhang, Y.; Zhao, X.; Lu, Z.; Zhang, B. Key Oil Accumulation Periods of Ultra-Deep Fault-Controlled Oil Reservoir in Northern Tarim Basin, NW China. Pet. Explor. Dev. 2022, 49, 285–299. [Google Scholar] [CrossRef]
  5. Sweeney, J.; Burnham, A. Evaluation of a Simple Model of Vitrinite Reflectance Based on Chemical Kinetics. Aapg Bull. 1990, 74, 1559–1570. [Google Scholar]
  6. Ketcham, R.A.; Donelick, R.A.; Carlson, W.D. Variability of Apatite Fission-Track Annealing Kinetics; III, Extrapolation to Geological Time Scales. Am. Miner. 1999, 84, 1235–1255. [Google Scholar] [CrossRef]
  7. Mora, A.; Casallas, W.; Ketcham, R.; Gomez, D.; Parra, M.; Namson, J.; Stockli, D.; Almendral Vazquez, A.; Robles, W.; Ghorbal, B. Kinematic Restoration of Contractional Basement Structures Using Thermokinematic Models: A Key Tool for Petroleum System Modeling. Aapg Bull. 2015, 99, 1575–1598. [Google Scholar] [CrossRef]
  8. Qiu, N.; Liu, X.; Xiong, Y.; Liu, Y.; Xu, Q.; Chang, Q. Progress in the Study of Carbonate Clumped Isotope in the Thermal History of Marine Basins. Pet. Geol. Exp. 2023, 45, 891. [Google Scholar] [CrossRef]
  9. Liu, Q.; He, L.; Chen, L. Tectono-Thermal Modeling of Cenozoic Multiple Rift Episodes in the Bohai Bay Basin, Eastern China and Its Geodynamic Implications. Int. J. Earth Sci. 2018, 107, 53–69. [Google Scholar] [CrossRef]
  10. Chen, L. Stretching Factor Estimation for the Long-Duration and Multi-Stage Continental Extensional Tectonics: Application to The Baiyun Sag in the Northern Margin of the South China Sea. Tectonophysics 2014, 611, 167–180. [Google Scholar] [CrossRef]
  11. Shenton, B.; Grossman, E.; Passey, B.; Henkes, G.; Becker, T.; Laya, J.C.; Perez-Huerta, A.; Becker, S.; Lawson, M. Clumped Isotope Thermometry in Deeply Buried Sedimentary Carbonates: The Effects of Bond Reordering and Recrystallization. Geol. Soc. Am. Bull. 2015, 127, 1036–1051. [Google Scholar] [CrossRef]
  12. Xu, Z.; Liu, L.; Liu, B.; Wang, T.; Zhang, Z.; Wu, K.; Feng, C.; Dou, W.; Wang, Y.; Shu, Y. Geochemical Characteristics of the Triassic Chang 7 Lacustrine Source Rocks, Ordos Basin, China: Implications for Paleoenvironment, Petroleum Potential and Tight Oil Occurrence. J. Asian Earth Sci. 2019, 178, 112–138. [Google Scholar] [CrossRef]
  13. Tao, S. Sequence of Diagenetic Authigenic Mineral: The Basis of Timing the Inclusions Formation in Sedimentary Rocks. Pet. Explor. Dev. 2006, 33, 154–160. [Google Scholar]
  14. Chen, G.; Li, S.; Zhang, H.; Ding, C.; Yang, F.; Lei, P. Timing and Stages of the Permian Oil-Gas Accumulations in Northeastern Ordos Basin. Geol. China 2013, 40, 1453–1465. [Google Scholar]
  15. Wei, X.; Zhu, Y.; Xu, H.; Zhao, G.; Li, Y. Discussion on Neogene Dolostone Forming Condition in Xisha Islands: Evidences From Isotope C and O and Fluid Inclosures. Acta Petrol. Sin. 2006, 22, 2394–2404. [Google Scholar]
  16. Rajabzadeh, M.A.; Rasti, S. Investigation on Mineralogy, Geochemistry and Fluid Inclusions of the Goushti Hydrothermal Magnetite Deposit, Fars Province, SW Iran: A Comparison with IOCGs. Ore Geol. Rev. 2017, 82, 93–107. [Google Scholar] [CrossRef]
  17. Kerkhof, A.; Hein, U. Fluid Inclusion Petrography. Lithos 2001, 55, 27–47. [Google Scholar] [CrossRef]
  18. Zhu, H.; Luo, Q.; Zhou, L.; Tang, M.; Chang, H. Application Prospect of Natural Gas Component Analysis Using Laser Raman Spectroscopy. Nat. Gas Ind. 2013, 33, 110–114. [Google Scholar] [CrossRef]
  19. Jayanthi, J.; Nandakumar, V.; Anoop, S. Feasibility of a 785 nm Diode Laser in Raman Spectroscopy for Characterizing Hydrocarbon-Bearing Fluid Inclusions in Mumbai Offshore Basin, India. Pet. Geosci. 2017, 23, 369–375. [Google Scholar] [CrossRef]
  20. Prieto, A.C.; Guedes, A.; Dória, A.; Noronha, F.; Jimenez, J. Quantitative Determination of Gaseous Phase Compositions in Fluid Inclusions by Raman Microspectrometry. Spectrosc. Lett. 2012, 45, 156–160. [Google Scholar] [CrossRef]
  21. Xie, K.; Tan, X.; Feng, M.; Wang, B.; Zhong, S.; Yang, M.; Nie, W.; Qiao, Z.; Zeng, W. Eogenetic Karst and Its Control on Reservoirs in the Ordovician Majiagou Formation, Eastern Sulige Gas Field, Ordos Basin, NW China. Pet. Explor. Dev. 2020, 47, 1246–1261. [Google Scholar] [CrossRef]
  22. Qin, Y.; Liu, C.; Huang, L.; Wang, J.; Zhao, J.; Shao, D.; Yang, L.; Zhao, X.; Khalaf, E.; Zhang, S.; et al. Characteristics of the Low-Pressure Spatial and Temporal Distributions of Oil- and Gas-Bearing Layers in the Ordos Basin, China. Int. J. Coal Geol. 2024, 285, 104476. [Google Scholar] [CrossRef]
  23. Liu, C.; Wang, J.; Zhang, D.; Zhao, H.; Zhao, J.; Huang, L.; Wang, W.; Qin, Y. Genesis of Rich Hydrocarbon Resources and Their Occurrence and Accumulation Characteristics in the OrdosBasin. Oil Gas Geol. 2021, 42, 1011–1029. [Google Scholar]
  24. Zhao, J.; Liu, C.; Huang, L.; Zhang, D.; Wang, D.; Wang, D. Paleogeography Reconstruction of a Multi-Stage Modified Intra-Cratonic Basin—A Case Study from the Jurassic Ordos Basin, Western North China Craton. J. Asian Earth Sci. 2020, 190, 104191. [Google Scholar] [CrossRef]
  25. Liu, C.; Zhao, H.; Gui, X.; Yue, L.; Zhao, J.; Wang, J. Space-Time Coordinate of the Evolution and Reformation and Mineralization Response in Ordos Basin. Acta Geol. Sin. 2006, 80, 618–638. [Google Scholar]
  26. Yang, P.; Ren, Z.; Fu, J.; Bao, H.; Xiao, H.; Shi, Z.; Wang, K.; Zhang, Y.; Liu, W.; Li, W. A Tectono-Thermal Perspective on the Petroleum Generation, Accumulation and Preservation in the Southern Ordos Basin, North China. Pet. Sci. 2024, 21, 1459–1473. [Google Scholar] [CrossRef]
  27. Darby, B.J.; Ritts, B.D. Mesozoic Contractional Deformation in the Middle of the Asian Tectonic Collage: The Intraplate Western Ordos Fold–Thrust Belt, China. Earth Planet. Sci. Lett. 2002, 205, 13–24. [Google Scholar] [CrossRef]
  28. FU, J.; Zheng, C. Evolution Between North China Sea and Qilian Sea of the Ordovician and the Characteristics of Lithofacies Palaeogeography in Ordos Basin. J. Palaeogeogr. 2001, 3, 25–34. [Google Scholar]
  29. Zhang, X.; Zhang, T.; Lei, B.; Zhang, J.; Zhang, J.; Zhao, Z.; Yong, J. Origin and Characteristics of Grain Dolomite of Ordovician Ma55 Member in The Northwest of Ordos Basin, NW China. Pet. Explor. Dev. 2019, 46, 1182–1194. [Google Scholar] [CrossRef]
  30. He, H.; Guo, X.; Zhao, Z.; Xi, S.; Wang, J.; Song, W.; Ren, J.; Wu, X.; Bi, H. New Understandings on Gas Accumulation and Major Exploration Breakthroughs in Subsalt Ma 4 Member of Ordovician Majiagou Formation, Ordos Basin, NW China. Pet. Explor. Dev. 2022, 49, 489–501. [Google Scholar] [CrossRef]
  31. Peng, H.; Wang, J.; Liu, C.; Zhao, H.; Huang, L.; Zhao, X.; Zhang, S.; Liang, C.; Wang, Z.; Cattò, S.; et al. Long-term and Multiple Stage Exhumation of the Ordos Basin, Western North China Craton: Insights from Seismic Reflection, Borehole and Geochronological Data. Earth-Sci. Rev. 2023, 238, 104349. [Google Scholar] [CrossRef]
  32. Tu, J.; Dong, Y.; Zhang, B.; Nan, H.; Li, C.; Wang, X.; Fei, X.; Zhou, W. Discovery of Effective Scale Source Rocks of the Ordovician Majiagou Fm in the Ordos Basin and Its Geological Significance. Nat. Gas Ind. B 2016, 3, 330–338. [Google Scholar] [CrossRef]
  33. Guo, Y.; Zhao, Z.; Zhang, Q.; Xu, W.; Bao, H.; Zhang, Y.; Gao, J.; Song, W. Development Characteristics and New Exploration Areas of Marine Source Rocks in Ordos Basin. Acta Pet. Sin. 2016, 37, 939–951. [Google Scholar] [CrossRef]
  34. Hu, D.; Han, C.; Ma, R.; Liu, Y.; Wang, J.; Gao, Z. The Very Low Grade Metamorphism in the Upper Paleozoic in Xinlingol Area of Inner Mongolia, NE China: Evidence from Studies of Illite and Vitrinite Reflectance. Acta Petrol. Sin. 2012, 28, 3042–3050. [Google Scholar]
  35. Qin, J.; Tenger, B.; Shen, B.; Tao, G.; Lu, L.; Yang, Y. Ultramicroscopic Organic Petrology Characteristics and Component Classification of Excellent Marine Source Rocks. Pet. Geol. Exp. 2015, 37, 671–680. [Google Scholar] [CrossRef]
  36. Wang, W.; Zhou, Z.; Yu, P. Relations Between Vitrinite Reflectance, Peek Temperature and Its Neighboring Temperature Variation Rate: A Comparison of Methods. Chin. J. Geophys. 2005, 48, 162–170. [Google Scholar] [CrossRef]
  37. Ren, Z.; Tian, T.; Li, J.; Wang, J.; Cui, J.; Li, H.; Tang, J.; Guo, K. Review on Methods of Thermal Evolution History in Sedimentary Basins and Thermal Evolution History Reconstruction of Superimposed Basins. J. Earth Sci. Environ. 2014, 36, 12–21. [Google Scholar]
  38. Qiu, N.; Li, H.; Jin, Z. Study of the Thermal History Reconstruction for Lower Paleozoic Carbonate Succession. Earth Sci. Front. 2005, 4, 561–567. [Google Scholar]
  39. Zhu, C.; Qiu, N.; Jiang, Q.; Hu, S.; Zhang, S. Thermal History Reconstruction Based on Multiple Paleo-Thermal Records of the Yazihe Area, Western Sichuan Depression. Chin. J. Geophys. 2015, 58, 3660–3670. [Google Scholar] [CrossRef]
  40. Barker, C.E.; Pawlewicz, M.J. An Empirical Determination of The Minimum Number of Measurements Needed to Estimate the Mean Random Vitrinite Reflectance of Disseminated Organic Matter. Org. Geochem. 1993, 20, 643–651. [Google Scholar] [CrossRef]
  41. Barker, C.E.; Goldstein, R.H. Fluid-inclusion Technique for Determining Maximum Temperature in Calcite and Its Comparison to the Vitrinite Reflectance Geothermometer. Geology 1990, 18, 1003–1006. [Google Scholar] [CrossRef]
  42. Teichmüller, M. Recent Advances in Coalification Studies and Their Application to Geology. Geol. Soc. Lond. Spec. Publ. 1987, 32, 127–169. [Google Scholar] [CrossRef]
  43. Fu, S.; Peng, P.; Zhang, W.; Liu, D.; Liu, J. Palaeo-water and Gas Boundary in the Upper Paleozoic Gas Reservoir of Ordos Basin Reconstructed Using Vitrinite Reflectance Kinetics and the Homogenization Temperature of Fluid Inclusion. Acta Petrolei Sinica 2004, 24, 46–51. [Google Scholar]
  44. Frings, K.; Lutz, R.; de Wall, H.; Warr, L. Coalification History of the Stephanian Ciñera- Matallana Pull- Part Basin, NW Spain: Combining Anisotropy of Vitrinite Reflectance and Thermal Modelling. Int. J. Earth Sci. 2004, 93, 92–106. [Google Scholar] [CrossRef]
  45. Sakaguchi, A.; Yanagihara, A.; Ujiie, K.; Tanaka, H.; Kameyama, M. Thermal Maturity of a Fold–Thrust Belt Based on Vitrinite Reflectance Analysis in the Western Foothills Complex, Western Taiwan. Tectonophysics 2007, 443, 220–232. [Google Scholar] [CrossRef]
  46. Ren, Z.; Yu, Q.; Cui, J.; Qi, K.; Chen, Z.; Cao, Z.; Yang, P. Thermal History and Its Controls on Oil and Gas of the Ordos Basin. Earth Sci. Front. 2017, 24, 137–148. [Google Scholar] [CrossRef]
  47. Qi, K. Meso-Cenozoic Lithospheric Thermal-Rheological Structure and Deep Magmatic-Thermal Process in the WNCC. Ph.D. Thesis, Northwest University, Xi’an, China, 2021. [Google Scholar]
  48. Keith, M.L.; Weber, J.N. Carbon and Oxygen Isotopic Composition of Selected Limestones and Fossils. Geochim. Cosmochim. Acta 1964, 28, 1787–1816. [Google Scholar] [CrossRef]
  49. Bemis, B.; Spero, H.; Bijma, J.; Lea, D. Reevaluation of the Oxygen Isotopic Composition of Planktonic Foraminifera: Experimental Results and Revised Paleotemperature Equations. Paleoceanography 1998, 13, 150–160. [Google Scholar] [CrossRef]
  50. O'Neil, J.R.; Clayton, R.N.; Mayeda, T.K. Oxygen Isotope Fractionation in Divalent Metal Carbonates. J. Chem. Phys. 1969, 51, 5547–5558. [Google Scholar] [CrossRef]
  51. Pawlewicz, M.J.; Barker, C.E. Vitrinite Reflectance of Tertiary Coal Across the Surface of the Northern Powder River Basin, Wyoming-Montana; AAPG: Tulsa, OK, USA, 1989; pp. 341–352. [Google Scholar]
  52. Ren, Z.; Cui, J.; QI, K.; Yang, P.; Liu, X.; Zhang, C.; Yang, G.; Gao, Y.; Zhang, Y.; Xing, G. New Progress in Research on Theories and Methods for Reconstruction of Deep and Ultra-Deep Thermal Evolution History in Superimposed Basins. J. Northwest Univ. (Nat. Sci. Ed.) 2022, 52, 910–929. [Google Scholar] [CrossRef]
  53. Dow, W. Kerogen studies and geological interpretations. J. Geochem. Explor. 1977, 7, 79–99. [Google Scholar] [CrossRef]
  54. Wu, X.Q. Study on Thermal Evolution History and Hydrocarbon Accumulation Period of B Basin. Master’s Thesis, Northwest University, Xi’an, China, 2013. [Google Scholar]
  55. Ren, Z.; Cui, J.; Qi, K.; Yang, G.; Chen, Z.; Yang, P.; Wang, K. Control Effects of Temperature and Thermal Evolution History of Deep and Ultra-Deep Layers on Hydrocarbon Phase State and Hydrocarbon Generation History. Nat. Gas Ind. B 2020, 7, 453–461. [Google Scholar] [CrossRef]
  56. Yang, P.; Ren, Z.; Zhou, R.; Cui, J.; Qi, K.; Fu, J.; Li, J.; Liu, X.; Li, W.; Wang, K. Tectonic Evolution and Controls on Natural Gas Generation and Accumulation in the Ordovician System of the Ordos Basin, North China. Energy Rep. 2021, 7, 6887–6898. [Google Scholar] [CrossRef]
  57. Roedder, E. Volume 12: Fluid inclusions. Rev. Mineral. 1984, 12, 644. [Google Scholar]
  58. Cao, Q.; Wei, X.; Chen, Z.; Zhao, J.; Tang, M. Hydrocarbon Charge History of the Upper Paleozoic, Ordos Basin as Revealed by Fluid Inclusions. Front. Phys. 2022, 10, 836977. [Google Scholar] [CrossRef]
  59. Zhao, G. Characterization of Fluid Inclusions and Timing of Gas Accumulation in Upper Paleozoic Reservoirs of Hangjinqi Area, Ordos Basin. Oil Gas Geol. 2017, 38, 905–912. [Google Scholar] [CrossRef]
  60. Song, T.; Liu, L.; Li, F.; Liu, N.; Zhou, B. The Study of The Tight Sandstone Reservoir's Characteristics and The Fluid Inclusions in Fuyu Oil Layer, Daqing Placanticline. Acta Geol. Sin.—Engl. Ed. 2015, 89, 79–80. [Google Scholar] [CrossRef]
  61. Guo, X.; Liu, K.; He, S.; Song, G.; Wang, Y.; Hao, X.; Wang, B. Petroleum Generation and Charge History of the Northern Dongying Depression, Bohai Bay Basin, China: Insight from Integrated Fluid Inclusion Analysis and Basin Modelling. Mar. Pet. Geol. 2012, 32, 21–35. [Google Scholar] [CrossRef]
  62. Zhu, R.; Li, R.; Wu, X.; Qin, X.; Zhao, B.; Liu, F.; Zhao, D. The Accumulation Characteristics of the Paleozoic Reservoir in the Central-Southern Ordos Basin Recorded by Organic Inclusions. Geofluids 2021, 2021, 9365364. [Google Scholar] [CrossRef]
  63. Ren, Z.; Cui, J.; Li, J.; Wang, J.; Guo, K.; Wang, W.; Tian, T.; Cao, Z.; Yang, P. Tectonic-Thermal History Reconstruction of Ordovician in the Weibei Uplift of Ordos Basin. Acta Geol. Sin. 2014, 88, 2044–2056. [Google Scholar]
Figure 2. Vertical distribution (a) and planar distribution (b) of the vitrinite reflectance of the Ordovician top surface in the east-central part of the Ordos Basin [46,47].
Energies 17 04435 g002
Figure 3. Vertical planar distribution of geothermal gradient (a) and temperature–depth relationship (b) in the Yishan slope of the Ordos Basin [47].
Energies 17 04435 g003
Figure 5. Maximum paleotemperature recovery of Yishan slope: (a) western Yishan slope; (b) eastern Yishan slope [47].
Energies 17 04435 g005
Figure 6. Calculation of late Cretaceous denudation thickness using the vitrinite reflectance method in the Ordos Basin.
Energies 17 04435 g006
Figure 7. Total denudation thickness since the late Early Cretaceous in the east-central Ordos Basin.
Energies 17 04435 g007
Figure 8. Maturity simulation results for the Ordovician Majiagou Formation.
Energies 17 04435 g008
Figure 9. The relationship of organic matter maturity and temperature versus evolutionary time for the Ordovician Majiagou Formation.
Energies 17 04435 g009
Figure 10. Micrographs of fluid inclusions in the Ordovician Majiagou Formation in the east-central Ordos Basin: (a) reservoir intergranular pore natural gas intrusion, Y1355, 4093.68 m, Ma65; (b) natural gas inclusions in fracture-pore dolomite, Y1147, 4057.85 m, Ma65; (c) natural gas inclusions in fracture-pore dolomite, grayish-black, Y1147, 4057.85 m, Ma65; (d) natural gas inclusions, non-fluorescent, same field of view as (c); (e) natural gas and aqueous inclusions in calcite cements, gray-black, Y1355, 4093.68 m, Ma55; (f) gray-black natural gas inclusions in fracture-pore calcite, aqueous inclusions, Y1366, 3976 m, Ma55; (g) asphalt inclusions, gray-black, in fracture-pore dolomite, Y1008, 4036.2 m, Ma65; (h) asphalt inclusions, fluorescent blue, same field of view as (g); (i) natural gas and aqueous inclusions in calcite, gray, Y1207, 3976 m, Ma55; (j) gray-black natural gas and aqueous inclusions in fracture-pore calcite, Y1366, 3976 m, Ma65; (k) natural gas inclusions in fracture-pore dolomite, Y1363, 4012.4 m, Ma54; (l) gray-black natural gas inclusions in fracture-pore dolomite, Y1147, 4057.85 m, Ma55. Note: The representative fluid inclusions are circled in red.
Energies 17 04435 g010
Figure 11. Raman spectra of Ordovician fluid inclusions in the east-central Ordos Basin: (a) aqueous inclusions; (b) methane inclusion; (c) asphalt inclusion; (d) methane asphalt inclusion.
Energies 17 04435 g011
Figure 12. Homogenization temperature distribution of Ordovician fluid inclusions in the east-central Ordos Basin.
Energies 17 04435 g012
Figure 13. Tectono-thermal evolutionary history and hydrocarbon charging period of Ordovician in east-central Ordos Basin.
Energies 17 04435 g013
Table 1. Statistics of homogenization temperature test of inclusions.
WellDepth/mStrataHost MineralMorphologyOccurrenceGas–Liquid Ratio/%OriginHomogenization Temperature/°CNumber
Y12073932.8O1mCalciteIrregularVein filling≤5Primary160~1706
Y12624049.6O1mCalciteIrregularVein filling≤5Primary170~1745
Y13533998.5O1mDolomiteRegularPore filling≤5Primary>1802
Y10084036.2O1mCalciteIrregularPore filling≤5Primary175~1803
Y12373870.3O1mCalciteIrregular, triangularPore filling≤5Primary171~1807
Y11474057.9O1mDolomiteRegularVein, pore filling≤5Primary128~1504
Y13554093.7O1mDolomiteRegularVein, pore filling≤5Primary125~1556
Y13663976O1mCalciteRegularVein, pore filling≤5Primary122~18214
L34183.7O1mCalciteIrregularVein filling3~8Primary90~15513
S1014065O1mCalciteIrregular, triangularPore filling3~8Primary85~14011
S963298O1mCalciteIrregularPore filling3~8Primary112~16815
S1103575.5O1mCalciteIrregularPore filling3~8Primary105~13812
S1103579.8O1mCalciteIrregularPore filling3~8Primary102~16310
S1113522.9O1mCalciteRound, triangularPore filling3~8Primary78~1169
S1233850.5O1mCalciteIrregularPore filling3~8Primary96~17014
S1383787.4O1mCalciteIrregularPore filling3~8Primary78~14612
L64351O1mCalciteIrregular, triangularPore filling3~8Primary98~14813
L64508.9O1mCalciteIrregular, triangularPore filling3~8Primary106~11610
S444089O1mCalciteRound, triangularPore filling3~8Primary103~17815
Disclaimer/Publisher’s Note: The statements, opinions and data contained in all publications are solely those of the individual author(s) and contributor(s) and not of MDPI and/or the editor(s). MDPI and/or the editor(s) disclaim responsibility for any injury to people or property resulting from any ideas, methods, instructions or products referred to in the content.

