Article

Enhanced Second-Order RC Equivalent Circuit Model with Hybrid Offline–Online Parameter Identification for Accurate SoC Estimation in Electric Vehicles under Varying Temperature Conditions

by
Hao Zhou
,
Qiaoling He
,
Yichuan Li
,
Yangjun Wang
,
Dongsheng Wang
and
Yongliang Xie
*
School of Mechanical Engineering, Southwest Jiaotong University, Chengdu 610031, China
*
Author to whom correspondence should be addressed.
Energies 2024, 17(17), 4397; https://doi.org/10.3390/en17174397
Submission received: 6 August 2024 / Revised: 20 August 2024 / Accepted: 24 August 2024 / Published: 2 September 2024
(This article belongs to the Section E: Electric Vehicles)

Abstract

:
Accurate estimation of State-of-Charge (SoC) is essential for ensuring the safe and efficient operation of electric vehicles (EVs). Currently, second-order RC equivalent circuit models do not account for the influence of battery charging and discharging states on battery parameters. Additionally, offline parameter identification becomes inaccurate as the battery ages. Online identification requires real-time parameter updates during the SoC estimation process, which increases the computational complexity and reduces the computational efficiency of real vehicle Battery Management System (BMS) chips. To address these issues, this paper proposes a SoC estimation method that combines online and offline identification based on an optimized second-order RC equivalent circuit model, which distinguishes it from existing methods in the field. On the basis of the traditional second-order RC model, the Ohmic resistance (R0), polarization resistance (R1), polarization capacitance (C1), diffusion resistance (R2), and diffusion capacitance (C2) during the charging and discharging processes are discussed separately. R0, which does not change frequently, is identified offline, while R1, R2, C1, and C2, which dynamically change with time and current, are identified online. To thoroughly verify the feasibility of the proposed method, we construct an SoC estimation test bench, which allows us to adjust the battery’s surface temperature in real time using a temperature control chamber. Experimental validation under Federal Urban Driving Schedule (FUDS) (−10 °C to 45 °C, 80% battery capacity) and Dynamic Stress Test (DST) (−10 °C to 45 °C, 8% battery capacity) conditions demonstrate that our method improves SoC estimation accuracy by 16.28% under FUDS and 28.2% under DST compared to the improved GRU-based transfer learning method, while maintaining system SoC estimation efficiency.

1. Introduction

In the automotive industry, lithium batteries are among the most widely used and promising batteries globally. They offer high specific energy, long working life, high safety operation performance, and low cost, gradually gaining advantages in the field of energy storage [1,2]. With the popularization of electric vehicles (EVs), the performance, cost, lifespan, and safety of vehicle batteries have become the focus of attention. In addition to enhancing the research and development of easily replaceable individual batteries and module assembly methods, the development of Battery Management Systems (BMS) has also become a hot topic [3]. BMS can detect the voltage, temperature, and current of battery packs, battery modules, and individual cells. It can also accurately estimate the State of Charge (SoC), State of Health (SoH), and remaining battery life [4]. The battery unit with the smallest capacity determines the range of battery usage. Accurate SoC estimation provides reliable battery information, helping to avoid overcharging and overdischarging, which can shorten the battery cycle life [5,6].
For many years, scholars have conducted extensive research on the estimation of battery SoC. There are two ways to obtain input parameters for battery SoC estimation: offline parameter identification and online parameter identification. E. P. et al. [7] used an offline identification method based on Thevenin’s model to obtain the fixed values of the internal parameters of the battery. They verified the estimated SoC using the Extended Kalman Filter (EKF) and a vehicle dynamics model in Matlab/Simulink, providing reliable SoC estimation for EV range prediction. However, this method did not consider the ambient temperature during battery operation, resulting in accuracy deviations of the estimation results at different temperatures. Shi et al. [8] established an equivalent circuit model based on Thevenin’s model and used recursive least squares with a forgetting factor (FFRLS) for online parameter identification. They used fuzzy control to adaptively adjust the forgetting factor, completing the SoC estimation. However, the addition of a fuzzy controller reduced computational efficiency, making it more complex to implement in traditional processing units.
Some scholars have also optimized the mathematical description, recognizing the nonlinear relationship between the SoC of the battery and the open circuit voltage (OCV). Refining the description of OCV can enhance the model’s accuracy. Common methods for fitting the OCV include piecewise linear fitting [9], polynomial fitting [10], lattice gas model fitting [11], and electrochemical polarization model fitting [12]. In terms of SoC algorithms, Xing et al. [13] combined the OCV method with the Kalman filter algorithm for SoC estimation. Using the Rint model, they considered the influence of temperature and added an SoC-OCV-T lookup table. Model parameters were identified using the least squares method, and SoC was estimated using the Unscented Kalman Filter (UKF). However, the experiment did not account for ambient temperatures below 0 °C, leading to incomplete estimation results. Chen et al. [14] proposed a state-dependent autoregressive model to describe the nonlinear dynamic characteristics of lithium-ion batteries and the time-varying operating states caused by load changes. They estimated SoC online through the Adaptive Extended Kalman Filter (AEKF). Yun et al. [15] proposed a segmented parameter identification method combining FFRLS and Gaussian Process Regression (GPR), utilizing a central differential Kalman filter to generate an importance density function to overcome particle degradation and improve estimation accuracy. Chen et al. [16] proposed a long short-term memory recurrent neural network (LSTM-RNN) that reduced the output fluctuation of the network and improved SoC estimation accuracy. Ahmed et al. [17] used a sliding mode observer to estimate SoC based on a reduced-order electrochemical model. Zhang et al. [18] used a highly compressed dataset, highly correlated with SoC, as input for a radial basis function neural network (RBFNN) to estimate battery pack SoC. Additionally, by utilizing particle swarm optimization (PSO), the algorithm improved the RBFNN estimation model and enhanced estimation accuracy. Although studies [14,15,16,17,18] have advanced the accuracy of SoC estimation based on previous research, they have not considered the impact of battery surface temperature changes on SoC estimation.
The SoC estimation of battery packs needs to consider issues such as timeliness, computational cost, and estimation accuracy [19,20,21]. In recent years, equivalent circuit models have played an important role in battery management, performance evaluation, power system simulation, thermal management, fault detection and diagnosis, and the development and optimization of new batteries. However, existing research has not accounted for the inconsistency of internal parameters during battery charging and discharging at different temperatures. In this paper, we present a SoC estimation method for Lithium-ion batteries in EVs, leveraging an optimized second-order RC equivalent circuit model that integrates online and offline parameter identification. Figure 1 illustrates the proposed generalized structure for SoC estimation, aligning with the framework discussed herein. The structure of the remaining sections of this paper will be outlined at the end of this section. This work contributes the following:
  • An enhanced second-order RC equivalent circuit model is proposed to identify internal parameters during both battery charging and discharging.
  • Taking into full consideration both the accuracy and timeliness of SoC estimation, design an estimator that combines online and offline parameter identification.
  • A comparison is made with the improved GRU-based transfer learning method, the traditional offline identification method, and the optimized online identification method.
  • Verified by changing the battery’s surface temperature and conducting two different driving cycle tests.
  • The results are verified through experiments, showing that the proposed method outperforms competing techniques.
The organization of the remaining sections of this paper is as follows: In Section 2, the battery’s surface temperature is controlled at different levels for HPPC charging and discharging tests, and an optimized second-order RC battery model is designed. In Section 3, mainstream parameter identification methods and the improved parameter identification method proposed in this paper are analyzed and derived. Section 4 presents an analysis and discussion of simulation results under the Federal Urban Driving Schedule (FUDS) and Dynamic Stress Test (DST) operating conditions. In Section 5, we experimentally validate the four methods by controlling the battery’s surface temperature. Finally, we conclude the article in Section 6.

2. Establish an Improved Lithium-Ion Battery Model

This section will optimize the traditional second-order RC circuit model by considering the effects of charging and discharging states, as well as temperature, on model parameters. To present the optimization process more clearly, the main tasks of this section include measuring the SOC-OCV-T curve of the battery at different temperatures through charge/discharge experiments and then deriving the improved mathematical and physical model based on the traditional second-order RC model.

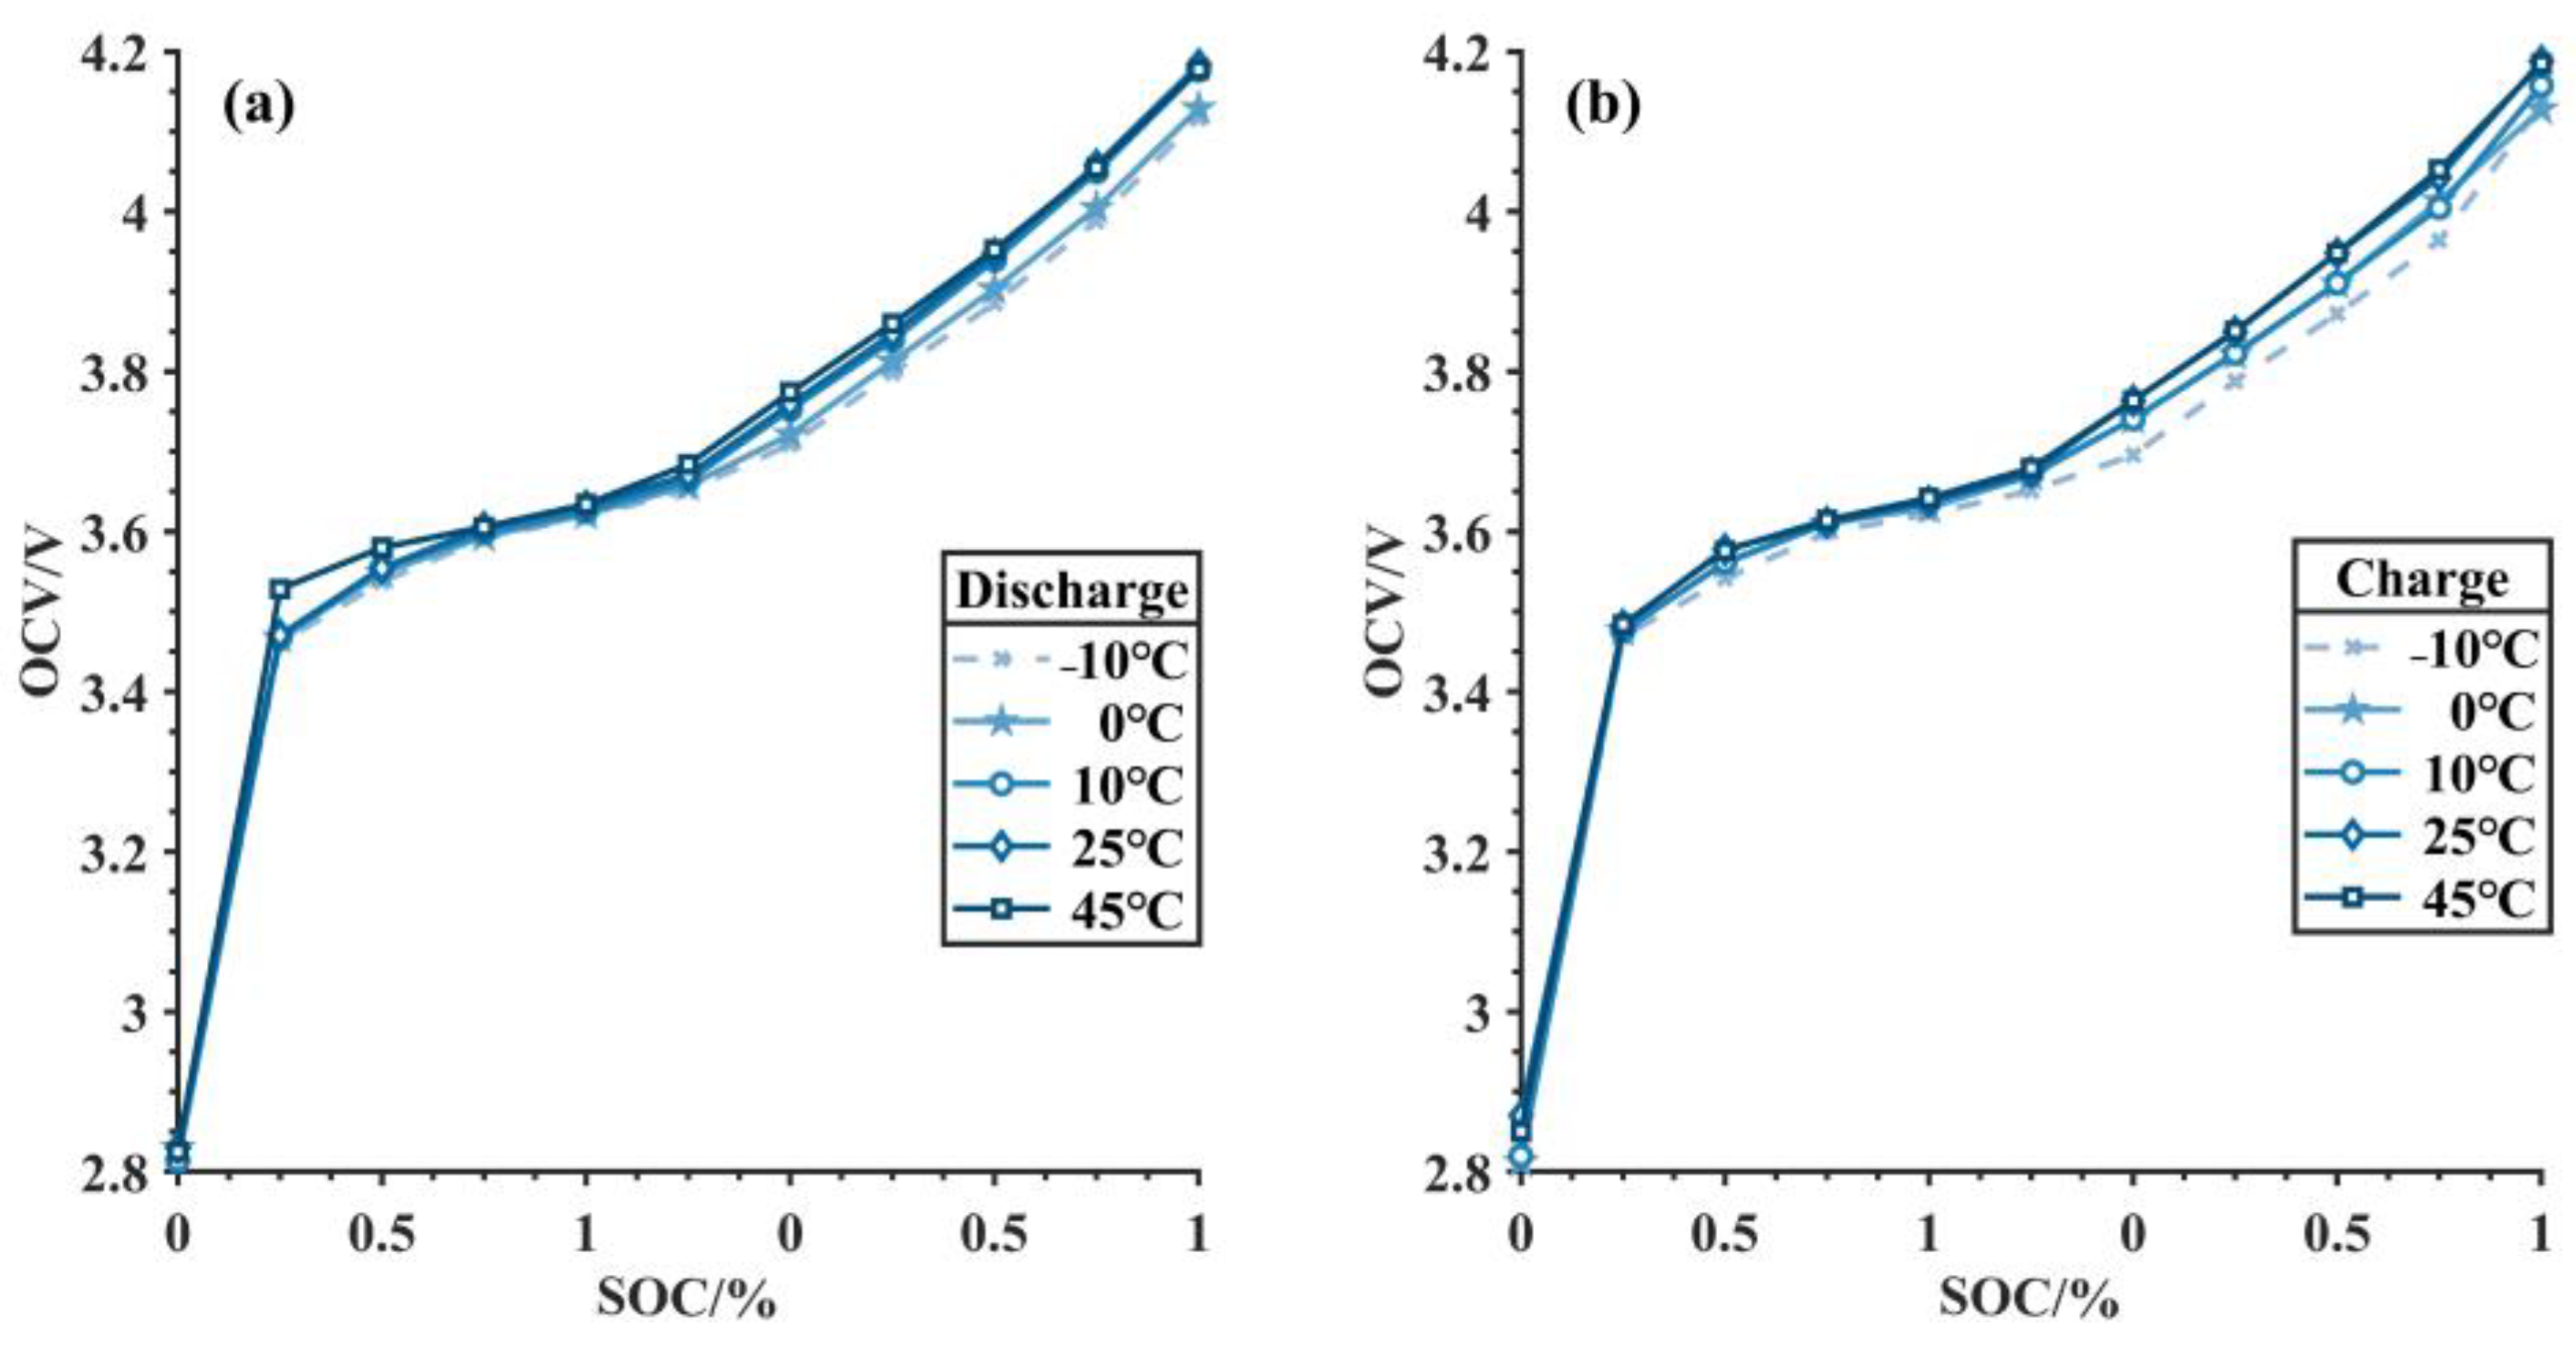
2.1. Obtaining the External Characteristic Curve of the Battery

This article uses the Panasonic NCR18650B battery (Monshin City, Japan) as the experimental object, and the battery characteristic parameters are shown in Table 1.
To determine the relationship curve between the OCV and SoC of the battery at various temperatures, a charge-discharge test platform is built to test the hybrid power pulse charge-discharge characteristics of the battery with undiminished capacity at temperatures of −10 °C, 0 °C, 10 °C, 25 °C, and 45 °C. The experimental steps are shown in Table 2 [22].
The experimental platform includes the LuGong ST-100LB (Yantai, China), an upper computer, and the ARBIN BT-5HC (College Station, TX, USA). The LuGong ST-100LB is used to regulate the surface temperature of the tested battery, the upper computer records and processes data, and the ARBIN BT-5HC charges and discharges the battery according to the experimental steps outlined in Table 2. The experimental platform is shown in Figure 2.
Based on the parameters obtained from the experiment, process the pulse voltage data to establish the relationship between the reference SoC and OCV at various temperatures, as shown in Figure 3.
It is evident that, whether in a charging pulse test or a discharging pulse test, the SoC-OCV curve is proportional to temperature. In Section 3, we will use the relationship between OCV, SoC, and T to identify the parameters of the battery.

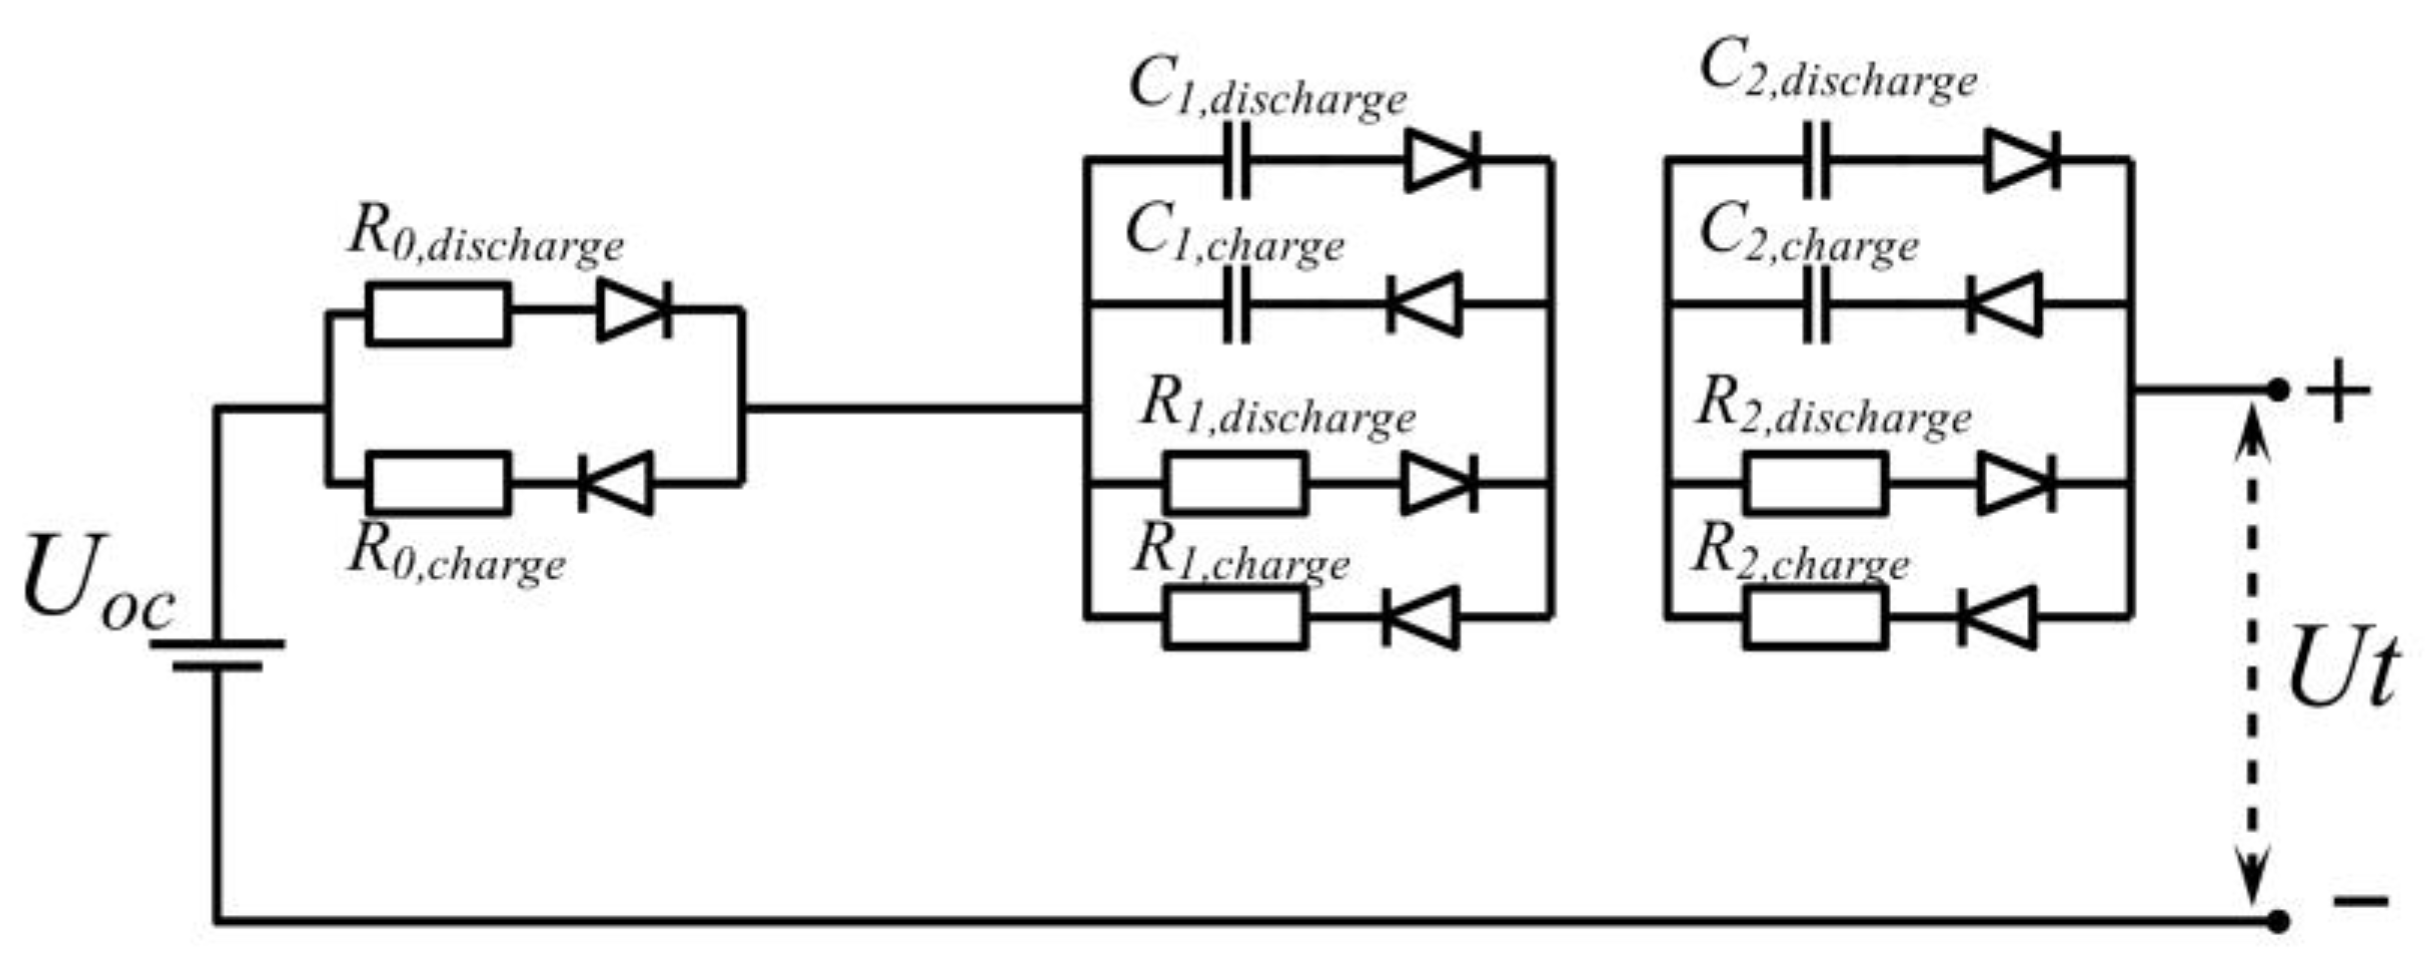
2.2. Optimized Equivalent Circuit Model

Nowadays, electrochemical models, neural network models, Rint models, Thevenin models, PNGV models, and multi-stage RC circuit models [23] are widely used. Among these, the electrochemical model offers high accuracy and a detailed description of the physical and chemical processes inside the battery, but it is complex and computationally intensive, making it more suited for studying battery performance and lifespan. Neural network models are highly flexible and can accurately handle nonlinear relationships, but they require extensive training data and lack interpretability. The Rint model is simple and fast, but it only describes the battery’s linear characteristics and lacks accuracy. The Thevenin model is relatively simple and can capture some dynamic behaviors, but its accuracy is limited. The PNGV model effectively describes dynamic behavior and state changes but is complex and has many parameters. The second-order RC circuit model strikes a good balance between complexity and accuracy; it effectively describes battery dynamics, is computationally efficient, widely applicable, easy to implement and calibrate, and offers good physical interpretability. Therefore, the second-order RC circuit model is suitable for practical applications, achieving real-time performance and efficiency while ensuring model accuracy. The structure of the second-order RC model is illustrated in Figure 4.
Based on Kirchhoff’s law, the differential equation for the second-order RC equivalent circuit model can be derived as follows:
U 1 · = U 1 C 1 R 1 + I C 1 U 2 · = U 2 C 2 R 2 + I C 2 U t = U o c U 1 U 2 I R 0
Here, U 1 and U 2 represent the polarization voltage and diffusion voltage of the battery, respectively; U ˙ 1 and U ˙ 2 represent the time rate of charge for U 1 and U 2 , respectively. U o c is the open circuit voltage; U t is the terminal voltage; R 1 and C 1 denote the polarization resistance and polarization capacitance, while R 2 and C 2 represent the diffusion resistance and diffusion capacitance.
Finally, discretize the Equation (1) and solve it to obtain
U 1 ( k ) = e t / τ 1 U 1 ( k 1 ) ( 1 e t / τ 1 ) R 1 I ( k 1 ) U 2 ( k ) = e t / τ 2 U 2 ( k 1 ) ( 1 e t / τ 2 ) R 2 I ( k 1 ) U t ( k ) = U o c ( k ) U 1 ( k ) U 2 ( k ) R 0 I ( k )
There, τ n = R n C n ( n = 1, 2) are time constants; e represents the exponential constant; t is the sampling time interval.
However, current second-order RC models do not account for the impact of battery charging and discharging states on battery parameters. To address this, we extend the traditional second-order RC model by separately discussing the Ohmic resistance R 0 , polarization resistance R 1 , polarization capacitance C 1 , diffusion resistance R 2 , and diffusion capacitance C 2 during the charging and discharging processes. This approach enhances the model’s accuracy and applicability without increasing its computational complexity. The optimized model is shown in Figure 5.
In Figure 4, the R 0 from Figure 4 is replaced by the charging Ohmic resistance R 0 , c h a r g e and discharging Ohmic resistance R 0 , d i s c h a r g e , denoted as R 0 = f 1 ( Q , s ) . The parameters R 1 , c h a r g e , C 1 , c h a r g e , R 2 , c h a r g e , C 2 , c h a r g e , R 1 , d i s c h a r g e , C 1 , d i s c h a r g e , R 2 , d i s c h a r g e , C 2 , d i s c h a r g e remain the same. Here, s represents the charge and discharge status, and Q represents SoC. Compared to the traditional second-order RC model, the optimized second-order RC model’s OCV U o c also varies with the charging and discharging states, expressed as U o c = f 2 ( Q , s ) . In other words, U o c is a function of SoC and charging/discharging states. Based on the above introduction of the optimized model, we can obtain:
U t ( k ) = f 2 ( Q , s ) U 1 ( Q , s ) U 2 ( Q , s ) I ( k ) f 1 ( Q , s )

3. Acquisition of Battery Characteristic Parameters

To provide a clearer analysis of the combined offline and online parameter identification method, this section first determines battery parameters using offline identification, followed by obtaining parameters through online identification. Ultimately, a combined offline and online identification method is derived based on these two approaches.

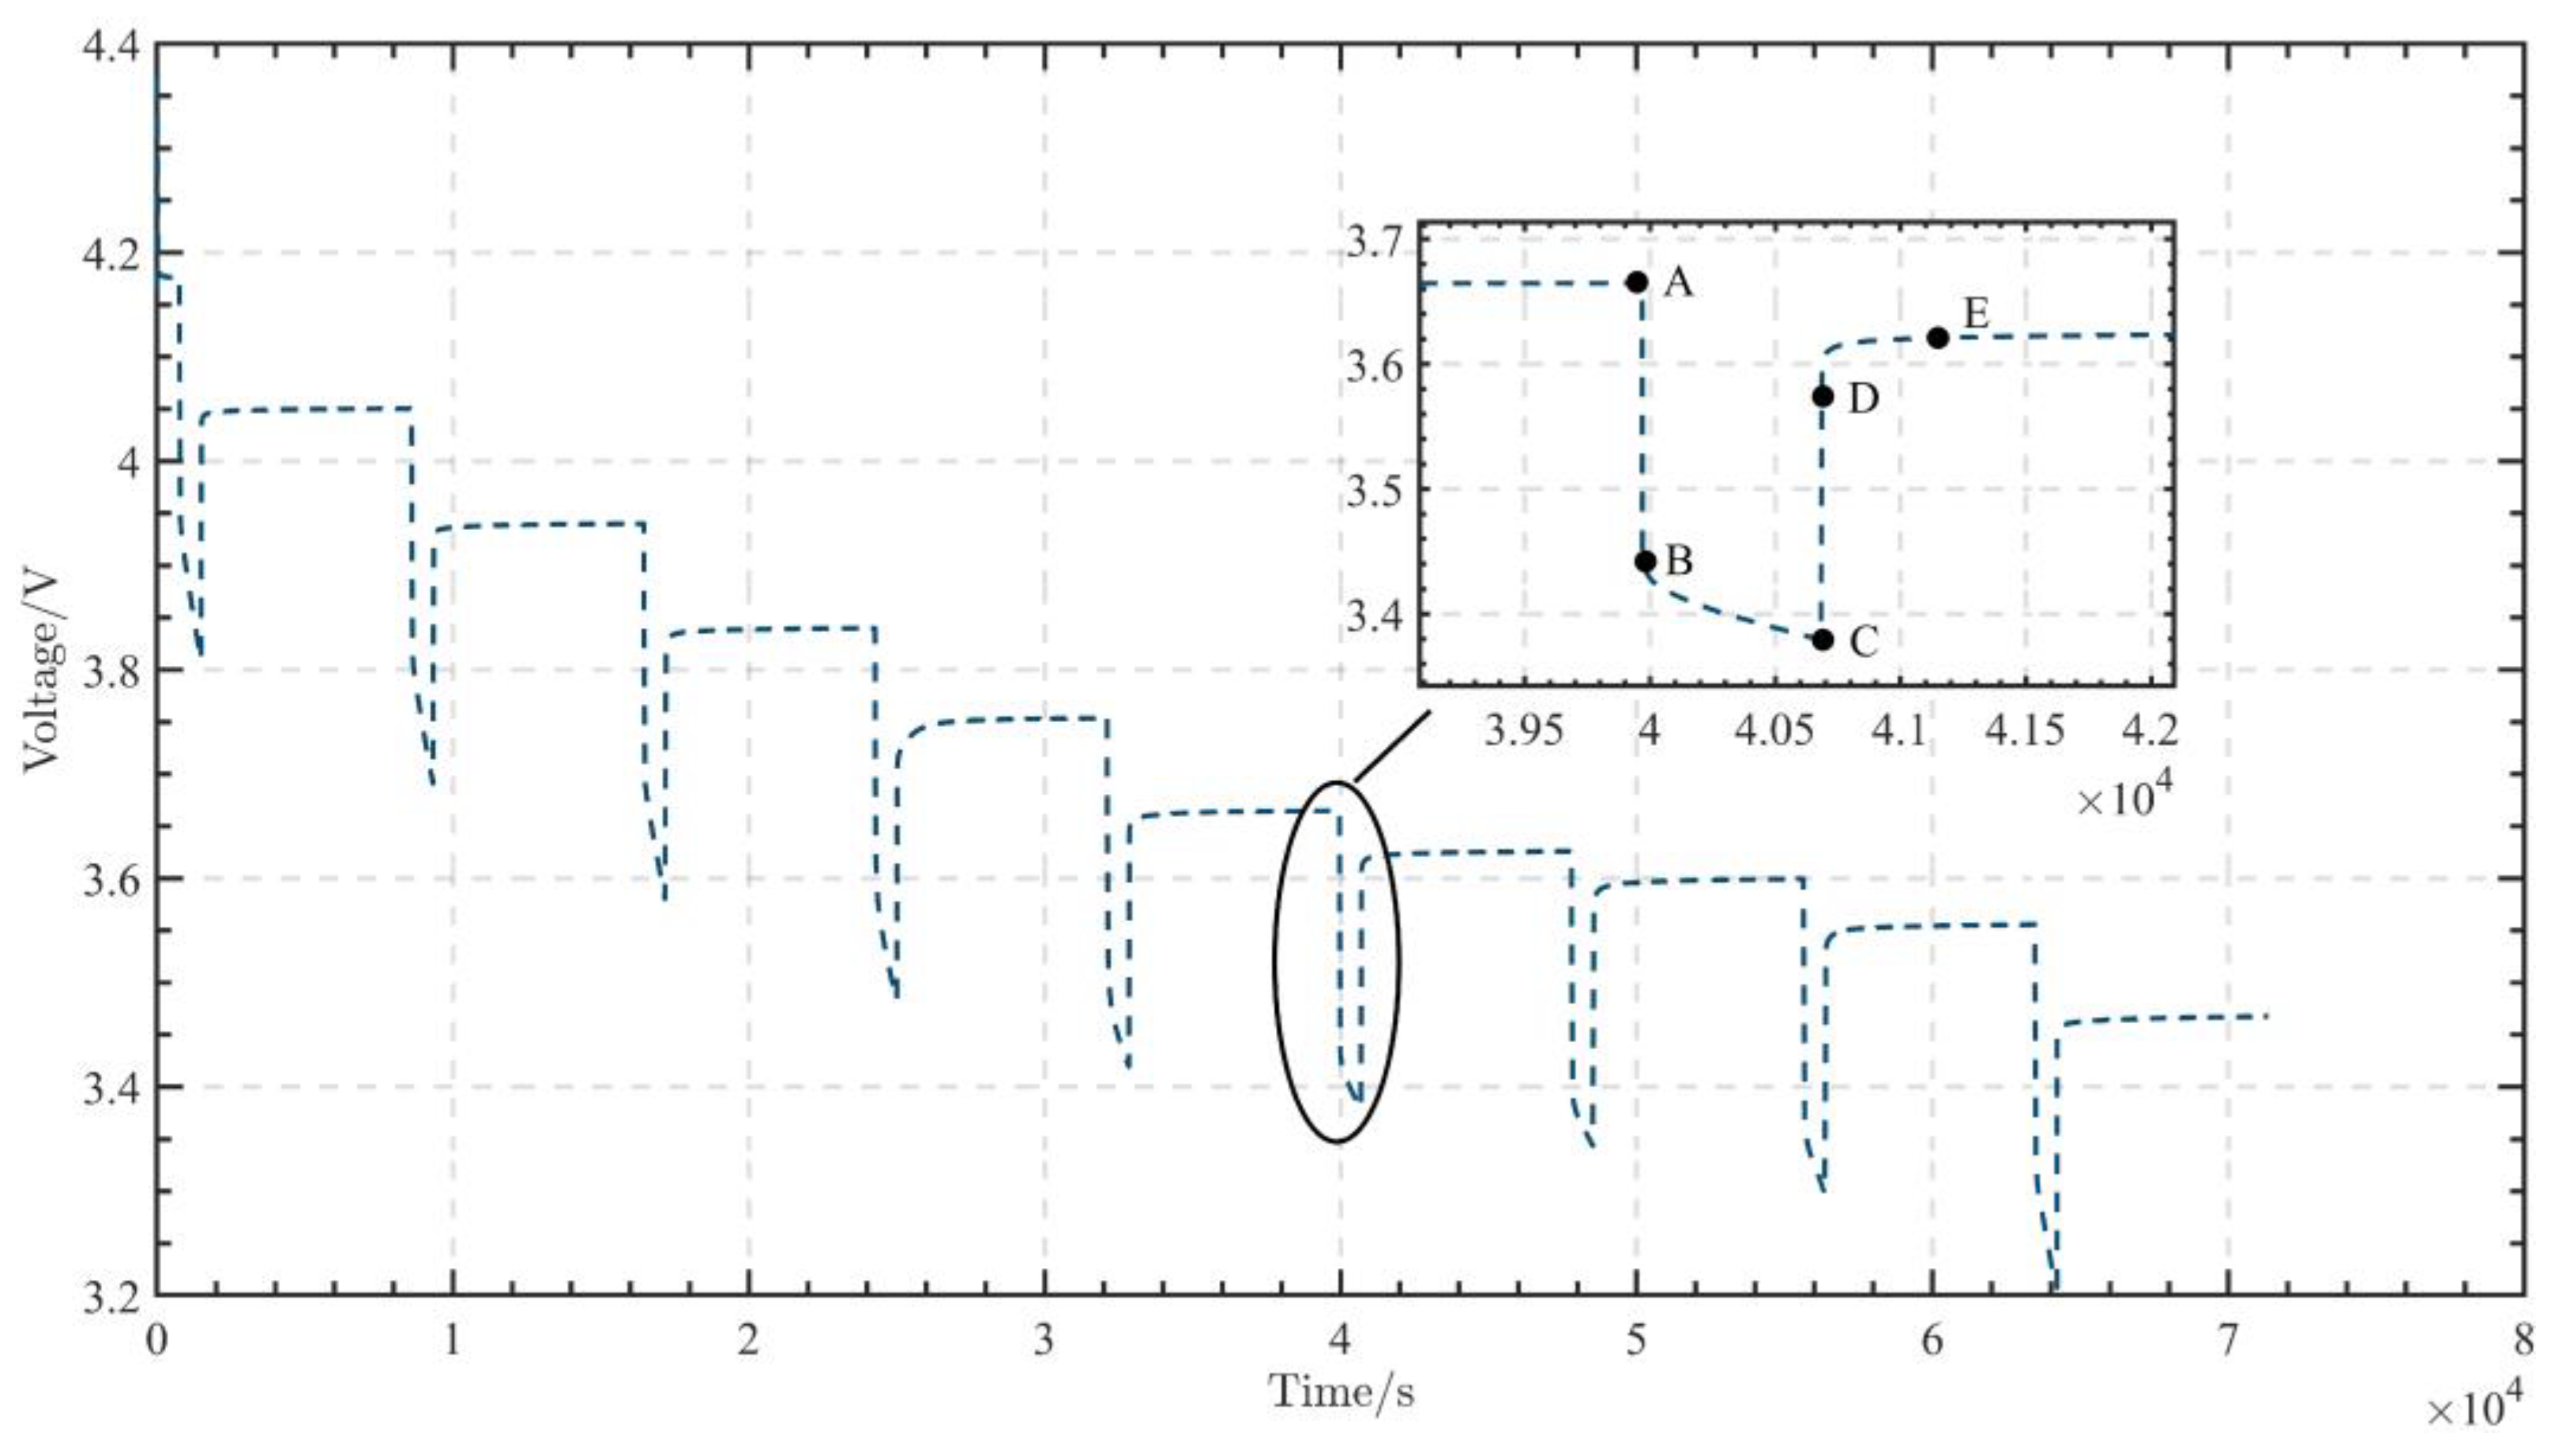
3.1. Offline Parameter Acquisition

Offline parameter acquisition requires the mathematical fitting of the stationary phase for each pulse segment. Since the internal parameters, such as internal resistance, vary between different batteries, accurately identifying all battery parameters under both charge and discharge states is crucial for reflecting the terminal voltage in the model. Voltage changing during state transitions are significantly influenced by the battery’s internal resistance, while the RC parallel network somewhat mitigates these changes [24]. The voltage variation caused by internal resistance corresponds to the AB and CD stages in Figure 6. At these stages, the magnitude of the internal resistance can be expressed as
R 0 = ( U A U B ) + ( U D U C ) 2 I
In the BC stage, after a long period of standing, the battery undergoes pulse discharge. This stage can be regarded as the zero-input response of the RC network in the equivalent circuit model. Its response equation is
U t ( t ) = U o c U 1 ( 0 ) e t / τ 1 U 2 ( 0 ) e t / τ 2
At point C, the battery output current suddenly drops to 0. However, since the voltage across the capacitor cannot change abruptly, the voltage values of the internal RC network at points C and D have not yet been adjusted. Therefore
U 1 ( 0 ) = I R 1 ( 1 e t C B / τ 1 ) U 2 ( 0 ) = I R 2 ( 1 e t C B / τ 2 )
The final result is
R 1 = U 1 ( 0 ) I ( 1 e t C B / τ 1 ) R 2 = U 2 ( 0 ) I ( 1 e t C B / τ 2 ) C 1 = τ 1 R 1 C 2 = τ 2 R 2
After the above solving steps, all parameters in the second-order RC battery model have been determined. The final fitted characteristic parameters for each SoC stage of the battery charging and discharging cycle at various temperatures are shown in Figure 7 and Figure 8.
As observed in Figure 7, in the discharged state, the values of R0, R1, and R2 decrease to varying extents as temperature increases, with R0 also being inversely proportional to the SoC level. In contrast, the values of C1 and C2 increase in direct proportion to the temperature.
In the charging state, the values of R0, R1, and R2 increase with temperature and decrease with higher SoC levels. Additionally, as temperature rises, the value of C1 also increases. For C2, apart from a noise-induced fluctuation, its value generally follows the same trend as C1.
The results suggest that the parameter identification for the charge/discharge states yielded inconsistent outcomes, likely due to differing electrochemical reaction mechanisms within the battery during these processes. During discharge, oxidation reactions dominate, with the reduction of active materials leading to electron flow from the negative electrode to the positive electrode. Conversely, during charging, reduction reactions occur, causing electrons to flow from the positive electrode to the negative electrode.

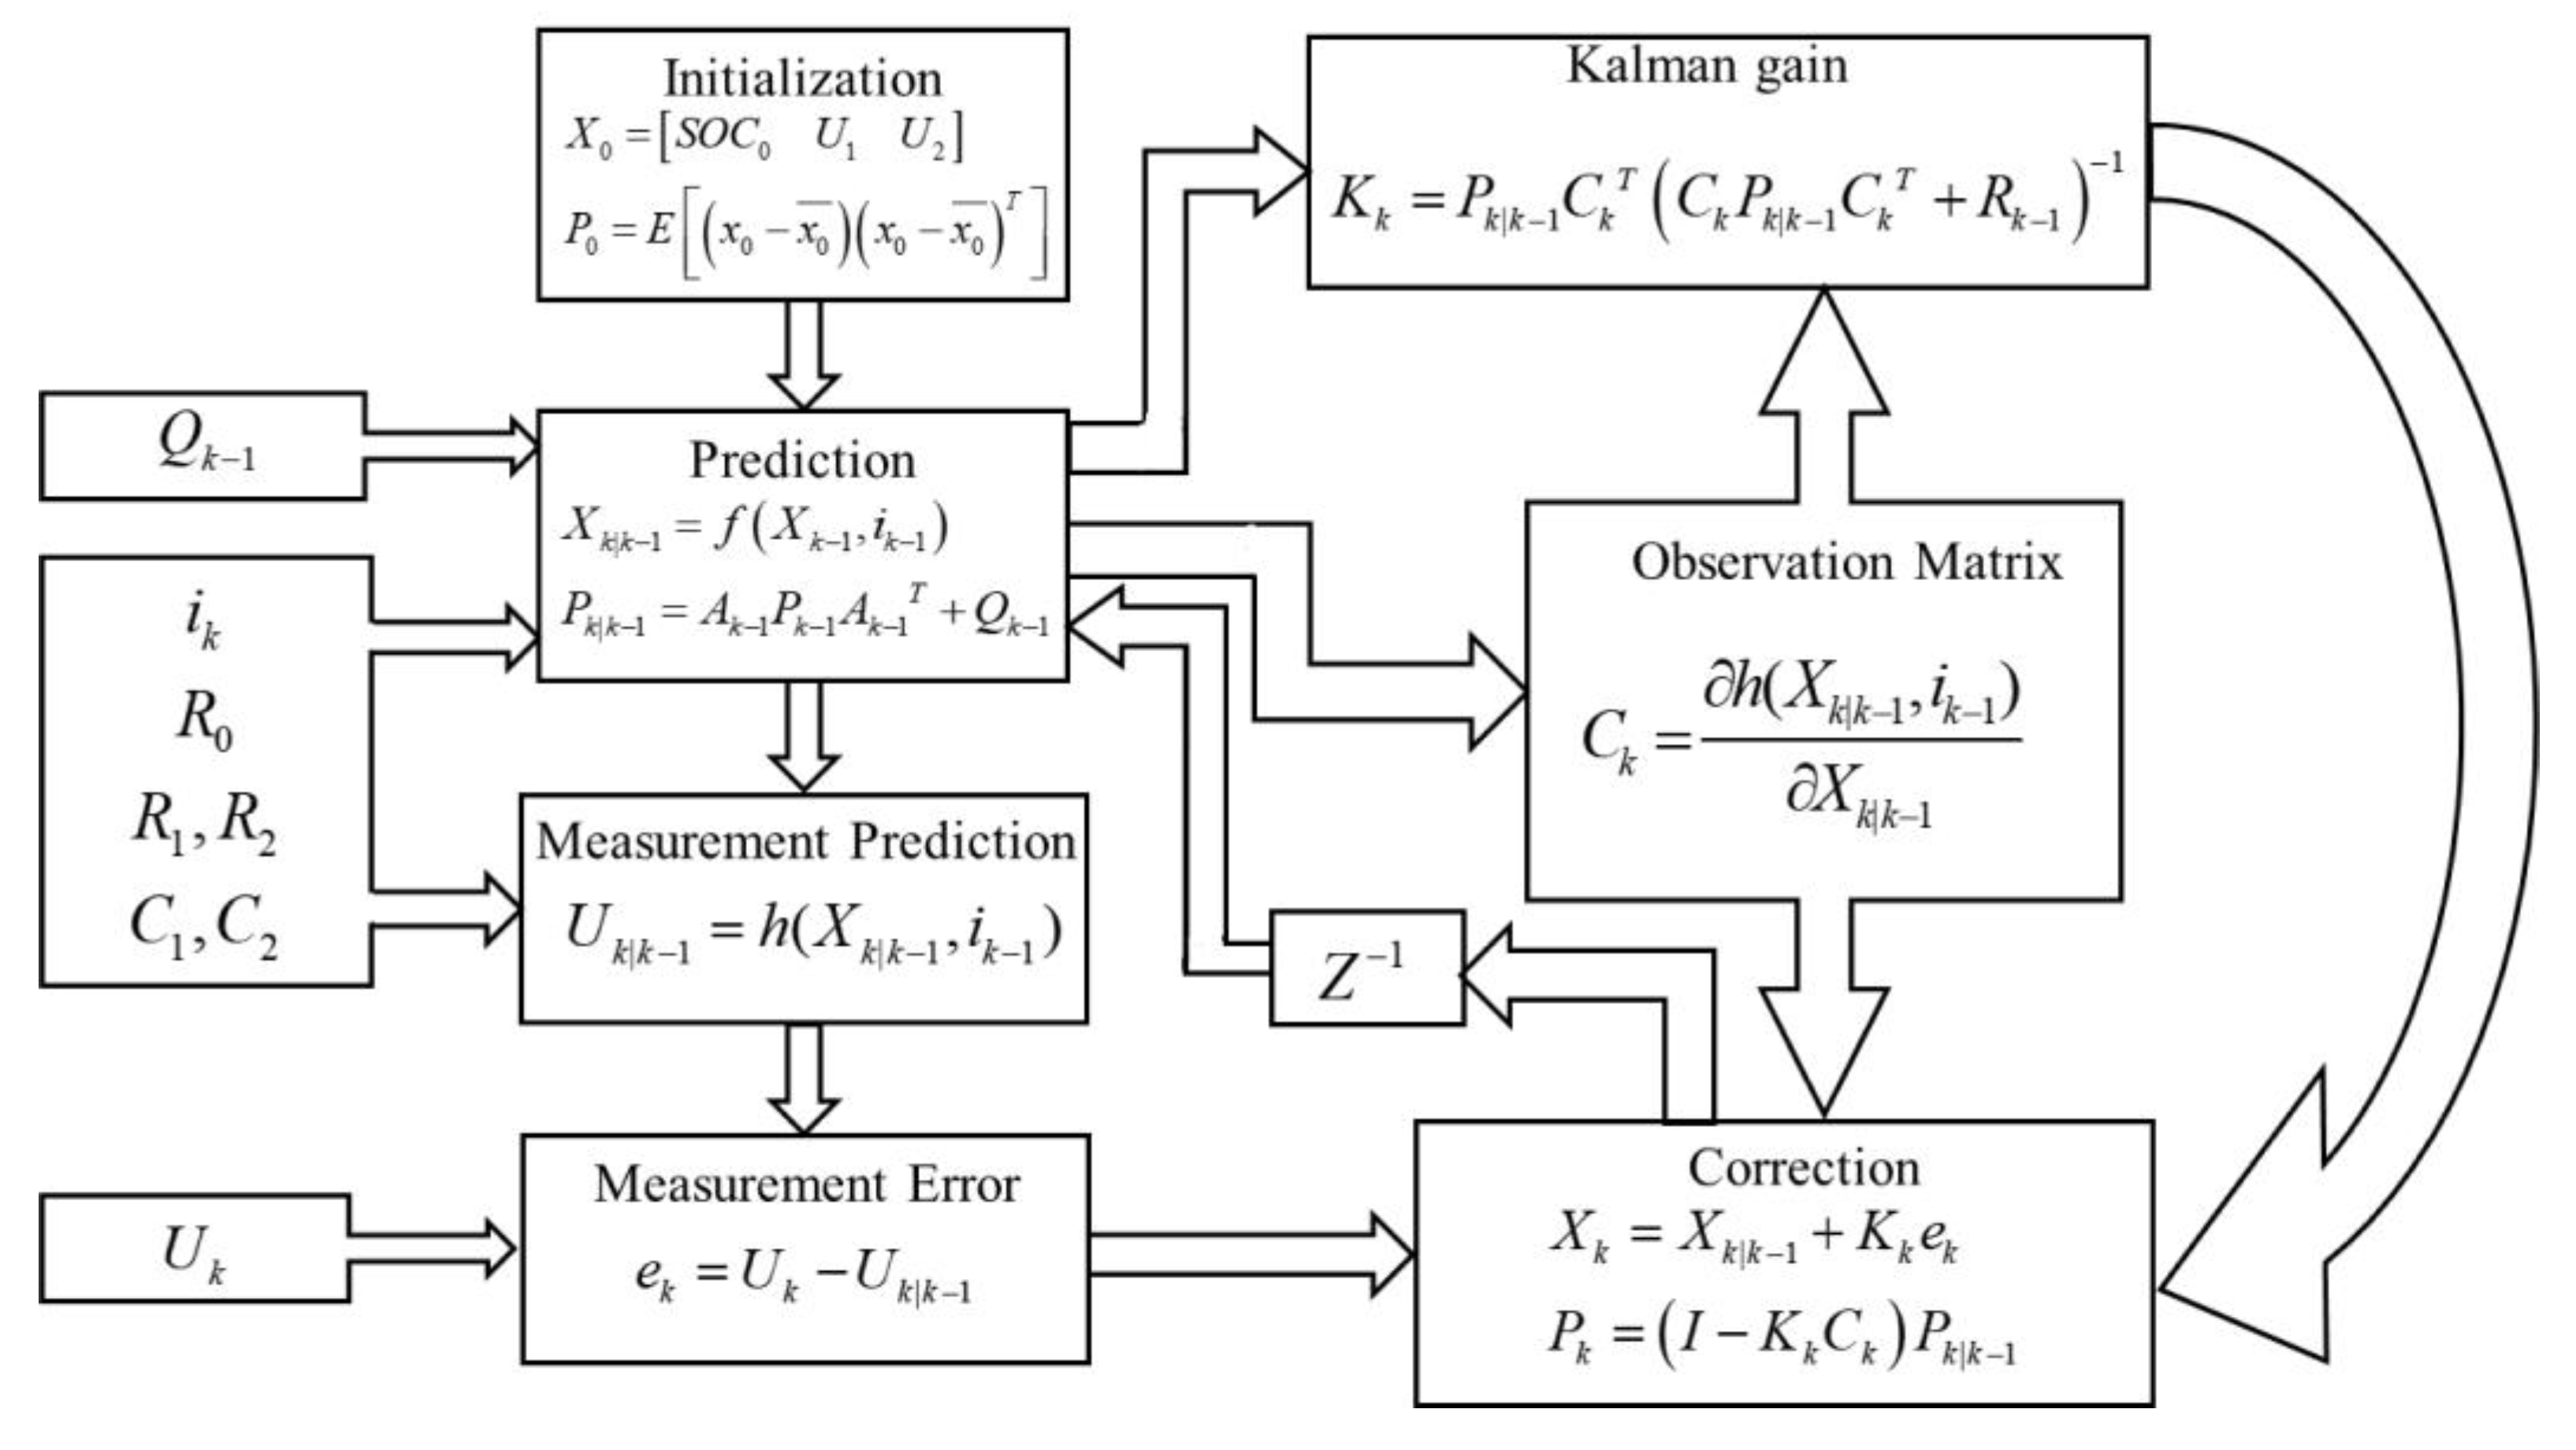
3.2. Online Parameter Acquisition

During the use of lithium batteries, complex chemical reactions occur internally, and these reactions are easily influenced by environmental conditions. Online parameter identification can update model parameters in real time during battery operation, reflecting real-time changes in the battery state. This is particularly important for capturing the dynamic characteristics of batteries under different temperature, load, and aging conditions [25]. In this article, we apply the FFRLS to the parameter identification of the lithium batteries equivalent circuit model, specifically identifying the parameters in the optimized equivalent circuit model. If the battery model is transformed into the least squares mathematical form, then
U o c = R 1 R 1 C 1 s + 1 + R 2 R 2 C 2 s + 1 + R 0 I + U t
By substituting τ n = R n C n , we can obtain
a U o c s 2 + b U o c s + U o c = a R 0 I s 2 + d I s + c I + a U t _ s 2 + b U t _ s + U t
where a = τ 1 τ 2 , b = τ 1 + τ 2 , c = R 1 + R 2 + R 0 , d = R 1 τ 2 + R 2 τ 1 + R 0 ( τ 1 + τ 2 ) .
Substituting s = x k x k 1 / T and s 2 = x k 2 x k 1 + x ( k 2 ) / T 2 into Equation (9) for discretization, where T is the sample time, yields
U o c ( k ) U t ( k ) = k 1 [ U t ( k 1 ) U o c ( k 1 ) ] + k 2 [ U t ( k 2 ) U o c ( k 2 ) ] + k 3 I ( k ) + k 4 I ( k 1 ) + k 5 I ( k 2 )
Here, k 1 , k 2 , k 3 , k 4 , k 5 can be represented as
k 1 = b T 2 a T 2 + b T + a ,   k 2 = a T 2 + b T + a k 3 = c T 2 + d T + a R 0 T 2 + b T + a ,   k 4 = d T 2 a R 0 T 2 + b T + a ,   k 5 = a R 0 T 2 + b T + a
Substitute Equation (10) into FFRLS, use θ = ( k 1   k 2   k 3   k 4   k 5   ) T as the direct identification parameters, and then derive the circuit model parameter from these identification results:
R 0 = k 5 k 2 R 1 = τ 1 c + τ 2 R 0 d τ 1 τ 2 R 2 = c R 1 R 0 C 1 = τ 1 R 1 C 2 = τ 2 R 2
Construct an online identification model based on FFRLS according to the above formula, and the specific algorithm flow is shown in Figure 9.
During each iteration, the algorithm corrects the final estimated value by incorporating the difference between the system’s computed observation value and the actual observation value, along with the gain K. The initial value of θ 0 can be any value; here, we take it as θ 0 = [−1.8975; 0.8994; 0.0009; −0.0010; 0.0005], To prevent the initial error from being too large, α should be set to a larger value. Here, we set α to 10 6 , and I is the identity matrix.
The online parameter identification results of the improved second-order RC battery model at various temperatures under pulse discharge/charge conditions are shown in Figure 10 and Figure 11.

3.3. Offline Combined with Online Parameter Acquisition

Based on the two methods mentioned earlier, this section considers combining offline identification with online identification to obtain real-time, updated internal parameters of the battery. The combination of online and offline identification leverages the algorithmic advantages of both methods to obtain accurate battery parameters. Due to its relative stability, R 0 has a low necessity for real-time updates. Unless the battery undergoes severe aging or damage, R 0 generally does not change frequently. Therefore, in this article, we conduct offline identification of R 0 . The polarization and diffusion processes, which dynamically change with time and current, reflect the instantaneous behavior of the battery under different operating conditions. Consequently, we use online identification methods to identify R 1 ,   C 1 ,   R 2 ,   C 2 .
Firstly, by transposing the terminal voltage formula to U = U o c + U t + I R 0 , the transfer function can be obtained
G ( s ) = U ( s ) I ( s ) = R 1 R 1 C 1 s + 1 R 2 R 2 C 2 s + 1
By performing the Tustin transformation on Equation (12), we can obtain
G ( z ) = b 1 z 2 + b 2 z + b 3 z 2 a 1 z + a 2
In which
a 1 = 2 R 2 C 2 t 2 R 2 C 2 + t + 2 R 1 C 1 t 2 R 1 C 1 + t ,   a 2 = ( 2 R 1 C 1 t ) ( 2 R 2 C 2 t ) ( 2 R 1 C 1 + t ) ( 2 R 2 C 2 + t ) b 1 = R 1 t 2 R 1 C 1 + t R 2 t 2 R 2 C 2 + t ,   b 2 = 2 t 2 ( R 1 R 2 ) ( 2 R 1 C 1 + t ) ( 2 R 2 C 2 + t ) ,   b 3 = R 2 t ( 2 R 1 C 1 t ) R 1 t ( 2 R 2 C 2 t ) ( 2 R 1 C 1 + t ) ( 2 R 2 C 2 + t )
The input of the system is I k , and the output is U 2 , Where U 2 , k = U t , k R 0 , k I k . Ignoring the variation of open circuit voltage within a unit sample time, the following can be obtained
U 2 , k = 1 a 1 + a 2 U o c , k + a 1 U 2 , k 1 + a 2 U 2 , k 2 b 1 I k b 2 I k 1 b 3 I k 2
The final result of the online parameter identification is as follows:
C 1 = t 2 b 1 + b 2 C 2 = t 2 ( b 1 b 2 ) R 1 = b 3 + b 1 a 2 2 b 2 R 2 = b 3 b 1 a 2 2 b 2
The calculation of R 0 using this method is entirely consistent with the calculation of R 0 from offline parameter identification. Details are omitted here.
The parameter identification results of this scheme under pulse charge/discharge are illustrated in Figure 12 and Figure 13.

4. Simulation and Comparison

The actual operating conditions alternate between charging and discharging states. To comprehensively compare the accuracy of SoC estimation between traditional battery models [26] and the improved second-order RC battery model proposed in this paper under various identification methods, this chapter utilizes the open-source lithium battery dataset from CALCE [27]. The dataset consists of a LiNiMnCo/Graphite battery with a nominal capacity of 2.0Ah. The test data encompass various dynamic current profiles, including DST, FUDS, US06 Highway Driving Schedule, and Beijing Dynamic Stress Test (BJDST). All tests were conducted at temperatures of 0 °C, 25 °C, and 45 °C, targeting battery capacities of 80% and 50%. This article specifically references the FUDS (25 °C, 80% battery level) and DST (25 °C, 80% battery level) operating conditions from this dataset for simulation purposes.
Under FUDS operating conditions, the battery is subjected to a series of charge and discharge cycles that mimic urban driving scenarios, including acceleration, deceleration, and idle periods. During testing, the dataset applies multiple pulse charges and discharges to the battery according to the FUDS standard curve, recording voltage, current, and temperature variations after each pulse. For DST operating conditions, dynamic current loads are applied to simulate the acceleration and deceleration phases of real vehicles, with particular emphasis on observing the battery’s response and performance degradation under high-power pulses.
To accurately estimate SoC, this paper employs the EKF for verification. EKF is designed to address nonlinear problems by extending the linear Kalman filtering approach [28]. The core concept involves Taylor expanding the nonlinear function at the state estimation point while retaining only the first-order terms. The state and observation equations for nonlinear discrete systems are as follows:
X k + 1 = f ( k , X k , u k ) + G k ω k Y k = h ( k , X k , u k ) + v k
When applying EKF to calculate the battery’s SoC after discretization, the state variable in the state equation is defined as X k = [ S o C k   U 1 , k   U 2 , k ] , and the state equation is expressed as follows:
S O C k U 1 , k U 2 , k = 1 0 0 0 e t / τ 1 0 0 0 e t / τ 2 S O C k 1 U 1 , k 1 U 2 , k 1 + η t C a ( 1 e t / τ 1 ) R 0 ( 1 e t / τ 2 ) R 0 i k 1 + w k
The measurement equation is as follows:
U k = d U o c , k d S O C k 1 1 S O C k U 1 , k U 2 , k R 0 i k + v k
According to Equations (17) and (18), the state transition matrix A k and the observation matrix C k are inferred as follows:
A k = 1 0 0 0 e t / τ 1 0 0 0 e t / τ 2 ,   C k = d U o c , k d S O C k 1 1
The input to the EKF includes the operating current, voltage, and battery parameters obtained through parameter identification, and the output is SoC. The algorithm flow is illustrated in Figure 14.
Finally, we substitute the parameters identified by different identification methods in Section 3 into the above algorithm. We name the combined identification method of the improved second-order RC model as Method A, the method proposed by [26] as Method B, the traditional offline identification method of the second-order RC model as Method C, and the online identification method of the improved second-order RC model as Method D. Next, we calculate the estimation errors between the actual SoC value and those obtained from Methods A, B, C, and D, naming these errors Error 1, Error 2, Error 3, and Error 4, respectively. Simulations are conducted in Matlab/Simulink 2023b, and the simulation results under FUDS (25 °C, 80% battery level) and DST (25 °C, 80% battery level) conditions are shown in Figure 15 and Figure 16 and Table 3.
It is evident that Method A provides the most accurate SoC estimation, as it combines online and offline recognition and performs well in dealing with dynamic operating conditions and aging effects. In contrast, the SoC estimation accuracy of Methods B and C is roughly similar, and Method B has slightly better performance because it can adapt to a wider range of operating conditions; However, Method C performs well under relatively stable HPPC conditions, but due to its lack of dynamic adjustment ability in parameter identification, the estimation error significantly increases at the end of the operating conditions under complex FUDS and DST conditions. The estimation accuracy of Method D is much lower, mainly due to the fact that although its online recognition method can update parameters in real time, the increased computational complexity and real-time requirements affect its accuracy under complex working conditions.

5. Experiment Validation

Our work is conducted using the NCR18650B battery as the experimental sample, with its specific parameters detailed in Table 1. Figure 17 illustrates the experimental platform established for the basic experiments.
For this part of the study, the experimental platform includes a sample battery (Panasonic NCR18650B), a programmable temperature and humidity chamber (HongYu HY-TH-150DH (Dongguan, China)), a battery test system (Arbin BT-5HC), an MCU (STM32F103C8T6 (Geneva, Switzerland)), a voltage/current/temperature measurement circuit, and a host computer. The measurement circuit monitors the battery’s surface temperature and displays it on the OLED screen for real-time monitoring. When the target temperature is higher than the measured temperature, the setting temperature of the HY-TH-150DH is increased to bring the battery surface to the target temperature; conversely, if the target temperature is lower, the setting temperature of the chamber is lowered. The BT-5HC performs the battery charge and discharge tests and supplies accurate current data. The MCU estimates SoC by reading the voltage/current values collected by the measurement circuit. The host computer saves real-time data and communicates in real time with the MCU. FUDS and DST are performed on this battery test bench. The experimental results are shown in Table 4.
The verification results of FUDS under variable battery surface temperatures (−10 °C to 45 °C) are shown in Figure 18.
Figure 19 shows the verification results of DST under varying battery surface temperatures (−10 °C to 45 °C).
The SoC estimation results obtained through experiments are consistent with those obtained from simulations, demonstrating the stability of the experimental platform. Additionally, using the MCU for SoC estimation takes the shortest time in Method C. This is because once Method C completes parameter identification, these parameters are directly used in the SoC estimation process without the need for additional calculations. However, in the actual operation of EVs, as the battery ages, its internal parameters will change, leading to decreased estimation accuracy for Method C. Methods A and B have similar estimation times, but Method A’s estimation accuracy is 14% higher than Method B’s. Method D updates all model parameters in real time during the estimation process, which increases computational burden and complexity. Compared to Method A, Method D’s estimation time increases by 99.09% and its estimation accuracy decreases by 123.26%.

6. Conclusions

This article proposes an improved second-order RC battery model that accurately estimates the SoC of lithium batteries using a combination of offline and online identification methods. The proposed method not only improves the estimation efficiency of SoC compared to traditional methods but also enhances the estimation accuracy. Some conclusions and summaries are presented below:
(1)
By considering the influence of battery charging and discharging states on battery parameters based on the traditional second-order RC battery model, the Ohmic resistance, polarization resistance, polarization capacitance, diffusion resistance, and diffusion capacitance during the charging and discharging process are discussed separately. This approach improves the accuracy and applicability of the model without increasing its computational complexity.
(2)
Traditional offline identification involves identifying parameters under specific conditions, but the characteristics of the battery may change over time, leading to inaccurate initial parameters. Additionally, traditional online SoC estimation methods often have low accuracy and efficiency. This paper proposes an SoC estimation method that combines online and offline identification, which not only greatly improves the efficiency of SoC estimation but also significantly enhances its accuracy and real-time performance. This method can take protective measures against overcharging, overdischarging, and other phenomena more quickly and accurately, which is crucial for improving BMS security.
(3)
By building an experimental platform, the feasibility of the proposed method is verified under FUDS (−10 °C to 45 °C, 80% battery level) and DST (−10 °C to 45 °C, 80% battery level) operating conditions. The experimental results show that the method proposed in this paper improves estimation accuracy by 16.28% and 28.2%, respectively, while achieving comparable estimation efficiency to the improved GRU-based transfer learning method.

Author Contributions

Conceptualization, H.Z. and Y.X.; methodology, H.Z.; software, H.Z.; validation, H.Z., Q.H. and Y.L.; formal analysis, Y.W.; investigation, D.W.; resources, Y.X.; data curation, Q.H.; writing—original draft preparation, H.Z.; writing—review and editing, Y.X.; visualization, Y.L.; supervision, Y.X.; project administration, H.Z. and Y.X.; funding acquisition, Y.X. All authors have read and agreed to the published version of the manuscript.

Funding

This research was funded by the Sichuan Science and Technology Program (2022NSFSC1912).

Data Availability Statement

The data presented in this study are available on request from the corresponding author due to the confidentiality period of the project.

Conflicts of Interest

The authors declare no conflicts of interest.

References

  1. Lai, X.; Yuan, M.; Tang, X.; Yao, Y.; Weng, J.; Gao, F.; Ma, W.; Zheng, Y. Co-Estimation of State-of-Charge and State-of-Health for Lithium-Ion Batteries Considering Temperature and Ageing. Energies 2022, 15, 7416. [Google Scholar] [CrossRef]
  2. Liang, J.; Wu, T.; Wang, Z.; Yu, Y.; Hu, L.; Li, H.; Zhang, X.; Zhu, X.; Zhao, Y. Accelerating perovskite materials discovery and correlated energy applications through artificial intelligence. Energy Mater. 2022, 2, 200016. [Google Scholar] [CrossRef]
  3. Guo, F.; Wu, X.; Liu, L.; Ye, J.; Wang, T.; Fu, L.; Wu, Y. Prediction of remaining useful life and state of health of lithium batteries based on time series feature and Savitzky-Golay filter combined with gated recurrent unit neural network. Energy 2023, 270, 126880. [Google Scholar] [CrossRef]
  4. Fang, X.; Xu, M.; Fan, Y. SOC-SOH Estimation and Balance Control Based on Event-Triggered Distributed Optimal Kalman Consensus Filter. Energies 2024, 17, 639. [Google Scholar] [CrossRef]
  5. Hannan, M.A.; Lipu, M.S.H.; Hussain, A.; Mohamed, A. A review of lithium-ion battery state of charge estimation and management system in electric vehicle applications: Challenges and recommendations. Renew. Sustain. Energy Rev. 2017, 78, 834–854. [Google Scholar] [CrossRef]
  6. Sang, B.; Wu, Z.; Yang, B.; Wei, J.; Wan, Y. Joint Estimation of SOC and SOH for Lithium-Ion Batteries Based on Dual Adaptive Central Difference H-Infinity Filter. Energies 2024, 17, 1640. [Google Scholar] [CrossRef]
  7. Sangeetha, E.P.; Subashini, N.; Santhosh, T.K.; Lindiya, S.A.; Uma, D. Validation of EKF based SoC estimation using vehicle dynamic modelling for range prediction. Electr. Power Syst. Res. 2024, 226, 109905. [Google Scholar]
  8. Shi, N.; Chen, Z.; Niu, M.; He, Z.; Wang, Y.; Cui, J. State-of-charge estimation for the lithium-ion battery based on adaptive extended Kalman filter using improved parameter identification. J. Energy Storage 2022, 45, 103518. [Google Scholar] [CrossRef]
  9. Sun, H.; Pan, T.; Wu, D. Weighted Online Estimation of SOC Based on Adaptive Battery Model. J. Syst. Simul. 2017, 29, 1677–1684. [Google Scholar]
  10. Daowd, M.; Omar, N.; Van Mierlo, J.; Van Den Bossche, P. An Extended PNGV Battery Model for Electric and Hybrid Vehicles. Int. Rev. Electr. Eng.-IREE 2011, 6, 1692–1706. [Google Scholar]
  11. Kalikmanov, V.I.; Koudriachova, M.V.; de Leeuw, S.W. Lattice-gas model for intercalation compounds. Solid State Ion. 2000, 136, 1373–1378. [Google Scholar] [CrossRef]
  12. Wu, S.; Pan, W.; Zhu, M. A Collaborative Estimation Scheme for Lithium-Ion Battery State of Charge and State of Health Based on Electrochemical Model. J. Electrochem. Soc. 2022, 169, 090516. [Google Scholar] [CrossRef]
  13. Xing, Y.; He, W.; Pecht, M.; Tsui, K.L. State of charge estimation of lithium-ion batteries using the open-circuit voltage at various ambient temperatures. Appl. Energy 2014, 113, 106–115. [Google Scholar] [CrossRef]
  14. Chen, L.; Zeng, X.; Xia, X.; Sun, Y.; Yue, J. A modeling and state of charge estimation approach to lithium-ion batteries based on the state-dependent autoregressive model with exogenous inputs. Energy 2024, 300, 131626. [Google Scholar] [CrossRef]
  15. Yun, X.; Zhang, X.; Wang, C.; Fan, X. Online parameters identification and state of charge estimation for lithium-ion batteries based on improved central difference particle filter. J. Energy Storage 2023, 70, 107987. [Google Scholar] [CrossRef]
  16. Chen, J.; Zhang, Y.; Wu, J.; Cheng, W.; Zhu, Q. SOC estimation for lithium-ion battery using the LSTM-RNN with extended input and constrained output. Energy 2023, 262, 125375. [Google Scholar] [CrossRef]
  17. Ahmed, R.; El Sayed, M.; Arasaratnam, I.; Tjong, J.; Habibi, S. Reduced-Order Electrochemical Model Parameters Identification and State of Charge Estimation for Healthy and Aged Li-Ion Batteries-Part II: Aged Battery Model and State of Charge Estimation. IEEE J. Emerg. Sel. Top. Power Electron. 2014, 2, 678–690. [Google Scholar] [CrossRef]
  18. Zhang, G.; Xia, B.; Wang, J.; Ye, B.; Chen, Y.; Yu, Z.; Li, Y. Intelligent state of charge estimation of battery pack based on particle swarm optimization algorithm improved radical basis function neural network. J. Energy Storage 2022, 50, 104211. [Google Scholar] [CrossRef]
  19. Salazar, D.; Garcia, M. Estimation and Comparison of SOC in Batteries Used in Electromobility Using the Thevenin Model and Coulomb Ampere Counting. Energies 2022, 15, 7204. [Google Scholar] [CrossRef]
  20. Zhang, R.; Xia, B.; Li, B.; Cao, L.; Lai, Y.; Zheng, W.; Wang, H.; Wang, W. State of the Art of Lithium-Ion Battery SOC Estimation for Electrical Vehicles. Energies 2018, 11, 1820. [Google Scholar] [CrossRef]
  21. Xie, S.; Xiong, R.; Zhang, Y.; He, H. The Estimation of State of Charge for Power Battery Packs used in Hybrid Electric Vehicle. In Proceedings of the 8th International Conference on Applied Energy (ICAE), Beijing, China, 8–11 October 2017; pp. 2678–2683. [Google Scholar]
  22. Wang, J.; Jia, Y.; Yang, N.; Lu, Y.; Shi, M.; Ren, X.; Lu, D. Precise equivalent circuit model for Li-ion battery by experimental improvement and parameter optimization. J. Energy Storage 2022, 52, 104980. [Google Scholar] [CrossRef]
  23. Charkhgard, M.; Farrokhi, M. State-of-Charge Estimation for Lithium-Ion Batteries Using Neural Networks and EKF. IEEE Trans. Ind. Electron. 2010, 57, 4178–4187. [Google Scholar] [CrossRef]
  24. Zhao, L.; Liu, Z.; Ji, G. Lithium-ion battery state of charge estimation with model parameters adaptation using H, extended Kalman filter. Control Eng. Pract. 2018, 81, 114–128. [Google Scholar] [CrossRef]
  25. Wu, S.; Zhang, S.; Li, H.; Cao, G.; Hu, Z.; Yu, Y.; Zhang, X. A totally coupled multi time-scale framework containing full parameters online identification and SOC real-time estimation of lithium-ion battery based on a fractional order model. J. Energy Storage 2023, 73, 109012. [Google Scholar] [CrossRef]
  26. Wang, Y.-X.; Chen, Z.; Zhang, W. Lithium-ion battery state-of-charge estimation for small target sample sets using the improved GRU-based transfer learning. Energy 2022, 244, 123178. [Google Scholar] [CrossRef]
  27. C. B. R. Group. CALCE Center for Advanced Life Cycle Engineering Lithium-Ion Battery Experimental Data [Online]. 2017. Available online: https://calce.umd.edu/battery-data (accessed on 11 May 2024).
  28. Zhao, X.; Sun, B.; Zhang, W.; He, X.; Ma, S.; Zhang, J.; Liu, X. Error theory study on EKF-based SOC and effective error estimation strategy for Li-ion batteries. Appl. Energy 2024, 353, 121992. [Google Scholar] [CrossRef]
Figure 1. Proposed SoC Estimation Process for Li-ion batteries in EV.
Energies 17 04397 g001
Figure 2. HPPC test platform.
Energies 17 04397 g002
Figure 3. OCV-SoC-T relationship curve: (a) Relationship curve under discharge state; (b) Relationship curve under charging state.
Energies 17 04397 g003
Figure 4. Second-order RC equivalent circuit model.
Energies 17 04397 g004
Figure 5. Optimized model.
Energies 17 04397 g005
Figure 6. Battery voltage response curve.
Energies 17 04397 g006
Figure 7. Offline identification results of improved model under discharge state: (a) fitting error; (b) R0; (c) R1; (d) R2; (e) C1; (f) C2.
Energies 17 04397 g007
Figure 8. Offline identification results of improved model under charge state: (a) fitting error; (b) R0; (c) R1; (d) R2; (e) C1; (f) C2.
Energies 17 04397 g008
Figure 9. FFRLS schematic diagram.
Energies 17 04397 g009
Figure 10. Online identification results of improved model under discharge state: (a) fitting error; (b) R0; (c) R1; (d) R2; (e) C1; (f) C2.
Energies 17 04397 g010
Figure 11. Online identification results of improved model under charge state: (a) fitting error; (b) R0; (c) R1; (d) R2; (e) C1; (f) C2.
Energies 17 04397 g011
Figure 12. Online + offline identification results of improved model under discharge state: (a) fitting error; (b) R0; (c) R1; (d) R2; (e) C1; (f) C2.
Energies 17 04397 g012
Figure 13. Online + offline identification results of improved model under charge state: (a) fitting error; (b) R0; (c) R1; (d) R2; (e) C1; (f) C2.
Energies 17 04397 g013
Figure 14. EKF process diagram.
Energies 17 04397 g014
Figure 15. SoC simulation estimation results under FUDS (25 °C, 80% battery level): (a) SoC estimation results; (b) SoC estimation errors; (c) Local magnification of SoC estimation results; (d) MSE and NMSE of SoC estimation results; (e) MAE and RMSE of SoC estimation results.
Energies 17 04397 g015
Figure 16. SoC simulation estimation results under DST (25 °C, 80% battery level): (a) SoC estimation results; (b) SoC estimation errors; (c) Local magnification of SoC estimation results; (d) MSE and NMSE of SoC estimation results; (e) MAE and RMSE of SoC estimation results.
Energies 17 04397 g016
Figure 17. Experimental platform.
Energies 17 04397 g017
Figure 18. SoC experimental estimation results under FUDS (−10–45 °C, 80% battery level): (a) SoC estimation results; (b) SoC estimation errors; (c) Local magnification of SoC estimation results; (d) MSE and NMSE of SoC estimation results; (e) MAE and RMSE of SoC estimation results.
Energies 17 04397 g018
Figure 19. SoC experimental estimation results under DST (−10–45 °C, 80% battery level): (a) SoC estimation results; (b) SoC estimation errors; (c) Local magnification of SoC estimation results; (d) MSE and NMSE of SoC estimation results; (e) MAE and RMSE of SoC estimation results.
Energies 17 04397 g019
Table 1. Key parameter of battery.
TypeParameterValue
Panasonic
NCR18650B
Rated capacity of battery2500 mAh
Normal voltage3.6 V
Max/Min voltageVmin: 2.8 V/Vmax: 4.2 V
Table 2. Pulse charge and discharge experiment [22].
StepProcedure
1After sufficient resting, discharge the battery at 1 C until the discharge cutoff voltage is reached.
2Rest for 2 h, then charge the battery with constant current and voltage to SoC = 100%. Set the charging current to 1 C, the charging voltage to 4.2 V, and the cutoff condition to a current of 0.05 C.
3Rest for 12 h to activate the battery, then measure and record the terminal voltage.
4Discharge at a constant current of 1 C for 6 min and rest for 1 h.
5After 10 cycles in step 4, let the battery rest for 2 h.
6Charge at a constant current of 1 C for 6 min and rest for 1 h.
7After 10 cycles in step 6, let the battery rest for 2 h.
Table 3. Comparison of simulation results of A, B, C, D under FUSD (25 °C, 80% battery level) and DST (25 °C, 80% battery level).
MethodFUDS (25 °C, 80% Battery Level)DST (25 °C, 80% Battery Level)
MAE (%)RMSE (%)MAX (%)MAE (%)RMSE (%)MAX (%)
A0.41660.48114.10890.390.454.7506
B0.50840.5875.01400.50.585.9928
C0.5330.6475.52720.630.656.6621
D0.971.1269.61090.981.1311.1377
Table 4. Comparison of experimental results of A, B, C, D under FUSD (−10–45 °C, 80% battery level) and DST (−10–45 °C, 80% battery level).
MethodFUDS (25 °C, 80% Battery Level)DST (25 °C, 80% Battery Level)
MAE (%)RMSE (%)MAX (%)Time * (ms)MAE (%)RMSE (%)MAX (%)Time * (ms)
A0.41660.48114.108991.270.390.454.7506107.68
B0.50840.5875.014094.290.50.585.9928103.65
C0.5330.6475.527253.50.630.656.662159.85
D0.971.1269.6109247.680.981.1311.1377214.38
* The time in Table 4 is the time taken by the MCU to calculate the SoC estimation result once.
Disclaimer/Publisher’s Note: The statements, opinions and data contained in all publications are solely those of the individual author(s) and contributor(s) and not of MDPI and/or the editor(s). MDPI and/or the editor(s) disclaim responsibility for any injury to people or property resulting from any ideas, methods, instructions or products referred to in the content.

