Article

Economic Analysis and Design of Sustainable Solar Electric Vehicle Carport at Applied Science Private University in Jordan

by
Emad Awada
1,*,
Eyad Radwan
2,
Suzan Abed
3 and
Akram Al-Mahrouk
4
1
Department of Electrical Engineering, Faculty of Engineering Technology, Al-Balqa Applied University, Amman 11134, Jordan
2
Department of Electrical Engineering, Faculty of Engineering and Technology, Applied Science Private University, Amman 11931, Jordan
3
School of Business and Public Administration, University of the District of Columbia, Washington, DC 20008, USA
4
Department of Electrical Engineering, Philadelphia University, Jerash 19392, Jordan
*
Author to whom correspondence should be addressed.
Energies 2024, 17(17), 4321; https://doi.org/10.3390/en17174321
Submission received: 24 June 2024 / Revised: 22 August 2024 / Accepted: 26 August 2024 / Published: 29 August 2024
(This article belongs to the Special Issue Towards a Sustainable Future: Recent Research in Renewable Energies)

Abstract

:
Electrical vehicles are finding wide acceptance in the Jordanian transportation market; this has caused an accelerating shift in the emissions of greenhouse gases from the direct burning of fossil fuels consumed by the transportation sector towards the power generation sector. On the other hand, as electric vehicles gain more popularity, an extra load is added to the electrical power generation systems, raising essential concerns such as the capability of the power network to support this massive extra load and the increased emission of greenhouse gases caused by power plants. Studies show that Jordan’s weather is known for being bright, sunny, and very suitable for the generation of electric power from solar energy sources. Therefore, with an infrastructure that can support convenient off-grid charging, a huge burden will be taken off the national grid and the environment. Therefore, this work proposes a basic design for an off-grid PV-covered carport and presents a study of the economics and effectiveness of using such a system to charge electric vehicles owned by the students and employees of the Applied Science Private University. The study is based on actual solar irradiance data collected on-site during university working hours (8 a.m.–5 p.m.) to allow students and employees to charge their electric vehicles from an off-grid carport system while on campus. Space limitations for carport design, initial design cost, return on investment, and annual electricity consumption are discussed to demonstrate the benefits of such a system for both the consumer (convenience and low charging cost) and the power company provider (less load to maintain).

1. Introduction

In the last decade, rapid population growth, economic growth, and political conflicts among countries have triggered higher energy demands worldwide [1,2]. As the energy sector plays a crucial role in many sectors [3,4], the International Energy Agency (IEA) outlines energy security as the availability of resources at a reasonable price [5]. On a large scale, energy prices and security have directly and indirectly aggravated all essential and nonessential aspects of human life globally, yet the seriousness of this situation may escalate into diverse critical difficulties from one country to another. For instance, Jordan is a country located in the heart of the conflict region in the Middle East; with refugees fleeing the surrounding countries such as Syria and Iraq, the population has reached approximately 11,642,859 [6] at a growth rate of 3.6% [7]. As a result, the Jordanian government has a serious problem with energy security as demands continue to increase. To make matters worse, Jordan depends completely on fossil fuels, while its resources for conventional fuels such as crude oil, coal, and natural gas are very limited. According to [7,8] and the Ministry of Energy and Mineral Resources, 94% of Jordan’s energy resources are imported from surrounding countries (such as Saudi Arabia and Iraq) and are expected to increase quickly in the near future [8]. In 2022, the Jordanian Ministry of Energy and Mineral Resources released an annual report to highlight the major energy-consuming sectors. As shown in Figure 1, transportation has occupied the first place in energy consumption, with a total of 49% of consumed energy [9]. Yet, this percentage is expected to increase even faster due to population growth and the increased dependency of many sectors on transportation, resulting in a catastrophic impact on the environment [10,11].
The economics and security of the energy sector in Jordan depend highly on imported energy since 96% of Jordan’s electricity is produced by imported fossil fuels through a significant gas feeder line between Egypt and Jordan called the Arab Gas Pipeline. Unfortunately, due to conflicts and political disturbances in the surrounding area, many incidents and attacks on the feeder line occurred between 2011 and 2014. As a result, these attacks distressed the Jordanian energy sector and other related sectors, as the Arab Gas Pipeline went out of commission and Jordan had to rely on other sources, such as diesel and heavy oil, to produce electricity at an additional cost of JOD 4 billion in 2012.
In the Jordan Energy Strategy Report 2020–2030, released by the Ministry of Energy and Mineral Resources [9], Jordan’s energy resources of imported oil, natural gas, and coal formed 81% of total energy, while renewable energy sources such as photovoltaic farms and windmills formed 11%, as illustrated in Figure 2. However, as the strategy plans to move along with the global target of 4500 GW of photovoltaic power generation in 2050 [12], Jordan’s dependency on fossil fuels is predicted to drop by 37% in 2035 [5] as it will be replaced by alternative renewable sources.
Environmentally, fossil fuels contribute to a very high level of greenhouse gas (GHG) emissions. With a total global emission of 53,786.4 Mtons CO2eq, Jordan produced 34.54 Mtons CO2eq, or 0.06% of total CO2eq worldwide, in 2022 [13]. Yet, as in [14], the amount of GHG emissions is projected to increase by 43.98 Mtons CO2eq in 2030. Therefore, the urgent need to find alternative energy resources has been prompted by a growing awareness among Jordanians, especially with the availability of sustainable renewable energy platforms. As a result, combining the new technology of Electric Vehicles (EVs) and renewable energy in remote and metropolitan areas has been an excellent solution that will contribute to the reduction in greenhouse gas emissions, improve energy sustainability, and strengthen economics with the rapid rise of fuel prices [15,16].
As EV popularity has risen and is anticipated to occupy 30% of the vehicle market globally in 2040 [17,18], Jordan has shown a particular interest in EVs to replace conventional internal combustion engine vehicles. However, charging EVs is still a substantial concern to many EV owners or potential owners due to its effects on electricity consumption for a household if charged at home. The unit price for electricity is still high at peak hours, and a higher accumulated number of kWh per month is used to charge extra, as the Jordan Electrical Tariff applies [19]. Therefore, in this work, a study was performed to investigate the ability to charge EVs through a solar energy-powered carport, as shown in Figure 3, based on actual real-time solar data collected at Applied Science Private University (ASU). The carport covered with PV panels is proposed as a power source to charge EVs while students and employees are on campus to reduce dependency on fossil fuels, provide shaded parking spaces, and generate revenue based on renewable energy.
Many studies have investigated the effect of EV charging on networks in terms of voltage stability [20], distribution peak load [21], and network harmonics effects [22]. Meanwhile, others proposed carports as an effective solution for charging electric vehicles off the power network. In [23,24], EV carport charging was discussed in terms of large spaces such as shopping centers and football stadiums, with a focus on rooftop design to produce high power in Europe and the US [24]. EV carport studies were also performed based on Brazilian claimants and power regulations in Poland, respectively, in [25,26]. In [27], a study was performed in the US based on charging a storage battery system as the main feeder to EV charging systems. An EV carport was investigated based on stochastic optimization in [28]. The work was based on dividing EVs into three groups and creating a model schedule for charging procedures. In [29], a simulation study was performed in Turkey to test a cluster of charging–discharging EV schemes. The study was based on a PV battery system with power grid integration. The study has shown a reduction in daily power demand of 64.24% for conventional stations. Meanwhile, in St. John’s, Canada, a study was based on an off-grid carport for 20 EVs [30]. With an average of 3.15 kWh/m2/day, around 34 strings with 10 PV panels in each string rated at 340 W were used to provide 115.8 kW. With this aspect of low irradiation, a study was performed in the Netherlands to explore the feasibility of PV carport EV charging [31]. However, based on the low solar irradiation in that region, PV panels were enlarged by 30% to meet the converter power rating. On the other hand, with high solar irradiation, King Abdulaziz University, Saudi Arabia, performed a study modifying a covered canopy parking lot with PV solar panels [32]. With the ability to generate around 66 GWh annually and an export tariff of USD 0.045/kWh, a 50% return on investment will be achieved in 25 years. Staying in the same region, the University of Ras Al Khaimah, UAE, proposed five parking spots for a carport-on-grid system study [33]. With an initial cost of USD 25,000, the return on investment was estimated at 13 years. Yet, for Saudi Arabia and the UAE, as oil-producing countries, the cost of fossil fuel is very low, which makes gas-combustion vehicles more popular.
In this work, a complete technical and economic model based on Jordan’s special characteristics is proposed for charging EVs using an off-grid carport. The model is based on energy distribution, renewable energy availability, cost of living, energy price, future transportation, and current and future electrical power scenarios. No previous work has been performed before to cover these constraints in Jordan with a clear view of the energy and transportation future in Jordan. It is projected that the proposed work will demonstrate effectiveness at the country level if the idea for this project is extended to other university campuses and government buildings.

2. Electrical Vehicles

Initially, EVs were invented in 1830–1840, before internal combustion engine vehicles. However, due to their low speed and unreliability [18], the production of EVs stopped until the technology advanced. As car makers have come a long way in car development, EVs continue to demonstrate steady progress and improved reliability. In [34], statistical data on EV sales worldwide were presented, with passenger vehicles alone achieving 9% of overall passenger vehicle sales, and EV sales of all sizes reaching 24% of all types of cars in 2021, as shown in Figure 4.
Meanwhile, for the year 2040, a significant increase in passenger EVs is anticipated to make up to 75% of global sales, as presented in Figure 5.
As a result, due to the EV’s high energy-efficient performance, low noise, and zero emissions [17,19], it is projected that a significant financial investment will be needed to develop infrastructure for charging stations to accommodate the growing number of EVs.

3. Jordan’s Electrical Energy System

With a total generated electrical power of 19,755 GWh in 2018, Jordan’s power generation is based on conventional plants supported by 132 kV and 400 kV transmission lines tied to Syria and 230 kV/400 kV transmission lines linked with Egypt [19,35] as the main feeders. Furthermore, Jordan’s largest distress is the old distribution system which desperately needs upgrades and improvements to decrease faults and raise capacity to accommodate the growing loads [36]. Meanwhile, as the number of EVs rises, an additional unequally distributed load brings extensive challenges to grid forecasting, operation, excess load, voltage sag, power loss, and undependable power supply [37]. Based on the historically available data provided by the Jordanian Ministry of Energy and Mineral Resources [9], electrical generation between 2014 and 2018 increased from 18,704 GWh to 19,755 GWh.
Meanwhile, as in [36], due to the lack of public EVs charging in Jordan, EV owners depend on their residential power supply for convenience and accessibility, especially at night. As a result, domestic power consumption has revealed an increase accounting for 45.5% of the total electrical consumption ratio for 2018, as shown in Table 1.

4. Renewable Energy in Jordan

Despite the geographical location of Jordan in the heart of a region rich with natural gas and crude oil, such as in Saudi Arabia and Iraq [13,38], Jordan has always suffered from a lack of oil and gas resources. Jordan has always depended on neighboring countries to import and secure its essential demands for energy. Jordan’s population has reached around 11,642,859 based on the latest Jordanian Department of Statistics [6] and is rapidly rising due to internal and external effects of refugees from the surrounding unstable countries. As a result, Jordan is becoming more vulnerable to the danger of a future gas crisis as price increases and greenhouse gas emissions grow [7,11]. Yet, Jordan has a unique location regarding the sun-belt states for solar irradiation and hot climate, as presented in Figure 6 for Global Horizontal Irradiation in Jordan.
Jordan is considered one of the blessed countries with substantial potential for renewable energy generation [39]. As a result, many solar photovoltaic (PV) projects have been established in public, private, and residential establishments. However, the Applied Science Private University (ASU) was one of the first private institutions in Jordan to generate electricity from PV cells from a system with a capacity of 500 kW covering around 30% of its energy demands. Meanwhile, as part of the continuous development at ASU, this research will investigate the feasibility of an EV carport system based on an off-grid, pure solar energy system.

5. Methodology and Design

When introducing solar PV for private, commercial, and agricultural operations, it is essential to determine the site’s merits for solar radiation [23]. This involves identifying the ideal place and position for the panels, subject to the highest amount of sun-received energy per unit area (irradiation). As a result, in this project, it was very critical to study the university parking lots in terms of:
  • Shading and obstacles: Shading and light obstacles can be a critical concern for solar panels since they reduce the amount of power produced. The most frequent shading causes are sounding building structures, trees, and weather issues. However, in this work analysis, the university parking lot has the advantage of a clear open area, as presented in Figure 7.
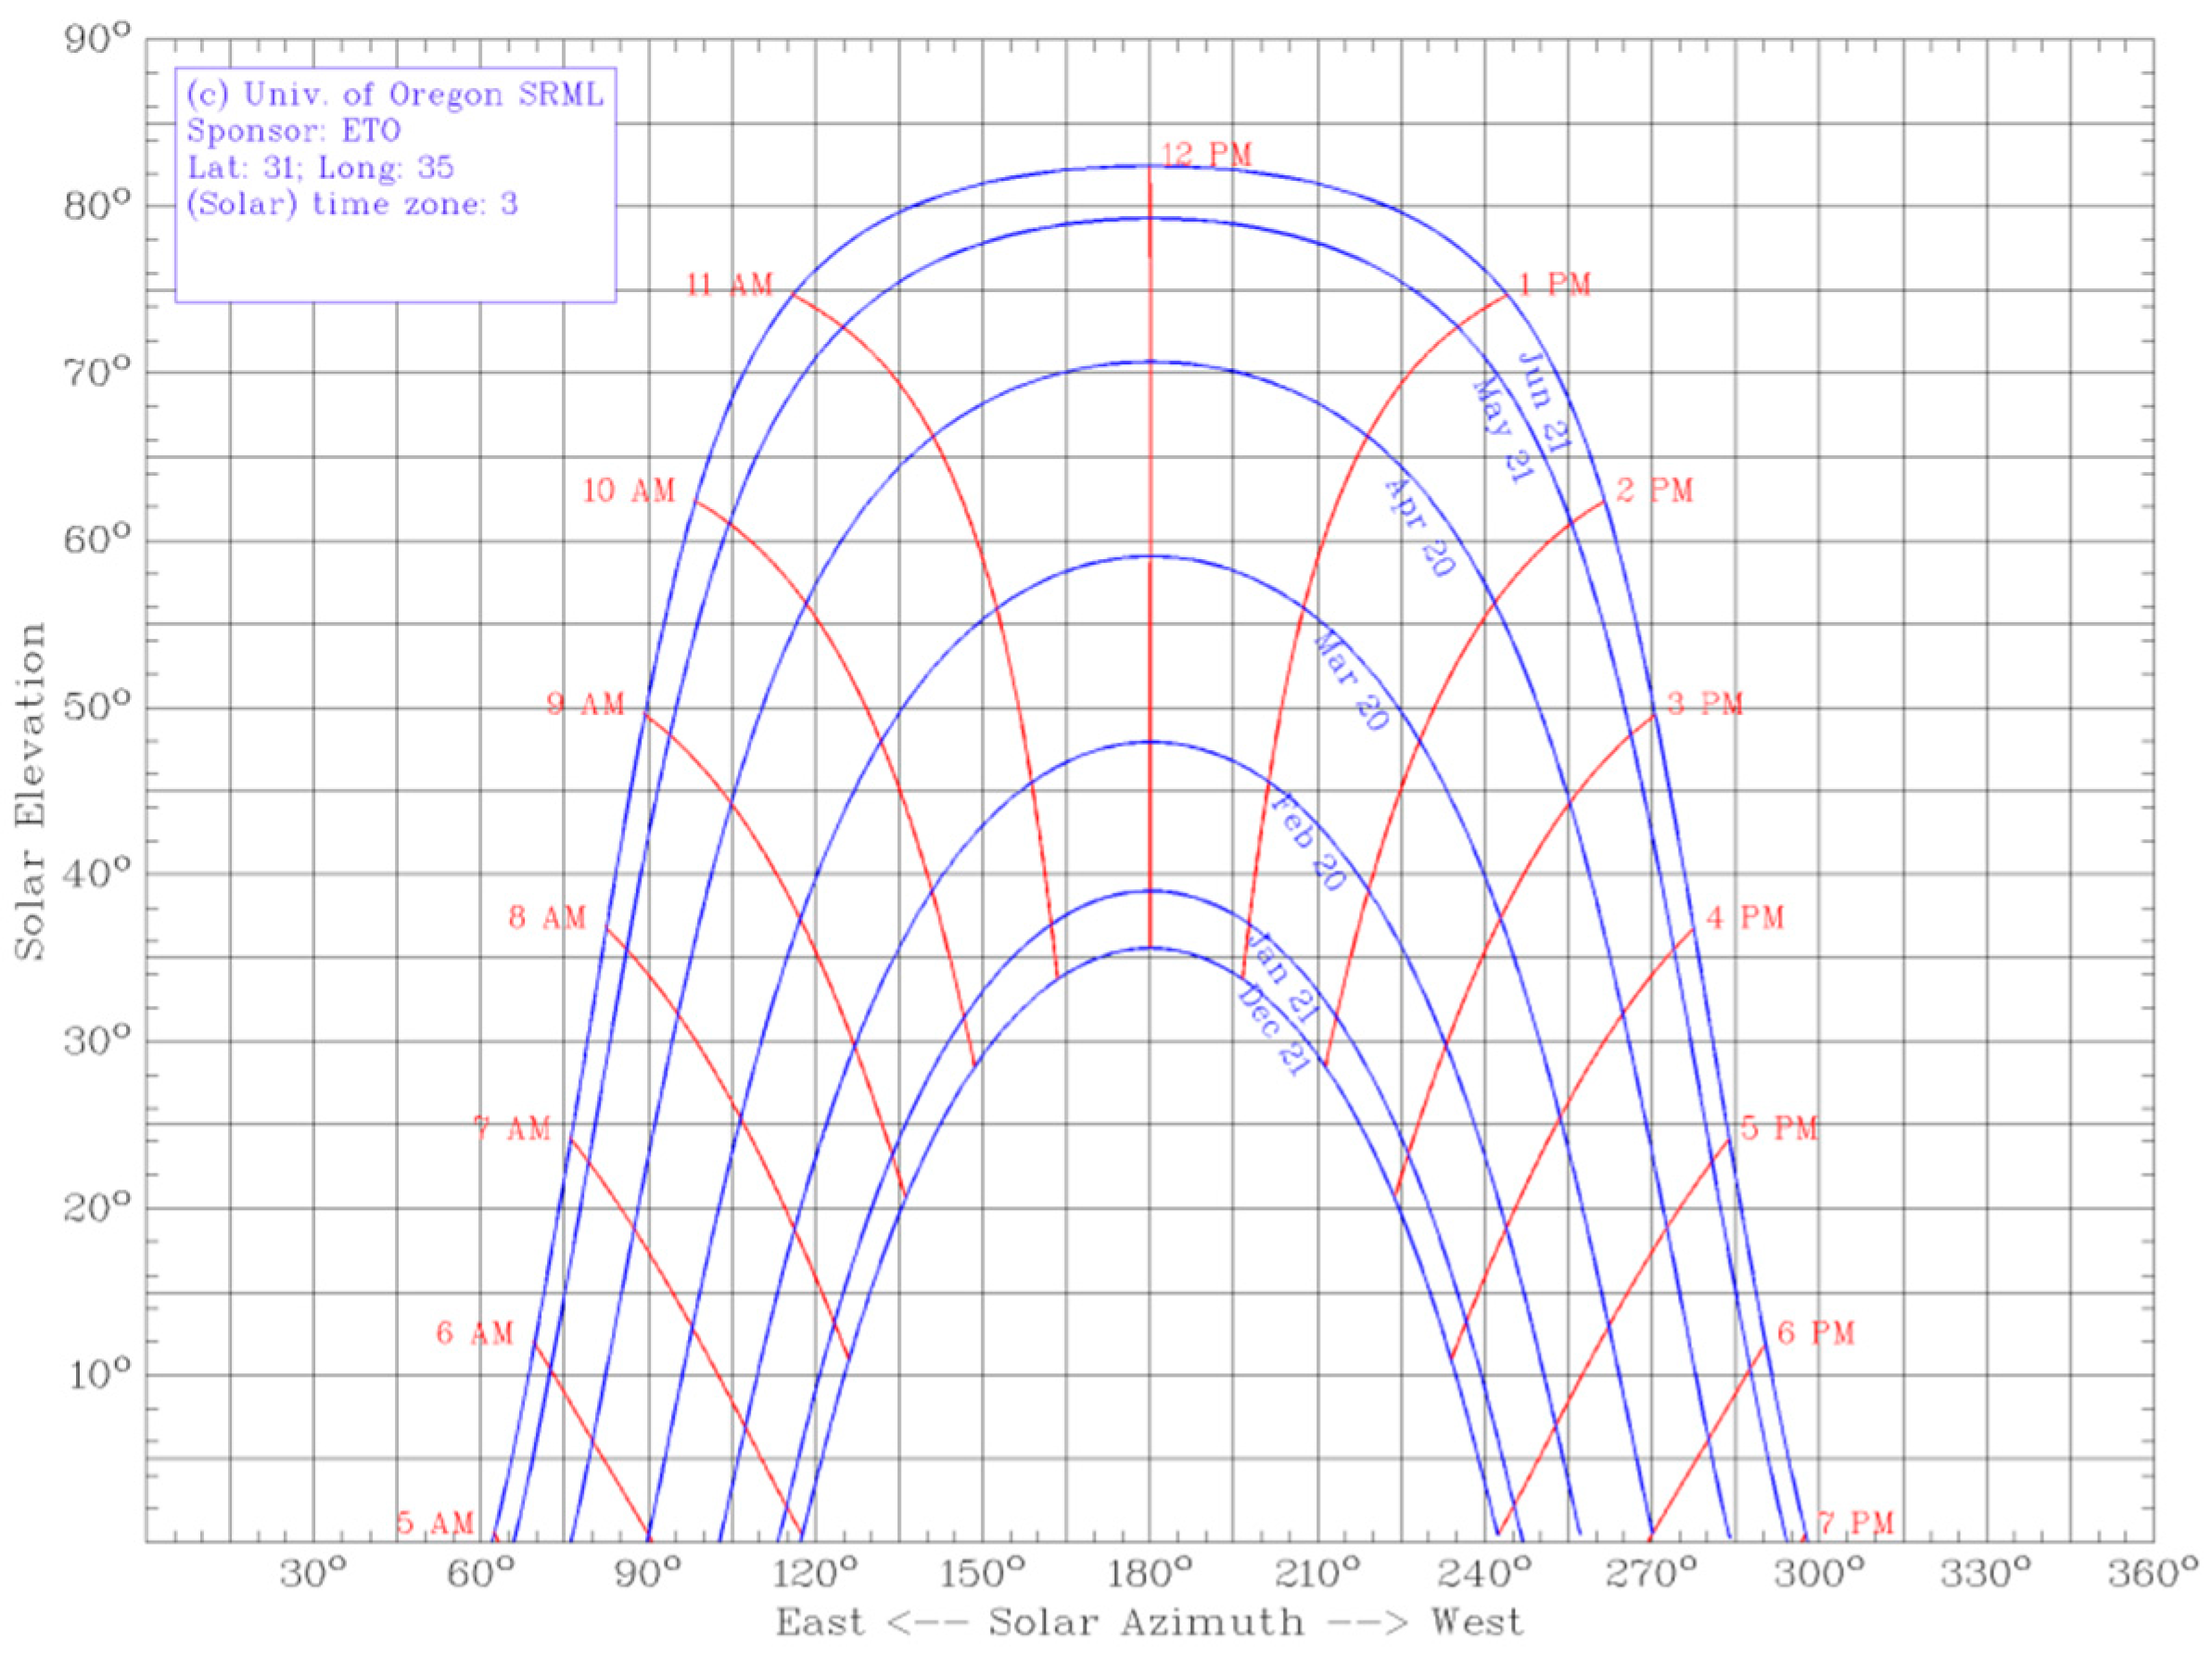
  • Irradiation rate and time window: Provides information on the sun’s direction throughout the year, as well as the amount of sunshine collected at the university site, as shown in Figure 8.
Figure 8 shows the sun path charts for ASU produced by the Solar Radiation Monitoring Laboratory (SRML) sponsored by the Energy Trust of Oregon (ETO). The vertical axis of Figure 8 shows the solar elevation (the sun’s angular height above the observer’s celestial horizon), while the horizontal axis shows the Solar Azimuth (an azimuth is the horizontal angle from a cardinal direction, most commonly north). These data were critical to determine the radiance needed to produce the necessary output watts throughout the year to handle a variable load during the day, as proposed in the charging method section.
The term off-grid describes a system not connected to the primary electrical grid. This can include solar power systems (off-grid PV), which can generate power and run applications independently, as presented in Figure 9. These plans usually suit rural areas with little or no grid access. Off-grid electrification is viable in remote areas where there is no grid access. The simple schematic of the proposed off-grid system, as shown in Figure 9, shows the solar panels with a DC-DC converter that will convert the panel’s output to be suitable for two purposes: (a) charging a storage battery or (b) feeding an inverter that will supply an EV charger.
However, in this study, the off-grid system was proposed due to the specific application of PVs to charge EVs during working hours while the vehicles are not in use. On the other hand, when the carport is not in use, a deep-cycle battery will be charged to store energy to supplement the EV charging demands during shady or nighttime charging requirements. To fulfill the EV charging requirements, the DC-DC converter is required to operate in three modes: (a) boost mode, where the PV system charges the EV directly, (b) buck mode, where the PV system charges the storage battery, and (c) boost mode where the storage battery is discharged to supply the EV. The layout of the proposed DC-DC converter is presented in Figure 10. In Figure 10, S1 to S5 represent the power switching devices, L1 and L2 are filter inductances, C is the filter capacitor, D1 and D2 are freewheeling diodes and reverse current blocking diodes, respectively, and Vs and VB are the PV source and the storage batteries, respectively.
Table 2 shows the switching states for each of the power devices that correspond with the mode of operation. Deep-cycle batteries are generally used in solar PV systems due to their unique charging and discharging characteristics [41]. These batteries can be characterized (in addition to their ability to be recharged) by their high power density, high discharge rate, flat discharge curves, and good low-temperature performance. By repeatedly charging and discharging to a low level of charge, as much as 80% of their total capacity (100% to 20% state of charge), deep-cycle batteries maintain charging without sustaining severe damage to their cells.
As the battery stores and releases energy for many days, taking into consideration not going over the maximum depth of discharge (DODmax), the minimum battery required capacity can be determined as in (1):
Q = E × A V × T × η i n v × η c a b l e
where:
  • Q = minimum battery capacity required in Ampere Hours, Ah;
  • E = daily energy requirement in Watt Hours, Wh;
  • A = number of days of storage required;
  • V = system D.C. voltage, V;
  • T = maximum allowed DOD of the battery (indicatively 0.3–0.9);
  • η i n v   = inverter efficiency (1.0 if there is no inverter);
  • η c a b l e   = efficiency of the cables delivering the power from the battery to loads.
To investigate the ability for solar energy generation, the area level of solar irradiance is one of the essential characteristics in designing PV-powered systems [42,43]. Therefore, to evaluate this research work, the ASU campus was selected to obtain monthly radiation measurements through the energy center located on the campus. Measures taken from January to December 2020 at the test field station at ASU showed an average daily solar irradiance recorded with the lowest value of approximately 2.5 kWh for December and a maximum of roughly 6.5 kWh for June, as presented in Figure 11.
This design study uses the following constraints to analyze the ASU sustainable car-parking system for EVs. As the university operates from 8.00 a.m. to 5.00 p.m., the PV-powered carport system is designed to provide sufficient charging of 5 kWh of daily energy requirements. This energy is estimated to be consumed for a minimum driving range between 25 and 30 km based on the average energy consumption of EVs [42]. Yet, based on the size of Amman city, this distance is sufficient for commuting between the university and most areas in Amman. In addition, as this system is based on off-grid production, a deep-cycle battery will be used to support charging during cloudy days with low levels of solar irradiance. The solar panel peak wattage can be determined as in (2) to size the stand-alone carport PV system.
W p v = E P S H × η s y s
where:
  • W p v   = peak wattage of the array, kWp;
  • E = daily energy requirement, kWh;
  • PSHs: the average daily number of Peak Sun Hours in the design month for the inclination and orientation of the PV array;
  • η s y s   = total system efficiency.
The sizing of the peak wattage of the PV array is determined based on the assumed overall system efficiency ( η s y s ) of 70% and daily energy requirements (E) of 5 kWh, as in Table 3.
Table 3 shows that December has the lowest PSHs and thus it requires the largest size of solar panels (largest Wpv of 2.8 kWp) to produce the required energy of 5 kWh for the 25–30 km drive. A monocrystalline PV cell was considered for the design of the PV array. Such PV cells require 2.5 m2 to produce 540 W. Hence, a total of approximately 6 panels ( 2.8   k w p / 540 ) will be required to cover an area of 15 m2 (2.5 m2 × 6 = 15 m2) for a maximum size for a one-car parking lot. Thus the 6-panel system will be capable of producing 3.24 kWp, which exceeds the design requirements based on the lowest average daily solar radiation (2.8 kWp) during the operational period of the system.

6. Economic Analysis

This project looks at the feasibility of having an off-grid PV system that can charge EVs. This approach can also be used on a wider scale to support all commercial and public access as a revenue source with a lower overhead charge. According to the Energy and Minerals Regulatory Commission [44], the majority of households in single houses (58%) consume an average of 300 kWh of electricity per month, 35% of apartment households consume approximately 600 kWh of electricity per month, and the remaining 7% of villa households consume over 900 kWh per month. Therefore, based on the average household consumption per month, the additional amount of electricity consumed may increase in the range of 100 kWh (20 days × 5 kWh/day) to 125 kWh (25 days × 5 kWh/day) monthly, as a result of charging an EV for a daily drive of 25 to 30 km. According to Jordan’s Electrical Tariff Structure in Table 4, this increase will lead to transferring 58% of the consumers from the second to the third tier and 35% of the consumers from the fourth to the fifth tier. This increase in consumption would cost between JOD 13.6 (125 kWh × 0.109 JD/kWh) and JOD 21.1 (125 kWh × 0.169 JD/kWh) for 58% and 35% of the consumers, respectively.
In Jordan, a 5 kWp system together with a storage battery would cost approximately JOD 2500. It is also estimated that system maintenance may cost an additional JOD 100/annum. As in (3), if it is projected that the recuperation period is 10 years, then to achieve a break-even for this investment over that period, the system must generate a daily income of:
2500   J D + 100   J D / a n n u m × 10   y e a r s 10   y e a r s × 12   m o n t h × 25   d a y s = 1.16   J D / d a y
However, in the summertime, the amount of power generated from the above system, 5 kWp, would be more than enough to charge two EVs since the system was designed based on the lowest average daily solar radiation, 2.8 kWp. Therefore, as in (4), if two EVs were charged per day, then each charged EV should pay for 1 kWh in the range of:
1.16   J D 2 × 5 k W h = 0.116   J D / k W h
The price of JOD 0.116 for 1 kWh falls well within the third and fifth tiers of the Jordan Electrical Tariff Structure, as shown in Table 4.

7. Research Methods

This section explains the research methodology used to test the proposed case to explore the future usage of EV carports as an alternative method of charging. A questionnaire survey was prepared to explore respondents’ views about the future of EV vehicles in Jordan. The questionnaire consists of 17 paragraphs. The questionnaire was distributed among students, staff, and faculty. The questionnaire was designed to gauge the level of future expectations for EVs and user expectations as well. In this case study, the questionnaire focused on areas such as commuting distance, charging preferences, and demographic data. An online questionnaire was distributed among students, staff, and faculty. The results have revealed that 234 questionnaires were returned, and 23 questionnaires were excluded from the analysis due to contradictory responses or missing data. As a result, a response rate of 90.2% was obtained for the questionnaire under study.

8. Questionnaire Data Analysis

In this section, a presentation of descriptive analysis and hypothesis testing for the research questioners is illustrated. That is, in Table 5, the demographic data of the final sample were analyzed, indicating that the majority of the respondents were male (n = 148, 70.1%). In addition, most of the respondents were less than 25 years old (n = 157, 74.7%). The largest proportion of the respondents listed themselves as holding a bachelor’s degree (n = 124, 58.8%). Additionally, Table 5 shows that most of the questionnaire respondents are students (n = 141, 66.8%) and the largest proportion of participants are single (n = 166, 78.7%). On the other hand, full-time employees (n = 63, 30%) and those who identified as seeking opportunities (n = 54, 25.6%) formed the majority of respondents.
Table 6 displays the monthly expenses for transportation of the final sample with 29.4% (n = 62) declaring spending between JOD 30 and 60 a month on transportation and 11% spending more than JOD 150. The majority of respondents, 61.6% (n = 130), used public transportation, whereas owning a car represented only 35.5% (n = 75). Table 6 also shows that almost 31.3% (n = 66) owned hybrid vehicles, whereas 23.7% (n = 50) owned EVs. Concerning the time required for participants to reach the university, data showed that 29.4% (n = 62) needed between 15 and 30 min to reach the university, whereas only 4.7% (n = 10) required 150 min or more to reach their universities. That is, almost 29% of the respondents live within 10 to 20 km of their universities.
Table 7 presents the respondents’ answers regarding the effect of the traveled distance on their academic achievements. While 54.5% (n = 115) of the respondents declared that the traveled distance did not affect their academic achievements, 38.9% (n = 82) indicated that distance had a major effect on their achievements. The data in Table 7 also showed that the distance from the respondent’s home to the university affected the choice of the university for 66.4% (n = 140) of the respondents.
In this questionnaire, the future preferences of vehicle purchase are presented in Table 8 to indicate the interest of the respondents in owning EVs for future considerations. The results showed that 46% (n = 97) preferred EVs, while 37% of the respondents favored hybrid vehicles for future considerations. This initially indicates that the questionnaire results support the earlier observation of the predicted future increase in the number of EVs on the road.
Furthermore, in terms of charging EVs while attending classes or during office hours, Table 9 shows the respondents’ perceptions of supporting or disagreeing with the proposed project. Results showed that 74% of the respondents supported the idea of charging their EVs while attending classes or working at the university.
In Table 10, environmental concerns were behind the support of 32.2% of the respondents for charging EVs while on campus compared to only 13.7% who favored convenience and time management. Both factors combined were also behind the choice of 45.5% of the respondents, indicating great awareness of the positive impact of EVs on the environment associated with concerns about time management due to the lengthy process of charging EVs. Additionally, the survey showed that making a financial benefit or gain was not a primary objective of the respondents since 49.7% were willing to pay the same or slightly above the grid tariff for charging their EVs using the proposed carport.
In Table 11, the results for one-sample t-tests to examine the main research questions are presented to show the findings of a parametric test. The results have revealed that, on average, distance from the resident’s home to the university affects their academic achievement, where the difference across groups is significant at the 5% level. As a result, Table 11 shows significant support for the idea of charging EVs while attending university classes. In addition, the difference in distance between homes and the university affects students’s registration considerably, by 5% for a semester.
The t-test and chi-square test were used since they are optimal methodologies for testing differences between two groups because they are tailored to handle specific types of data commonly encountered in research, ensuring clear, reliable, and interpretable results.
Table 12 presents the results of the one-sample chi-square test. The table reveals the results for the following items: monthly transportation expenses paid, type of transportation, time required to travel to university, distance from your residence to the university affects your academic achievement, the distance between your home and university affects your registration for the semester, and type of vehicle you intend to purchase in the future, and the idea of charging your vehicle while attending classes.
As a result, sufficient evidence was obtained to conclude that the observed distribution was not the same as the expected distribution. However, for the results of the question related to whether students own a car and what type of car they have, no difference between the observed distribution and the expected distribution was observed. That is, the results retain the null hypothesis.
The expected distribution is the theoretical or hypothesized distribution of data based on certain assumptions or prior information. It represents what the data distribution should look like if a particular hypothesis or model is true. It implies that, based on statistical analysis, the observed data do not match the hypothesized or expected distribution according to the theoretical model.
The null hypothesis for using a t-test is an indication of no significant difference between the means of the two groups being compared. The null hypothesis represents a position of no effect or no difference, which the t-test will test against an alternative hypothesis suggesting a significant effect or difference.

9. Results and Discussion

In this paper, the notion of carport off-grid renewable energy EV charging in Jordan was investigated. As discussed earlier, Jordan has very limited energy sources and depends on neighboring countries to compensate for shortages. Meanwhile, as the transportation sector has always occupied the first place in fuel consumption, EVs have become popular over the years as gas prices have become unstable and increased systematically. In fact, as in [19], the number of registered EVs has steadily increased in the last few years and is expected to continue growing.
To identify the present status and the future needs of the Jordanian market for EVs, a sample group of college students and staff with different backgrounds was tested. The study results indicated that most respondents were under 25 years old, held a bachelor’s degree, were single, and were seeking job opportunities. The findings also revealed that the majority of the participants used public transportation, with nearly 31% owning a hybrid car. Additionally, about one-quarter of the respondents were looking forward to owning an electric vehicle in the future.
Moreover, the results showed that most respondents lived within 15–30 min of the university, which significantly affected their selection or choice of the university for their studies. The study results indicated that the distance between home and university also affected students’ academic achievements and had a significant impact on their performance. Nearly 50% of respondents supported the idea of charging electric vehicles while at the university and agreed to pay the same rate as the grid tariff or slightly more. In contrast, 22.3% of the respondents were willing to pay 50% less than the grid tariff. The results of parametric and non-parametric tests indicated that monthly expenses, type of transportation, time required to commute to university, and distance from residence to university all affect academic achievement.
Preferences for future vehicle purchases and agreement with the idea of charging vehicles with a carport charging system while attending university and the ability to charge EVs off-grid are ideal scenarios for academic campuses and very promising for traveling short distances to and from campuses.

10. Conclusions

As future transportation is moving toward EVs, Jordanian authorities have realized the challenges and benefits of EVs. That is, on the positive side, energy conservation, emissions reduction, and empowering green technology will be optimized for a better future. Yet, it is also realized that such rapid transformation from conventional internal combustion engine vehicles to electric-powered vehicles would place a huge burden on the national power network. Extra electrical loads will also result in burning extra amounts of fossil fuel, leading to the release of higher amounts of greenhouse gas emissions. Therefore, in this paper, the option of using solar energy as a clean, convenient, and low-cost charging alternative to power EVs was investigated at the scale of university students and employees and found to be very promising, with high potential for success.
The questionnaire data analysis has shown young Jordanians’ preferences for EVs with the ability of convenient charging and low cost. As a result, energy policymakers, along with stakeholders and investors, should adopt various types of sustainable energy in the transportation sector. Meanwhile, as further work in this study, the acceptance of EV carports will be investigated in other universities in Jordan to develop a sustainable energy model. This model can be used to promote EVs as a substitution for conventional gas vehicles, increase renewable energy, reduce dependence on fossil fuels, and transform into green cities.

Author Contributions

Conceptualization, E.A., E.R. and A.A.-M.; methodology, S.A.; validation, E.A. and E.R.; formal analysis, E.A. and A.A.-M.; investigation, E.A.; resources, E.A. and A.A.-M.; data curation, S.A.; data analysis, E.A.; writing—original draft preparation, E.A.; writing—review and editing, E.A. and E.R.; visualization, E.A.; supervision, E.A. and E.R.; project administration, E.R., E.A. and S.A. All authors have read and agreed to the published version of the manuscript.

Funding

This research received no external funding.

Data Availability Statement

The raw data supporting the conclusions of this article will be made available by the authors on request.

Conflicts of Interest

The authors declare no conflicts of interest.

References

  1. Al Ghussain, L. Economic Assessment of PV Investments in Jordan. Innov. Energy Res. 2017, 6, 2–5. [Google Scholar] [CrossRef]
  2. Alilou, M.; Gharehpetian, G.; Ahmadiahangar, R.; Rosin, A.; Anvari-Moghaddam, A. Day-Ahead Scheduling of Electric Vehicles and Electrical Storage Systems in Smart Homes Using a Novel Decision Vector and AHP Method. Sustainability 2022, 14, 11773. [Google Scholar] [CrossRef]
  3. Muna, Y.B.; Kuo, C.-C. Feasibility and Techno-Economic Analysis of Electric Vehicle Charging of PV/Wind/Diesel/Battery Hybrid Energy System with Different Battery Technology. Energies 2022, 15, 4364. [Google Scholar] [CrossRef]
  4. Seddig, K.; Jochem, P.; Fichtner, W. Integrating renewable energy sources by electric vehicle fleets under uncertainty. Energy 2017, 141, 2145–2153. [Google Scholar] [CrossRef]
  5. International Energy Agency. Available online: https://www.iea.org/ (accessed on 10 July 2024).
  6. Jordanian Department of Statistics. Available online: https://dosweb.dos.gov.jo/ (accessed on 29 July 2024).
  7. Jaber, J. Future energy consumption and greenhouse gas emissions in Jordanian industries. Appl. Energy 2002, 71, 15–30. [Google Scholar] [CrossRef]
  8. Baniyounes, A. Renewable energy potential in Jordan. Int. J. Appl. Eng. Res. 2017, 12, 8323–8331. [Google Scholar]
  9. Ministry of Energy and Mineral Resources (MEMR). Performance of Jordanian Mining Sector During 2019–2021. Local Rep. 2021. Available online: https://www.memr.gov.jo/ (accessed on 16 July 2024).
  10. Günkaya, Z.; Özdemir, A.; Özkan, A.; Banar, M. Environmental Performance of Electricity Generation Based on Resources: A Life Cycle Assessment Case Study in Turkey. Sustainability 2016, 8, 1097. [Google Scholar] [CrossRef]
  11. Awada, E.A.; Abed, A.; Radwan, E.; Al-Qaisi, A.; Al-Rawashdeh, A.Y. Energy conservation as a sustainable strategy for smart home buildings in amman, jordan with improving indoor built environment features and key performance. Int. J. Energy Econ. Policy 2021, 11, 408–417. [Google Scholar] [CrossRef]
  12. Weckend, S.; Wade, A.; Heath, G. End-of-Life Management/Solar Photovoltaic Panels. International Energy Agency IEA and Internationa Renewable Energy Agency IRENA. 2016. Available online: https://www.irena.org/ (accessed on 30 June 2024).
  13. Emissions Database for Global Atmospheric Research (EDGAR). Available online: https://edgar.jrc.ec.europa.eu/report_2023?vis=ghgtot#emissions_table (accessed on 24 July 2024).
  14. Jordanian Ministry of Environment, Updated Submission of Jordan’s 1st Nationally Determined Contribution (NDC) 2021. Available online: https://unfccc.int/sites/default/files/NDC/2022-06/UPDATED%20SUBMISSION%20OF%20JORDANS.pdf (accessed on 31 July 2024).
  15. Zheng, Y.; Niu, S.; Shang, Y.; Shao, Z.; Jian, L. Integrating plug-in electric vehicles into power grids: A comprehensive review on power interaction mode, scheduling methodology and mathematical foundation. Renew. Sustain. Energy Rev. 2019, 112, 424–439. [Google Scholar] [CrossRef]
  16. Yao, X.; Fan, Y.; Zhao, F.; Ma, S.-C. Economic and climate benefits of vehicle-to-grid for low-carbon transitions of power systems: A case study of China’s 2030 renewable energy target. J. Clean. Prod. 2022, 330, 129833. [Google Scholar] [CrossRef]
  17. Vandewetering, N.; Hayibo, K.S.; Pearce, J.M. Open-Source Photovoltaic—Electrical Vehicle Carport Designs. Technologies 2022, 10, 114. [Google Scholar] [CrossRef]
  18. Gelmanova, Z.S.; Zhabalova, G.G.; ASivyakova, G.; Lelikova, O.N.; Onishchenko, O.N.; ASmailova, A.; Kamarova, S.N. Electric cars. Advantages and disadvantages. J. Phys. Conf. Ser. 2018, 1015, 052029. [Google Scholar] [CrossRef]
  19. Shalalfeh, L.; AlShalalfeh, A.; Alkaradsheh, K.; Alhamarneh, M.; Bashaireh, A. Electric Vehicles in Jordan: Challenges and Limitations. Sustainability 2021, 13, 3199. [Google Scholar] [CrossRef]
  20. Hongjie, J.; Xiaodan, Y.; Yixin, Y. An improved voltage stability index and its application. Int. J. Electr. Power Energy Syst. 2005, 27, 567–574. [Google Scholar] [CrossRef]
  21. Khamis, A.; Aiman, M.; Faizal, W.; Khor, C. Charging strategy in electric vehicle chargers by utilizing demand side management scheme. Electr. Power Syst. Res. 2023, 220, 109240. [Google Scholar] [CrossRef]
  22. Rodrigo, A.; Priyanka, V. Impact of High Penetration of EV Charging on Harmonics in Distribution Networks. In Proceedings of the Moratuwa Engineering Research Conference (MERCon), Moratuwa, Sri Lanka, 30 May–1 June 2018; pp. 340–344. [Google Scholar] [CrossRef]
  23. Erdenebat, M.; Khayankhyarvaa, S. Assessment of a Solar PV System Installation on the Roof of a Building. Embed. Selforganising Syst. 2022, 9, 20–24. [Google Scholar] [CrossRef]
  24. Iringová, A.; Kovačic, M. Design and optimization of photovoltaic systems in a parking garage—A case study. Transp. Res. Procedia 2021, 55, 1171–1179. [Google Scholar] [CrossRef]
  25. Kulik, A.C.; Tonolo, A.; Scortegagna, A.K.; da Silva, J.E.; Junior, J.U. Analysis of Scenarios for the Insertion of Electric Vehicles in Conjunction with a Solar Carport in the City of Curitiba, Paraná—Brazil. Energies 2021, 14, 5027. [Google Scholar] [CrossRef]
  26. Sokolovskij, E.; Małek, A.; Caban, J.; Dudziak, A.; Matijošius, J.; Marciniak, A. Selection of a Photovoltaic Carport Power for an Electric Vehicle. Energies 2023, 16, 3126. [Google Scholar] [CrossRef]
  27. Novoa, L.; Brouwer, J. Dynamics of an integrated solar photovoltaic and battery storage nanogrid for electric vehicle charging. J. Power Sources 2018, 399, 166–178. [Google Scholar] [CrossRef]
  28. Seddig, K.; Jochem, P.; Fichtner, W. Two-stage stochastic optimization for cost-minimal charging of electric vehicles at public charging stations with photovoltaics. Appl. Energy 2019, 242, 769–781. [Google Scholar] [CrossRef]
  29. Ozkan, H.A.; Erol-Kantarci, M. A novel Electric Vehicle Charging/Discharging Scheme with incentivization and complementary energy sources. J. Energy Storage 2022, 51, 104493. [Google Scholar] [CrossRef]
  30. Sundararajan, R.S.; Iqbal, T. Design of solar parking lot for 20 electric vehicles in St. John’s NL. In Proceedings of the 29th Annual Newfoundland Electrical and Computer Engineering Conference, St. John’s, NL, Canada, 19 November 2020; pp. 1–4. [Google Scholar]
  31. Chandra, G.R.; Bauer, P.; Zeman, M. System design for a solar powered electric vehicle charging station for workplaces. Appl. Energy 2016, 168, 434–443. [Google Scholar] [CrossRef]
  32. Alghamdi, A.S.; Bahaj, A.S.; Wu, Y. Assessment of Large Scale Photovoltaic Power Generation from Carport Canopies. Energies 2017, 10, 686. [Google Scholar] [CrossRef]
  33. Al Awadhi, N.; Moumouni, Y.; Khodary, A. Sizing of a Car Parking Photovoltaic System: An Economic Analysis. In Proceedings of the 2019 Advances in Science and Engineering Technology International Conferences, Dubai, United Arab Emirates, 26 March–10 April 2019; pp. 1–4. [Google Scholar] [CrossRef]
  34. Prateek, J.; Carishma, G.; Fundamentals of Electric Vehicles (EVs). National Renewable Energy Laboratory. 2022. Available online: https://www.nrel.gov/docs/fy23osti/84498.pdf (accessed on 1 July 2024).
  35. National Electric Power Company (NEPCO). Annual Reports, Amman, Jordan. Available online: https://www.nepco.com.jo/store/docs/web/2018_en.pdf (accessed on 31 July 2024).
  36. Obeidat, M.A.; Almutairi, A.; Alyami, S.; Dahoud, R.; Mansour, A.M.; Aldaoudeyeh, A.-M.; Hrayshat, E.S. Effect of Electric Vehicles Charging Loads on Realistic Residential Distribution System in Aqaba-Jordan. World Electr. Veh. J. 2021, 12, 218. [Google Scholar] [CrossRef]
  37. Xiang, Y.; Hu, S.; Liu, Y.; Zhang, X.; Liu, J. Electric vehicles in smart grid: A survey on charging load modelling. IET Smart Grid 2019, 2, 25–33. [Google Scholar] [CrossRef]
  38. Tahtamouni, A.; Al Qaisi, F.; Fendi, A. The Effect of Oil Price Falling on the Jordanian Economic System. Int. J. Econ. Financ. Issues 2017, 7, 282–289. [Google Scholar]
  39. SOLARGIS. Available online: https://solargis.com/maps-and-gis-data/download/jordan (accessed on 22 July 2024).
  40. Solar Radiation Monitoring Laboratory. University of Oregon. Sun Path Chart Program. Available online: https://solardata.uoregon.edu/SunPathChart.html (accessed on 24 January 2024).
  41. Alternative Energy Tutorials. Available online: https://www.alternative-energy-tutorials.com/energy-storage/deep-cycle-batteries.html (accessed on 22 July 2024).
  42. Lee, H.; Kim, S.; Yun, C. Comparison of Solar Radiation Models to Estimate Direct Normal Irradiance for Korea. Energies 2017, 10, 594. [Google Scholar] [CrossRef]
  43. Seyedmahmoudian, M.; Kok Soon, T.; Jamei, E.; Thirunavukkarasu, G.S.; Horan, B.; Mekhilef, S.; Stojcevski, A. Maximum Power Point Tracking for Photovoltaic Systems under Partial Shading Conditions Using Bat Algorithm. Sustainability 2018, 10, 496. [Google Scholar] [CrossRef]
  44. Monna, S.; Abdallah, R.; Juaidi, A.; Albatayneh, A.; Zapata-Sierra, A.J.; Manzano-Agugliaro, F. Potential Electricity Production by Installing Photovoltaic Systems on the Rooftops of Residential Buildings in Jordan: An Approach to Climate Change Mitigation. Energies 2022, 15, 496. [Google Scholar] [CrossRef]
Figure 1. Categories of Jordan’s energy consumption in categories [9].
Energies 17 04321 g001
Figure 2. Breakdown of Jordan’s primary energy mix 2020 [9].
Energies 17 04321 g002
Figure 3. ASU proposed EVs Carport.
Energies 17 04321 g003
Figure 4. EV worldwide sales for 2021 [34].
Energies 17 04321 g004
Figure 5. EV worldwide projection sales, 2022–2040 [34].
Energies 17 04321 g005
Figure 6. Global Horizontal Irradiation in Jordan [39].
Energies 17 04321 g006
Figure 7. Applied Science Private University parking space area.
Energies 17 04321 g007
Figure 8. Sun path charts for ASU are geographically located in Jordan at Latitude 31/Longitude 35 [40].
Energies 17 04321 g008
Figure 9. Proposed carport off-grid power system.
Energies 17 04321 g009
Figure 10. Proposed carport power charging system.
Energies 17 04321 g010
Figure 11. Monthly average solar irradiance received daily between 10:00 a.m. and 5:00 p.m. at ASU field test station.
Energies 17 04321 g011
Table 1. Jordan electricity consumption by sector 2014–2018 [9].
YearSector %Total
DomesticIndustryCommercialWater PumpingStreet Lights
2014432515152100
2015432515152100
2016452315152100
2017462215152100
201845.522.514162100
Table 2. Off-grid charging modes.
ModeS1S1S2S3S4S5Notes
BoostONONONOFFOFFSWPV source Vs. supplies the load, and S5 is the switching transistor.
BuckONONOFFOFFSWOFFPV source Vs. charges the battery, and S4 is the switching transistor.
BoostOFFOFFOFFONOFFSWBattery VB is discharging, and S5 is the switching transistor.
Table 3. Daily average Peak Sun Hours and peak wattage.
MonthPSH (h) k W p v MonthPSH (h) k W p v
January2.62.7July6.41.1
February3.22.2August6.01.2
March4.11.7September4.81.5
April5.11.4October3.71.9
May6.21.2November2.82.6
June6.51.1December2.52.8
Table 4. Jordan Electrical Tariff Structure 1 April 2022 [35].
Consumption Jordanian Dinar (JOD)/kWh
1–160 kWh/Month0.042
161–300 kWh/Month0.092
301–500 kWh/Month0.109
501–600 kWh/Month0.145
601–750 kWh/Month0.169
751–1000 kWh/Month0.19
More than 1000 kWh/Month0.256
Table 5. Demographic data.
GenderFrequencyPercent
Male14870.1
Female5827.5
Missing41.9
Prefer not to say10.5
Total211100.0
AgeFrequencyPercent
Less than 25 years old15774.4
25–<35 years old178.1
35–<45 years old146.6
45–<65 years old2110.0
>65 Years old20.9
Total211100.0
EducationFrequencyPercent
High School167.6
College degree3315.6
Bachelor’s degree12458.8
Master’s degree41.9
Ph.D. degree3315.6
Prefer not to say10.5
Total211100.0
OccupationFrequencyPercent
Student14166.8
Faculty4420.9
Staff2411.4
Missing20.9
Total211100.0
Marital StatusFrequencyPercent
Married3215.2
Single16678.7
Separated73.3
Widow20.9
Prefer not to say31.4
Missing10.5
Total211100.0
EmploymentFrequencyPercent
Employed full-time6329.9
Employed part-time4320.4
Seeking opportunities5425.6
Retired83.8
Prefer not to say3717.5
Missing62.8
Total211100.0
Table 6. Frequency and percentage of monthly traveling expense, transportation type, traveling time, and traveling distance.
Monthly Exp.FrequencyPercent
JOD 0–<30 4923.2
JOD 30–<60 6229.4
JOD 60–<904119.4
JOD 90–<1202310.9
JOD 120–<150125.7
JOD 150 and above2411.4
Total211100.0
Type of TransportationFrequencyPercent
Public transportation13061.6
Own car7535.5
Walking or bicycling62.8
Total211100.0
Type of CarFrequencyPercent
Gasoline5425.6
Electric vehicle5023.7
Hybrid6631.3
No car4119.4
Total211100.0
Time RequiredFrequencyPercent
0–<15 min209.5
15–<30 min6229.4
30-<45 min4119.4
45–<60 min3818.0
60–<120 min3114.7
120–<150 min94.3
150 min. and above104.7
Total211100.0
DistanceFrequencyPercent
0–<10 km3818.0
10–<20 km6128.9
20–<30 km5224.6
30–<40 km3114.7
40 km and above2813.3
Missing10.5
Total211100.0
Table 7. Frequency and percentage of distance effect on achievements, registration, and choice of university.
The Distance to the University Affects Academic AchievementFrequencyPercent
Yes11554.5
No8238.9
Prefer not to say146.6
Total211100.0
The Distance Affects Your Registration for the SemesterFrequencyPercent
Yes10147.9
No9545.0
Prefer not to say157.1
Total211100.0
The Distance Affects Your Choice of UniversityFrequencyPercent
Yes14066.4
No5827.5
Prefer not to say136.2
Total211100.0
Table 8. What type of vehicle do you intend to purchase in the future?
FrequencyPercent
Gasoline3114.7
EV9746.0
Hybrid7837.0
Missing52.4
Total211100.0
Table 9. Do you agree with the idea of charging your EV while attending classes at university?
FrequencyPercent
Strongly agree7033.2
Agree8640.8
Not sure3416.1
Disagree73.3
Strongly disagree104.7
Missing41.8
Total211100.0
Table 10. Reasons that support the idea of charging vehicles while attending classes at university.
ReasonsFrequencyPercent
Environment viability reasons4119.4
Environment-friendly reasons2712.8
Time convenience and management2913.7
All reasons above9645.5
I don’t support the idea115.2
Missing73.3
If you charge your EV while attending classes, you are willing to pay
PaymentFrequencyPercent
Slightly above the grid tariff3315.6
Same as the grid tariff7234.1
25% less than the grid tariff5023.7
50% less than the grid tariff4722.3
Missing94.3
Table 11. One-sample t-test.
TdfMean Diff.
Does the distance from your residence to the university affect your academic achievement?40.223 ***1961.416
Do you agree with the idea of charging your EV while attending classes at university?54.940 ***2063.961
Does the distance between the home and university affect your registration for the semester?41.485 ***1951.485
Does the distance from your residence to the university affect your choice of university?39.874 ***1971.293
*** The p-value is significant at the 1% level.
Table 12. Hypothesis test Summary: one-sample chi-square test.
QuestionsSigDecision
1. What is your monthly expense for transportation?0.000Reject the null hypothesis
2. What is the type of your transportation?0.000Reject the null hypothesis
3. If you own a car, what type of car do you have? 0.294Retain the null hypothesis
4. What time is required from home to the university?0.000Reject the null hypothesis
5. Does the distance from your residence to the university affect your academic achievement?0.023Reject the null hypothesis
6. Does the distance between your home and university affect your registration for the semester?0.000Reject the null hypothesis
7. Does the distance from your residence to the university affect your choice of university?0.000Reject the null hypothesis
8. What type of vehicle do you intend to purchase in the future?0.000Reject the null hypothesis
9. Do you agree with the idea of charging your vehicle while attending classes at university?0.000Reject the null hypothesis
The significance level is 0.05.
Disclaimer/Publisher’s Note: The statements, opinions and data contained in all publications are solely those of the individual author(s) and contributor(s) and not of MDPI and/or the editor(s). MDPI and/or the editor(s) disclaim responsibility for any injury to people or property resulting from any ideas, methods, instructions or products referred to in the content.

