
Real-Time Impedance Detection for PEM Fuel Cell Based on TAB Converter Voltage Perturbation


 ,
,  ,
,  ,
, 
Abstract
1. Introduction
2. PEMFC EIS Detection Method Based on TAB Converter
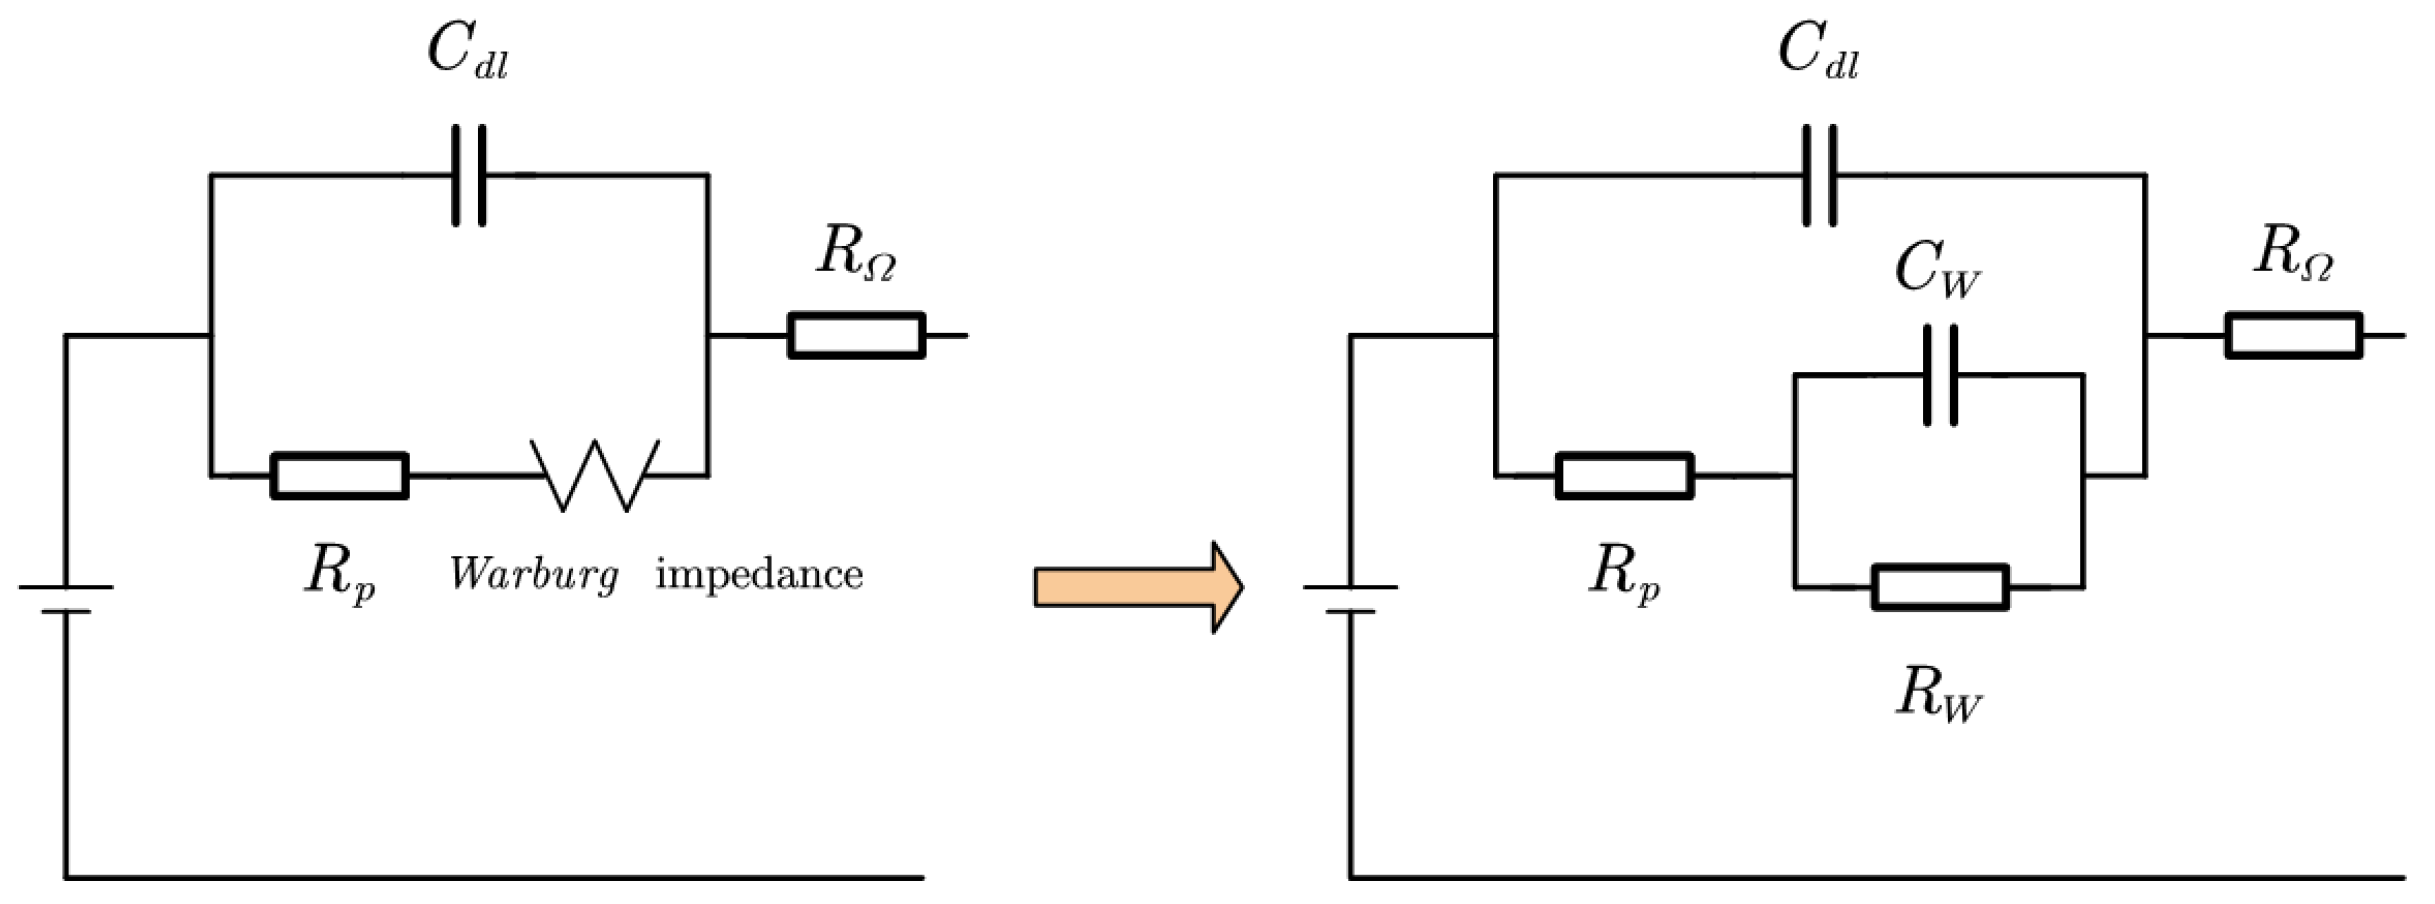
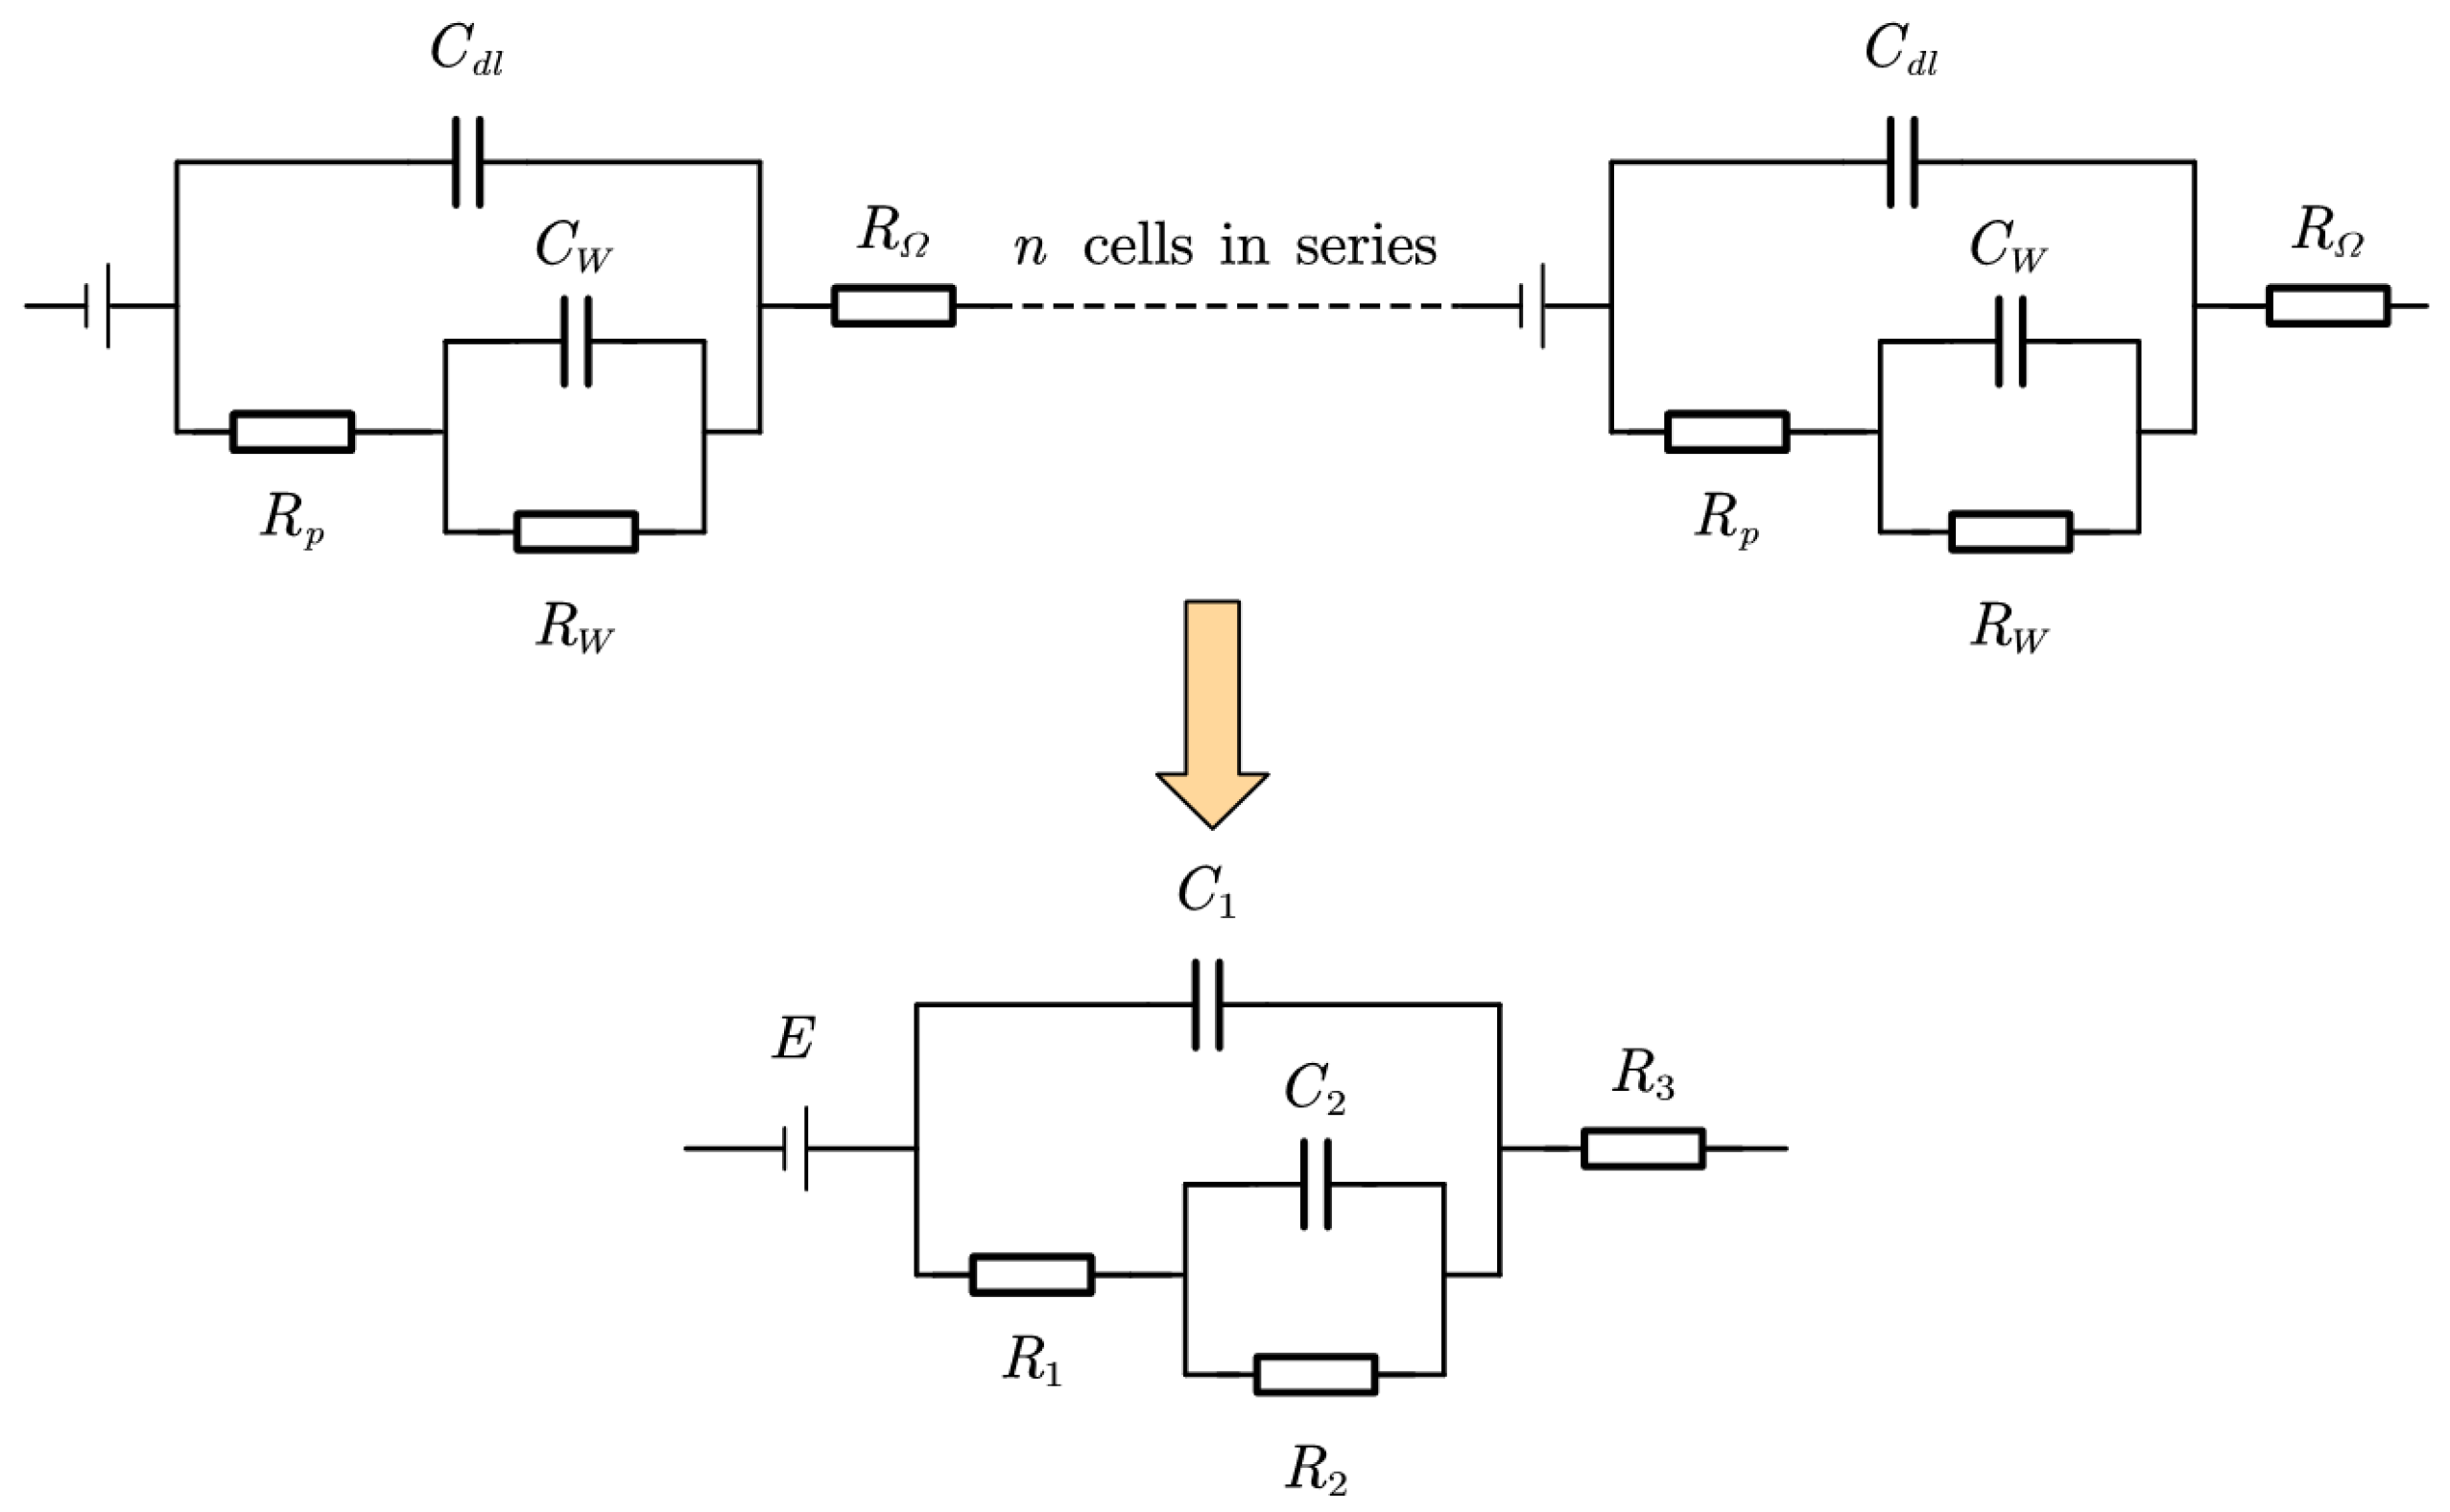
2.1. PEMFC Impedance Model
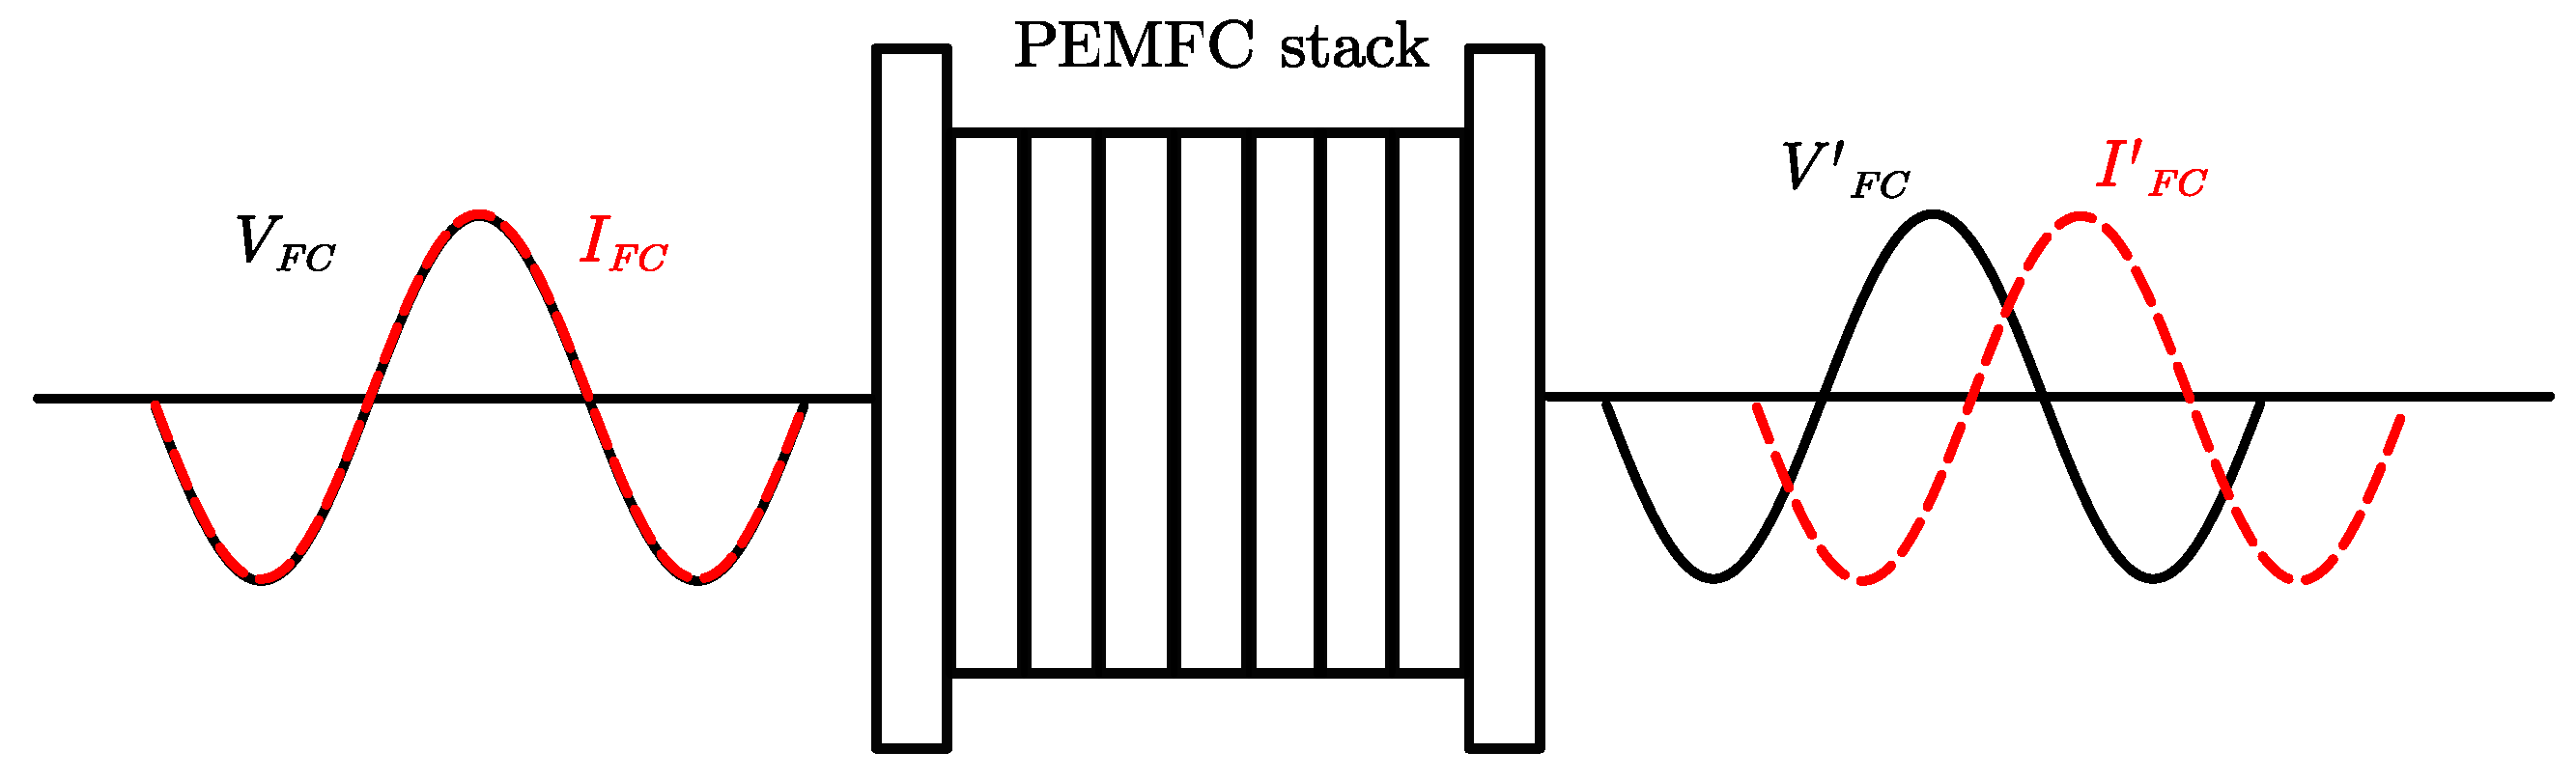
2.2. Principle of EIS Detection
2.3. Topology and Control Methods of TAB Converter
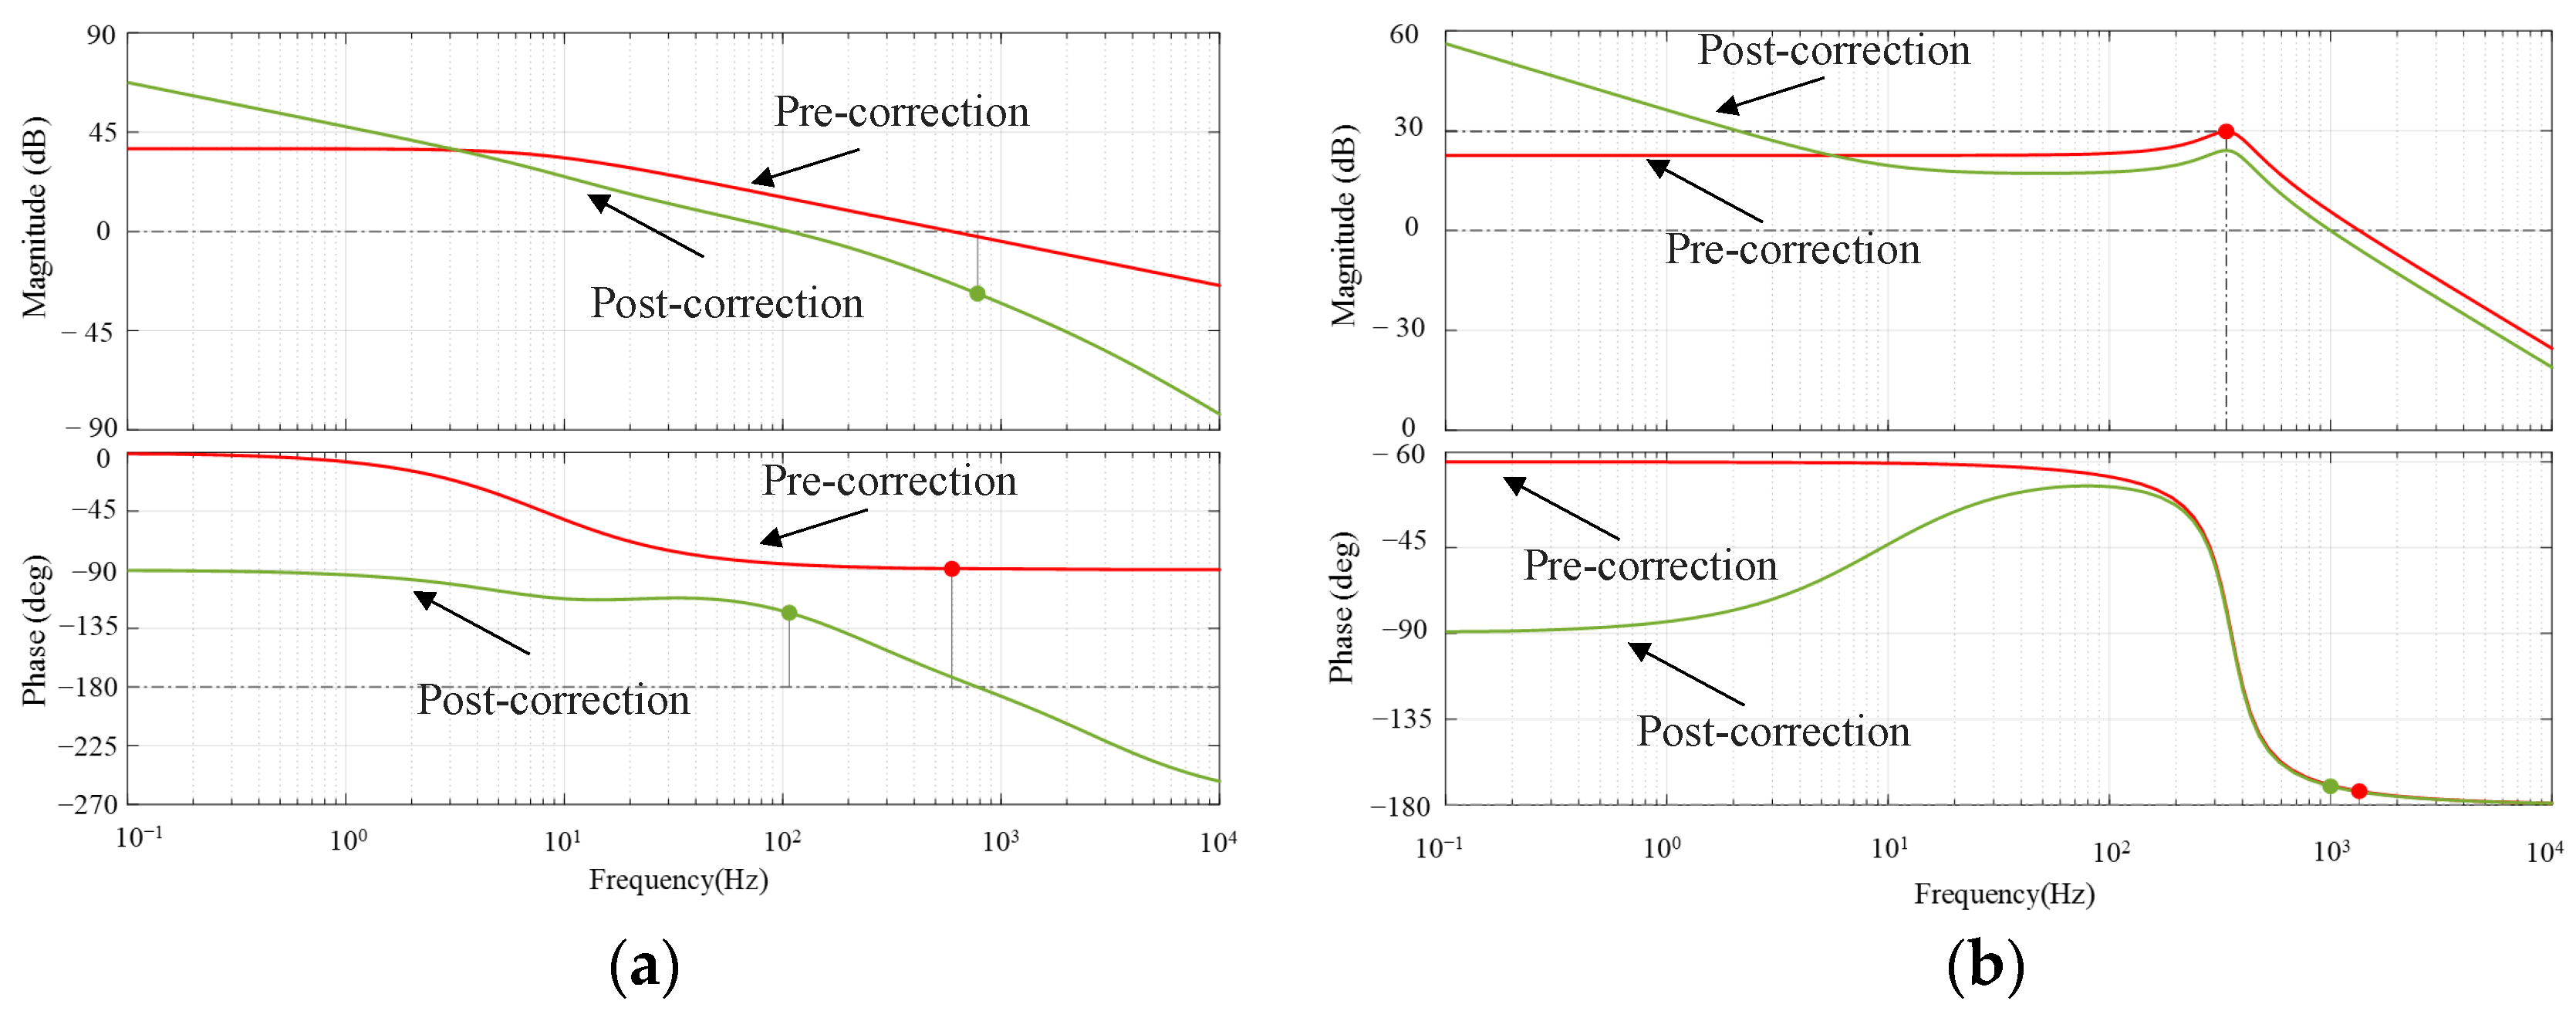
3. Design of Control Systems
3.1. Small Signal Model
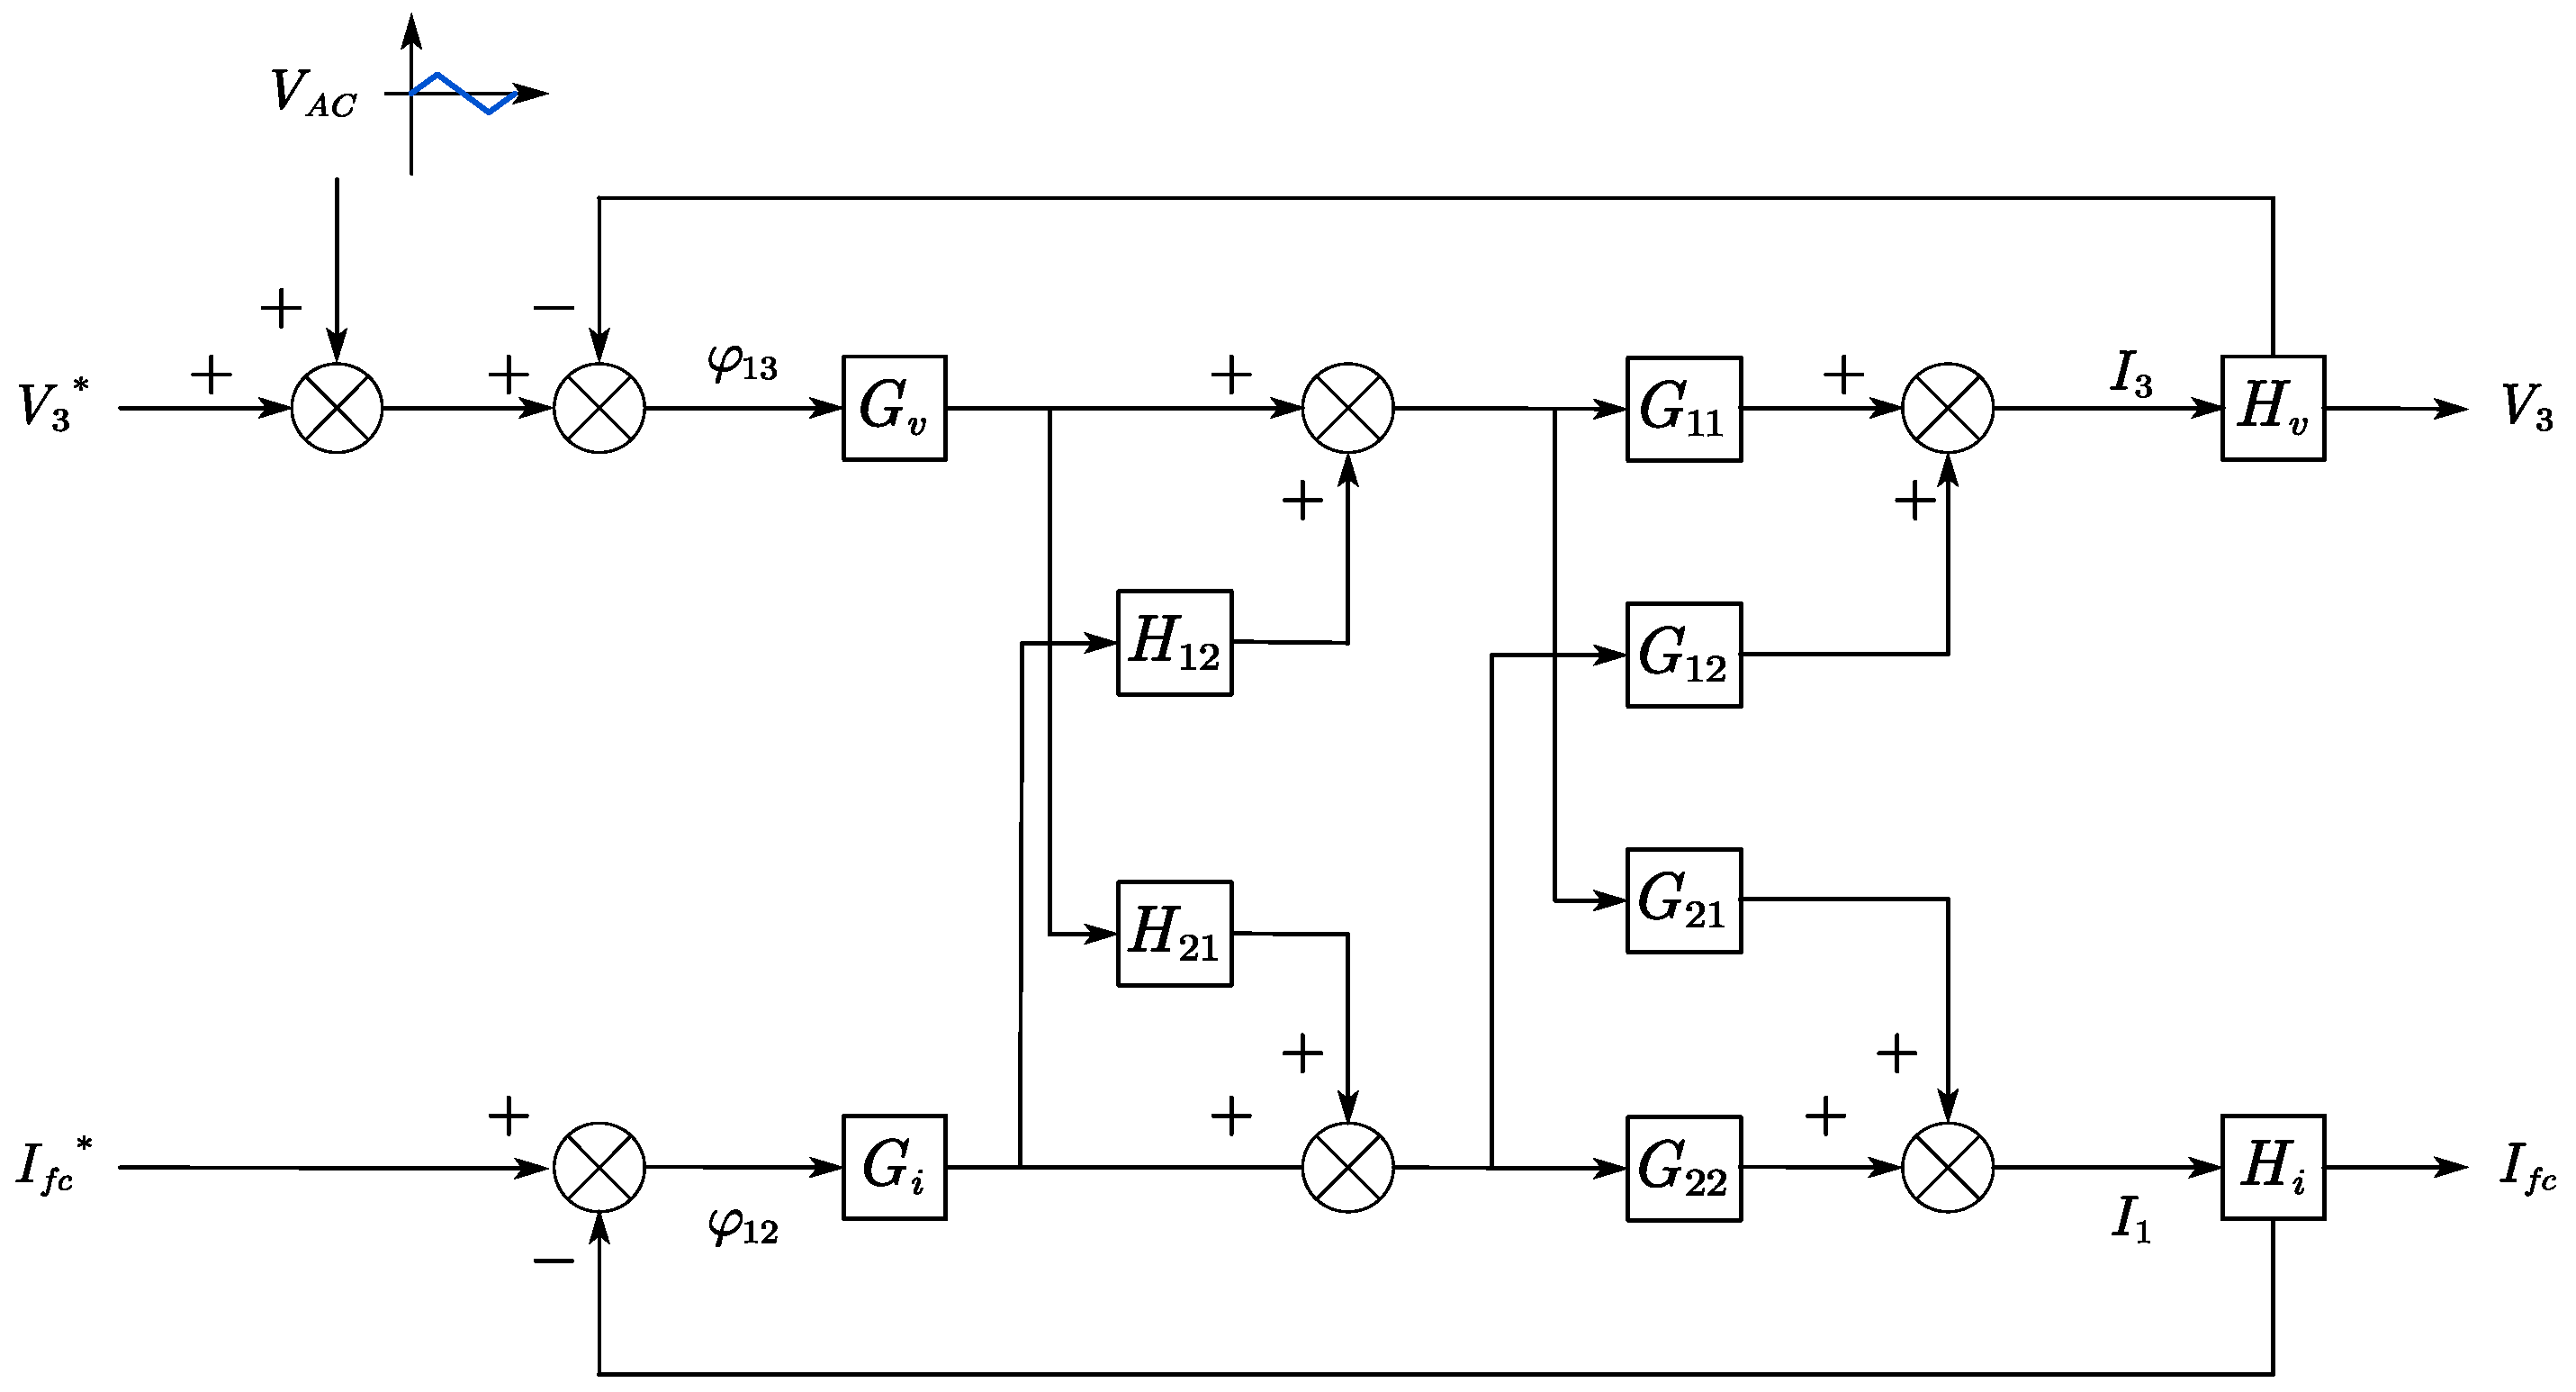
3.2. Decoupling Control
4. Simulation Results and Discussion
4.1. Model Parameters
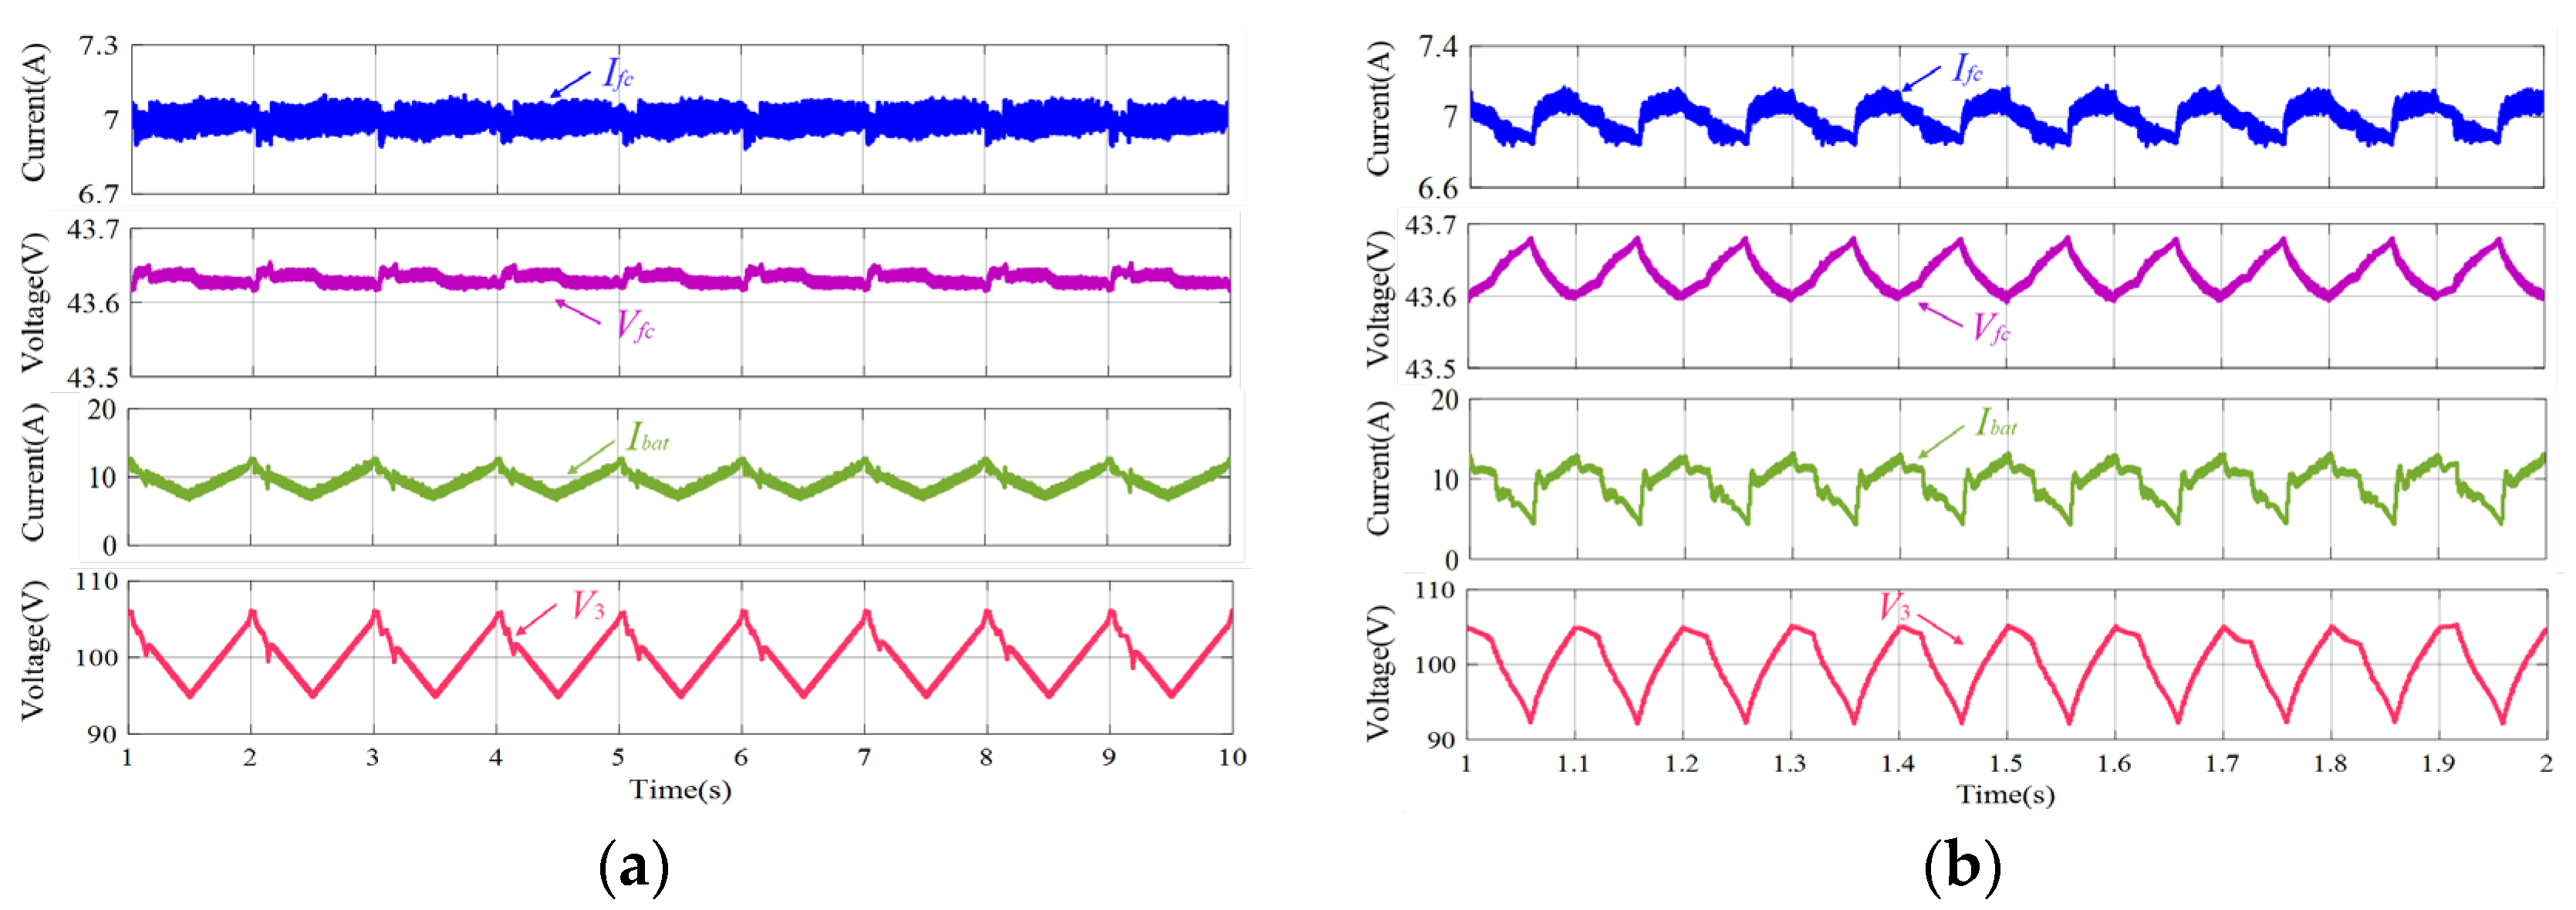
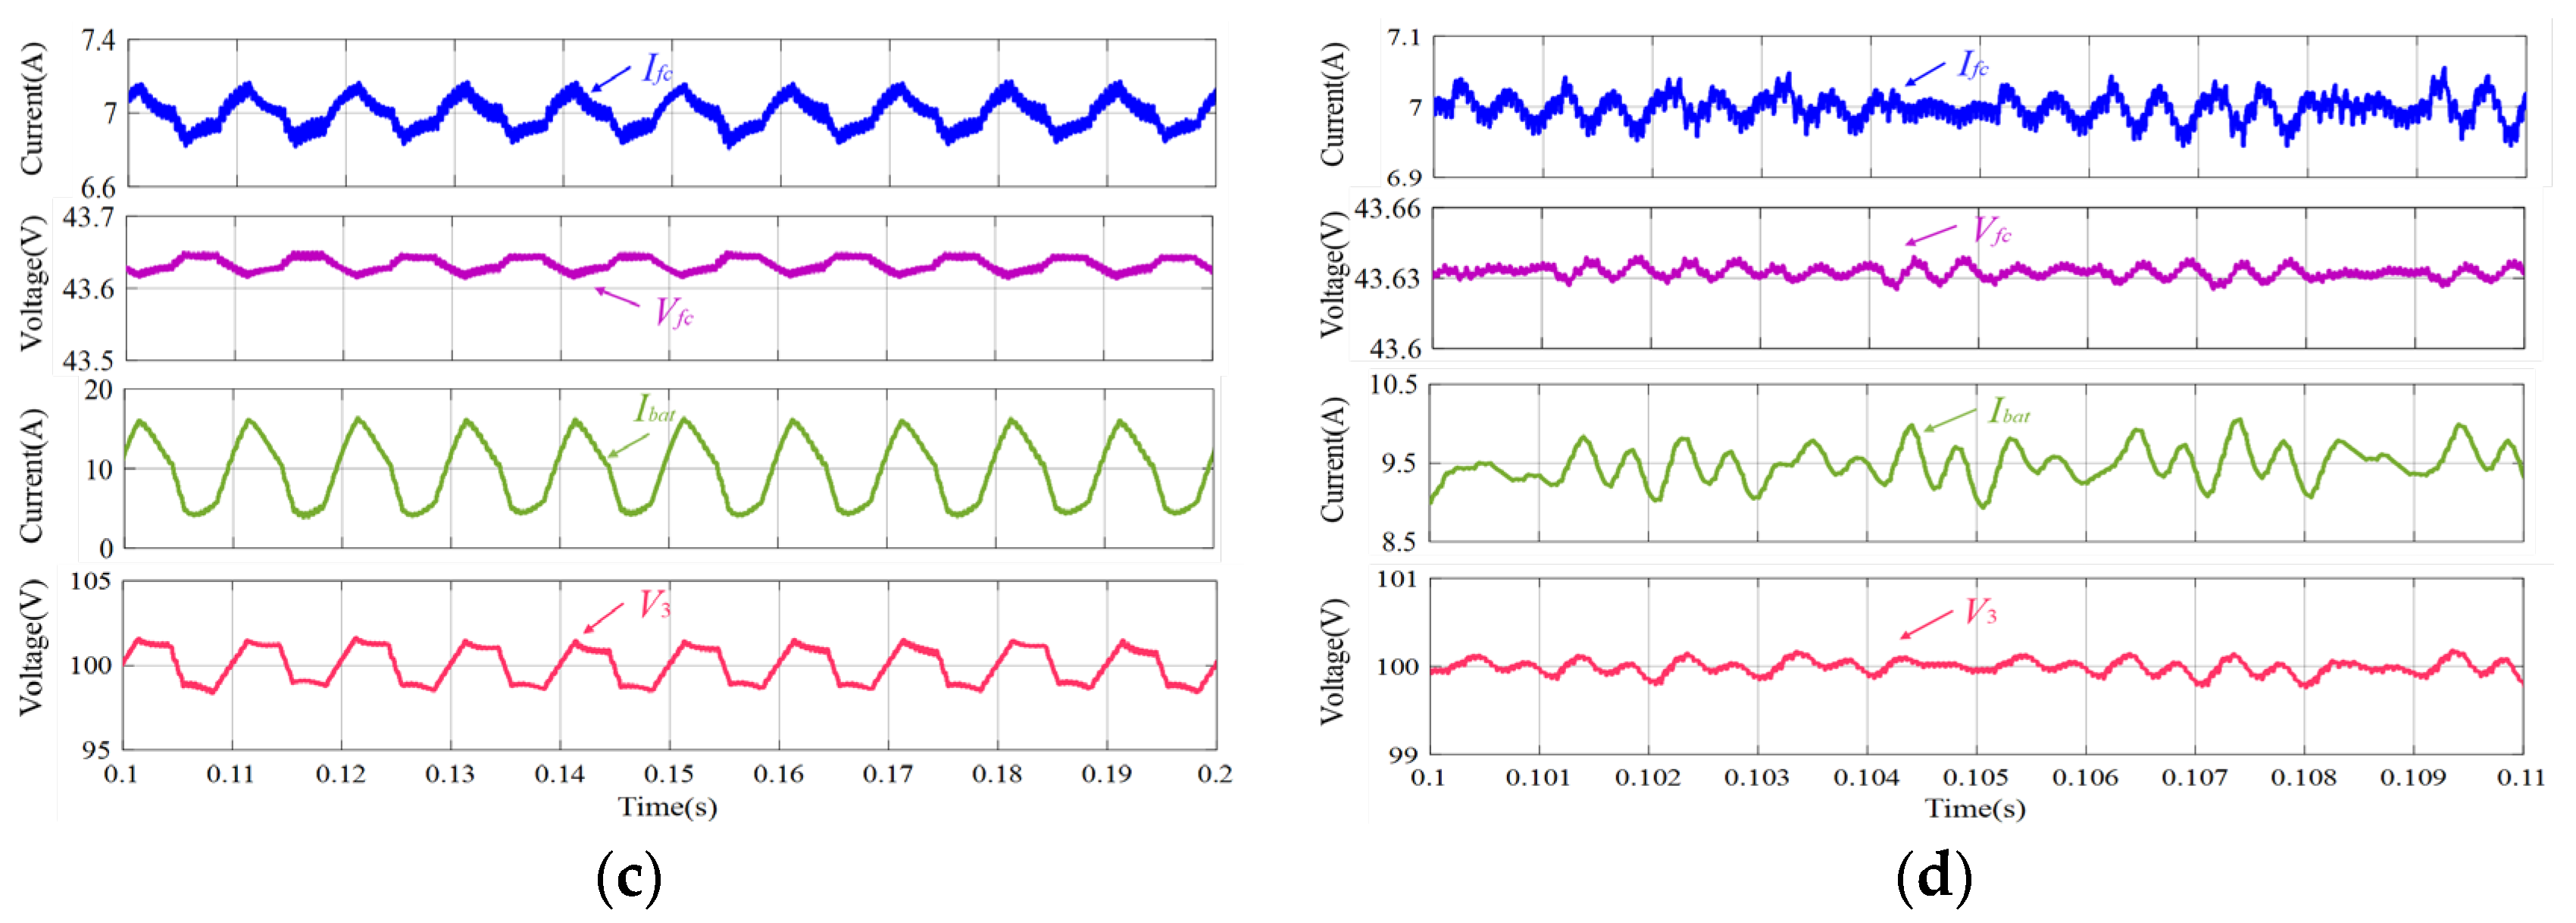
4.2. Simulation Results and Analysis
5. Conclusions
Author Contributions
Funding
Data Availability Statement
Conflicts of Interest
References
- Zhang, T.; Wang, P.; Chen, H.; Pei, P. A review of automotive proton exchange membrane fuel cell degradation under start-stop operating condition. Appl. Energy 2018, 223, 249–262. [Google Scholar] [CrossRef]
- Yu, Z.; Xia, L.; Xu, G.; Wang, C.; Wang, D. Improvement of the three-dimensional fine-mesh flow field of proton exchange membrane fuel cell (PEMFC) using CFD modeling, artificial neural network and genetic algorithm. Int. J. Hydrogen Energy 2022, 47, 35038–35054. [Google Scholar] [CrossRef]
- Khatir, F.A.; Barzegari, M.M.; Talebi-Ghadikolaee, H.; Seddighi, S. Integration of design of experiment and finite element method for the study of geometrical parameters in metallic bipolar plates for PEMFCs. Int. J. Hydrogen Energy 2021, 46, 39469–39482. [Google Scholar] [CrossRef]
- Song, Y.; Zhang, C.; Ling, C.Y.; Han, M.; Yong, R.Y.; Sun, D.; Chen, J. Review on current research of materials, fabrication and application for bipolar plate in proton exchange membrane fuel cell. Int. J. Hydrogen Energy 2020, 45, 29832–29847. [Google Scholar] [CrossRef]
- Altarawneh, R.M.; Pickup, P.G. Pt and PtRu catalyst bilayers increase efficiencies for ethanol oxidation in proton exchange membrane electrolysis and fuel cells. J. Power Sources 2017, 366, 27–32. [Google Scholar] [CrossRef]
- Li, H.; Tang, Y.; Wang, Z.; Shi, Z.; Wu, S.; Song, D.; Zhang, J.; Fatih, K.; Zhang, J.; Wang, H.; et al. A review of water flooding issues in the proton exchange membrane fuel cell. J. Power Sources 2008, 178, 103–117. [Google Scholar] [CrossRef]
- Niya, S.M.R.; Hoorfar, M. Study of proton exchange mem brane fuel cells using electrochemical impedance spectroscopy technique—A review. J. Power Sources 2013, 240, 281–293. [Google Scholar] [CrossRef]
- Kashyap, D.; Dwivedi, P.K.; Pandey, J.K.; Kim, Y.H.; Kim, G.M.; Sharma, A.; Goel, S. Application of electrochemical impedance spectroscopy in bio-fuel cell characterization: A review. Int. J. Hydrogen Energy 2014, 39, 20159–20170. [Google Scholar] [CrossRef]
- Hernández-Gómez, Á.; Langarica-Cordoba, D.; Martinez-Rodriguez, P.R.; Guilbert, D.; Ramirez, V.; Saldivar, B. PEM Fuel Cell Emulators: A Review. Electronics 2023, 12, 2812. [Google Scholar] [CrossRef]
- Hernández-Gómez, Á.; Langarica-Cordoba, D.; Martinez-Rodriguez, P.R.; Guilbert, D.; Ramirez, V.; Saldivar, B. Development of an equivalent electronic circuit model for PEMFC voltage based on different input electrical currents. IEEE Access 2023, 11, 108328–108338. [Google Scholar] [CrossRef]
- Samal, K.B.; Pati, S.; Sharma, R. A review of FCs integration with microgrid and their control strategies. Int. J. Hydrogen Energy 2023, 48, 35661–35684. [Google Scholar] [CrossRef]
- Pham, V.L.; Wada, K. Applications of triple active bridge converter for future grid and integrated energy systems. Energies 2020, 13, 1577. [Google Scholar] [CrossRef]
- Zeng, J.; Yu, Z.; Liu, J.; Liu, F. Triple-compound-full-bridge-based multi-input converter with wide zero-voltage switching range and wide conversion gain. IEEE Trans. Ind. Electron. 2019, 67, 9260–9272. [Google Scholar] [CrossRef]
- Biswas, I.; Kastha, D.; Bajpai, P. Small signal modeling and decoupled controller design for a triple active bridge multiport DC–DC converter. IEEE Trans. Power Electron. 2020, 36, 1856–1869. [Google Scholar] [CrossRef]
- Wang, H.; Gaillard, A.; Hissel, D. A review of DC/DC converter-based electrochemical impedance spectroscopy for fuel cell electric vehicles. Renew. Energy 2019, 141, 124–138. [Google Scholar] [CrossRef]
- Hong, P.; Li, J.; Xu, L.; Ouyang, M.; Fang, C. Modeling and simulation of parallel DC/DC converters for online AC im-pedance estimation of PEM fuel cell stack. Int. J. Hydrogen Energy 2016, 41, 3004–3014. [Google Scholar] [CrossRef]
- Mahlangu, S.; Barendse, P. Fuel Cell Stack Broadband Excitation for Online Condition Monitoring Using Different Switch-mode DC-DC Topologies. In Proceedings of the 2022 IEEE Energy Conversion Congress and Exposition (ECCE), Detroit, MI, USA, 9–13 October 2022; pp. 1–8. [Google Scholar]
- Cao, J.; Li, K.; Luan, X.; Han, C.; Tang, H. DC-DC Current Perturbation Based EIS Measurement for PEM Stack. In Proceedings of the 2022 4th Asia Energy and Electrical Engineering Symposium (AEEES), Chengdu, China, 25–28 March 2022; pp. 33–40. [Google Scholar]
- Huang, W.; Qahouq, J.A.A. An online battery impedance measurement method using DC–DC power converter control. IEEE Trans. Ind. Electron. 2014, 61, 5987–5995. [Google Scholar] [CrossRef]
- Shen, J.; Wang, J. Analysis and design of an isolated converter with embedded EIS function for fuel cell stack considering low-frequency oscillations. In Proceedings of the IECON 2020 the 46th Annual Conference of the IEEE Industrial Electronics Society, Singapore, 18–21 October 2020; pp. 1750–1755. [Google Scholar]
- Qahouq, J.A.A.; Xia, Z. Single-perturbation-cycle online battery impedance spectrum measurement method with closed-loop control of power converter. IEEE Trans. Ind. Electron. 2017, 64, 7019–7029. [Google Scholar] [CrossRef]
- Zhang, X.; Zhang, T.; Chen, H. Implementation and optimization of perturbation currents for vehicular proton exchange membrane fuel cells online electrochemical impedance spectroscopy measurements. Fuel Cells 2024, 24, 17–31. [Google Scholar] [CrossRef]
- Darowicki, K.; Janicka, E.; Mielniczek, M.; Zielinski, A.; Gawel, L.; Mitzel, J.; Hunger, J. The influence of dynamic load changes on temporary impedance in hydrogen fuel cells, selection and validation of the electrical equivalent circuit. Appl. Energy 2019, 251, 113396. [Google Scholar] [CrossRef]
- Zhao, L.; Dai, H.; Pei, F.; Ming, P.; Wei, X.; Zhou, J. A Comparative Study of Equivalent Circuit Models for Electro-Chemical Impedance Spectroscopy Analysis of Proton Ex-change Membrane Fuel Cells. Energies 2022, 15, 386. [Google Scholar] [CrossRef]
- Wang, Q.; Hu, Z.; Xu, L.; Li, J.; Gan, Q.; Du, X.; Ouyang, M. A comparative study of equivalent circuit model and distribution of relaxation times for fuel cell impedance diagnosis. Int. J. Energy Res. 2021, 45, 15948–15961. [Google Scholar] [CrossRef]


| Components | C1 (F) | C2 (F) | R1 (Ω) | R2 (Ω) | R3 (Ω) |
|---|---|---|---|---|---|
| Parameters | 0.028 | 0.099 | 0.098 | 0.272 | 0.252 |
| Symbol | Name | Value |
|---|---|---|
| Vfc | PEMFC stack rated voltage | 48 V |
| V2 | Lithium-ion battery rated voltage | 48 V |
| V3 | Load voltage | 100 V |
| r1 | 0.2 Ω | |
| fs | Switching frequency | 10 kHz |
| N1:N2:N3 | Transformer ratio | 1:1:2 |
| Lf1, Lf2 | Filter inductors | 200 μH/200 μH |
| L1, L2, L3 | Power transfer inductors | 25 μH/25 μH/25 μH |
| C1, C2, C3 | Filter capacitors | 1000 μF/1000 μF/1000 μF |
| Frequency (Hz) | Amplitude of Voltage (V) | Phase of Voltage (°) | Amplitude of Current (A) | Phase of Current (°) |
|---|---|---|---|---|
| 0 | 43.6300 | 0 | 7.00000 | 0 |
| 1 | 0.00684 | 203.5 | 0.01120 | 32.2 |
| 3 | 0.01867 | −70.7 | 0.03504 | 131.7 |
| 5 | 0.02771 | 123.2 | 0.06126 | −23.7 |
| 7 | 0.02942 | 177.7 | 0.08135 | 33.7 |
| 10 | 0.03292 | −89.5 | 0.10050 | 125.9 |
| 30 | 0.02480 | 239.0 | 0.12740 | 95.5 |
| 50 | 0.02030 | 227.7 | 0.13490 | 81.1 |
| 70 | 0.01684 | 218.8 | 0.12710 | 68.0 |
| 90 | 0.01306 | 213.1 | 0.11480 | 56.9 |
| 100 | 0.01205 | 210.1 | 0.10910 | 52.3 |
| 300 | 0.00472 | 185.7 | 0.04944 | 14.6 |
| 500 | 0.00211 | 173.2 | 0.02785 | 0.5 |
| 700 | 0.00147 | 166.2 | 0.01721 | −7.8 |
| 900 | 0.00063 | 170.5 | 0.00761 | −4.8 |
| 1000 | 0.00068 | 170.4 | 0.00762 | −5.9 |
| 3000 | 0.00095 | 20.1 | 0.00856 | 203.6 |
| 5000 | 0.00029 | 64.9 | 0.00284 | 249.1 |
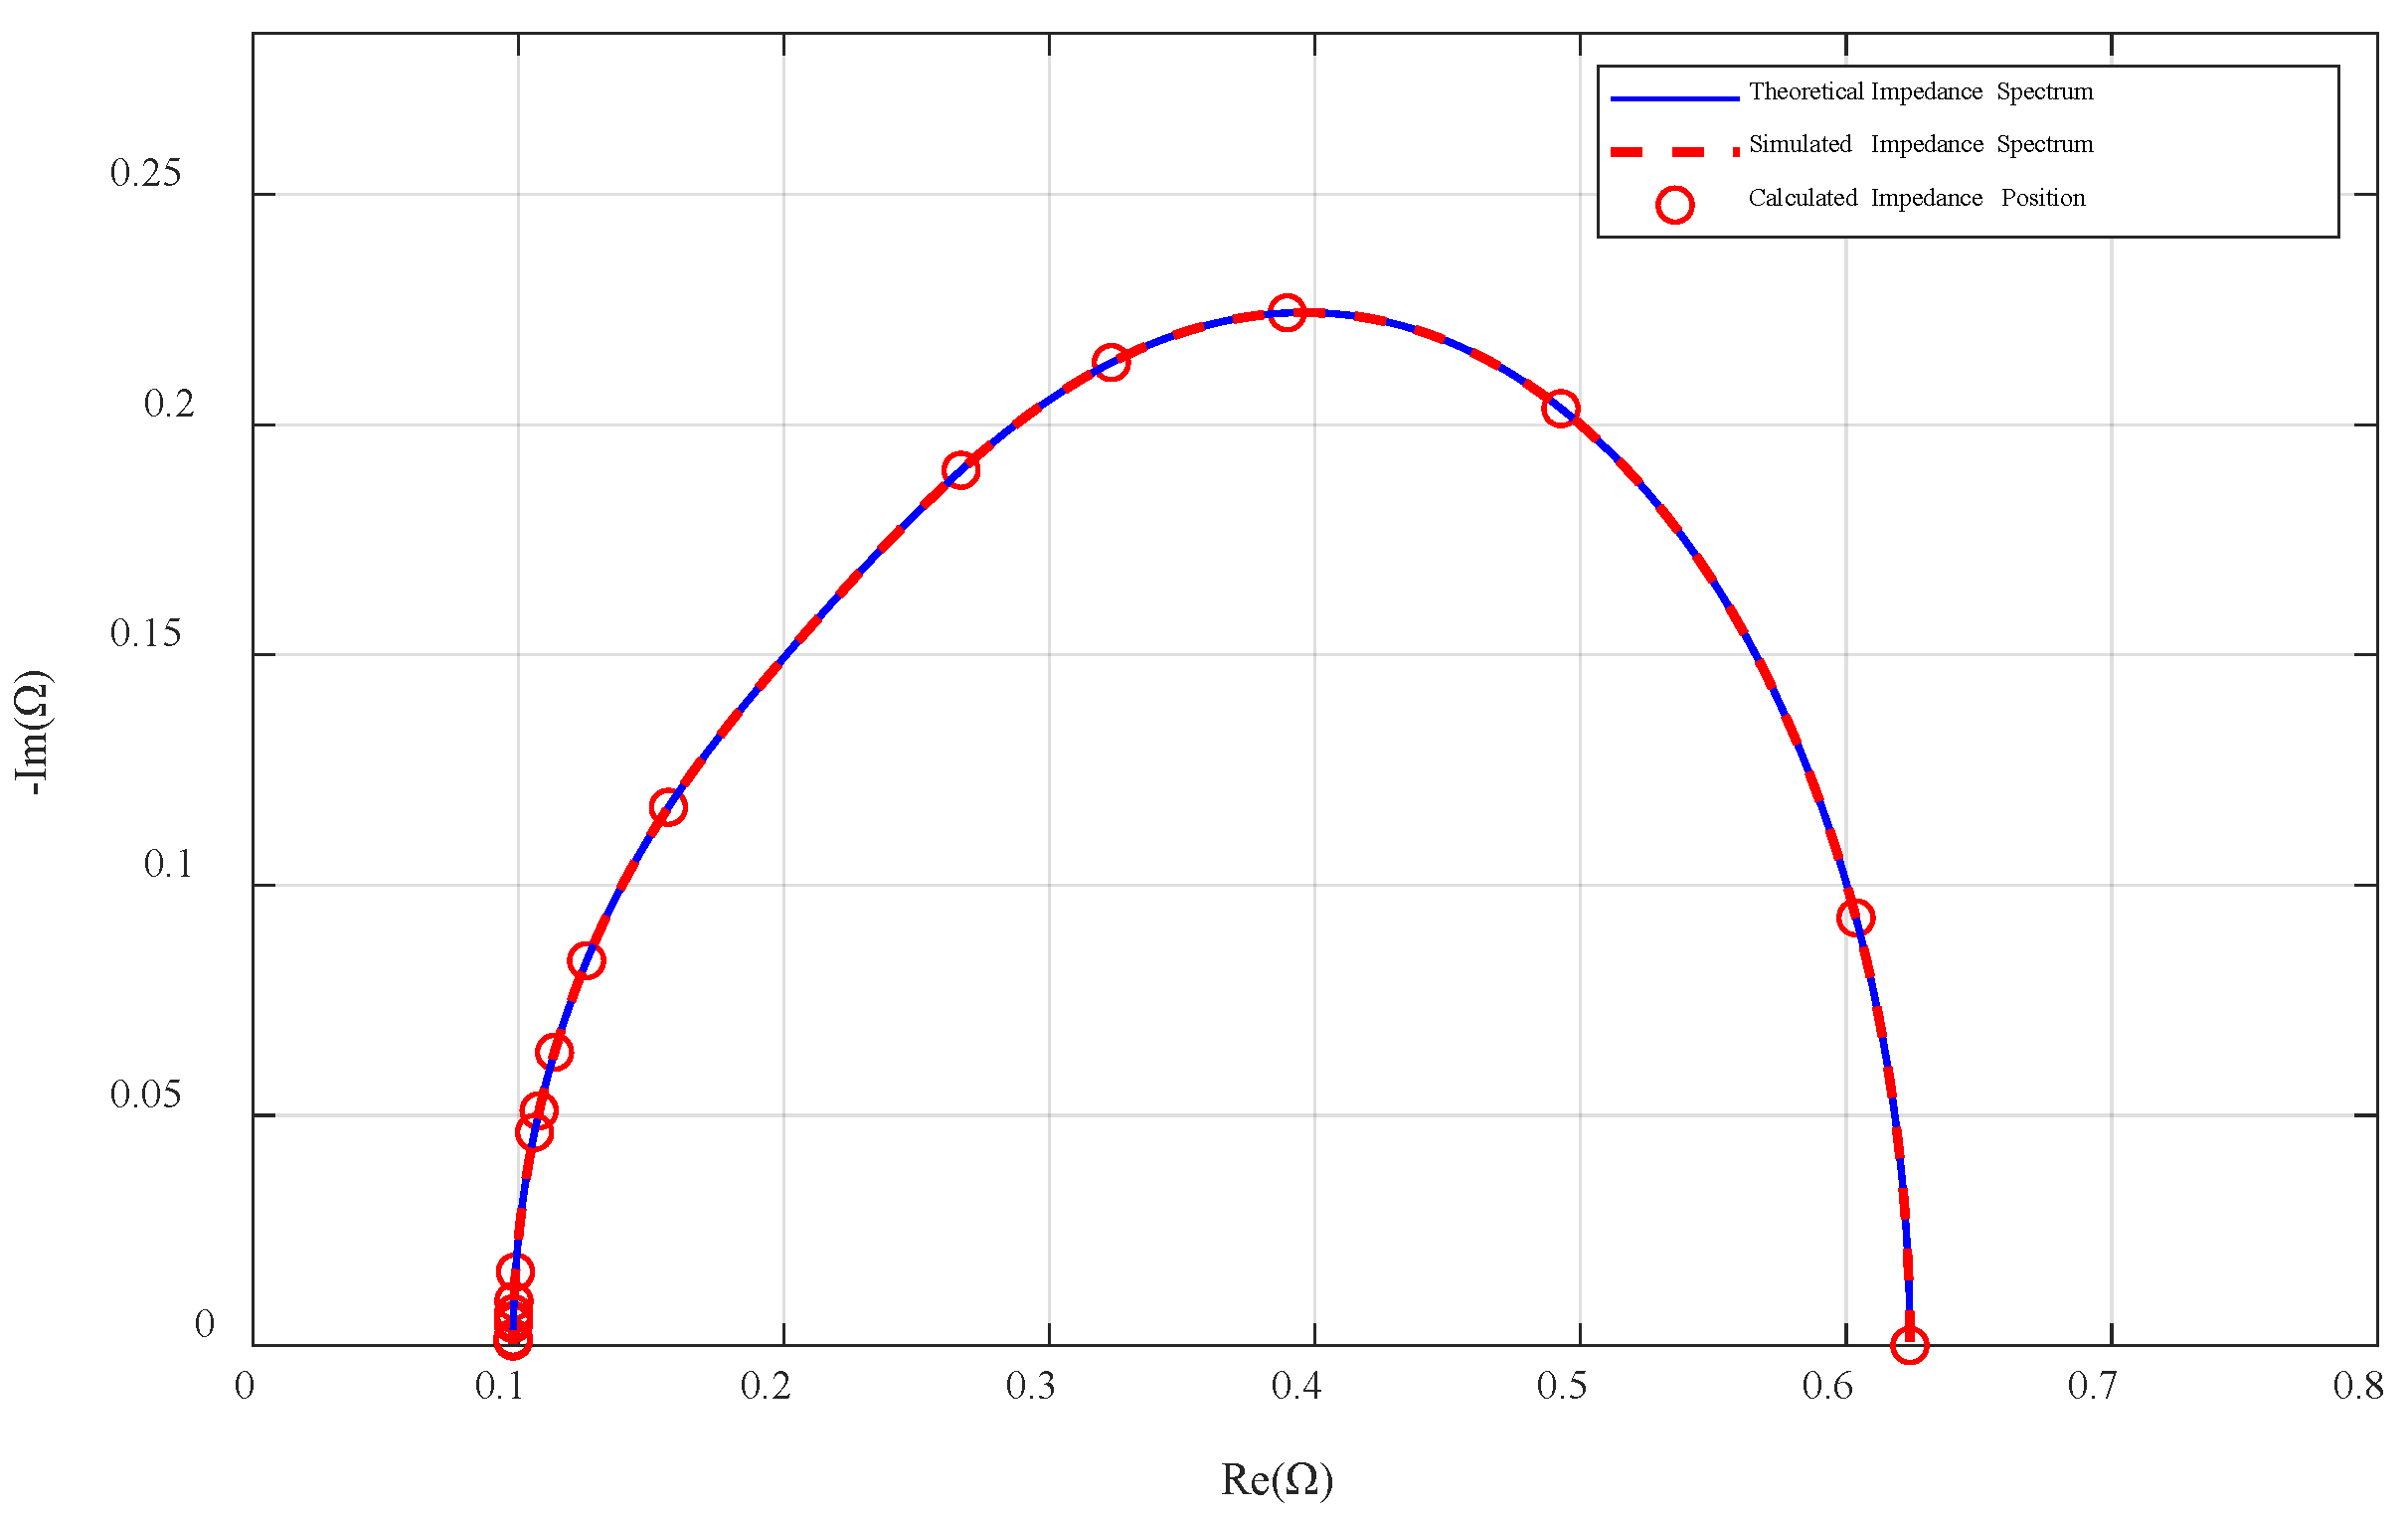
| Frequency (Hz) | Simulated Impedance Value (Ω) | Theoretical Impedance Value (Ω) |
|---|---|---|
| 0 | 0.624 | 0.624 |
| 1 | 0.603–0.092 i * | 0.604–0.093 i |
| 3 | 0.493–0.203 i | 0.493–0.204 i |
| 5 | 0.379–0.247 i | 0.390–0.224 i |
| 7 | 0.293–0.213 i | 0.323–0.214 i |
| 10 | 0.278–0.173 i | 0.267–0.190 i |
| 30 | 0.156–0.116 i | 0.157–0.117 i |
| 50 | 0.126–0.083 i | 0.126–0.084 i |
| 70 | 0.116–0.064 i | 0.114–0.064 i |
| 90 | 0.104–0.046 i | 0.108–0.051 i |
| 100 | 0.102–0.041 i | 0.106–0.046 i |
| 300 | 0.094–0.015 i | 0.099–0.016 i |
| 500 | 0.075–0.010 i | 0.098–0.100 i |
| 700 | 0.085–0.009 i | 0.098–0.007 i |
| 900 | 0.082–0.007 i | 0.098–0.005 i |
| 1000 | 0.090–0.006 i | 0.098–0.005 i |
| 3000 | 0.110–0.007 i | 0.098–0.002 i |
| 5000 | 0.100–0.007 i | 0.098–0.001 i |
Disclaimer/Publisher’s Note: The statements, opinions and data contained in all publications are solely those of the individual author(s) and contributor(s) and not of MDPI and/or the editor(s). MDPI and/or the editor(s) disclaim responsibility for any injury to people or property resulting from any ideas, methods, instructions or products referred to in the content. |
© 2024 by the authors. Licensee MDPI, Basel, Switzerland. This article is an open access article distributed under the terms and conditions of the Creative Commons Attribution (CC BY) license (https://creativecommons.org/licenses/by/4.0/).
Share and Cite
Zhou, J.; Jiang, J.; Fan, F.; Sun, C.; Dong, Z.; Song, K. Real-Time Impedance Detection for PEM Fuel Cell Based on TAB Converter Voltage Perturbation. Energies 2024, 17, 4320. https://doi.org/10.3390/en17174320
Zhou J, Jiang J, Fan F, Sun C, Dong Z, Song K. Real-Time Impedance Detection for PEM Fuel Cell Based on TAB Converter Voltage Perturbation. Energies. 2024; 17(17):4320. https://doi.org/10.3390/en17174320
Chicago/Turabian StyleZhou, Jialong, Jinhai Jiang, Fulin Fan, Chuanyu Sun, Zhen Dong, and Kai Song. 2024. "Real-Time Impedance Detection for PEM Fuel Cell Based on TAB Converter Voltage Perturbation" Energies 17, no. 17: 4320. https://doi.org/10.3390/en17174320
APA StyleZhou, J., Jiang, J., Fan, F., Sun, C., Dong, Z., & Song, K. (2024). Real-Time Impedance Detection for PEM Fuel Cell Based on TAB Converter Voltage Perturbation. Energies, 17(17), 4320. https://doi.org/10.3390/en17174320