1. Introduction
Shipping is a highly energy-intensive sector, and fleet decarbonization initiatives can significantly reduce greenhouse gas (GHG) emissions. With the aim of accelerating the transition to net zero CO
2 (carbon dioxide) emissions in the maritime sector, in July 2023 the International Maritime Organization (IMO) revised its GHG emissions strategy. The updated steps towards the target of reaching carbon neutrality by 2050 are emission reductions in GHGs of 20% by 2030 and 70% by 2040, compared to 2008 reference levels [
1].
In the short-to-medium term, reciprocating internal combustion engines will continue to be used for propulsion or as electricity generators onboard ships, because current electric-energy storage systems do not yet allow for high levels of travel autonomy. While waiting for further technology improvements, it is crucial to drastically reduce CO
2 emissions in the next few years to comply with the IMO GHG reduction pathway. The levers guiding ecological transition will include low-carbon fuels, which will be progressively combined with and replaced by carbon-free fuels [
2,
3,
4]. Wind or solar assistance could be used for auxiliary power sources and e-fuel production. In parallel, electric propellers [
3], a cold ironing system [
4], and carbon capture and storage (CCS) systems will be integrated onboard [
5].
The energy carriers of greatest interest in the marine field have been already investigated by H. Xing et al. [
6].
Hydrogen is considered to be the ideal substitute used to replace carbon fuels, and it could be used, in a pure state or in a blend with other fuels, in compression-ignition or spark-ignition engines and fuel-cell applications; due to its low volumetric energy density, however, under standard conditions, it requires storage at high pressure or liquefication at cryogenic temperatures [
7]. In addition, hydrogen gas is odourless and invisible, and its wide range of flammability (4–77% in air) makes it highly explosive [
8].
Ammonia is an attractive shipping energy carrier that could be used as a combustion fuel, as well as a feedstock for hydrogen production. Ammonia, compared with hydrogen, is safer, has a lower cost, and lower storage issues, and it is more suitable for application on ships, as it can be stored in its liquid phase. On the other hand, the large amounts of nitrogen released by the ammonia, if uncontrolled, could create serious environmental damage [
9].
The growing interest in alternative fuels has promoted the development of advanced techniques for fuel production. In particular, Carbon-Neutral Synthetic fuels represent a viable alternative because they use CO
2 captured from the CCS system and electricity. E-fuels could avoid CO
2 emissions, taking advantage of electricity generated from green sources. The current costs and infrastructure associated with the technology are not commercially feasible. Among the different e-fuels, methanol appears to be the most promising alternative fuel for global shipping [
10], while other carbon-neutral biofuels may be feasible for short-distance sea shipping [
6].
Hydrogen and ammonia are expected to be utilized, as they are ideal fuels for inland and coastal shipping, but they are not recommended for long-distance applications, due to their low volumetric energy densities, in addition to issues associated with their availability, transportation, and storage. Even though hydrogen and ammonia do not produce CO
2, PM (particulate matter), or SOx (sulphur oxides) [
11], their sustainability is not yet effective, because they are still produced from fossil fuels. According to International Renewable Energy Agency (IRENA) reports, at the end of 2021, only about 1% of global hydrogen and ammonia outputs were produced by the use of renewable sources [
12].
Liquefied Natural Gas (LNG), considered a transitional fuel and consisting of a hydrocarbon gas mixture which is primarily methane, has a potential CO
2 emission reduction rating of around 20–30%, compared to conventional marine fuels. [
13]. Compared to Compressed Natural Gas (CNG), LNG allows for a halving of the storage space required; the compression of natural gas reduces its storage volume by about 300 times, compared to ambient pressure, while liquefying natural gas reduces the storage volume by about 620 times, compared to ambient pressure and temperature conditions. Therefore, LNG is preferred over CNG for long-distance applications such as marine transport [
14]. LNG has energy characteristics very close to those of traditional marine fuels, but the lower volumetric energy density requires approximately twice the space onboard [
15]. LNG provides immediate environmental benefits; it is widely available and cheap. Further, in the near future, LNG can be replaced by e-methane, which is produced by the synthesis of captured CO
2 and hydrogen. For these reasons, LNG represents the most promising transitional fuel, even though it cannot meet the IMO’s long-term target for GHG reduction [
16].
Table 1 shows the main characteristics of the above-mentioned fuels, compared with traditional marine fuels such as Marine Gas Oil (MGO), which are set as reference. Each fuel is characterized by an energy content that may require larger or smaller storage volumes, in addition to specific storage and preservation conditions [
17].
For the purposes of the next decade, among several alternative fuels for shipping, methanol and biodiesel are the most promising [
10,
18], because they are easy to store and to transport. They can be derived from fossil resources and biomass, as well as from renewable energy, and fossil energy combined with CCS systems. In addition, the future increased numbers of land-based green power generation systems will lead to a greater electricity generation and electricity surplus which could be used for fuel production, reducing the costs and environmental impacts [
19].
Overall, considering the long timescales associated with marine-fuel substitution, in accordance with general forecasts, the goal of low-carbon maritime transportation can be realized using LNG [
20,
21], because natural gas is widely available worldwide and can be gradually replaced with e-methane or biomethane [
6], while avoiding additional CO
2 emissions into the atmosphere.
Although it is not possible to find unambiguous predictions about the future energy mix, in a scenario of diversification of energy sources, it is reasonable to assume that LNG is going to be the main low-carbon fuel for the next decade, while it will be gradually supported by methanol in the next few years, and by e-fuel, starting from 2030 [
18,
22].
The shipping sector contributes about 2–3% of total GHG emissions [
23], and its main contribution is associated with large ships [
24], which have large energy requests and require considerable sailing autonomy. As consequence, they require fuels with a high energy content in small volumes, in order to not reduce the payload of the vessel. At the same time, new regulations concerning emission reduction force shipowners to modernize their fleets and use innovative fuels to avoid stops and penalties. Retrofit technologies will be implemented for existing ships, replacing traditional fuel with low-carbon fuels, while new technologies will be applied for new engines. Construction costs of LNG ships are 15~30% higher, compared to conventional ships, due to construction technology [
25]. On the other hand, lower fuel costs, compared to other alternative fuels [
4], could provide shipowners with an effective way to reduce CO
2 emissions; then, further optimization and aftertreatment systems could ensure the minimization of polluting emissions. Particular care should be paid to methane emissions, which significantly impact upon the global CO
2 assessment [
26].
Ushakov et al. [
27] analysed the advantages and disadvantages of different key technologies enabling the use of natural gas in naval engines. Based on the engine concept, three different technological solutions can be distinguished: Lean-Burn Spark-Ignition (LBSI), Low-Pressure Dual-Fuel (LPDF), and High-Pressure Dual-Fuel (HPDF) engines.
Natural gas exhibits greater resistance to knock, due to its high octane number and auto-ignition temperature, making it theoretically an ideal fuel for engines with a high compression ratio. Nevertheless, the lower flame-speed propagation and the higher autoignition temperature require a high-energy ignition system; for this purpose, Turbulent-Jet Ignition (TJI) technology is adopted for LBSI engines, while for Dual-Fuel (DF) engines, a small amount of high-reactivity fuel is used as combustion trigger.
LBSI engines are generally equipped with a passive prechamber system and reach higher efficiencies than traditional engines, while also demonstrating high λ and low emission levels. The electrical spark-plug starts the combustion, and the turbulent jets, coming from the prechamber, burn the lean mixture below. The central position of the spark plug allows a uniform jet distribution, reducing knock-probability. Specific fuel consumption, and thus CO
2 emissions, are reduced by 20–30%, but these engines are subject to the methane-slip phenomena, which strongly influences GHG emissions, especially under low-load conditions [
28]. In order to quantify the specific contribution of each single climate-altering chemical species, the Intergovernmental Panel on Climate Change (IPCC) introduced the Global Warming Potential (GWP) [
29]. The GWP provides a measure of how much energy the emission of one ton of a gas will absorb over a specific period of time (generally 100 years), compared to the emissions of one ton of CO
2. Methane has a GWP
100 between 28 and 36, meaning that one ton of methane has the same climate impact as 28 to 36 tons of CO
2, when assessed over a 100-year period [
30]. In order to ensure stable combustion in the main chamber, especially under a low load, new spark-plug designs and a more accurate prechamber, increasing the turbulence, have been developed [
31,
32]. LBSI engines allow significant reductions of PM and comply with Tier III regulations in their NOx (Nitrogen Oxides) emissions.
Further performance improvements can be achieved by using active prechamber systems, a prospect which has already been explored in automotive areas [
33,
34], improving the stability of turbulent jets and increasing λ. On the other hand, active prechamber systems have numerous drawbacks that would prevent their wide use in shipping. The implementation of the injection system increases engine complexity. The maintenance guidelines and the sensitivity of the components reduce the ship’s availability and engine robustness, while a passive pre-chamber allows for long periods of operation and lower costs, in terms of initial investment and maintenance.
DF engines are preferred by shipowners, as these engines provide greater fuel-flexibility, allowing the use of several fuel blends, and as they can also work with diesel and MGO [
35]. Further, existing compression-ignition engines can easily be retrofitted to work in a DF mode. DF engines use a small amount of high-reactivity fuel to trigger ignition and sustain combustion of the less-reactive fuel used for the main combustion. Using low-carbon fuels, CO
2 reduction can be achieved. However, converting compression-ignition engines to allow the use of low-reactivity fuels in a dual-fuel mode inevitably compromises performance. In fact, the typically high compression ratio, which is not ideal for the premixed combustion of low-cetane fuels, in addition to the shape of the combustion chamber, prevents the full utilization of these fuels’ characteristics. Additionally, using secondary diesel injection instead of a spark plug always results in late combustion-timing. Furthermore, the different combustion mode, operating conditions, and fuel characteristics can lead to a higher formation of NOx and unburned hydrocarbons (HC), as compared to traditional compression-ignition engines, especially under low-load conditions.
High-Pressure Dual-Fuel (HPDF) engines use the direct injection of diesel and methane into the combustion chamber at pressures exceeding 30 MPa, concentrating the charge locally. Methane-slip is not relevant, because only air goes into the crevice regions, avoiding the premixing step, and high efficiencies are achieved, mostly at low loads. Due to the quick duration, the unburned hydrocarbons amount to less than 1 g/kWh [
36]. However, to comply with the NOx levels in Tier III, these engines need Selective Catalytic Reduction (SCR) or Exhaust Gas Recirculation (EGR) [
37]. The main drawbacks that limit the use of these engines are associated with their costs, which are between 15% and 40% higher, when compared to LPDF and LBSI engines [
38].
Further critical issues are related to the fuel used: the LNG injection system requires cryogenic pumps that operate continuously [
27], while the use of hydrogen could lead to high temperatures close to the injector holes, reducing service time [
39].
LPDF is nowadays the most widely adopted solution [
28], because it offers high reliability (especially for genset applications) and satisfies NOx Tier III emissions standards. Also, PM emissions are significantly reduced. LPDF engines operate based on the Otto cycle, utilizing a low-reactivity fuel for port-fuel injection (generally, natural gas) and a high reactivity fuel for pilot injection (e.g., diesel or hydrotreated vegetable oil (HVO)). Pilot injection plays a key role in engine performance and shows a direct proportionality with NOx emissions [
40]. The main challenges are primarily linked to low-load conditions, when small amounts of pilot are injected, lower hotspots are created, and premixed combustion results become unstable; as a consequence, large amounts of unburned hydrocarbon are generated. In addition, the premixed phase generates bypass during valve overlap and accumulation of fuel in the crevices [
28].
The present paper investigates the influence of diesel injection strategies on the performance and emissions of a single-cylinder prototype compression-ignition engine for marine applications, retrofitted to work as an LPDF engine with methane fuel. In [
41], a continuous gas-flow valve was adopted, providing reductions in CO
2 emission up to ~22%. On the other hand, HC emissions were found to be an order of magnitude higher than in the diesel reference case, partially negating the benefits in terms of GHG emissions, considering the high GWP of methane. Such an increase is partly attributable to the change in the combustion mechanism, and partly to the continuous injection system in the intake manifold, which leads to an increase in the methane slip through the valve overlap. In this paper, a more efficient injection is proposed in order to limit methane-slip phenomena. Two different methane-injection systems were tested: a mass flow controller enabling continuous-mode gas feeding, and a Solenoid-Operated Gas Admission Valve (SOGAV) for marine applications, the latter allowing a phased NG (Natural Gas) injection. Experimental tests were focused on partial-load conditions, which are critical for DF engines, as diesel trigger-injection is short, resulting in low injection-event repeatability and a high local air-to-fuel ratio, resulting in low combustion efficiency and high HC emissions.
2. Materials and Methods
The experimental effort was carried out on a prototype single-cylinder, large bore, 4-stroke engine used for genset/marine propulsion applications, which was derived from the production multi-cylinder Isotta Fraschini IF1700 series. CNG was used as the low-reactivity fuel, while a Common Rail system, operating at an injection pressure of up to 160 MPa, properly dosed the diesel trigger-injection, keeping the CNG/diesel mass ratio constant at 4. The characteristics of engine are shown in
Table 2;
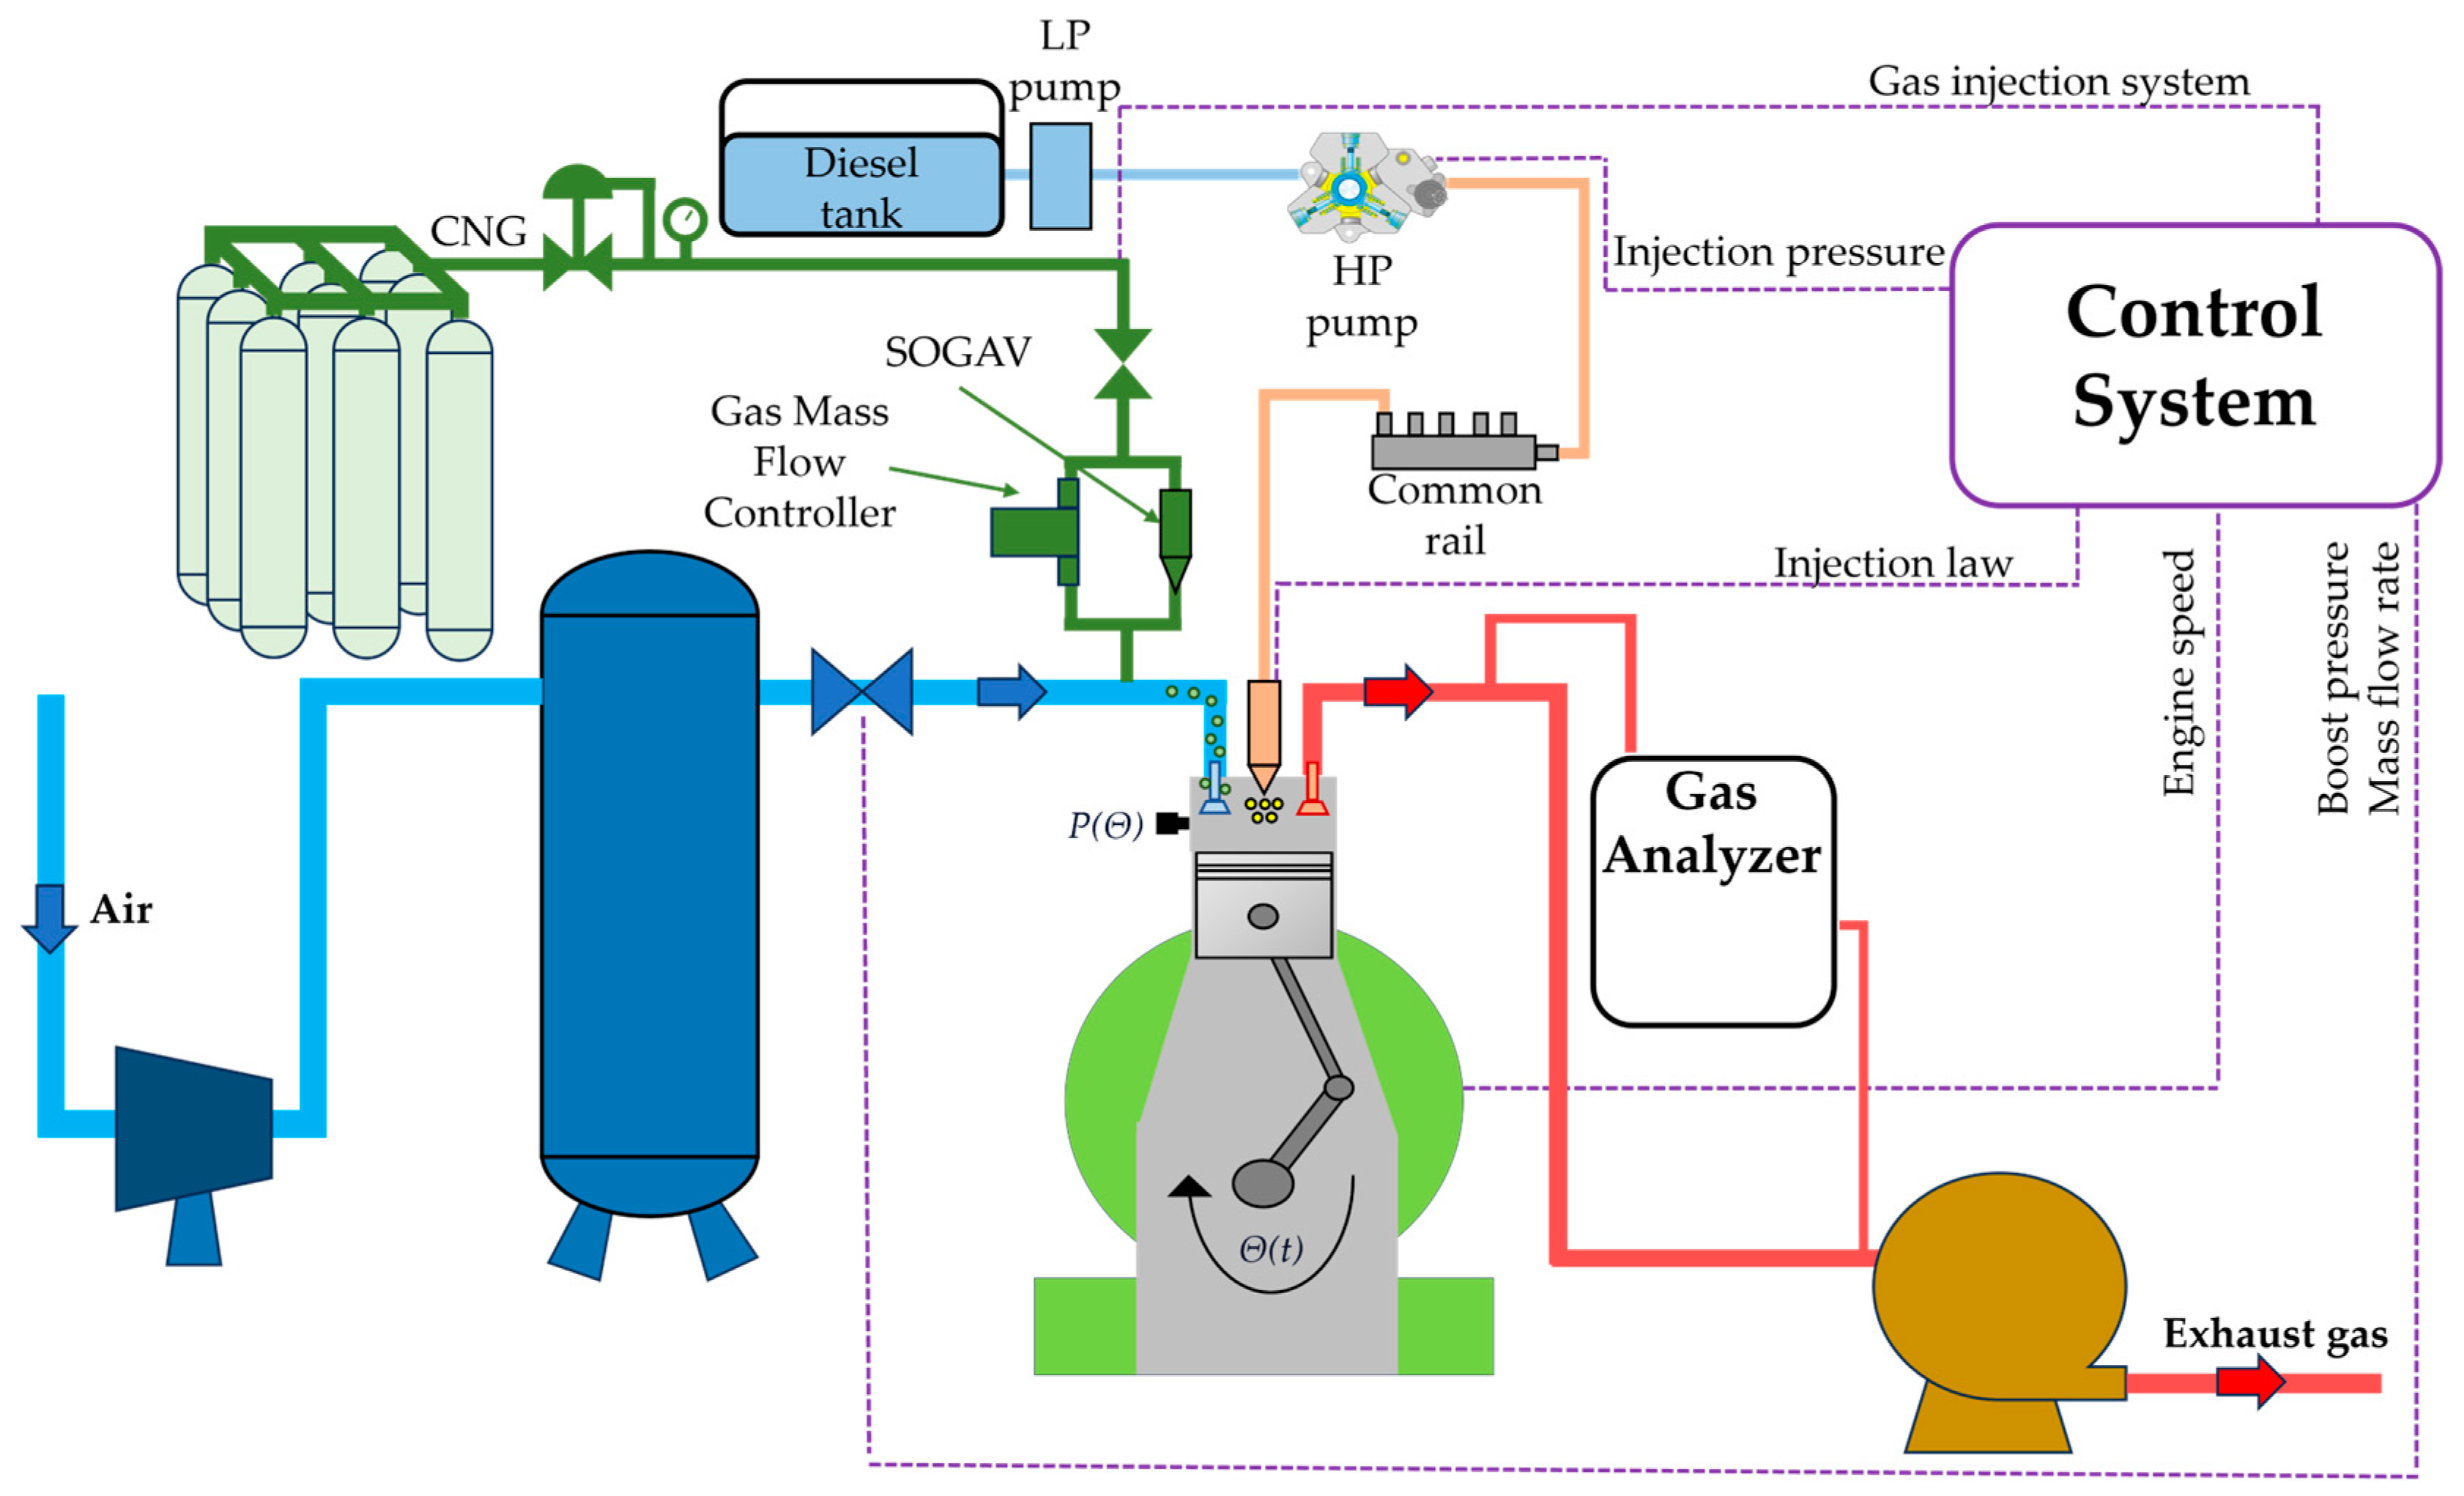
Figure 1 represents a sketch of the experimental set-up.
Boost pressure was provided by an external volumetric air compressor; air mass flow was monitored by a fan anemometer coupled with an actuator system for the boost regulation. The in-cylinder pressure trace was acquired by a high-speed data acquisition unit, using a quartz piezometric transducer coupled with a shaft encoder. The sampling resolution was 0.1 CAD (Crank Angle Degree) between −90 to 90 CAD ATDC (After Top Dead Centre) and 1 CAD out of this interval. For each test point, 250 consecutive cycles were acquired.
Two different gas-injection systems were tested: a mass flow controller enabling continuous-mode gas feeding, and a Solenoid-Operated Gas Admission Valve (SOGAV) for marine applications, the latter allowing a phased NG injection.
The first system included a mass flow controller (range 0–150 slm N2 equivalent) used to adjust gas flow rate (settling time standard 0.6 s), enabling continuous-mode gas feeding, and a pressure regulator ensuring an injection pressure 0.35 MPa higher than the intake pressure. NG was introduced continuously in the intake port, immediately upstream of the inlet valves.
In the second setup, a SOGAV for marine applications, allowing phased NG injection, was installed. It was a 6-hole, 30 mm in diameter, fast-response valve (time of full opening/closure 0.0020 s max after trigger signal). A dedicated calibration Engine Control Unit (ECU) allowed for the control of injection phasing and duration.
Table 3 reports test conditions. Tests were performed at a fixed speed of 1500 rpm and 0.84 MPa Brake Mean Effective Pressure (BMEP), corresponding to about 30% of maximum load. These conditions appear to be particularly critical, as the combustion characteristics of dual-fuel diesel–NG engines deteriorate at lower load conditions. An increase in methane content decreases thermal efficiency because the in-cylinder pressure peak lowers and the ignition delay rises, compared to the diesel reference case. Furthermore, using high substitution rates with a partial load can result in excessively short and unstable diesel injection events which, in turn, worsen the stability of the natural gas combustion [
42]. Full diesel (FD) combustion operations were set as the reference, considering the minimum BSFC condition, and corresponding to a single-injection strategy of −24 CAD ATDC start of injection (SOI) and 100 MPa injection-pressure. For both the DF and FD conditions, the air-to-fuel ratio λ was 1.5.
In order to optimize DF engine consumption and HC emissions, three different diesel trigger-injection strategies were tested: single, double (pilot+main), and triple (pilot+pre+main) injection; injection pressure was set at 80, 100, and 120 MPa, respectively. A sweep on diesel SOI was performed from −40 CAD ATDC to −20 CAD ATDC with a step of 5 CAD.
Engine-out exhaust gas emissions were measured: a Flame Ionization Detector (FID) analyser (accuracy ±1%) was used for HC, a cold extractive Infrared (IR) gas analyser (accuracy ±2%) measured CO (carbon monoxide) and CO2, NO concentration was detected by a Non-Dispersive Ultraviolet (NDUV) Detector (range: 0–5000 ppm, accuracy ±3% of reading or 15 ppm). An opacimeter allowed for the estimation of particulate matter concentration (measurement value resolution 0.01% or 0.001 m−1).
Since diesel and NG have different chemical and physical characteristics, an equivalent consumption was defined to allow a proper comparison between FD and DF conditions, considering the different Lower Heating Values (LHV), (42.6 MJ/kg for diesel, 50 MJ/kg for NG). The equivalent brake-specific consumption
was calculated according to Formula (1).
where
QDiesel and
QNG are the diesel and NG mass flow rates, respectively.
Further, Brake Thermal Efficiency
BTEDF, considering an NG mass concentration of 80%, was estimated with the following, Equation (2):
To maximize the benefits of phased NG injection a sweep on injection phasing was performed over a complete crankshaft rotation, keeping the fuels’ flow rate fixed (2 kg/h of diesel and 7.7 kg/h of NG). Diesel injection pressure was 80 MPa, and a double-injection strategy (pilot + main) was set with SOImain of −30 CAD ATDC at a boost pressure of 0.15 MPa. The NG duration-of-injection was 30 CAD. The tests were performed at a fixed engine speed of 1500 rpm. A load of 0.9 MPa BMEP was set for the NG SOI of 0 CAD ATDC.
Figure 2 shows the trends of the HC (blue line + triangle symbol) emissions and BMEP (green line + circle symbol) as function of NG SOI; for an easier reading of the data, intake (blue) and exhaust (red) valve lift profiles are also represented. A maximum engine load and a minimum of HC emissions are achieved when the NG SOI condition maximizes the amount of natural gas trapped in the combustion chamber at exhaust valve closure. Due to the delay between the injector opening and the actual flow of gas through the intake valve seats, which is primarily influenced by injector and intake manifold dynamics, an advance in NG SOI relative to intake valve opening was expected. Tests were performed with a step of 60 CAD in the interval between −240 CAD ATDC and 240 CAD ATDC. Starting from SOI of 240 CAD ATDC, a tighter step of 30 CAD was set to investigate the influence of the intake valve being opened-up to maximum lift. After a first stage with almost-constant levels, a linear reduction in HC was observed at 240 CAD ATDC with a minimum at 330 CAD ATDC, which was about 15 CAD after the start of the opening of the intake valve.
By relating the HC reduction to the valve lift, a delay of about 120 CAD is noted between the SOI (240 CAD ATDC) and the opening of the intake valve. Considering a full-opening time of the SOGAV of 0.002 s, corresponding to 18 CAD, a delay of about 100 CAD between the full opening of SOGAV and the NG’s entry into the combustion chamber through the intake valves was found. The same 120 CAD shift exists between the optimal SOI (330 CAD ATDC), which minimizes HC and maximizes BMEP, and the point of maximum valve-lift (−270 CAD ATDC). Further delaying the SOI, after the optimum HC, emissions increase up to a maximum at −240 CAD ATDC. Based on the previous assumption, NG charge reaches the combustion chamber 120 CAD after NG SOI, at −120 CAD ATDC, corresponding to the closure of intake valves, maximizing the methane slip through the intake–exhaust valve overlapping at the next cycle. Moving NG SOI toward the TDC results in a progressive reduction in HC emissions, up to a constant value.
3. Results
The aim of this study is to evaluate the efficacy of a simple retrofitted system for a diesel marine engine to dual-fuel methane–diesel as a way to reduce GHG emissions in the short-to-medium term. In a previous work [
41], a reduction in CO
2 emission up to ~22% was demonstrated with a continuous gas-flow valve. On the other hand, HC emissions resulted which were an order of magnitude higher than in the diesel reference case, partially negating the benefits in terms of GHG emissions, considering the high GWP of NG. The switch from a continuous to a phased injection system can contribute to reductions in the emissions of both CO
2 and HC. In the next subsection, a comparison between the two injection systems will be provided before the advantages of DF combustion over full diesel mode are explored.
3.1. Comparison between Continuous and Phased NG Injection Systems
A comparison between continuous and phased NG injection systems at different injection pressures (80, 100, and 120 MPa) and using different strategies was performed to estimate differences in fuel consumption and unburned hydrocarbons.
Figure 3 shows the trends of BSFC
eq for both NG injection systems and three different diesel injection strategies, Single (S), Double (D), and Triple (T), at 100 MPa injection pressure, and as function of diesel SOI
main. A like-parabolic trend was found for all investigated strategies and injection systems, with minimum fuel consumption points found at SOIs between −35 and −25 CAD ATDC. Higher values were recorded at the extreme SOIs, as ignition condition worsened; SOIs which are too advanced prolong ignition delay, increasing the diesel premixed combustion stage; SOIs which are too late move the combustion event toward the expansion stroke, to the detriment of the final stage of combustion. Regardless of injection strategies, switching from continuous to phased NG injection resulted in a significant reduction in fuel consumption. The diesel injection strategy significantly influences the combustion process in the case of continuous NG flow; the multiple injections allow the diesel start of combustion (SOC) to be advanced, favouring a more stable NG combustion. Differences in SOC predominantly affect the initial phase of combustion, which is associated with the formation of flame kernels and the propagation of the methane flame front. This mechanism has an impact on the continuation of natural gas combustion, increasing stability and reducing consumption. Average reductions of 5 g/kWh and 10 g/kWh were recorded with double and triple injection, as compared to single injection.
These differences were found to be minimal in the case of phased natural-gas injection, which is already characterized by a less delayed and more stable combustion compared to continuous injection. Comparing NG continuous and phased injection, a reduction in fuel consumption is apparent: larger differences were found for the single-injection strategy, with improvements in fuel economy of between 8% and 11%; similarly, using SOGAV results in a fuel consumption reduction from 7% to 9.7% and from 5.4% to 7.2% in the cases of the double- and triple-injection strategies, respectively. The increase in fuel consumption difference moving from triple to single injection strategies is related to the lower sensitivity of phased injection to multiple-injection strategies. Similar trends were found at diesel injection pressures of 80 and 120 MPa.
Figure 4 shows HC emissions for both NG injection systems and three different diesel injection strategies as function of diesel SOI
main. An almost constant reduction of 50% in HC was achieved with phased injection, independent of injection strategy. This reduction is mainly due to optimized NG-injection phasing. In fact, considering SOGAV mechanical delays and the travel time of the NG in reaching the intake valves from the nozzle, the gas reaches the combustion chamber at the point of maximum valve-lift, when the exhaust valve is already closed, thus maximizing NG introduction in the combustion chamber and reducing methane-slip during the scavenging phase. The multiple injection strategies do not provide relevant advantages in HC reduction.
The phased injection system allows for the minimization of GHG emission, improving both fuel consumption and HC emissions, compared to the continuous-injection mode. For this reason, in order to assess the possible advantages and constraints over full diesel combustion in the following subsections, the influence of different diesel injection parameters on SOGAV dual fuel (DF) combustion will be discussed, taking as reference a full diesel condition (FD).
3.2. Effect of Diesel Injection Strategy on Combustion and Emissions
In order to evaluate the effects diesel multiple injection on the DF combustion process and exhaust emissions, experimental tests were carried out for different injection strategies, with a sweep on main SOI.
Figure 5 shows the in-cylinder pressure cycle (top), instantaneous rate (solid line) and integral (dash line) heat release (middle), and injection energization current (bottom) for three different injection strategies, single, double, and triple, at 80 MPa injection pressure, −35 CAD ATDC SOI
main.
As expected, increasing the number of injections per cycle results in a shorter ignition delay, advancing the start of the combustion of the main, with a consequent increase in in-cylinder pressure peak.
Observing the rate of heat release (ROHR) curve, a slight increase can be observed up to values lower than 10 kJ/CAD, corresponding to the ignition of diesel fuel, followed by a Gaussian-like profile due to the premixed combustion of the gaseous fuel. The ROHR profile of a single-injection strategy provides a higher peak, compared to multiple injections, as the delayed start of combustion results in a larger amount of diesel autoignition with a higher instantaneous heat release during the early stage of the NG premixed combustion. As a consequence, a single injection ROHR profile is tighter, with a higher peak.
Regarding the IHR (instantaneous heat release), no significant variations are observed in correspondence with the secondary injections’ combustion; however, there is a noticeable reduction in the combustion speed of the main injection as the number of injections per cycle increases. This reduction is due to the smaller amount of diesel fuel that auto-ignites during the premixed phase when multiple injections are used. As previously discussed, the SOC in the case of a single injection is slightly delayed compared to the double and triple injections; however, the quicker combustion speed ensures that the combustion durations are similar for all injection strategies.
An interesting observation arises from comparing the IHR trend with the injection-current profiles (
Figure 5, bottom). It is evident that the main injections are all phased with each other, while the secondary injections present a dwell time (defined as the period between the end of one injection and the start of the next) of 5 CAD and have the same duration, accounting for 10% of the total injected-fuel mass. This results in a reduction in the main injection duration as the number of injections per cycle increases.
This reduction has an effect on the tail end of the NG combustion, as seen in the final stage of the IHR, where it is clear that the single injection reaches the end of combustion earlier than do the double and triple injections.
3.2.1. Effects of Diesel Injection Strategy on DF Combustion Process and Fuel Consumption
With the aim of optimizing diesel injection timing, a sweep on SOI for each investigated injection strategy was carried out to characterize the effect on combustion parameters.
Figure 6 shows the characteristic combustion angles as a function of the main SOI, namely, MFB
10 (top), MFB
50 (middle), and 2xMFB
10–50 (bottom), for three injection strategies in DF mode; diesel reference condition is shown with black diamond symbol and a dashed line is used to make easier the comparison with DF mode.
The results refer to a 100 MPa injection pressure; similar trends were found at 100 and 120 MPa injection-pressure values. The influence of injection pressure on the combustion process and emissions will be discussed in
Section 3.3.
As expected, even when advancing the diesel SOImain compared to FD mode, the MFB10 of the diesel reference is far in advance, due to the difference between diffusive FD and the premixed DF combustion mechanisms. Further, despite SOImain variations over a wide CAD range (−40 CAD ATDC, −20 CAD ATDC), the SOC changes by only a few degrees (between 3 and 5 CAD), resulting in a late NG ignition, compared to the optimal condition that would be achieved with a spark plug. A slight improvement is obtained by adopting multi-injection strategies that reduce the induction time. This effect is more evident for injection strategies with increased delays. By advancing the SOI, the influence of the multiple injections is reduced due to the increase in mixing time and the progressive increase in the proportion of the premixed diesel combustion.
The MFB50 trends are coherent with MFB10; the optimum SOI is at −30 CAD ATDC, corresponding to about 10 CAD ATDC in the case of triple injection, about 8 CAD later than the FD reference case.
Despite the difference in MFB10 and MFB50, combustion duration (2xMFB10%–50%), curves are almost overlapped, indicating a quicker NG combustion in the late stage in the case of the single-injection method. This behaviour can be attributed to the longer duration of single injection, supporting the combustion and thus reducing the duration of the late stage of combustion. For SOIs between −30 and −20 CAD ATDC, the combustion duration is comparable to that of the FD reference mode; despite the longer ignition delay, the NG-premixed flame propagates and is stable along the expansion stroke, while FD mixed controlled combustion suffers in the late stage of combustion.
Figure 7 shows the trends of equivalent brake-specific consumption BSFC
eq, as defined in
Section 2. The results refer to a 100 MPa injection pressure for different injection strategies and main SOIs. The high replacement ratio for NG–diesel allows for the reduction of specific consumption due to the smaller work adsorbed by the diesel high-pressure fuel pump and the higher heating value of the NG. For all investigated injection strategies, a minimum fuel consumption was achieved of between −35 and −30 CAD ATDC, with improvement between 14.0 and 14.5% compared to FD reference. The optimum value was recorded at −30 CAD ATDC SOI with single injection (230.3 g/kWh), with a gain of 14.5% compared to FD.
3.2.2. Effect of Diesel Injection Strategy on DF Exhaust Emissions
Switching from FD mixed-controlled to DF premixed combustion impacts upon pollutant-exhaust emissions. Controlling NG combustion phasing by means of diesel injection strategy can significantly affect the emission levels.
Figure 8 shows gaseous species and PM emissions as functions of main SOI for different injection strategies: NOx, HC, CO, and PM. The FD reference condition is shown with a black diamond symbol, and a dashed line is used to make easier the comparison with DF mode.
The NOx emissions increase as the SOI increases, up to a maximum SOI between −35 CAD ATDC for double- and triple-injection strategies and −30 CAD ATDC for single injection; multiple injections reduce the induction time of the main injection, advancing the SOC; as a consequence, the SOI corresponding to the maximum pressure peak, which corresponds to the maximum temperature condition, is advanced. Further advancing the start of injection reduces NOx emissions; as the injection is advanced, the backpressure in the combustion chamber decreases, resulting in a longer ignition delay and a progressive increase in the amount of premixed diesel that auto-ignites. When this portion becomes significant, further increases in SOI can result in a delay in the start of combustion, leading to reductions in peak pressure and combustion temperature, which in turn result in a decrease in NOx emissions. The highest value, of about 17.2 g/kWh, was recorded with triple injection, with a −35 CAD ATDC SOI.
FD NOx emissions (~10.4 g/kWh) were significantly lower than DF. This behaviour can be explained with different combustion mechanisms linked to FD mixed-controlled and DF premixed combustion. NOx formation in internal combustion engines is strongly dependent on temperature, as it increases chemical reaction rates. In FD mode, the air–fuel mixture is heterogenous and globally diluted, and local temperature peaks are confined in rich mixture combustion zones, while in the peripheral regions of the combustion chamber, the high air–fuel ratio keeps the temperature low. In DF mode, the air–NG mixture is homogeneous, the dilution is slightly lower when compared to FD, and premixed combustion results in a higher in-cylinder temperature.
In DF mode, HC levels are significantly higher than in the diesel case due to the different combustion mechanism. Gaseous fuel, like NG, tends to have greater diffusion in air. Additionally, premixed combustion is subject to blow-by phenomena and partial combustion. Ignition of NG by diesel pilot injection does not allow full control of the ignition start and it is always delayed compared to spark-plug ignition. Consequently, the combustion centre is later than would be optimum, with an inevitable increase in HC and CO. Conversely, in FD mode, HC are almost negligible. The lowest HC values were achieved at earlier SOIs due to the improved air–fuel mixture.
A decreasing trend with increasing SOI, advancing up to −35 CAD ATDC, has been found for HC emissions, for all investigated strategies and injection systems, with a minimum found at SOIs between −35 and −30 CAD ATDC. The lowest emissions, of 2.9 g/kWh, were recorded at −35 CAD ATDC SOI for the triple-injection strategy. Further advancing the SOI, up to −40 CAD ATDC, results in a slight increase in CO, as diesel combustion deteriorates due to a too-large amount of premixed combustion with higher SOC variability. CO emissions were lower compared to the FD reference (4.7 g/kWh).
Smoke opacity is shown in
Figure 8. DF engines can significantly reduce smoke emissions. Compared to the FD reference (1.43%), at most advanced diesel SOI
main, DF test points exhibited minimal levels close to zero, independent of the injection strategy. This is primarily due to the gas’s low propensity to generate soot, in contrast to diesel fuel, which contains paraffinic chains that promote particulate matter (PM) formation. Additionally, DF lean premixed combustion facilitates soot oxidation produced from liquid fuel combustion.
The growing interest in the transition to dual-fuel engines which replace traditional diesel engines is motivated by the reduction in CO
2 emissions. The use of drop-in fuels with lower carbon content such as NG facilitates GHG mitigation in the near-to-medium term.
Figure 9 shows the CO
2 emissions trends for each investigated strategy as a function of diesel main SOIs.
All DF CO2 emissions were lower than FD reference of 954 g/kWh. Using single and double injection, the lowest values were recorded at −25 CAD ATDC SOI with gains of 15.8% and 21.9% compared to the diesel reference, while the triple-injection strategy allows for a greater reduction, with the minimum value, of about 745 g/kWh, recorded at −25 CAD ATDC SOI, representing a gain of 21.9%.
3.3. Effect of Diesel Injection Pressure on Combustion and Emissions
In order to evaluate the diesel injection pressure’s effect on the DF combustion process and exhaust emissions, experimental tests were carried out for different injection strategies, with a sweep on main SOI.
Figure 10 shows the in-cylinder pressure cycle (top), instantaneous rate (solid line) and integral (dash line) heat release (middle), and injection energization current (bottom), adopting a double-injection strategy, for three different injection pressures: 80, 100, and 120 MPa, at −30 CAD ATDC SOI
main.
Increasing injection pressure provides a better spray atomization, with an increase in air–fuel mixing, resulting in a shorter ignition delay. This behaviour is confirmed by in-cylinder pressure trends: an increase in injection pressure advances the SOC, with a consequent increase in in-cylinder pressure.
Enhanced injection pressures promote stronger atomization, reducing the lift-off length, and leading to a more stable flame kernel formation that accelerates the ignition of the NG–air mixture, along with a higher heat release peak and shorter duration, as evident by ROHR and IHR analysis.
3.3.1. Effects of Diesel Injection Pressure on DF Combustion Process and Fuel Consumption
With the aim of investigating the effect of diesel injection pressure on DF combustion parameters, a sweep on SOImain for each investigated injection strategy was carried out at different injection pressures: 80, 100, and 120 MPa.
Figure 11 shows characteristic combustion angles as function of diesel injection pressure, namely, MFB10 (top), MFB50 (middle), and 2xMFB
10–50 (bottom), for three injection strategies in DF mode; the results refer to the optimum SOI
main, minimizing the fuel consumption. The FD reference condition is shown with a black diamond symbol and a dashed line is used to make easier the comparison with DF mode.
As discussed in
Section 3.2.1, the DF early stage of combustion is delayed compared to FD mode; this behaviour is confirmed even at the maximum injection pressure of 120 MPa. As expected, an increase in diesel injection pressure results in a shorter ignition delay, advancing the early stage of NG combustion. Multiple injections contribute to an increase in the autoignition tendency, with a further advance in MFB10. The most advanced MFB10 is achieved at 120 MPa pressure (3.6 CAD ATDC). A similar trend is observed for MFB
50.
A more advanced centre of combustion results in a shorter combustion duration. At 80 MPa injection pressure, the DF combustion duration is higher than in the FD reference case. By increasing the injection pressure, this behaviour is inverted: at 120 MPa, the DF combustion is shorter than in the FD reference case. It is worth pointing out that the injection pressure of the FD reference case is 100 MPa, and the combustion duration of DF at 100 MPa injection pressure is almost the same. In other words, as aforementioned in
Section 3.2.1, despite the longer ignition delay, the NG-premixed flame propagates stably along the expansion stroke, while the FD mixed controlled combustion suffers in the late stage of combustion.
Figure 12 shows the trends of equivalent brake-specific consumption BSFC
eq, as defined in
Section 2. The results refer to the optimum SOI
main, minimizing the fuel consumption for different injection strategies and pressures.
Despite the improvements in the early stage of combustion linked to the better atomization of diesel spray triggering the combustion of NG, increasing injection pressure does not result in a corresponding reduction in fuel consumption, with the exception of the single-injection strategy. An opposite trend was found for multiple-injection strategies. This behaviour can be ascribed to a too-short duration of main injection when the pressure is increased. In fact, due to the high substitution rate (80%w NG 20%w diesel) and low-load condition, diesel injection is small; increasing injection pressure while keeping the diesel mass rate constant results in a further duration reduction, which can worsen the NG combustion stability within the early stage of combustion.
The minimum BSFCeq recorded was 219.1 gDiesel_eq/kWh, achieved with triple injection at 80 MPa injection pressure, with a reduction of about 20.7% compared to FD reference (276.3 gDiesel_eq/kWh).
3.3.2. Effect of Diesel Injection Pressure on DF Exhaust Emissions
Diesel injection pressure impacts exhaust emissions: better atomization of diesel fuel reduces HC emissions emerging from the combustion of diesel fraction. Additionally, it affects the combustion timing of NG, allowing for greater ignition advances due to the reduced diesel induction time. The different combustion timing significantly impacts NOx emissions because it alters the in-cylinder pressure peak and locally changes the air–fuel ratio. A better atomization promotes the homogenization of the diesel–air mixture on one hand, and on the other, it favours diesel fuel autoignition, reducing the lift-off length. Consequently, flame nuclei will be located closer to the nozzle, and towards the centre of the combustion chamber.
Figure 13 shows gaseous species and PM emissions as functions of injection pressure for different injection strategies: NOx, HC, CO, and PM. The results refer to optimum SOI
main, minimizing the fuel consumption; the FD reference condition is shown with a black diamond symbol, and a dashed line is used to make easier the comparison with DF mode.
NOx emissions exhibit an increasing trend with the diesel injection pressure, which is consistent with observations of the characteristic combustion angles discussed in
Section 3.3.1: higher diesel injection pressure allows for earlier combustion timing, resulting in increased pressure peaks and temperatures in the combustion chamber. NOx emissions in FD mode are lower than in DF mode, except at 80 MPa injection pressure, where they are comparable.
Maximum NOx emissions of 17.3 g/kWh were achieved at 120 MPa DF, in the triple-injection strategy and were about 60% higher than the FD reference value (10.5 g/kWh).
As aforementioned in
Section 3.2.2, H,C levels were significantly higher than in the FD case due to the different combustion mechanism. Increasing injection pressure promotes a better combustion phasing with a reduction in HC found when multiple-injection strategies were adopted, while single injection provided an almost constant trend.
In DF mode, CO emissions were lower compared to the FD reference. At 100 and 120 MPa, variations in strategy are negligible, with values averaging around 3 g/kWh, while at 80 MPa, a higher value is observed with triple injection, which is closer to FD reference emission of 4.5 g/kWh.
PM emissions in the DF mode are consistently lower than in the FD reference case: NG lean premixed combustion prevents soot formation and facilitates the soot oxidation produced from diesel-fuel combustion. With increasing injection pressure, a slight increase in PM emissions was recorded; higher pressures improve atomization, with a consequent reduction in ignition delay, which in turn results in a lower local air-to-fuel ratio, promoting soot formation. Additionally, increases in pressure and temperature can promote the nucleation and coalescence of soot particles.
Figure 14 shows CO
2 emissions as function of injection pressure for different injection strategies. As expected, the data reveal a consistent correlation with BSFC
eq. Notably, the single injection shows almost-constant CO
2 values (765 g/kWh), with reduction of about 19% compared to the FD reference. The lowest CO
2 emissions were achieved with double and triple injection at 80 MPa, resulting in reductions of about 27% and 28.5%, respectively.
3.4. Evaluation of Optimum Point Compared to Diesel References
In order to effectively estimate the effort of DF-NG combustion in GHG reduction it is important to weigh the contributions of all climate-altering gases. The GWP allows a comparison of the impacts on global warming of different gases emitted into the atmosphere. Specifically, the GWP provides a measure of how much energy the emissions of one ton of a gas will absorb over a specific period of time (generally 100 years), compared to the emissions of one ton of carbon dioxide (CO2).
Table 4 provides a comparative analysis of the DF optimum condition (minimum BSFC
eq) and the FD reference. The table includes BSFC
eq, HC, CO
2, and GWP. The CO
2eq is a standardized measure used to compare the emissions of different greenhouse gases based on their global warming impact relative to CO
2. To perform a simplified GWP estimation, the exhaust emissions of the HC were attributed to the incomplete combustion of NG (neglecting the contribution from the diesel fraction during DF operation), and for this, the GWP of methane was considered. The impact of methane emissions was estimated to be 28 times that of carbon dioxide in 100-year time-horizon [
43]. Despite a reduction in CO
2 emissions of 28.5%, the reduction in GWP is only 2.9%. This result emphasizes the need for an optimization of DF marine engines, limiting exhaust methane emissions.


