1. Introduction
The electric vehicle sector is experiencing robust growth, with electric vehicles increasingly becoming the primary mode of transportation globally, leading to an expanding market size year after year. Research into optimizing the orderly charging and discharging processes of electric vehicles represents a pivotal direction in advancing electric vehicle technology.
Ref. [
1] describes the international standards, technical challenges, impact and prospects of electric vehicles, and provides a detailed description and analysis. This paper takes an in-depth look at the current situation and challenges of the EV market, and ref. [
2] provides a detailed overview of the existing EV charging infrastructure and outlines the future development trends in this field. A refined load demand response model is constructed in ref. [
3]. The 800 v electric vehicle system has the advantages of a fast charging speed, high power density, low energy loss, etc. Ref. [
4] puts forward future trends, such as sustainable development and the application of intelligent technology.
In ref. [
5], electric vehicles (EVs) have a significant impact on the charging demand of resistance low-voltage distribution networks, which may lead to overload problems with the increase in the number of EVs. In the distributed power system, ref. [
6] combines topological reconstruction with vehicle-to-grid technology to build a model that includes both electric vehicles and distributed power sources, thus enhancing the stability and elasticity of the power grid. Refs. [
7,
8,
9,
10] explore the charging and discharging patterns of electric vehicles (EVs) and examine the impacts of shifts in vehicle owner behavior on the power grid. Ref. [
11] establishes and solves the optimization model aiming at the minimum operating cost of the system. Additionally, refs. [
12,
13,
14] propose a novel reliability-focused approach to assessing the integration effects of EVs and renewable energy resources within a restructured power system.
Ref. [
15] introduces an approach for optimizing electric vehicle (EV) charging that emphasizes a hierarchical structure and user satisfaction. This optimization algorithm efficiently addresses routing and charging issues for multiple EVs [
16,
17,
18]. Ref. [
19] presents a model based on mixed integer linear programming, utilizing a virtual price mechanism to enhance energy efficiency within the power grid. This model also reduces charging and discharging costs for EVs and lowers driving costs for users. The research findings indicate that the model effectively balances energy distribution and load to meet the travel demands of EVs.
Moreover, in ref. [
20], a cluster-based model is proposed specifically for charging fleets of electric vehicles within a single parking facility. This model is designed to significantly reduce energy costs and enhance the overall efficiency of charging operations. Ref. [
21] presents an intelligent strategy for electric vehicle charging and discharging, utilizing decision functions integrated into a smart grid framework. Additionally, ref. [
22] introduces a real-time control approach to manage the charging and discharging of electric vehicles. Ref. [
23] proposes a two-layer optimization framework based on the Stackelberg leader and follower model to manage three-level energy management strategies to coordinate EV charging. Based on the group price response behavior of electric vehicles, ref. [
24] proposed a spatio-temporal optimal pricing strategy of CSs. Ref. [
25] establishes a multi-objective optimization model of power grid with the total operating cost and the minimum amount of renewable energy abandoned air as the objectives. Ref. [
26] proposes a two-level tiered toll scheduling method that includes an online booking system (OBS) and a pricing-based charging control system (PCCS).
As research on electric vehicle (EV) charging load forecasting progresses, a comprehensive approach considering both spatial and temporal distribution is becoming a future research trend. However, current modeling methods for predicting the spatial and temporal distribution of EV loads remain relatively crude. They often overlook the detailed travel distribution of EVs and the diversity of charging locations, and the prediction methods are not yet fully developed. The existing reference primarily emphasizes the economic benefits for users and power grids, lacking in-depth research on the efficient utilization of transportation energy and the interactive development of EV charging and discharging, transportation energy generation, and electricity consumption across different regional loads and power grids. Therefore, it is essential to broaden the research scope and intensify the focus and exploration in the transportation sector to foster innovation and advancement in related technologies and strategies.
This paper explores load forecasting and strategies for the systematic management of electric vehicle (EV) charging and discharging. The main contributions are outlined below.
Firstly, the results derived from the parking generation rate model might differ from future local vehicle prediction data. Typically, there is a discrepancy between the construction standards for parking spaces and actual parking demand. Thus, this paper makes necessary adjustments to the parking demand estimated by the parking generation rate model.
Secondly, based on the driving and parking behaviors of EVs, this paper proposes a Monte Carlo simulation approach to forecast EV charging load, emphasizing spatial and temporal distribution characteristics.
Finally, the current lack of coordination in EV charging exacerbates the strain on the power grid, particularly during peak load periods. This paper selects two objective functions, namely the lowest system operating cost and the least load fluctuation deviation and proposes an organized approach to charging and discharging EVs, designed to minimize operational costs and reduce fluctuations in load while accounting for time-of-use electricity pricing. The strategy aims to lower power generation expenses and stabilize load variations, effectively achieving peak load reduction and off-peak load enhancement.
2. Space–Time Distribution Prediction of Electric Vehicle Charging Load
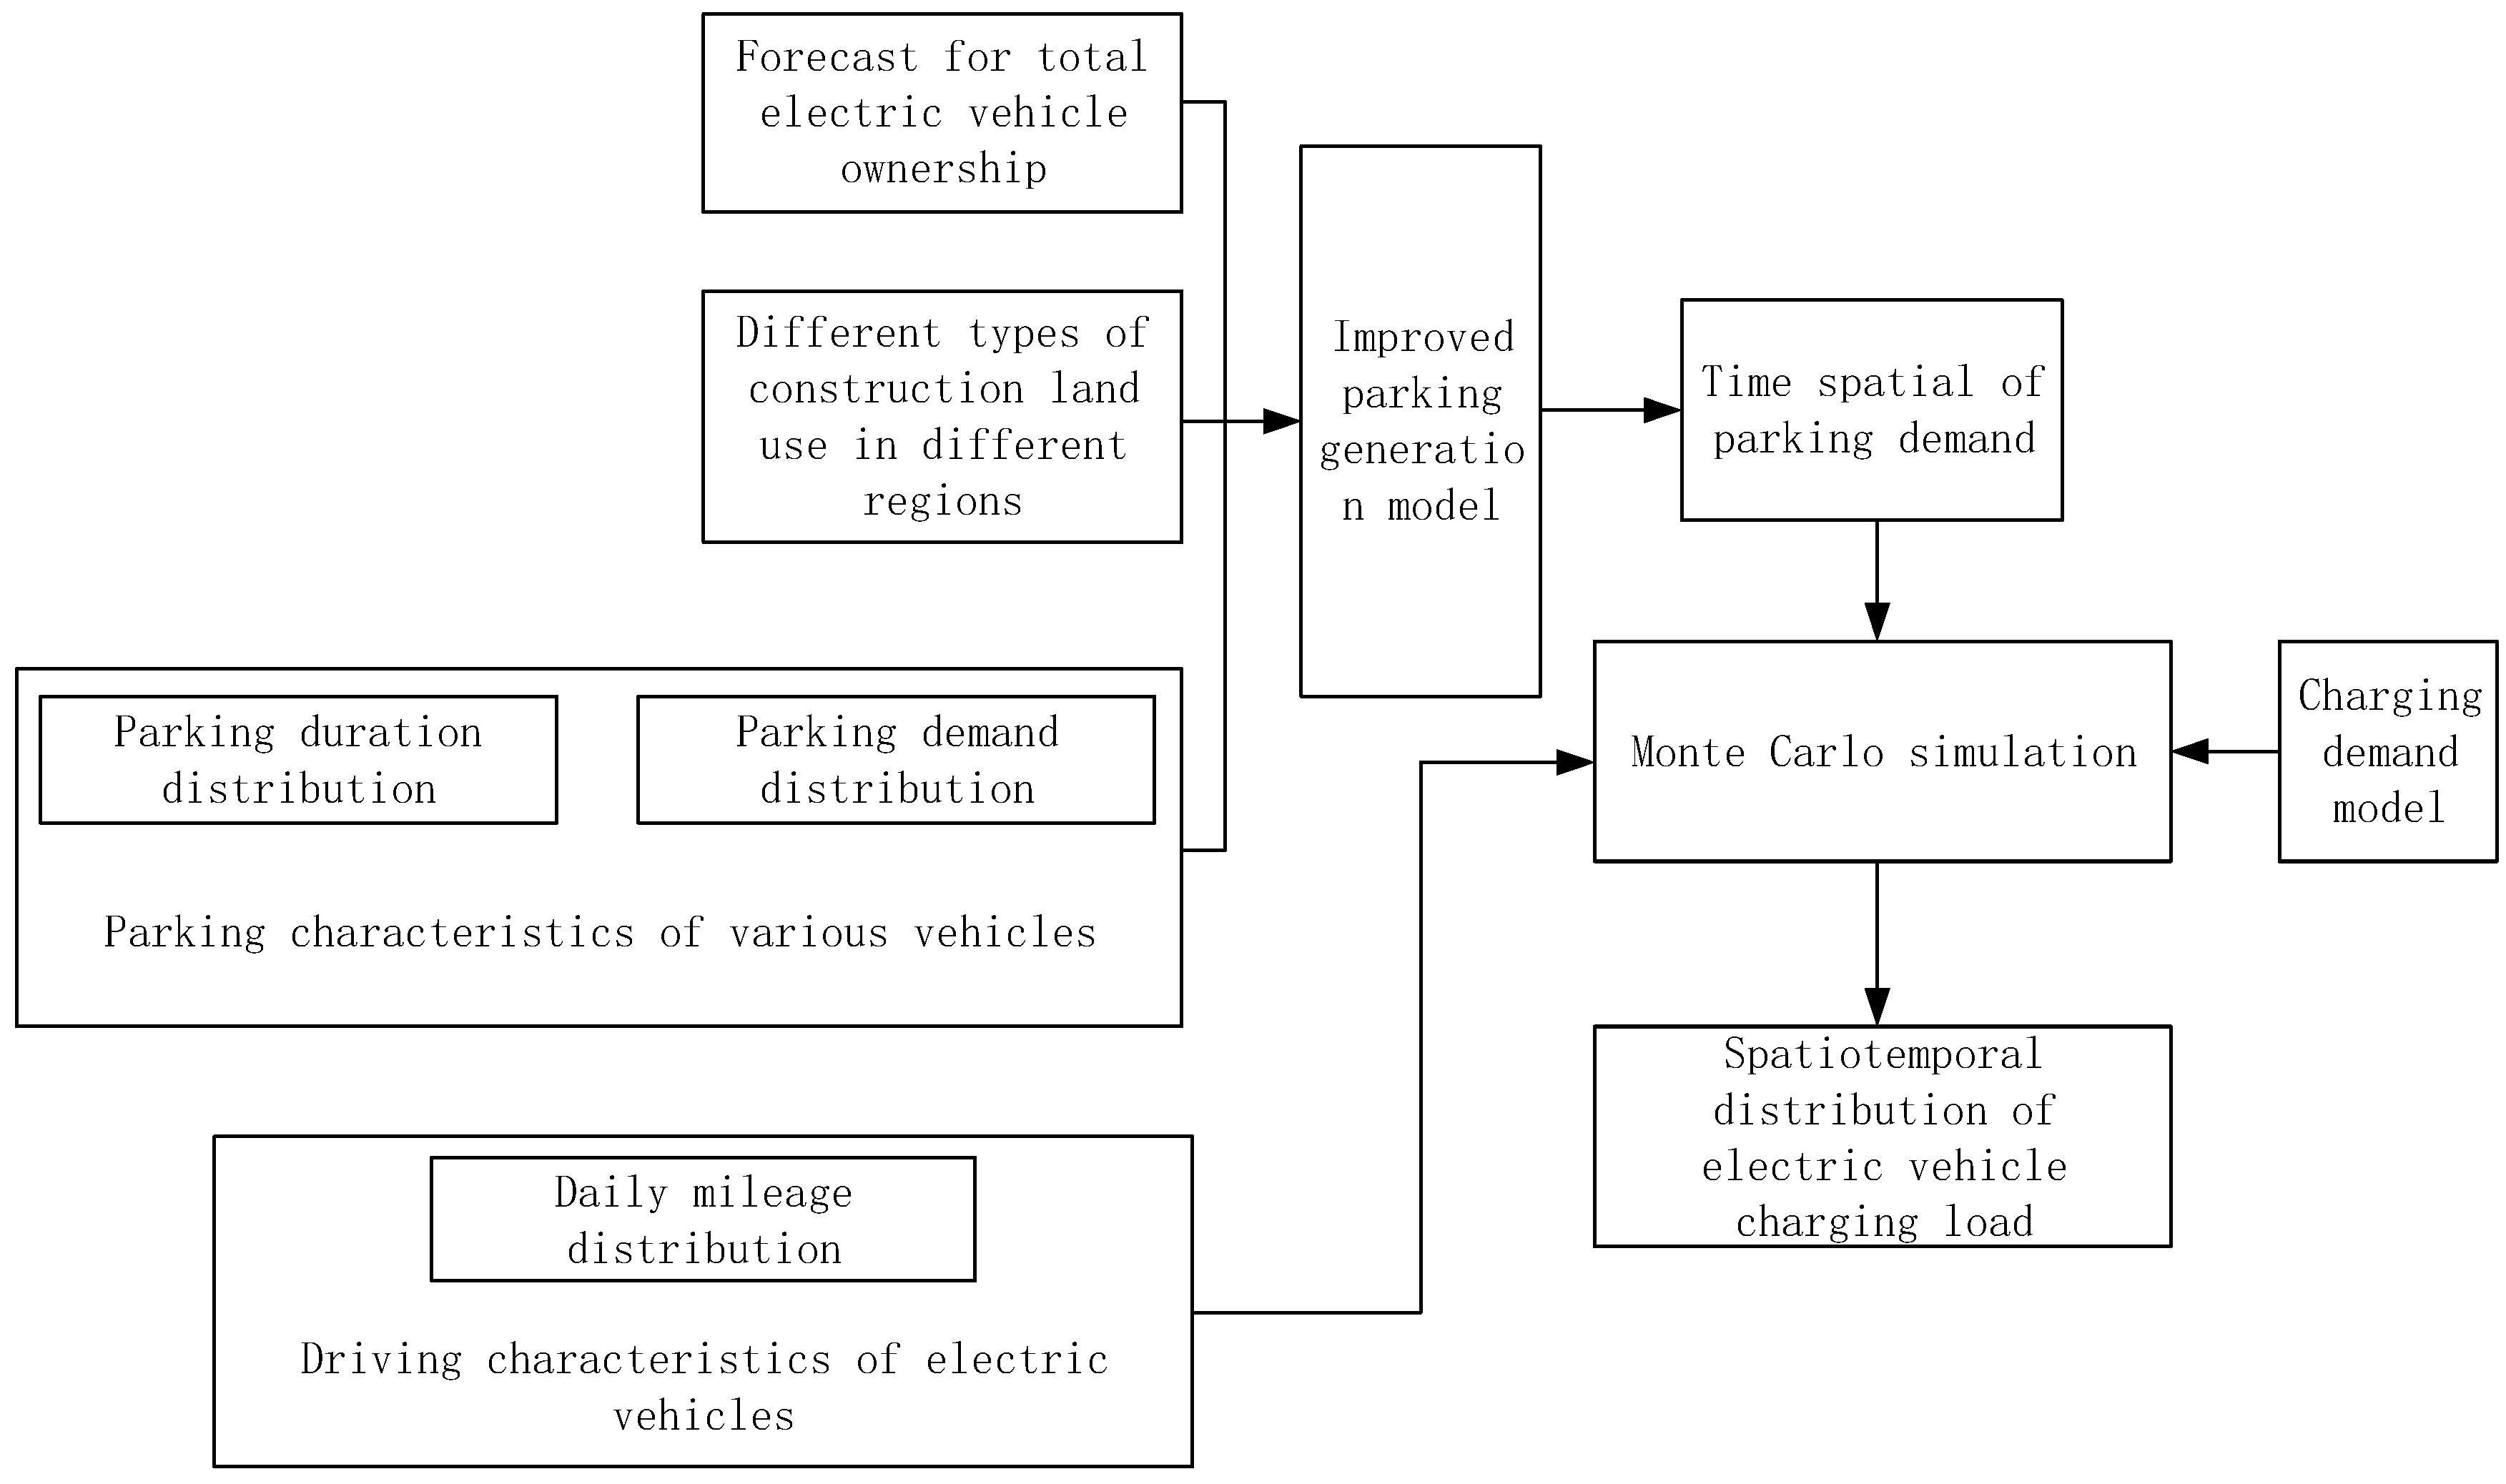
To begin, the future total number of electric vehicles expected in a specific area is projected, followed by the subdivision of the area into distinct regions. Using an enhanced parking generation rate model, the parking demand across each region is computed based on diverse land use types and parking characteristics. Subsequently, a charging demand model is formulated based on the driving behaviors typical of electric vehicles in each region. Employing the Monte Carlo method, simulations are conducted to model various aspects of electric vehicle behavior, encompassing driving patterns, parking preferences, and charging needs across all regions. These simulations generate detailed time-based profiles of electric vehicle charging loads for each respective region. As shown in
Figure 1.
2.1. Parking Generation Rate Model Considering Spatial and Temporal Distribution
The traditional parking generation rate model is a key method for forecasting parking demand. Different land use types have distinct parking generation rates (i.e., parking demand generated by land use). By multiplying the parking generation rate of a specific type of land use by its area, the parking demand for that type of land in the area can be determined. Summing the parking demand across various types of land use yields the total parking demand for the area. This can be expressed mathematically as follows:
In the formula, is the parking demand (spots) in the peak time of area ; is the parking demand generation rate of class land in area ; is the land use amount (land use) of class in area ; and is the correction coefficient of parking generation rates related to urban location, economic status, and population density in different regions.
The traditional parking generation rate model focuses solely on peak hour parking demand, failing to capture the time distribution characteristics of vehicle parking. This limitation makes it unsuitable for forecasting electric vehicle load. Hence, this study introduces an enhanced iteration of the conventional parking generation rate model to rectify these deficiencies.
The same type of land use has similar parking characteristics because of its identical function. Parking characteristics include two aspects: the distribution characteristics of parking time length and the variation characteristics of parking demand with time.
Suppose that the per unit value curve of the parking demand of class
land in area
changes with time is
, and the corresponding parking demand generation rate is
, then the parking demand of the entire area
at time
is
Equation (2) introduces an enhanced parking generation rate model that integrates the parking duration distribution characteristics across various types of land use. This model effectively captures both spatial and temporal variations in total car parking within a specified area.
On one hand, future results from the parking generation rate model survey may differ from local actual vehicle prediction data. On the other hand, in cases where detailed parking generation rate survey data are unavailable, local land use berth allocation standards can be utilized for estimation. However, these standards may often deviate from the actual parking demand. Therefore, to enhance prediction accuracy, it is crucial to adjust the parking demand calculated by the parking generation rate model.
2.1.1. Revision of the Proportion of Parking Spaces in Residential, Industrial, and Commercial Areas
Administrative offices, commercial finance, industrial facilities, warehouses, healthcare, educational and research institutions, sports facilities, and other types of land can collectively be categorized as industrial and commercial areas. When analyzing private car usage, the parking demand in industrial and commercial areas is adjusted based on that in residential areas. Typically, the difference between peak and off-peak parking demands is slightly greater in residential areas compared to industrial and commercial zones.
Assuming the residential land number
, the parking demand in the residential area is
The parking requirements in industrial and commercial zones are as follows:
The correction coefficient is
In the formula, is the correction coefficient considering the in-transit vehicle; is the parking peak time of residential land; and is the peak parking time for other types of land.
The adjusted parking demand in industrial and commercial areas is as follows:
The overall total parking requirement is
2.1.2. Forecast Parking Demand and Forecast Vehicle Ownership Correction
Based on the predicted value K of future car ownership, the total parking demand is corrected. The maximum total parking demand should be lower than the car ownership.
The correction coefficient is
In the formula, is the correction coefficient considering the in-transit vehicle and is the maximum total parking demand.
After correction, the regional and total parking demands are
2.2. Spatial and Temporal Distribution of Electric Vehicles’ Driving and Parking Characteristics
By analyzing the daily mileage of electric vehicles and their power consumption rates per 100 km, we can calculate the distribution of the state of charge (SoC) for electric vehicles at the end of each day. Due to the limited scale of electric vehicle adoption and insufficient data, the driving behaviors of electric vehicles are typically analyzed using methodologies applicable to conventional fuel vehicles. Typically, vehicle daily mileage is acquired through GPS positioning or travel surveys.
The data obtained through analysis shows that the daily mileage
of the car satisfies the lognormal distribution, and its probability density function is
where
;
; the unit of
is km.
2.2.1. Weekday Parking Demand in Typical Residential Areas
A car in a residential area generally leaves the residential area when it goes out in the morning, ushering in the peak of cars leaving the residential area; vehicles return in the afternoon or night, ushering in the peak of parking.
Equation (12) is the fitting result of the weekday parking demand function of a typical residential area obtained using statistics. The fitting effect is shown in
Figure 2. It can be seen that the residential area has a parking time of about 2 h during the day.
Parking demand refers to the need for electric vehicles to stop to charge during a certain period of time. The parking demand data are obtained by fitting the parking demand data through Equation (12), and the actual parking demand data are the data of a charging station in Liaoning.
2.2.2. Weekday Parking Demand in Typical Industrial and Commercial Areas
During the day, with the opening of factories, shopping malls, offices, etc., a large number of cars have entered this type of area, and the industrial and commercial areas have ushered in the peak of parking; in the evening, with the closure of factories, shopping malls, offices, etc., workers or consumers are driving away from industrial and commercial areas, ushering in the peak of departure.
Equation (13) is the fitting result of the weekday parking demand of a typical industrial and commercial area obtained from a survey (parking demand is higher during working hours), and the fitting effect is shown in
Figure 3.
Parking behavior in industrial and commercial areas can be divided into commuting cars and non-commuting cars according to the purpose of parking. The daily parking time of commuter cars is generally 3–8 h, and the peak time of parking is 07:00–10:00 in the morning and 12:00–14:00 in the afternoon. The parking time of non-commuting vehicles is about 1.5 h at a time during the day, and there is no obvious parking peak during the day. The number of non-commuter cars is small, and the parking time is short, so it is not considered as the main object.
2.3. Electric Vehicle Charging Demand Model and Load Forecasting Method
2.3.1. Electric Vehicle Charging Demand Model
Without considering charging, the
SoC decreases at the rate
from the beginning of the day to the end of the trip. Then, the
SoC of a
electric vehicle at time
can be expressed as
In the formula, is the moment when the SoC begins to decline in the day; is the SoC at the time ; and is the added value of the SoC caused by charging before time.
Since the decrease in the
SoC is directly related to the driving of the car, assuming that the average speed of all cars in the study area is
, the average
SoC decline speed
of a
car can be calculated by the following formula:
In the formula, is the parking sign; its value is one when parking and its value is zero when driving; and are the daily mileage and daily parking time of the vehicle, respectively; and , , and are the power consumption and battery capacity per 100 km of the car, respectively.
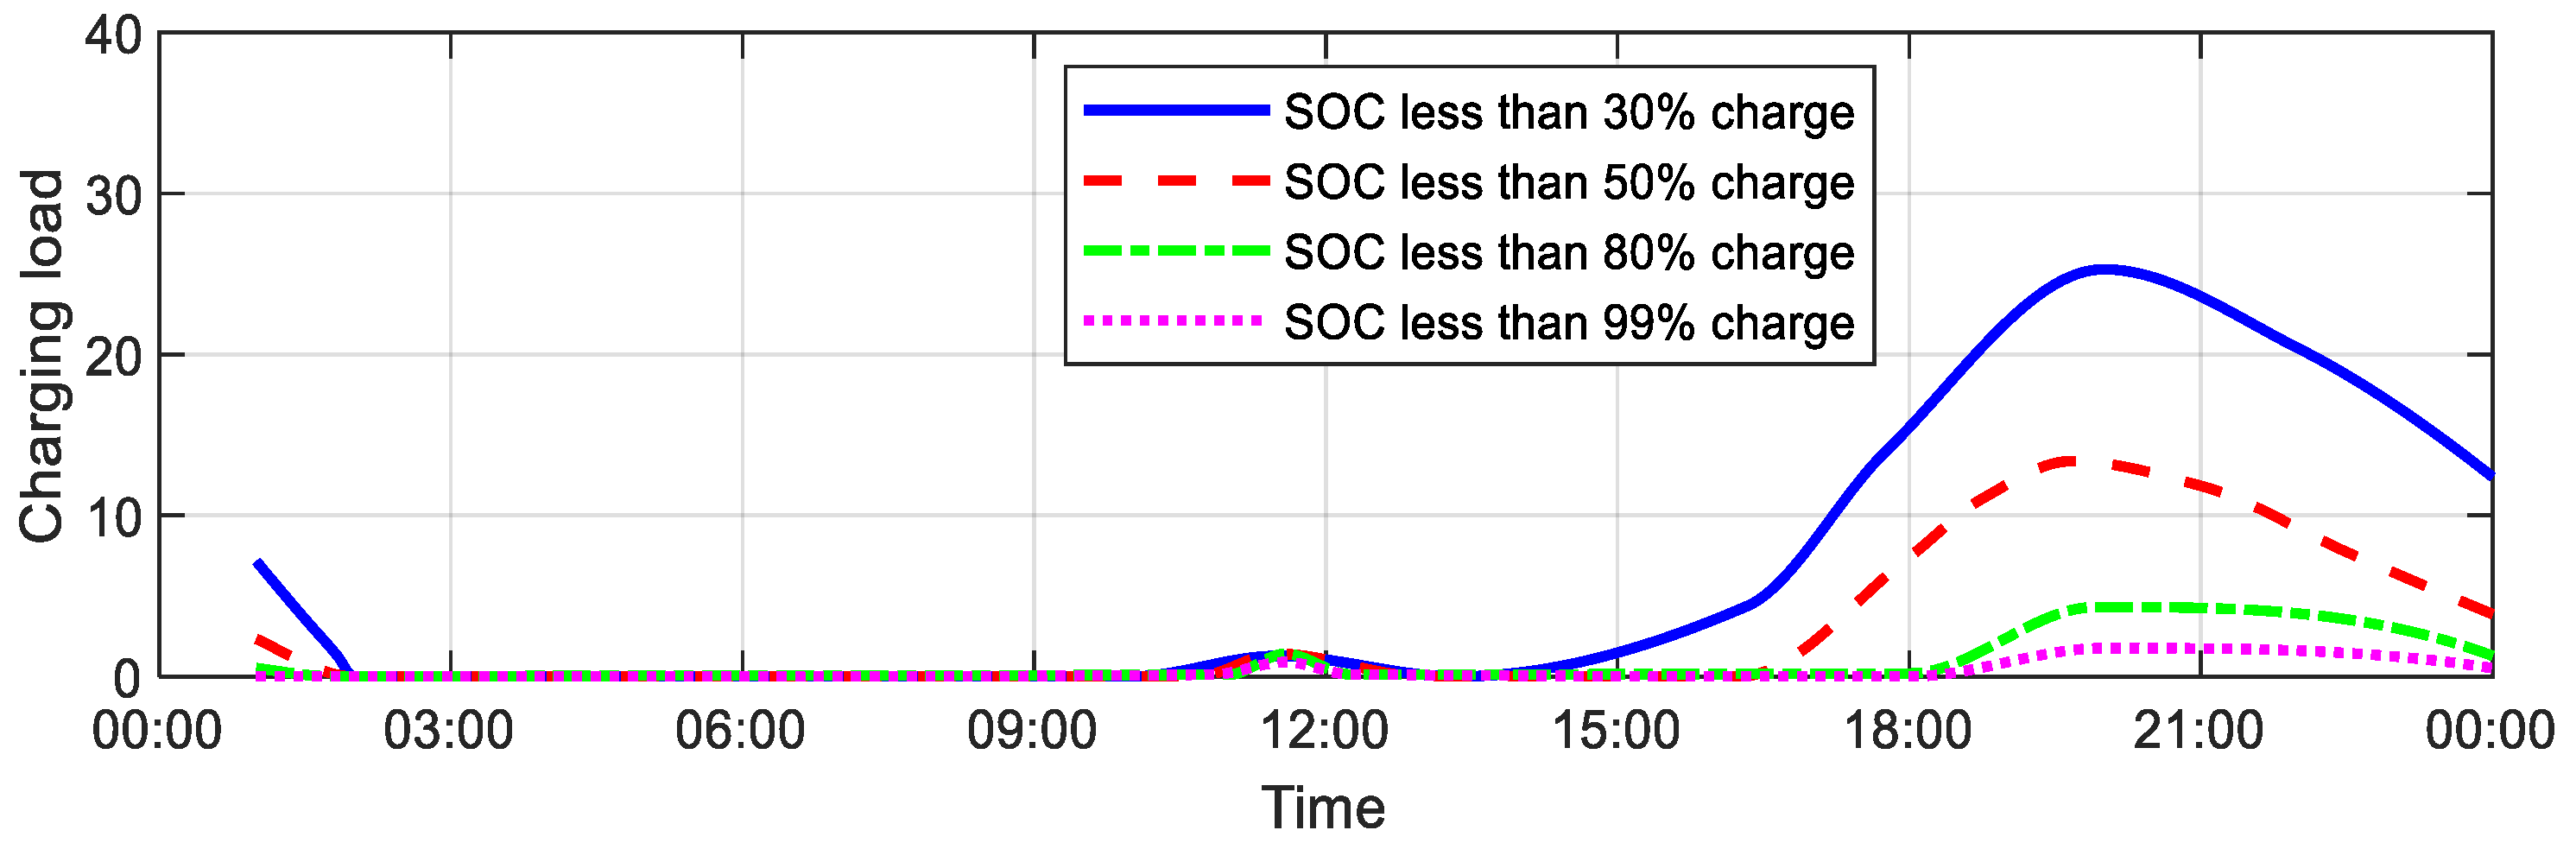
Electric vehicles generate charging demand as their state of charge (SoC) decreases, occurring in the following scenarios:
Upon reaching their destination and halting, if the SoC drops below a certain threshold, vehicles opt to charge at the parking location;
During the vehicle’s journey, if the SoC falls below a preset warning level, it will seek out a charging station for recharging;
At the end of the day, electric vehicles may decide to charge following their final stop.
2.3.2. Forecasting Electric Vehicle Loads Using Monte Carlo Simulation
Based on data including the daily mileage distribution of electric vehicles, land use characteristics across various regions, parking generation rates, and parking distribution patterns, a Monte Carlo simulation was employed. This simulation extracted the daily mileage, modeled parking and driving behaviors, and predicted parking durations for vehicles on different types of land in different regions.
Figure 4 illustrates these procedures for predicting the spatial and temporal distribution of electric vehicle loads.
Taking the highest time of total parking demand as the starting time of the simulation, the daily mileage, battery capacity, and power consumption per 100 km of all vehicles were extracted. According to the time distribution of the first trip of the electric vehicle, the parking time of the parked vehicles in various parking lots was extracted.
Subsequently, the parking and charging status of each vehicle was updated every 15 min. When a vehicle’s parking duration expired, it departed from the parking lot and proceeded to charge based on scheduled charging times. The charging demand was accommodated according to specific demand types.
The difference between the current actual number of parking vehicles in various parking lots and the parking demand calculated by the parking generation rate model was calculated. If > 0, the in-transit vehicles were randomly selected to park in the parking lot, and the parking time was extracted according to the parking location, parking purpose, and current time. If < 0, a random sample of cars currently parked in the parking lot was taken out.
The longer the daily mileage of electric vehicles, the shorter the corresponding daily parking time. The sampling procedure obtained the parking time according to the parking time distribution of different types of parking spaces and parking purposes and then corrected it according to the daily mileage of the vehicle. Assuming that the kth car sampled stops at a certain time t and the parking time is
, the modified parking time is:
In the formula, is the average mileage of all cars.
The state of charge (SoC) of the electric vehicle decreases while driving at a rate denoted as .
3. Study on Organized Charging and Discharging Strategy with Electric Vehicle Load Prediction
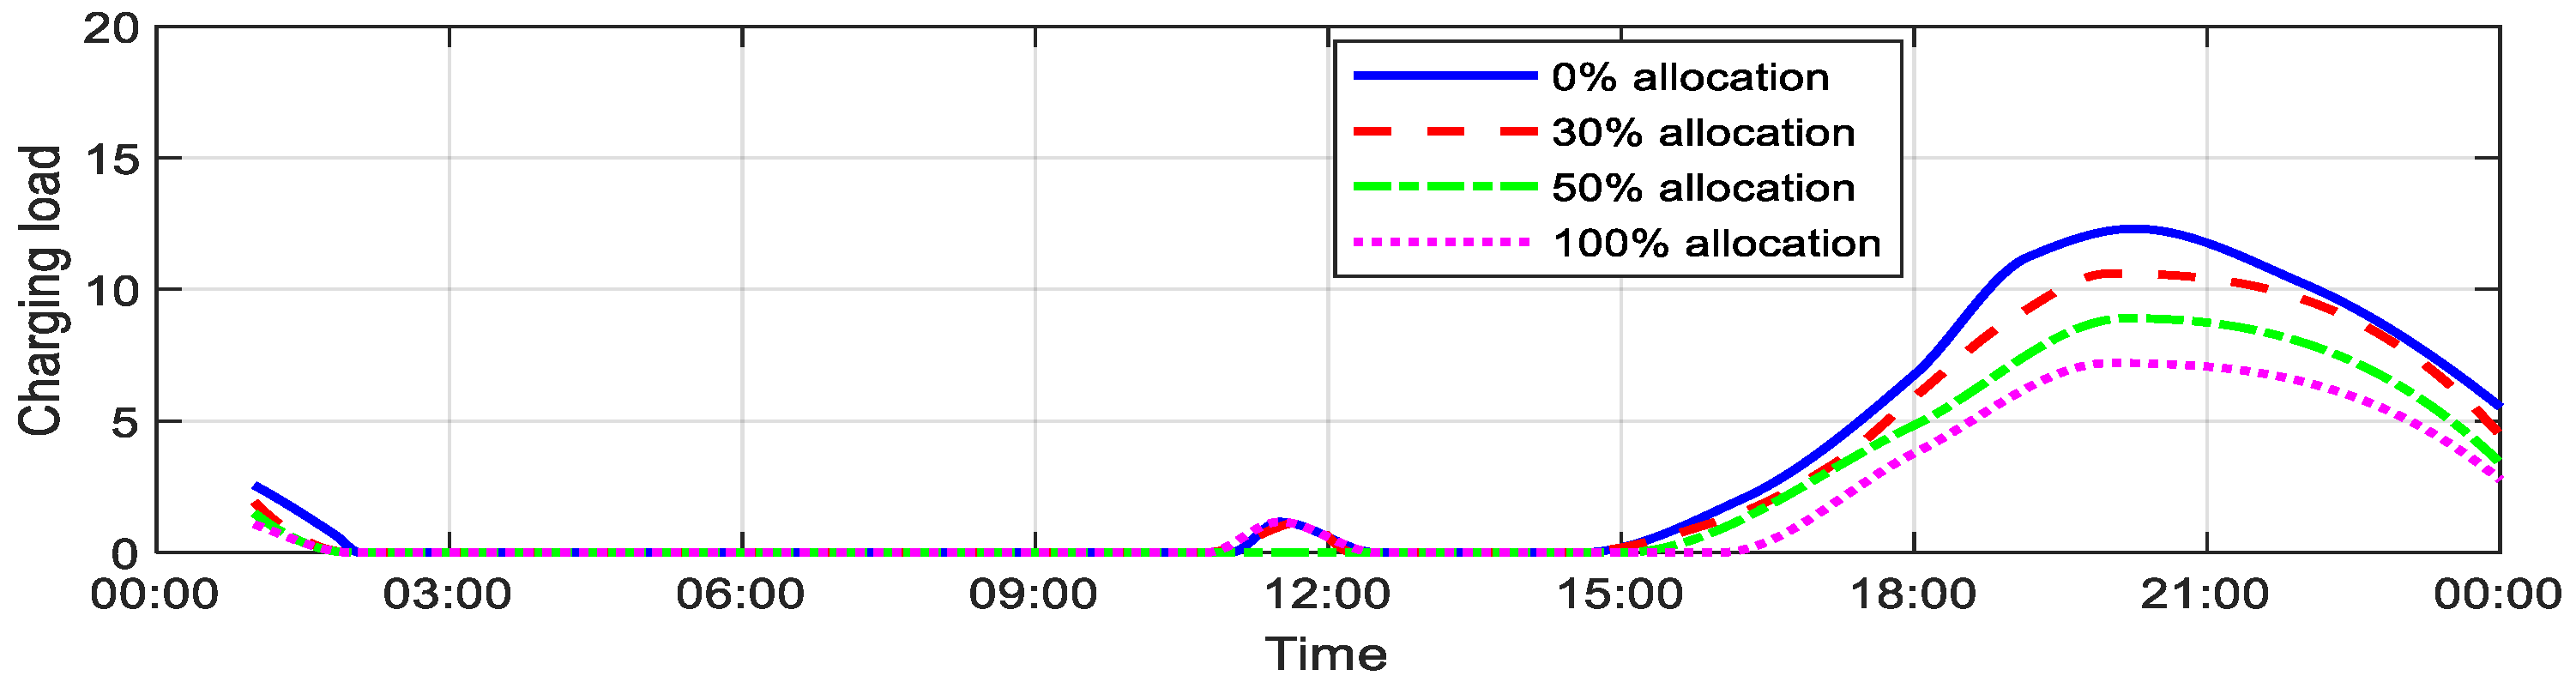
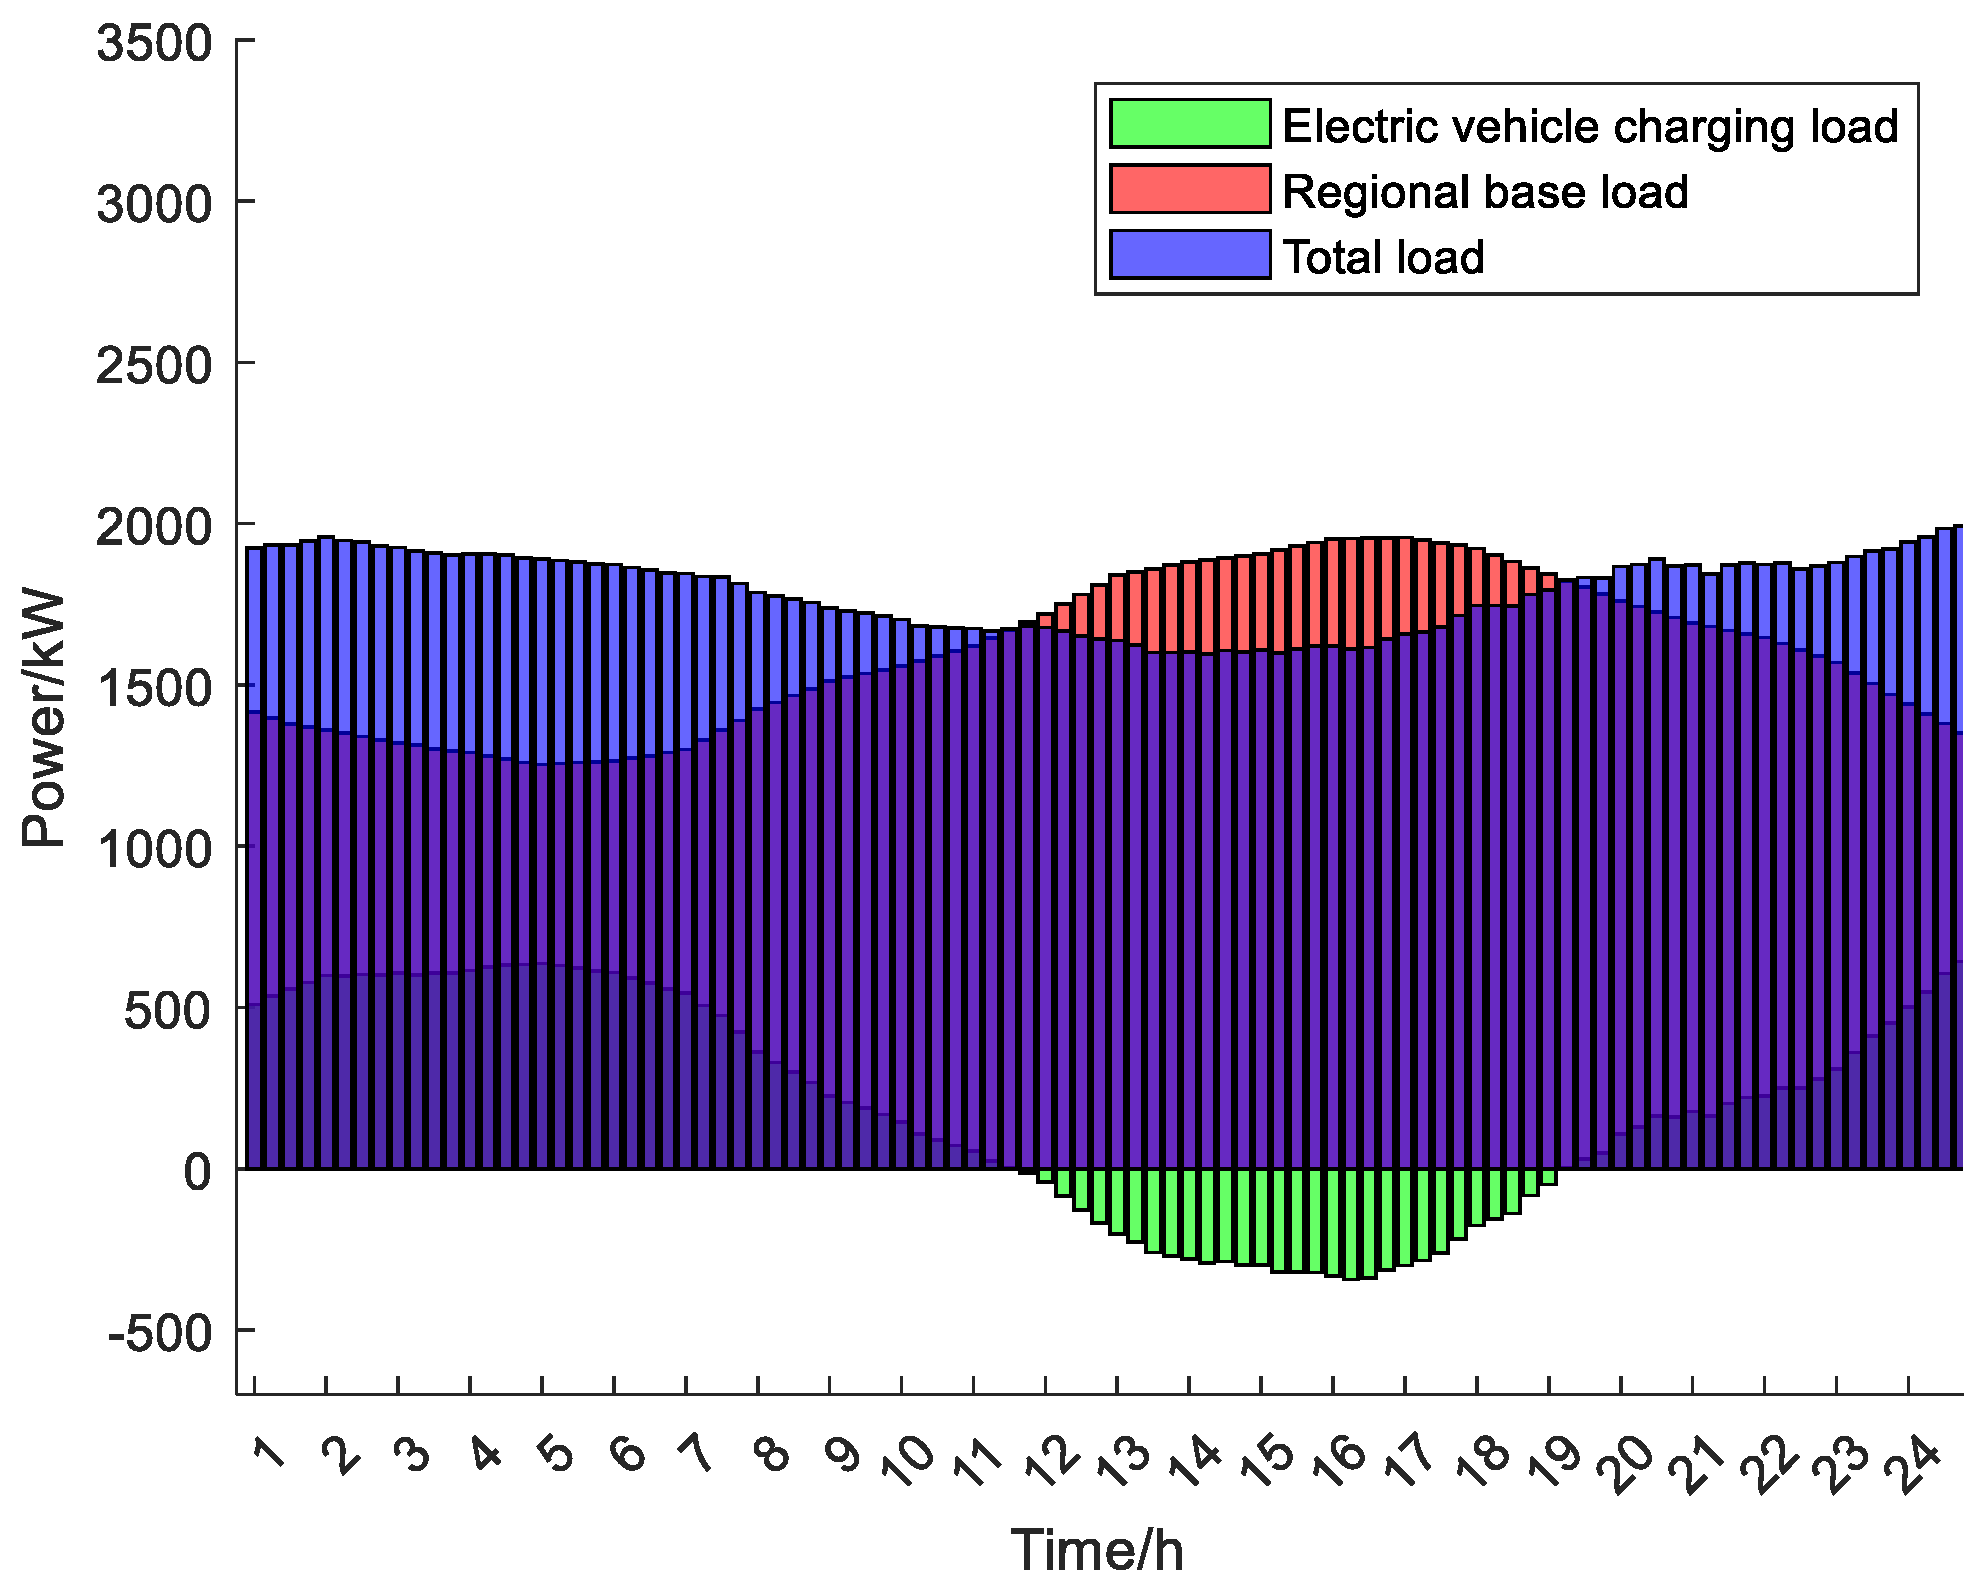
Electric vehicle (EV) load forecasting relies on spatial and temporal distribution, shaping the foundation for devising orderly charging and discharging strategies. Optimal system cost minimization involves timing controls, channeling charging demands to regions with lower loads to mitigate load fluctuation deviations. Unregulated EV charging can escalate peak loads on the power grid, significantly impacting economic efficiency and grid stability. Hence, guiding centralized EV charging is essential to mitigate adverse grid impacts, maximize renewable energy utilization, promote economic grid operations, and achieve load equilibrium.
3.1. Charging–Discharging Model of Ordered Charging–Discharging Strategy
3.1.1. Operating Cost of System Is the Lowest
Electric vehicle charging primarily relies on renewable energy and traditional power grid sources. Leveraging renewable energy can diminish the reliance on thermal and other conventional power sources, thereby optimizing grid economic benefits and curbing carbon emissions through an increased renewable energy uptake.
The objective function of the model is expressed as
In the formula,
is the power generation of the power grid;
is the charging power;
is the power consumption of other basic power facilities;
is the power of wind power generation;
is the power of photovoltaic power generation;
is the length of each period, which is 1 h;
is the number of all-electric vehicles in the regional power grid;
is the charging price of the period
;
is the discharge price of the period
; and
is the charging state of
electric vehicles. The charging state is charged and uncharged, which can be expressed as
3.1.2. Deviation of Load Fluctuation Is the Smallest
The optimization of electric vehicle charging and discharging schedules entails selecting optimal charging times considering the current grid load conditions. Charging during high grid load periods raises peak demand while charging during low grid load periods mitigates this impact. Therefore, minimizing load fluctuations is prioritized as the primary objective for optimizing electric vehicle charging.
The objective function is expressed as
In the formula, is the fluctuation of the total load of the distribution network and is the average value of the distribution network load.
Centralized optimization constraints for electric vehicles primarily encompass several limitations, including constraints on charging times, total charging capacity, and charging preferences.
In the formula, is the percentage of the remaining battery capacity; is the percentage of remaining battery capacity when the electric vehicle leaves; is the battery capacity; is the charging start time; is the charging time; is the charging efficiency; and is the time that the electric vehicle is expected to leave.
The charging time constraint ensures that the electric vehicle is charged within its duration of stay. If the charging capacity during this period does not suffice for the subsequent travel demand, owners must adjust their departure time or reduce the planned charging amount accordingly.
In the formula, and are the total charging amount of the electric vehicle in a day under disorderly charging and orderly charging, respectively.
Assuming the electric vehicle initiates charging at time
, it ensures that the remaining battery capacity of electric vehicle
meets the owner’s desired level and does not exceed the vehicle’s battery capacity.
3.2. Research on the Algorithm of Orderly Charge and Discharge Strategy
The strategy for scheduling electric vehicle charging and discharging operations involves two primary objectives: minimizing system operating costs and reducing deviations in load fluctuation. To address this multi-objective and multi-constrained optimization problem, the NSGA-II algorithm is employed. NSGA-II is designed to optimize both objectives simultaneously, aiming to achieve optimal system cost efficiency and minimal load fluctuation deviations. Building upon NSGA-I, NSGA-II incorporates advanced algorithmic strategies such as fast non-dominated sorting and an elite strategy, which enhance computational efficiency and effectiveness in managing large-scale optimization challenges.
To obtain the optimal compromise solution, fuzzy theory is adopted, and a small satisfaction function is selected in the fuzzy satisfaction function.
The analytical expression of the small fuzzy satisfaction function is as follows:
In the formula, is the function value of the electric vehicle optimization target; is the maximum value of the electric vehicle optimization goal ; and is the minimum value of the electric vehicle optimization goal .
The analytic expression of the large fuzzy satisfaction function is as follows:
The analytical expression of the intermediate fuzzy satisfaction function is shown below.
To achieve the lowest system operation cost and minimize load fluctuation deviation, selecting a small fuzzy membership function proves to be the most suitable approach for solving the objective function. A fuzzy satisfaction function value closer to one indicates a more optimal solution to the objective function.
is the membership value of the electric vehicle optimization objective function. is the number of objective functions; in this paper.
The NSGA-II algorithm proceeds through the following stages to address the optimization model for orderly electric vehicle charging. As shown in
Figure 5.

