Article

Research on Inter-Fracture Gas Flooding for Horizontal Wells in Changqing Yuan 284 Tight Oil Reservoir

1
University of Chinese Academy of Sciences, Beijing 100049, China
2
Institute of Porous Flow and Fluid Mechanics, Chinese Academy of Sciences, Langfang 065007, China
3
Research Institute of Petroleum Exploration & Development, China National Petroleum Corporation, Beijing 100083, China
4
CNPC Engineering Technology R&D Company Limited, Beijing 102206, China
5
Petroleum Engineering School, Southwest Petroleum University, Chengdu 637001, China
*
Author to whom correspondence should be addressed.
Energies 2024, 17(17), 4254; https://doi.org/10.3390/en17174254
Submission received: 2 July 2024 / Revised: 15 August 2024 / Accepted: 21 August 2024 / Published: 26 August 2024
(This article belongs to the Section H: Geo-Energy)

Abstract

:
In tight reservoir development, traditional enhanced oil recovery (EOR) methods are incapable of effectively improving oil recovery in tight reservoirs. Given this, inter-fracture flooding is proposed as a new EOR method, and physical model simulation and numerical simulation are performed for inter-fracture water flooding. Compared with inter-fracture water flooding, inter-fracture gas flooding has a higher application prospect. However, few studies on inter-fracture gas flooding have been reported, and its EOR mechanisms and performance are unclear. This paper used the geological model of the actual tight reservoir to carry out numerical simulations for two horizontal wells in the Changqing Yuan 284 block. The results showed that (1) inter-fracture gas flooding can effectively supplement formation energy and increase formation pressure; (2) inter-fracture gas flooding delivers simultaneous displacement, which can effectively increase the swept area in tight reservoirs; (3) injected CO2 dissolves into the reservoir fluid, reduces fluid viscosity, and improves fluid flow through the reservoir; and (4) the recovery factor increment of the CO2 injection is higher than those of natural gas injection and N2 injection. The findings of this research provide references for the production and development of tight reservoirs.

1. Introduction

The current tense energy bureau urgently needs to be alleviated by increasing the exploration and development of unconventional oil and gas resources [1,2]. North America is rich in tight oil and has successfully developed these unconventional hydrocarbons via horizontal drilling and multi-stage fracturing, which is game-changing for the world energy framework [3]. However, tight reservoirs are characterized by low permeability, small pore throats, high flow resistance, and extreme difficulties in replenishing reservoir energy in a timely fashion [4,5]. In the development process, well production declines rapidly, with a decline rate of 40% to 50% in the first year [6,7]. The high production decline rate results in a low ultimate recovery factor, and a large amount of oil remains underground after reservoir depletion [8]. As suggested by the existing development model, maintaining the long-term sustainability of tight oil development is economically challenging under low oil prices, and enhanced oil recovery (EOR) is an inevitable choice for the development of tight oil [9,10]. An increase of 5% in oil recovery means an increment of hundreds of millions of tons of recoverable reserves, and hence, new technologies that can effectively enhance oil recovery are revolutionary for tight oil development [11,12].
Conventional EOR methods, such as water and gas injection, are often found with problems, such as low water injectivity, gas channeling, and insufficient formation energy during the late stage of tight reservoir development [13]. Huff-and-puff pushes oil deeper into the reservoir, and the oil displacement efficiency is low. Inter-well flooding easily causes the injection medium to cross the fracture, resulting in a small, swept area [14]. Therefore, it is urgent to find effective ways to enhance oil recovery and realize the efficient development of tight reservoirs [15]. Inter-fracture flooding is considerably promising as a newly-proposed enhanced oil recovery method for tight oil [16]. Inter-fracture flooding refers to using one fracture in a stage-fractured horizontal well as an injection fracture and the two adjacent fractures as oil-production fractures [17]. Oil displacement is achieved as injected water displaces oil to adjacent fractures [18]. Inter-fracture flooding handles the low injectivity of tight reservoirs by increasing the injection area and changing the flow field [19]. Also, it shortens the displacement distance and effectively reduces the risks of water channeling [20]. In homogeneous tight reservoirs, inter-fracture flooding can effectively increase the volume conformance coefficient, slow down the rising rate of water cut, and improve oil recovery [21,22]. Physical model simulation results show that the recovery factor can be increased by more than 10% when the injection reaches 0.2 PV (pore volume) [23]. Inter-fracture asynchronous flooding can be performed during the shut-in of wells, which increases the oil displacement efficiency [24]. Numerical simulation results show that the EOR performances of inter-fracture asynchronous flooding and inter-fracture continuous flooding are better than those of five-spot well pattern flooding and huff-and-puff (huff-n-puff) [25,26].
Laboratory experiments and numerical simulation validate the EOR efficiency of inter-fracture water flooding in tight reservoirs, which is found to be better than those of huff-n-puff and well-to-well flooding [27]. Moreover, gas injection is superior to water injection in terms of EOR in tight reservoirs [28]. A large number of laboratory experimental studies have demonstrated that the injection of CO2, gaseous hydrocarbons, and N2 into tight reservoirs can effectively improve the physical properties of crude oil, promote the volume expansion of crude oil, increase reservoir pressure, and reduce fluid viscosity and flow resistance [29,30,31]. CO2 has a higher expansion coefficient and lower miscible pressure [32]. It reduces the interaction energy between fluids and pore walls, resulting in reduced adsorption onto the rock skeleton and significant increases in the diffusion coefficients of each component of the fluids [33]. Consequently, crude oil in pores is replaced with the injected CO2. The mechanisms of nitrogen-based EOR include reducing the viscosity and density of formation oil and improving formation oil flow ability [34]. The EOR mechanisms of natural gas-based EOR include gas dissolution and viscosity reduction [16]. Injected natural gas is miscible with heavy oil, which reduces reservoir plugging, due to the precipitation of heavy components [35].
At present, the research on inter-fracture flooding is mostly limited to inter-fracture water flooding [36], and studies on inter-fracture gas flooding are rarely reported, except for a few exploratory studies based on ideal models [28,37]. In order to investigate the EOR effect of inter-fracture gas flooding in tight reservoirs, a numerical simulation was performed on the reservoir model of the Yuan 284 block of the Changqing Oilfield using the Eclipse300 compositional simulator. Firstly, the EOR performances of the depletion recovery, gas injection huff-n-puff, and inter-fracture gas flooding were compared to define the most suitable EOR method for tight reservoirs. Then, the numerical simulations of N2, CO2, and natural gas injection gas were carried out to characterize the EOR performance of inter-fracture gas flooding in cases of different injection media and hence to identify the most suitable one. Finally, the parameters of the inter-fracture gas flooding were optimized. The findings of this research provide practical support for the efficient implementation of gas injection in tight reservoirs and vital guidance for the field development of the Yuan 284 block.

2. Modeling

2.1. Basic Parameters

The basic parameters of the reservoir mainly include the formation pressure; compressibility of rock, water, and crude oil; and properties of oil, gas, and water in the original reservoir state. The basic properties of reservoir are shown in Table 1.

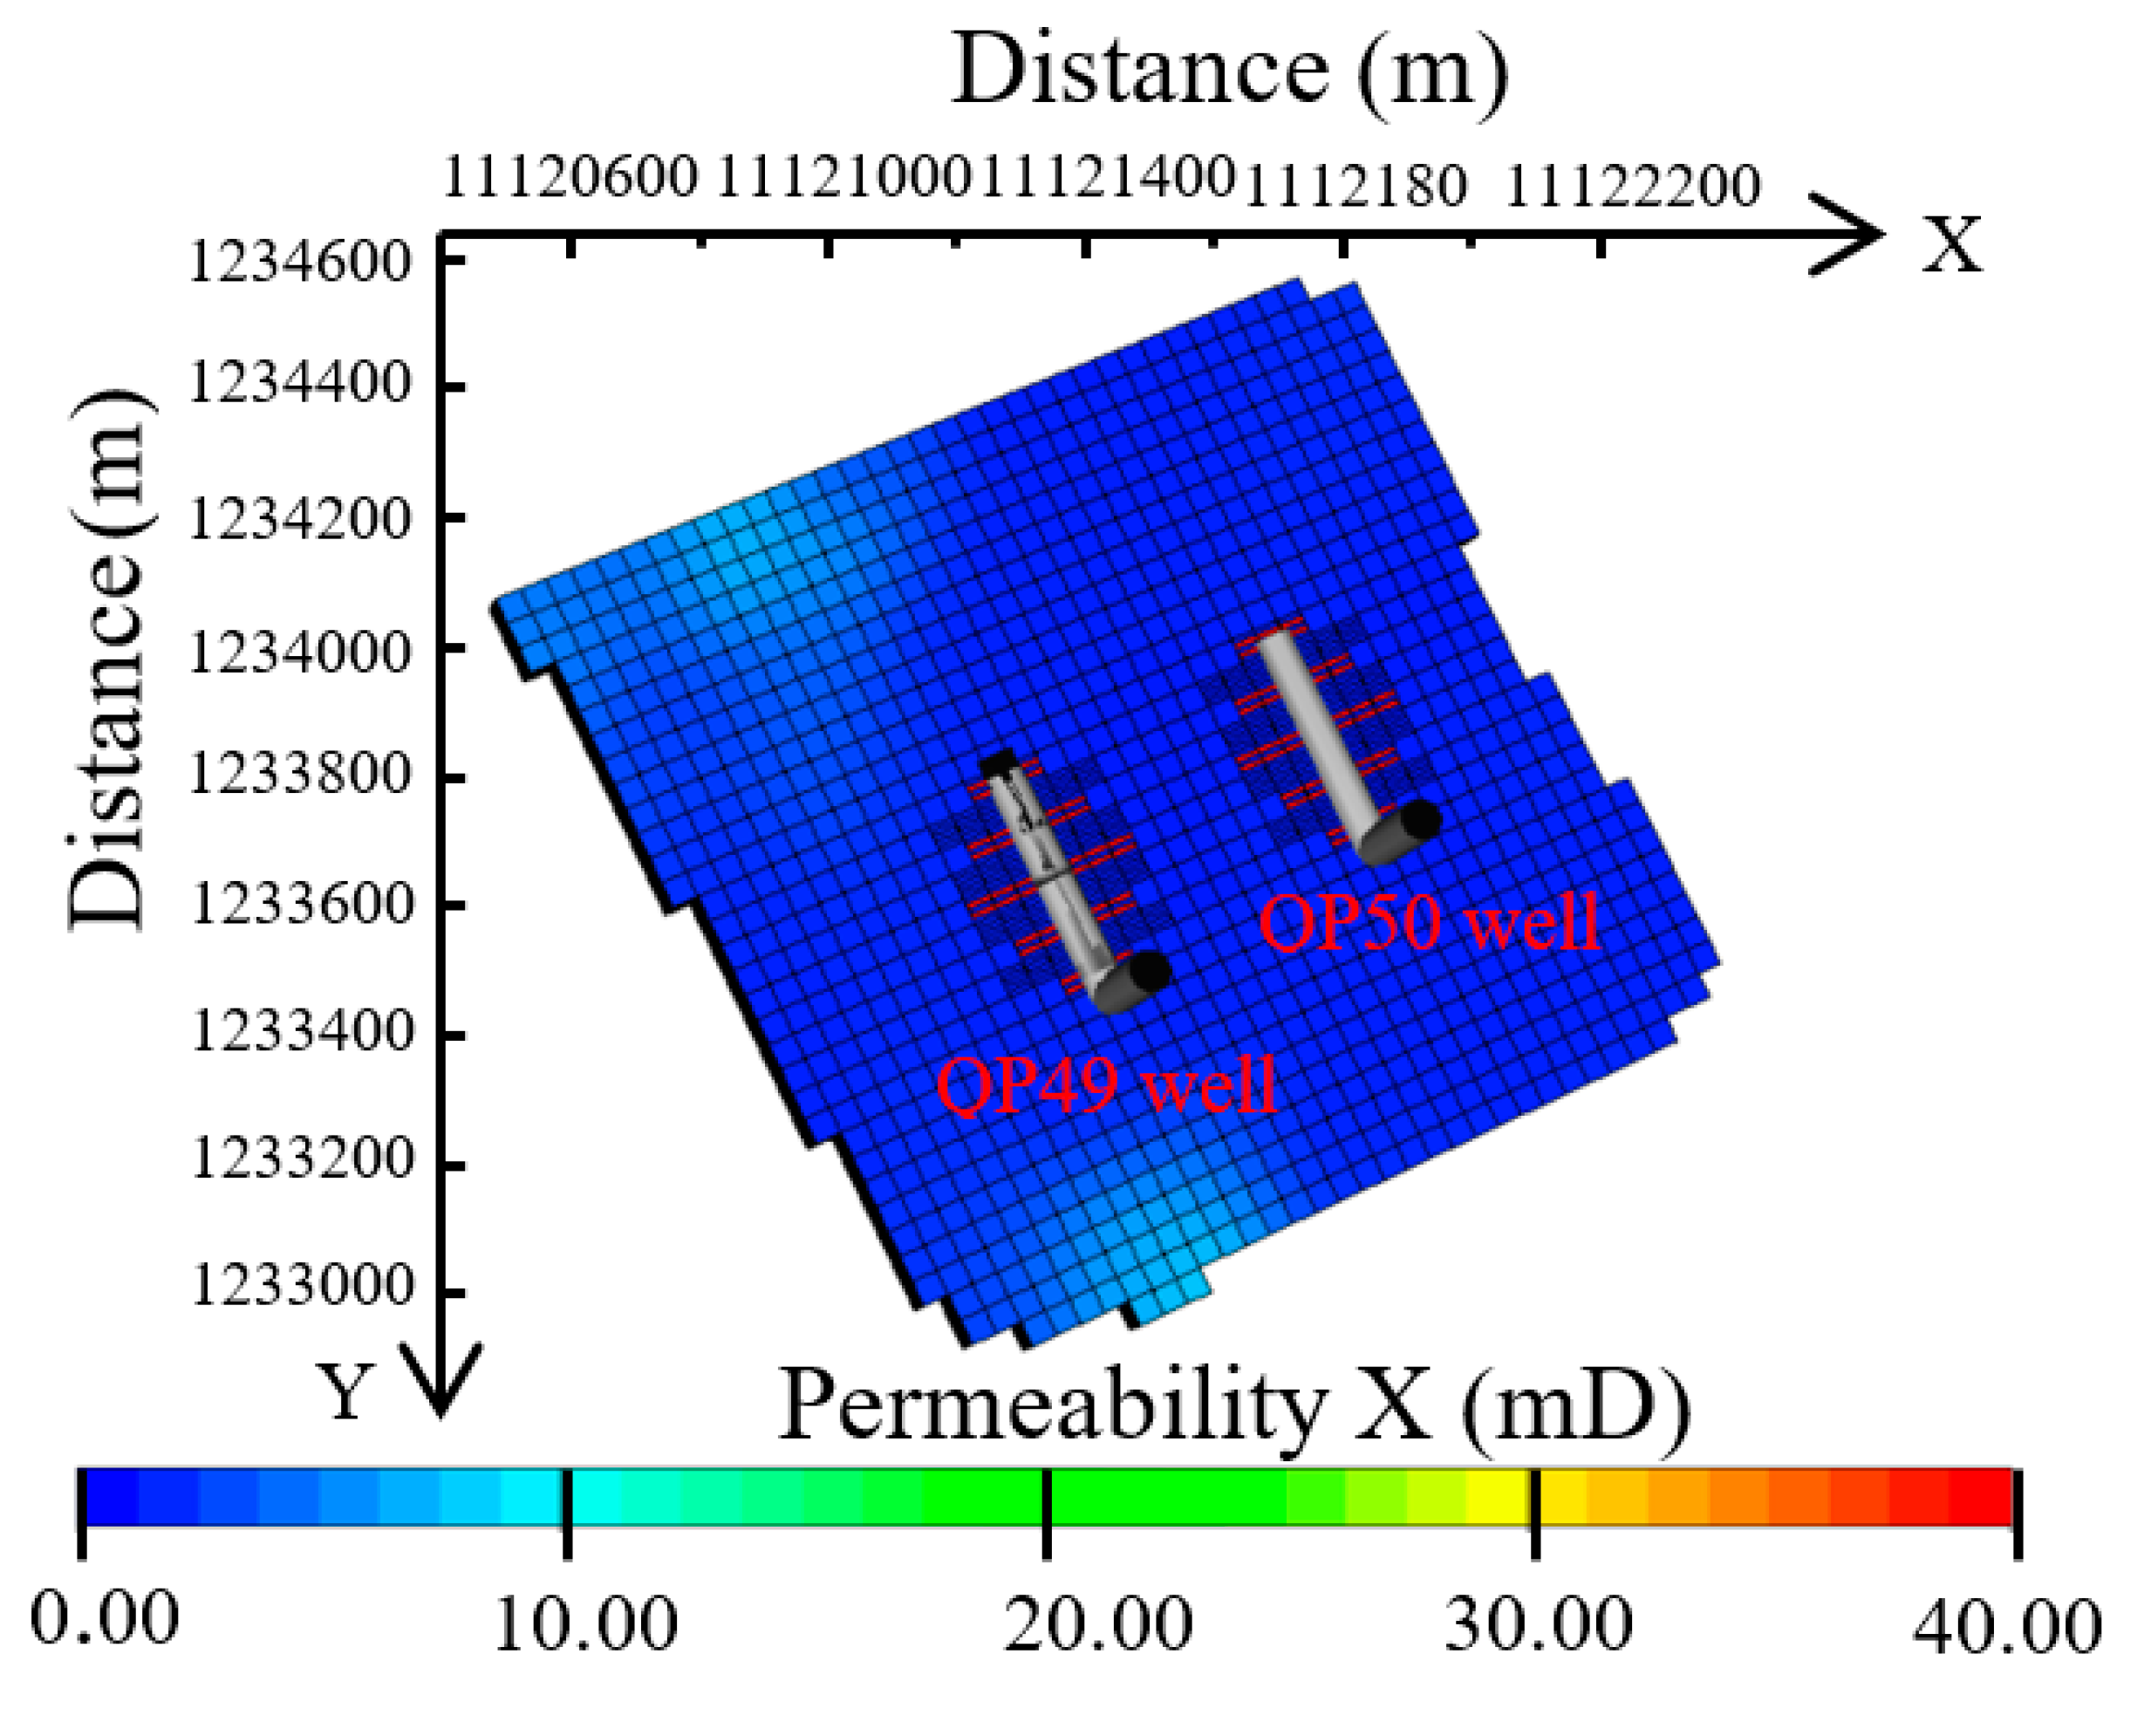
2.2. Geological Model

A geological model was built based on the physical properties of the Chang-63 reservoir in the Yuan 284-Li 70 well district, Huaqing Oilfield (of the Changqing Oilfield). The grids were 25 m × 25 m, and the total grid number amounted to 20915. The local grid refinement (LGR) was performed to simulate the artificial fracture networks of horizontal wells. The width of a single artificial fracture was 5 m, and the simulated fracture porosity was 20%. The designed fracture permeability was 10 mD, and matrix permeability was 0.58 mD when the local mesh was refined. The porosity was 11.9%, and the oil saturation was 56%. The geological model also incorporated the actual well configurations and multi-stage fracturing practice of well groups QP49 and QP50. The horizontal wellbore lengths were 440 m and 450 m, and the fracture spacing was 50 m. The two wells were fractured in the field, alternating between 50 m and 75 m half-fracture lengths, and the real fracturing data were taken into account in the design of the geological model. The well-controlled reserves in this paper were calculated according to the area controlled by fractures. The total control reservoir of the two wells was 3,168,000 m3, and the original oil content was 211,116 m3. The geological model is shown in Figure 1.

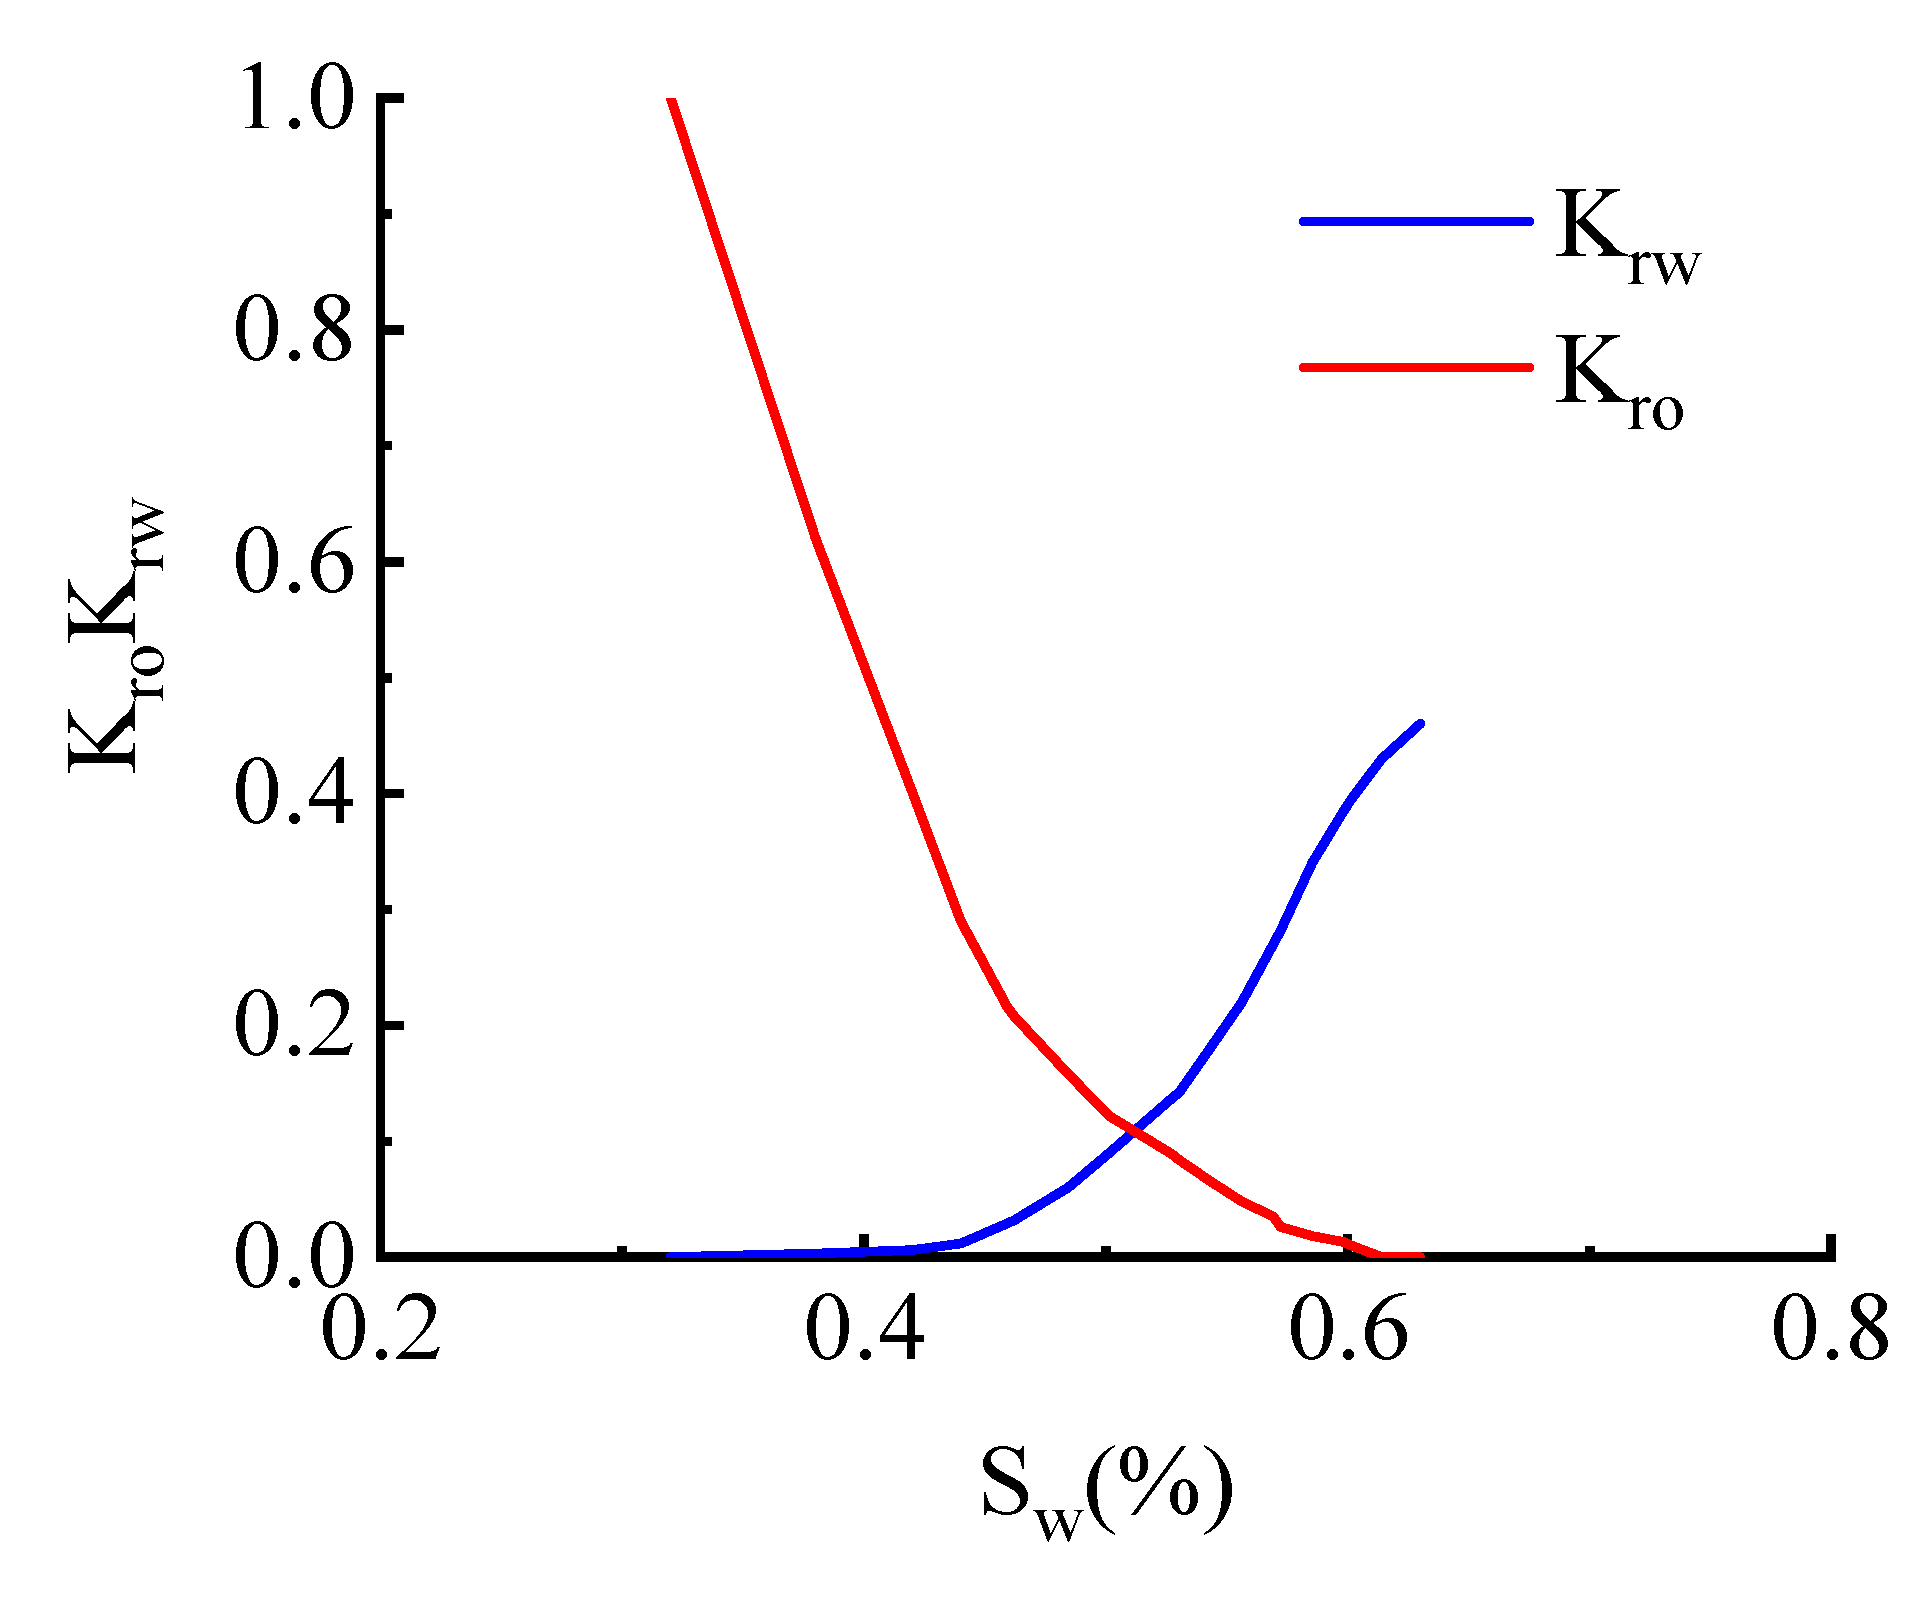
2.3. Oil–Water Relative Permeability and Oil–Gas Relative Permeability

The crude oil of the Yuan 284 tight reservoir was used to carry out the fluid relative permeability test, and the relative permeabilities of the oil and water phases were normalized and used as the basic data of the numerical simulation. The relative permeability of oil, gas and water is shown in Figure 2 and Figure 3.

2.4. Compositional Model

The data from multiple tests of the Yuan 284 crude oil were collected, such as the single-stage degassing test, multi-stage degassing test (DL = differential liberation), bubble point test, and constant mass expansion (CME or CCE = constant composition expansion) test. The bubble point test data were used to fit the bubble point pressure, while the CME test data were used to fit the fluid density and relative volume. The bubble point pressure fitting diagram is shown in Figure 4.
The gas deviation factor, gas viscosity, dissolved gas–oil ratio, gas weight, and gas volume coefficient were used in the stepwise degassing experiment. The composition of well fluid was divided and is shown in Table 2.

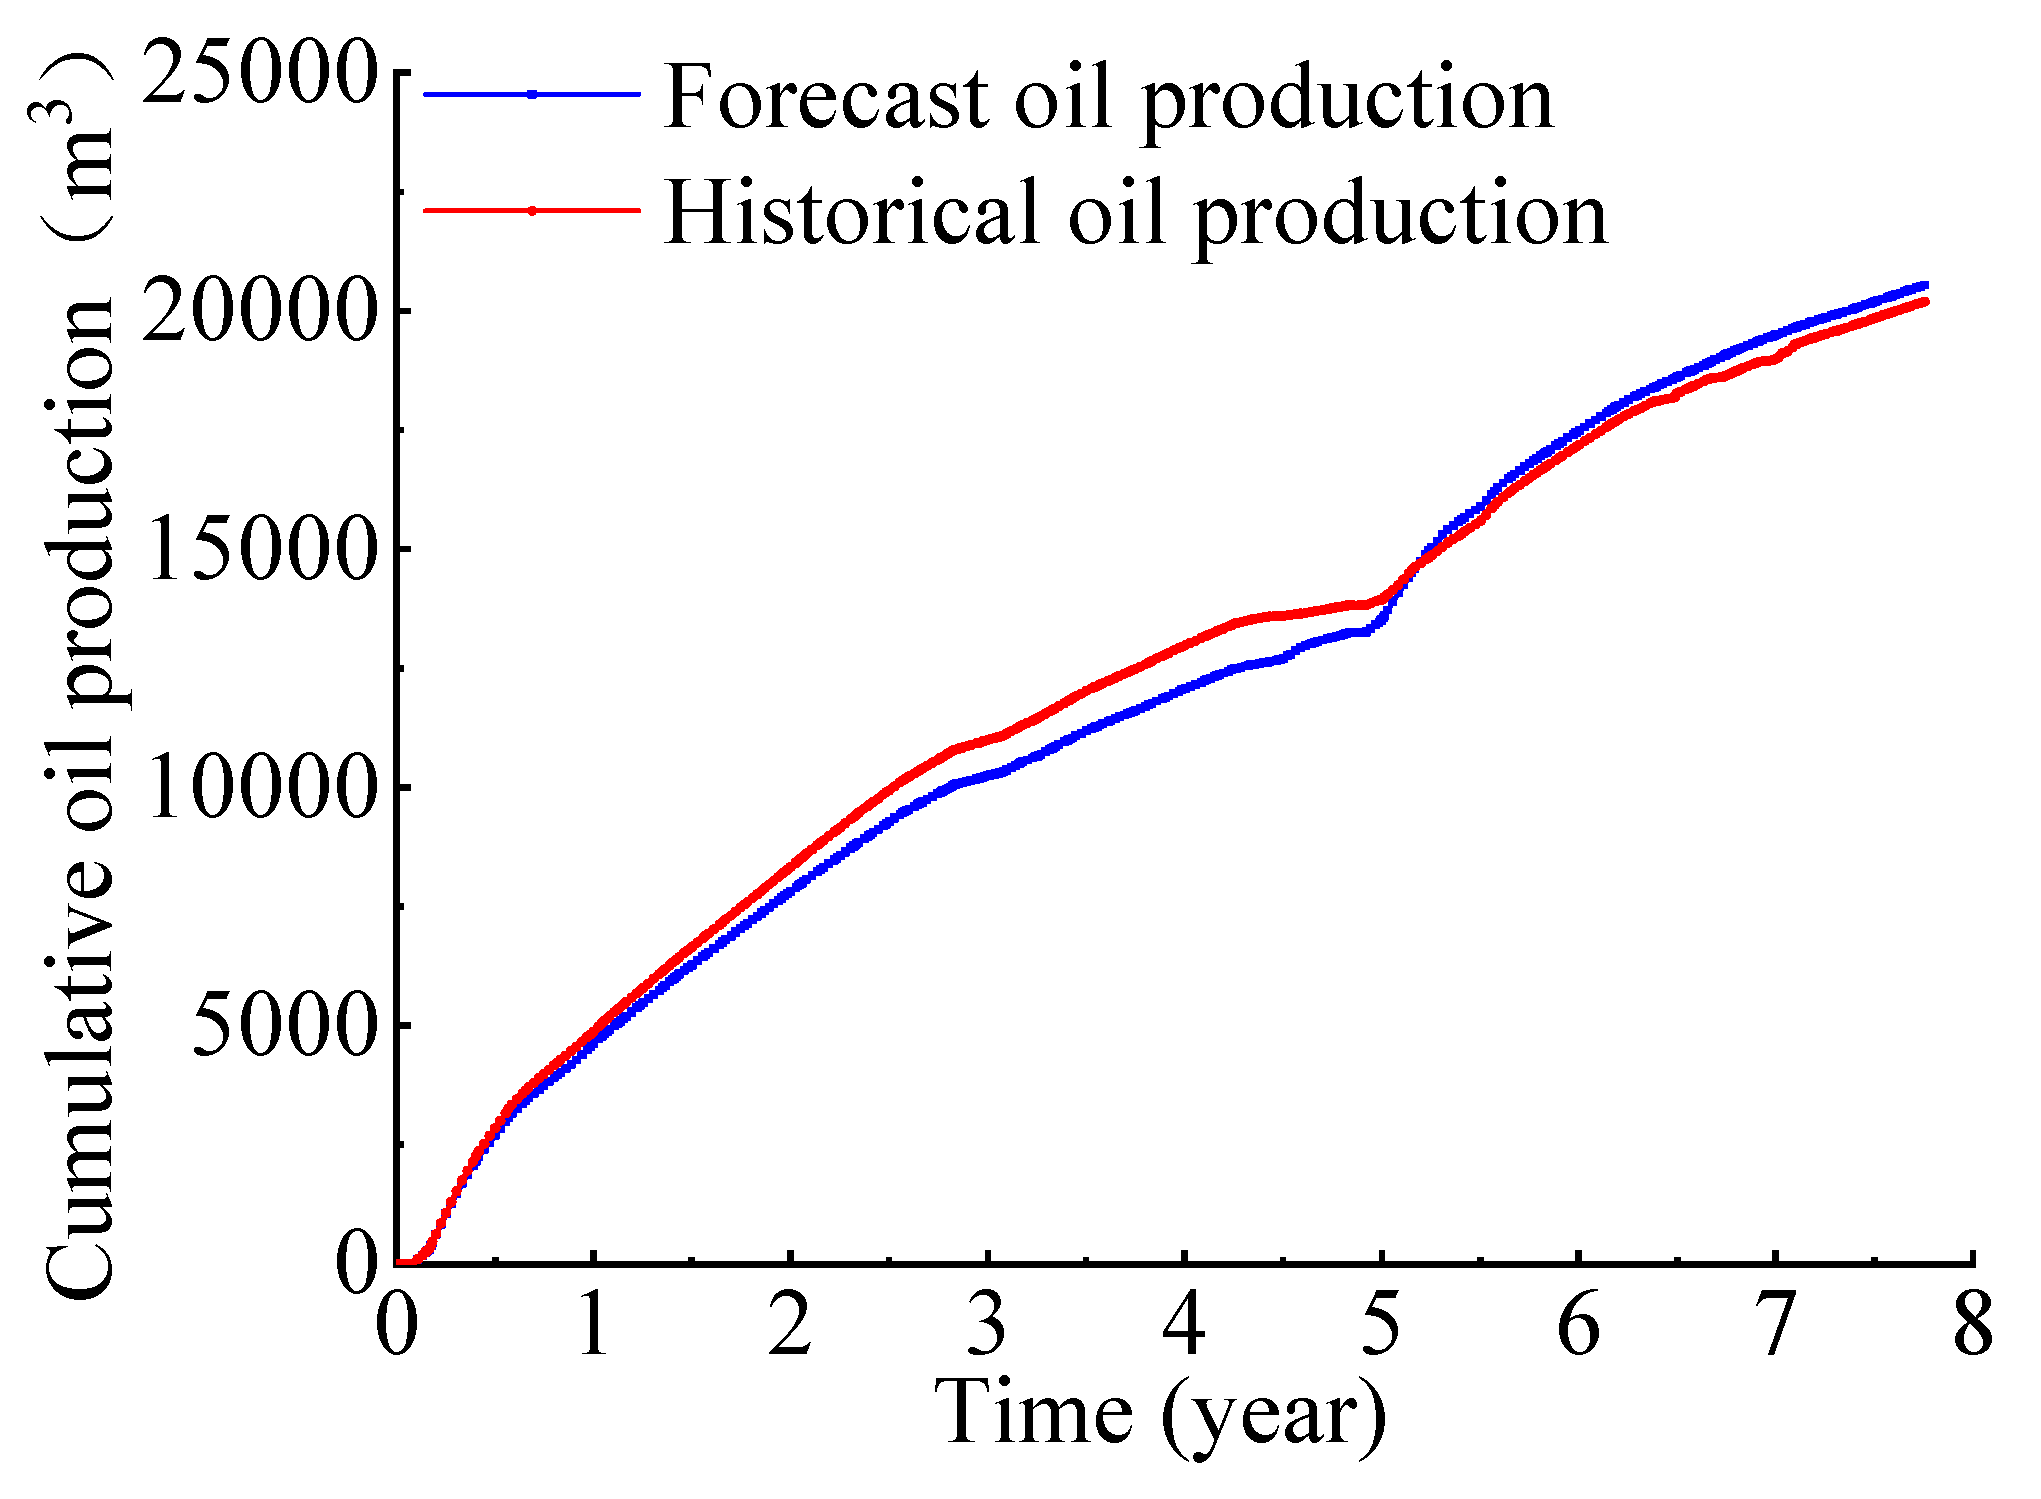
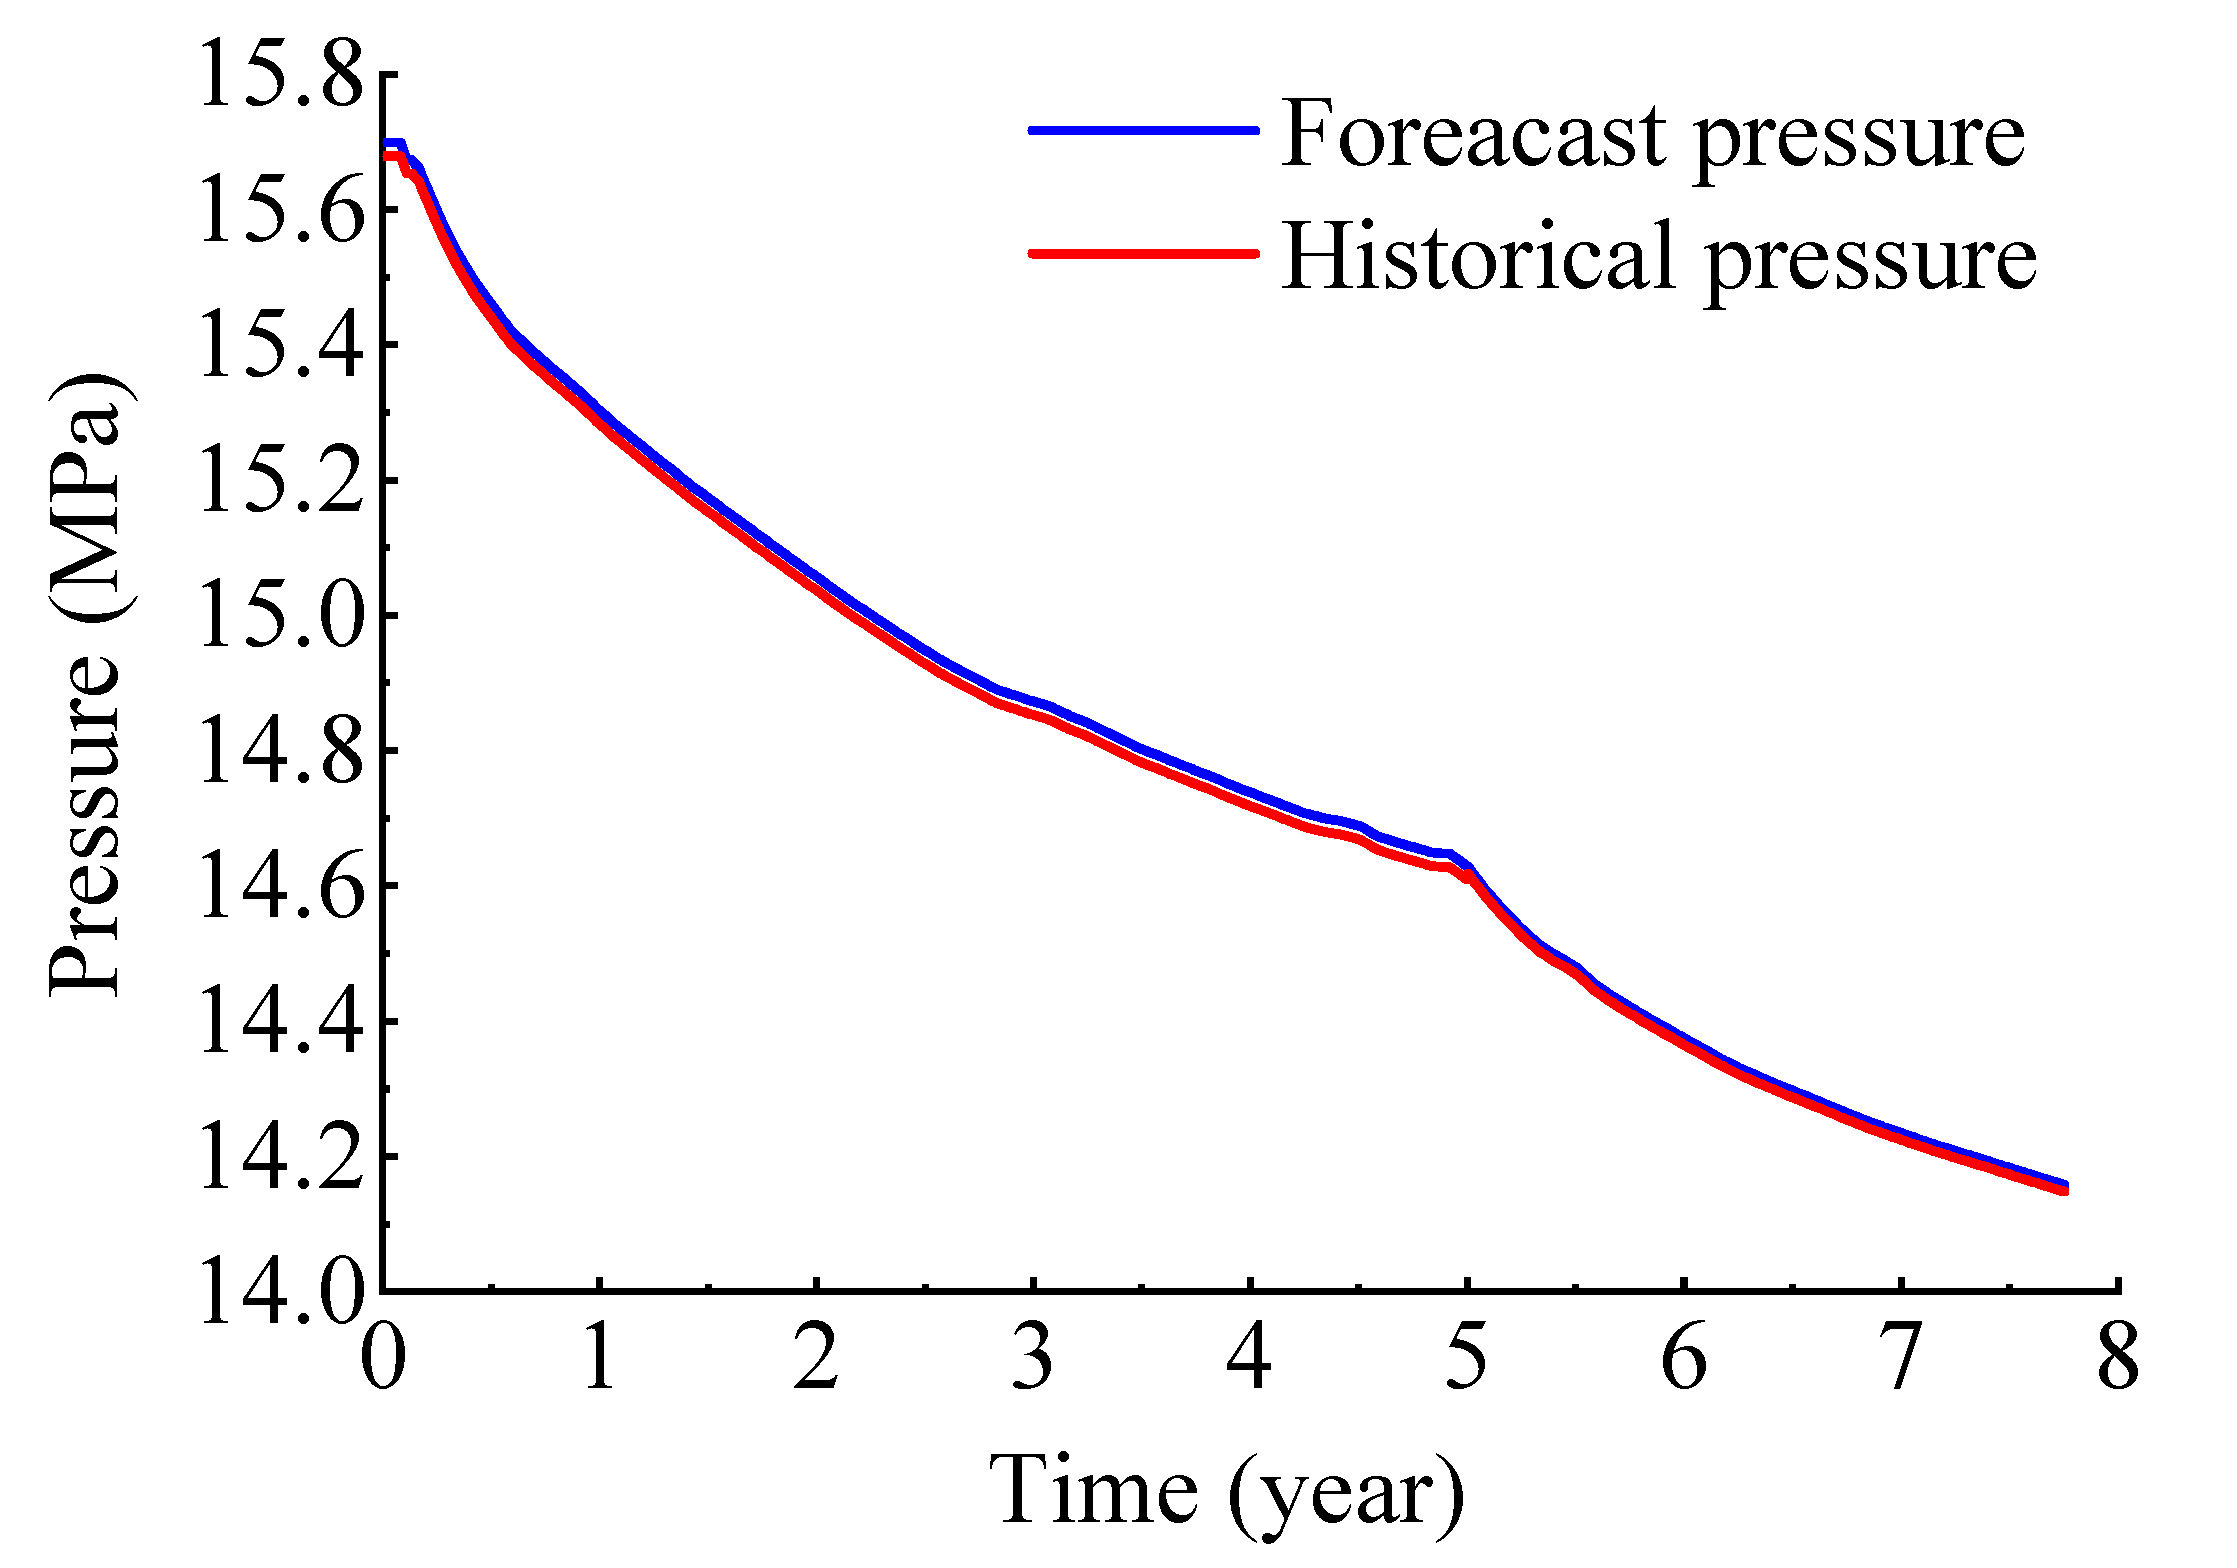
2.5. History Matching

After the geological modeling, fitting of oil and CO2 phases, and mapping of the compositional model parameters, production history matching was performed using the compositional model of the QP 49 and QP 50 well groups. In the fifth year of development, the QP 49 and QP 50 well groups implemented multi-stage fracturing, which resulted in a total of 20 artificial fractures and a raised production. The history-matching results showed that the matching degrees of cumulative oil production of the well group with formation pressure were greater than 95%, proving the reliability of the built model.

3. Experimental Scheme

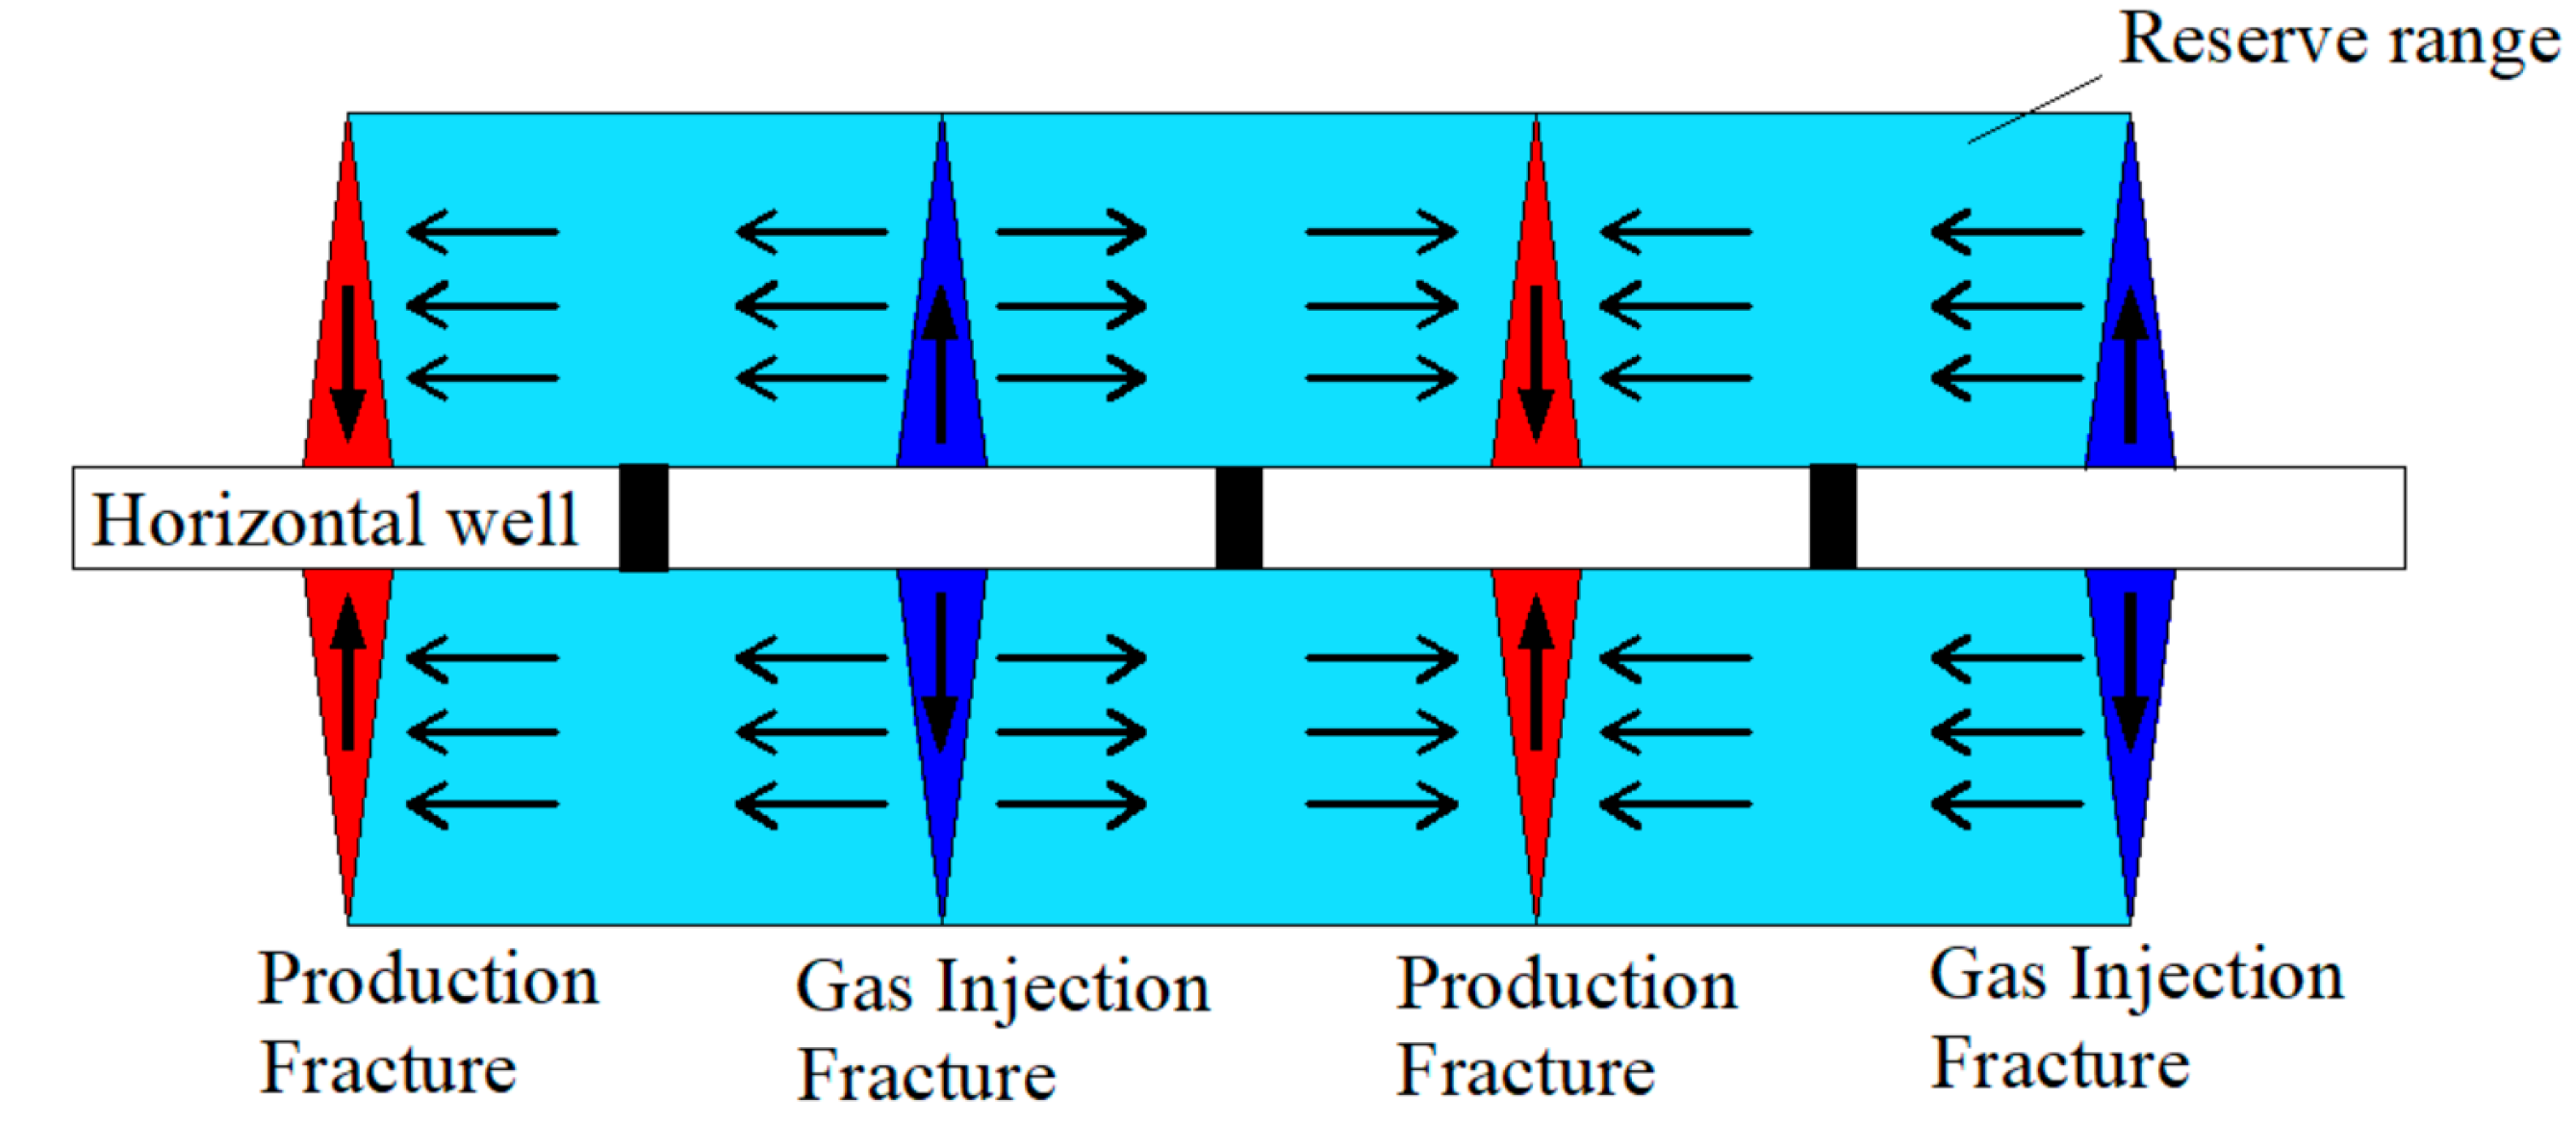
3.1. Development Modes

Numerical simulation was carried out for three different development modes, namely depletion, huff-n-puff, and inter-fracture gas flooding. For each development mode, the simulation duration was 15 years, and the specific parameters are shown in Table 3.

3.2. Injection Medium

The fracture-to-facture gas flooding simulation involved three different injection media, namely CO2, N2, and natural gas, and the specific parameters are shown in Table 4.

4. Results

4.1. Development Modes

4.1.1. Oil Recovery

The oil recoveries of different development modes were calculated [41]. The oil recovery is defined as the ratio of produced oil to total geological oil reserves, and the range of geological reserves is the cuboid zone enclosed by the fracture length and the two ends of the horizontal well, as shown in Figure 5. In the simulation process, the entire geological model, except this zone, was set as non-flow, with a permeability of zero.
The results of the oil recoveries of the three different development methods are shown in Figure 6. After 15 years of development, the oil recovery of the depletion mode was only 13.51%. The oil recovery of gas injection huff-n-puff was 40.27% (26.76% higher than that of the depletion mode). The oil recovery of the inter-fracture gas flooding reached 48.87% (8.6% higher than that of gas injection huff-n-puff). It is shown that gas injection greatly improves the oil recovery of tight reservoirs, and the EOR performance of inter-fracture gas flooding is better than gas injection huff-n-puff.

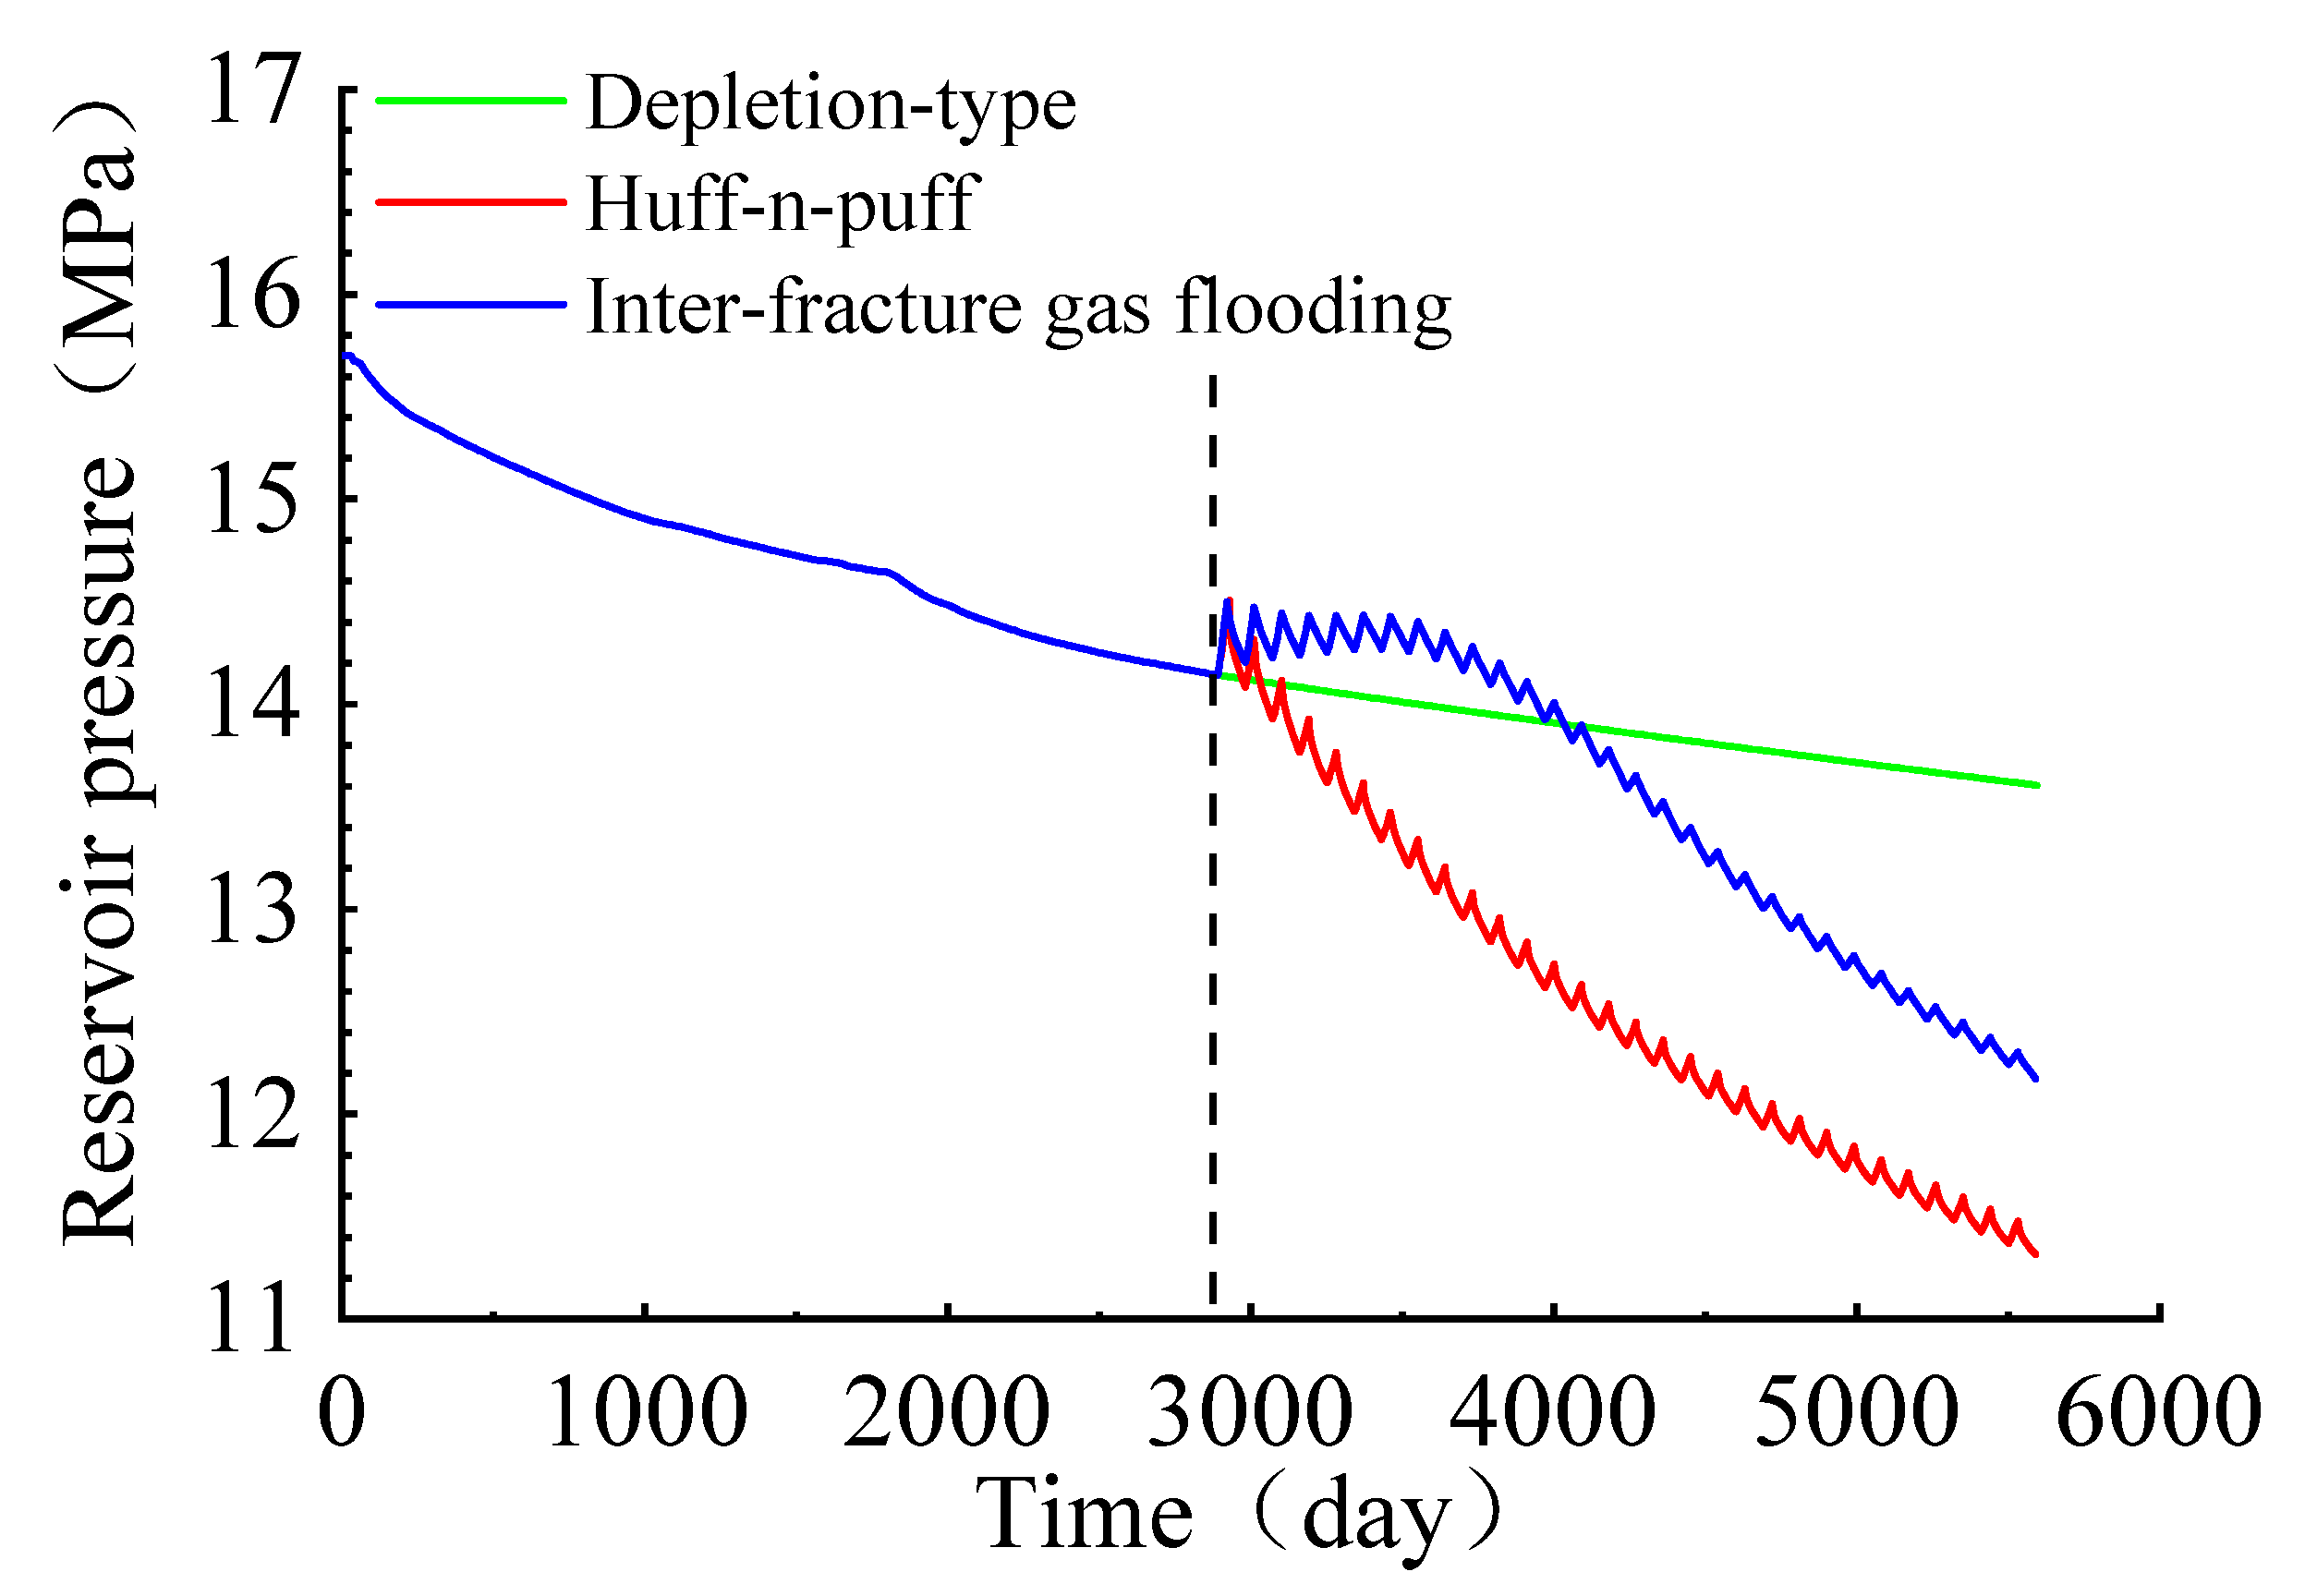
4.1.2. Pressure Change Pattern

The pressure changes in the three different development modes are shown in Figure 7. The formation pressure of the depletion mode decreased slowly—after about 15 years of production, the pressure dropped from 15.8 MPa to 13.6 MPa. The formation pressure dropped rapidly with gas injection because CO2 dissolved into crude oil after injection, reduced the crude oil viscosity, increased the fluid flow ability in tight reservoirs, and promoted fluid flow in tight reservoirs [42]. After 7 years of gas injection huff-n-puff, the formation pressure decreased from 14.1 MPa to 11.3 MPa. After 7 years of inter-fracture gas flooding, the formation pressure decreased from 14.1 MPa to 12.2 MPa. Increased fluid mobility raised the production from tight reservoirs and reduced formation pressure. Oil recovery of the QP 49 and QP 50 well groups is shown in Figure 8.

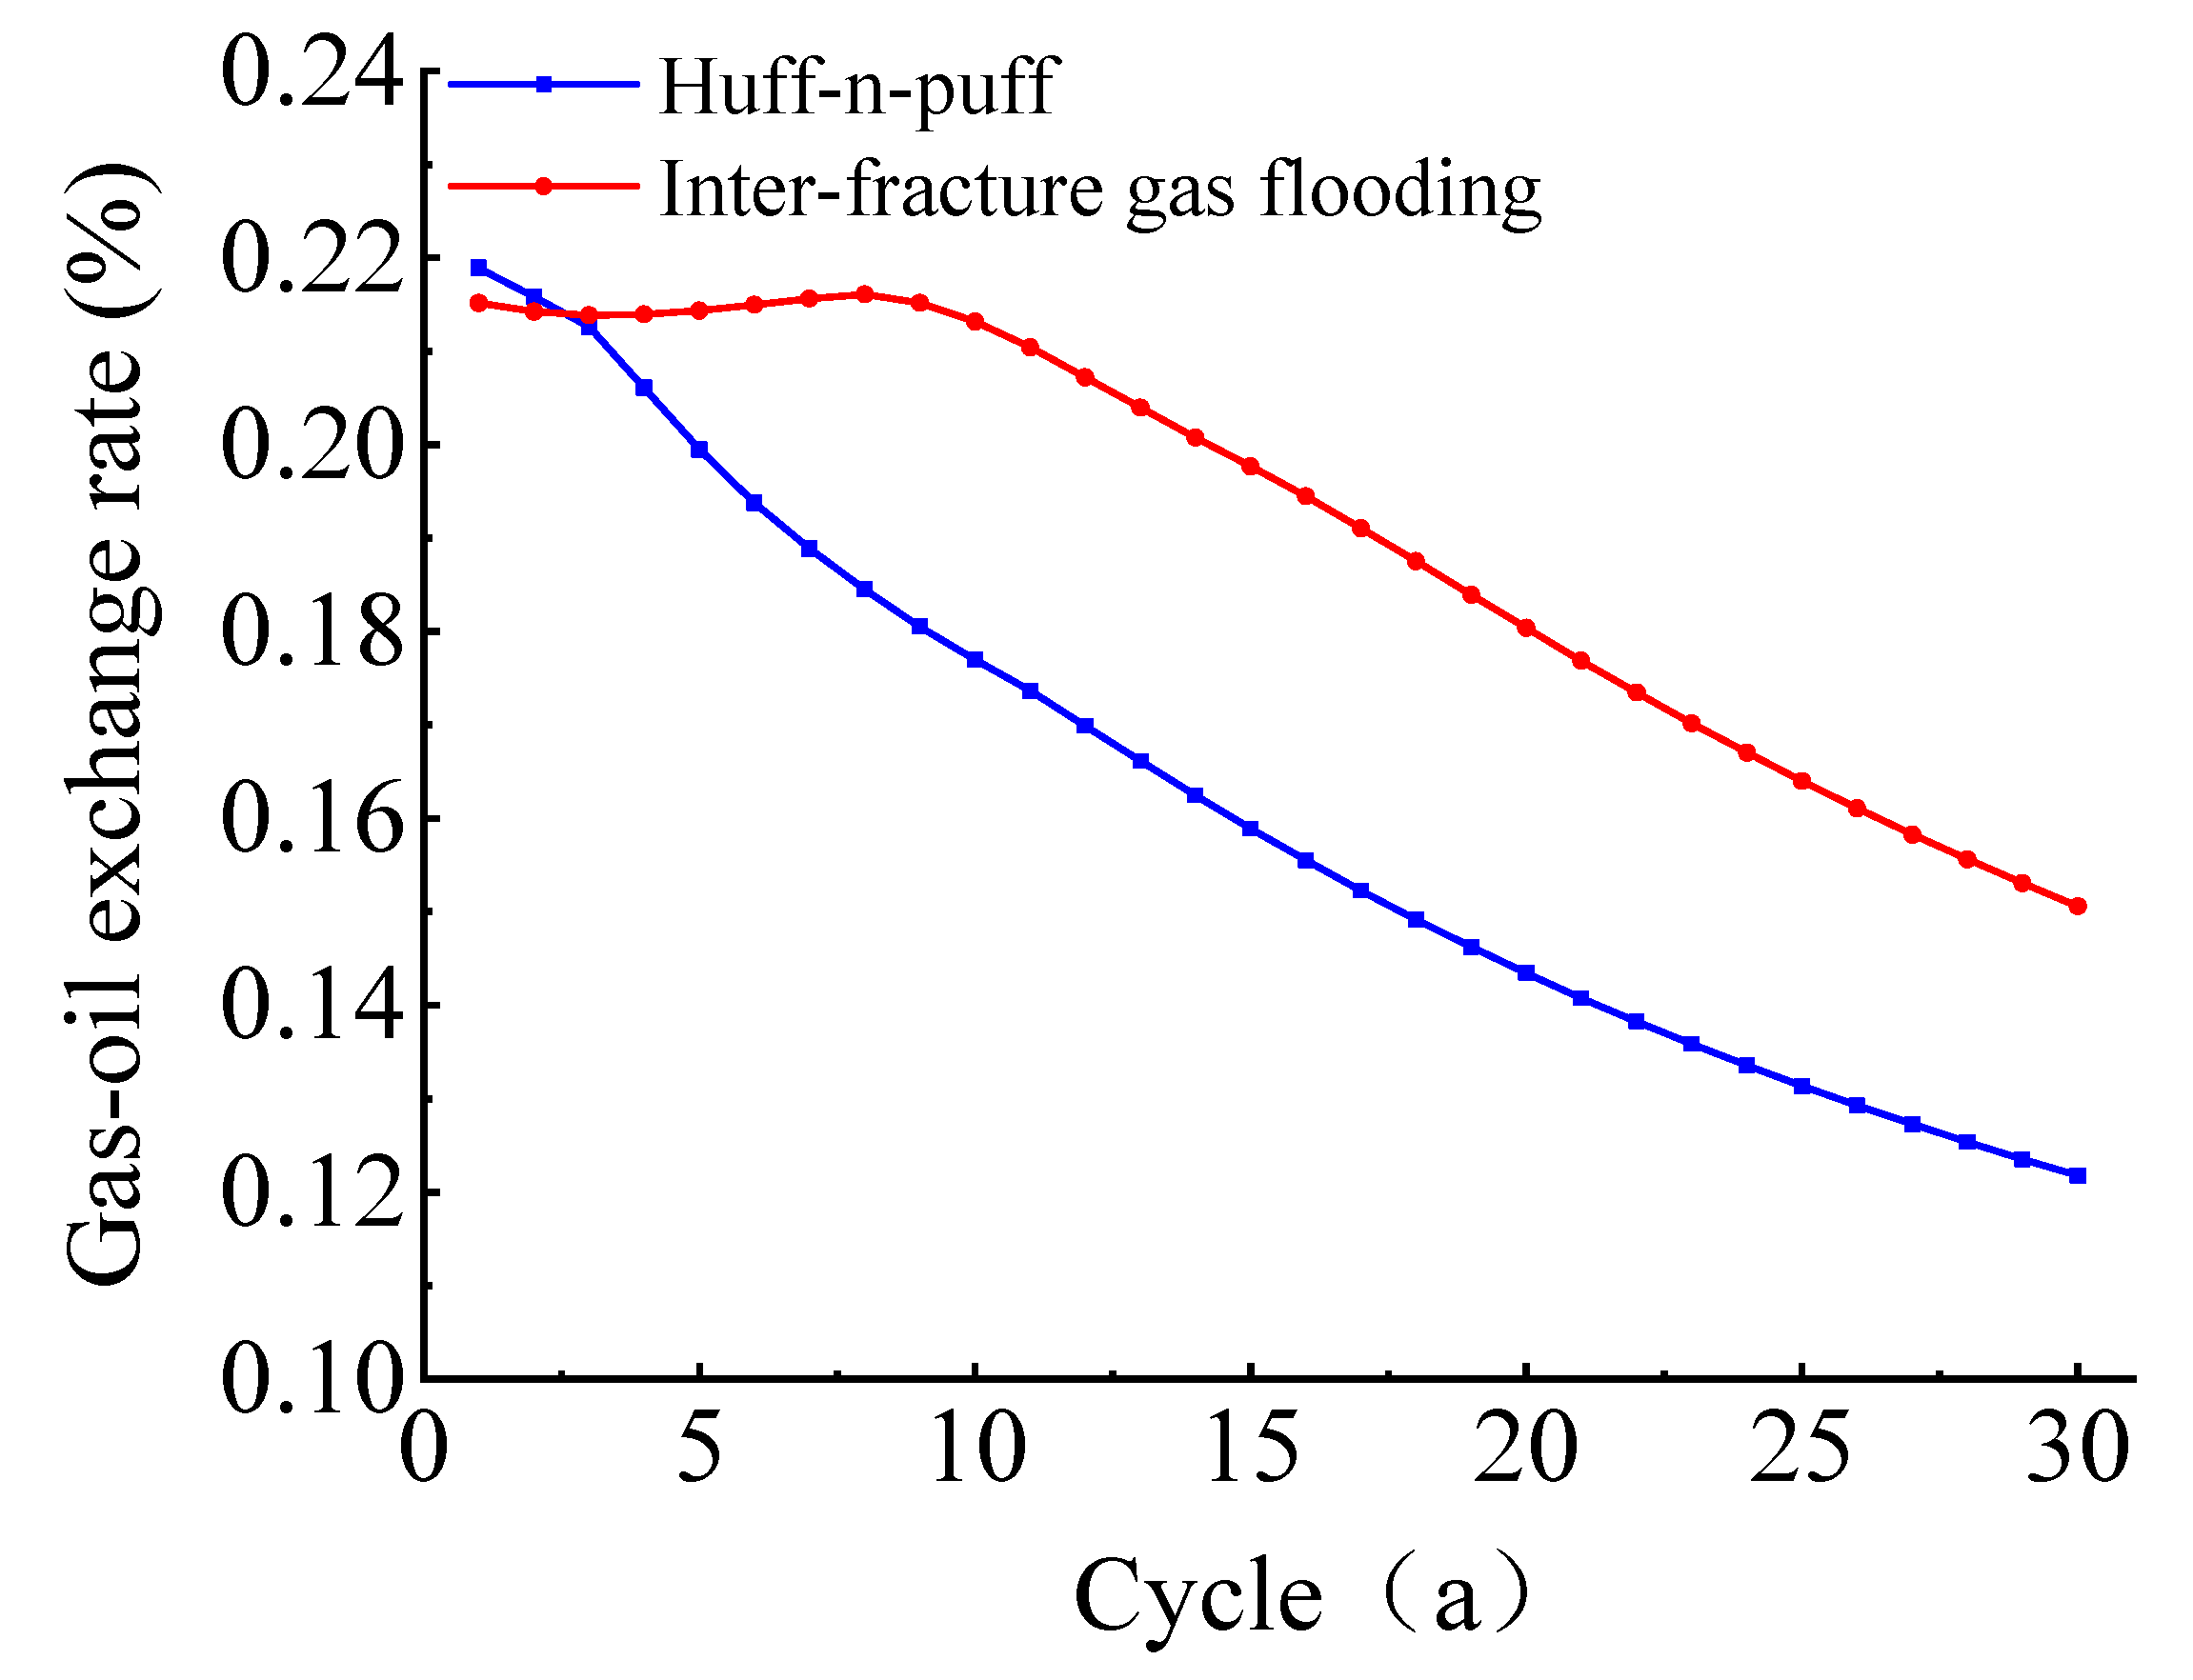
4.1.3. Gas–Oil Exchange Rate

The gas–oil exchange rate refers to the quantity of produced crude oil per unit mass of injected gas. Here, the gas–oil exchange rate (GOER) is defined as the ratio of oil production to injected gas volume, in m3/m3, as shown below:
G O E R = V o V g
where GOER is the gas–oil exchange rate, m3/m3; Vo is the oil production, m3; and Vg is the gas injection volume, m3.
With the increasing cycles of injection and production, the gas–oil exchange rate of gas injection huff-n-puff decreased gradually, and it dropped to only 0.12% after 30 injection–production cycles. The gas–oil exchange rate of inter-fracture gas flooding was stable in the first nine cycles (0.215%) and dropped to 0.15% after 30 cycles, which was still 25% higher than that of the gas injection huff-n-puff. These indicate that with the same gas injection rate, inter-fracture gas flooding displaces more crude oil out from the reservoir because in inter-fracture gas flooding, the path of gas injection and oil displacement is a loop, and the oil displacement among fractures is synchronized, which expands the swept area; however, huff-n-puff involves a displacement process with a direction that is the reverse of that of gas injection. Based on what was stated above and the formation pressure change pattern, inter-fracture gas flooding was chosen as the EOR method of tight reservoirs, although the swept area with supplemented formation energy was small, and the gas–oil exchange rate and oil recovery were low.
The comprehensive consideration of the above analysis and the reservoir numerical simulation results suggest that among the three different development modes, inter-fracture gas flooding presents the best performance to improve oil recovery. However, the performance of inter-fracture gas flooding was different under different conditions. Therefore, the factors affecting the EOR performance of inter-fracture asynchronous gas injection were analyzed.

4.2. Injection Media

4.2.1. Oil Recovery of Injection

The oil recoveries of the three different injection gases are shown in Figure 9 and Figure 10. The results showed that after 15 years of production, the oil recovery of inter-fracture N2 flooding reached 43.5%, and those of natural gas and CO2 flooding reached 46.6% and 48.9%, respectively. It is indicated that these three gases can all greatly improve the oil recovery of tight reservoirs. With the same injection and production parameters, the oil recovery was ranked as CO2 > gaseous hydrocarbons > N2. The recovery efficiency under different gas injection media is shown in Figure 11.

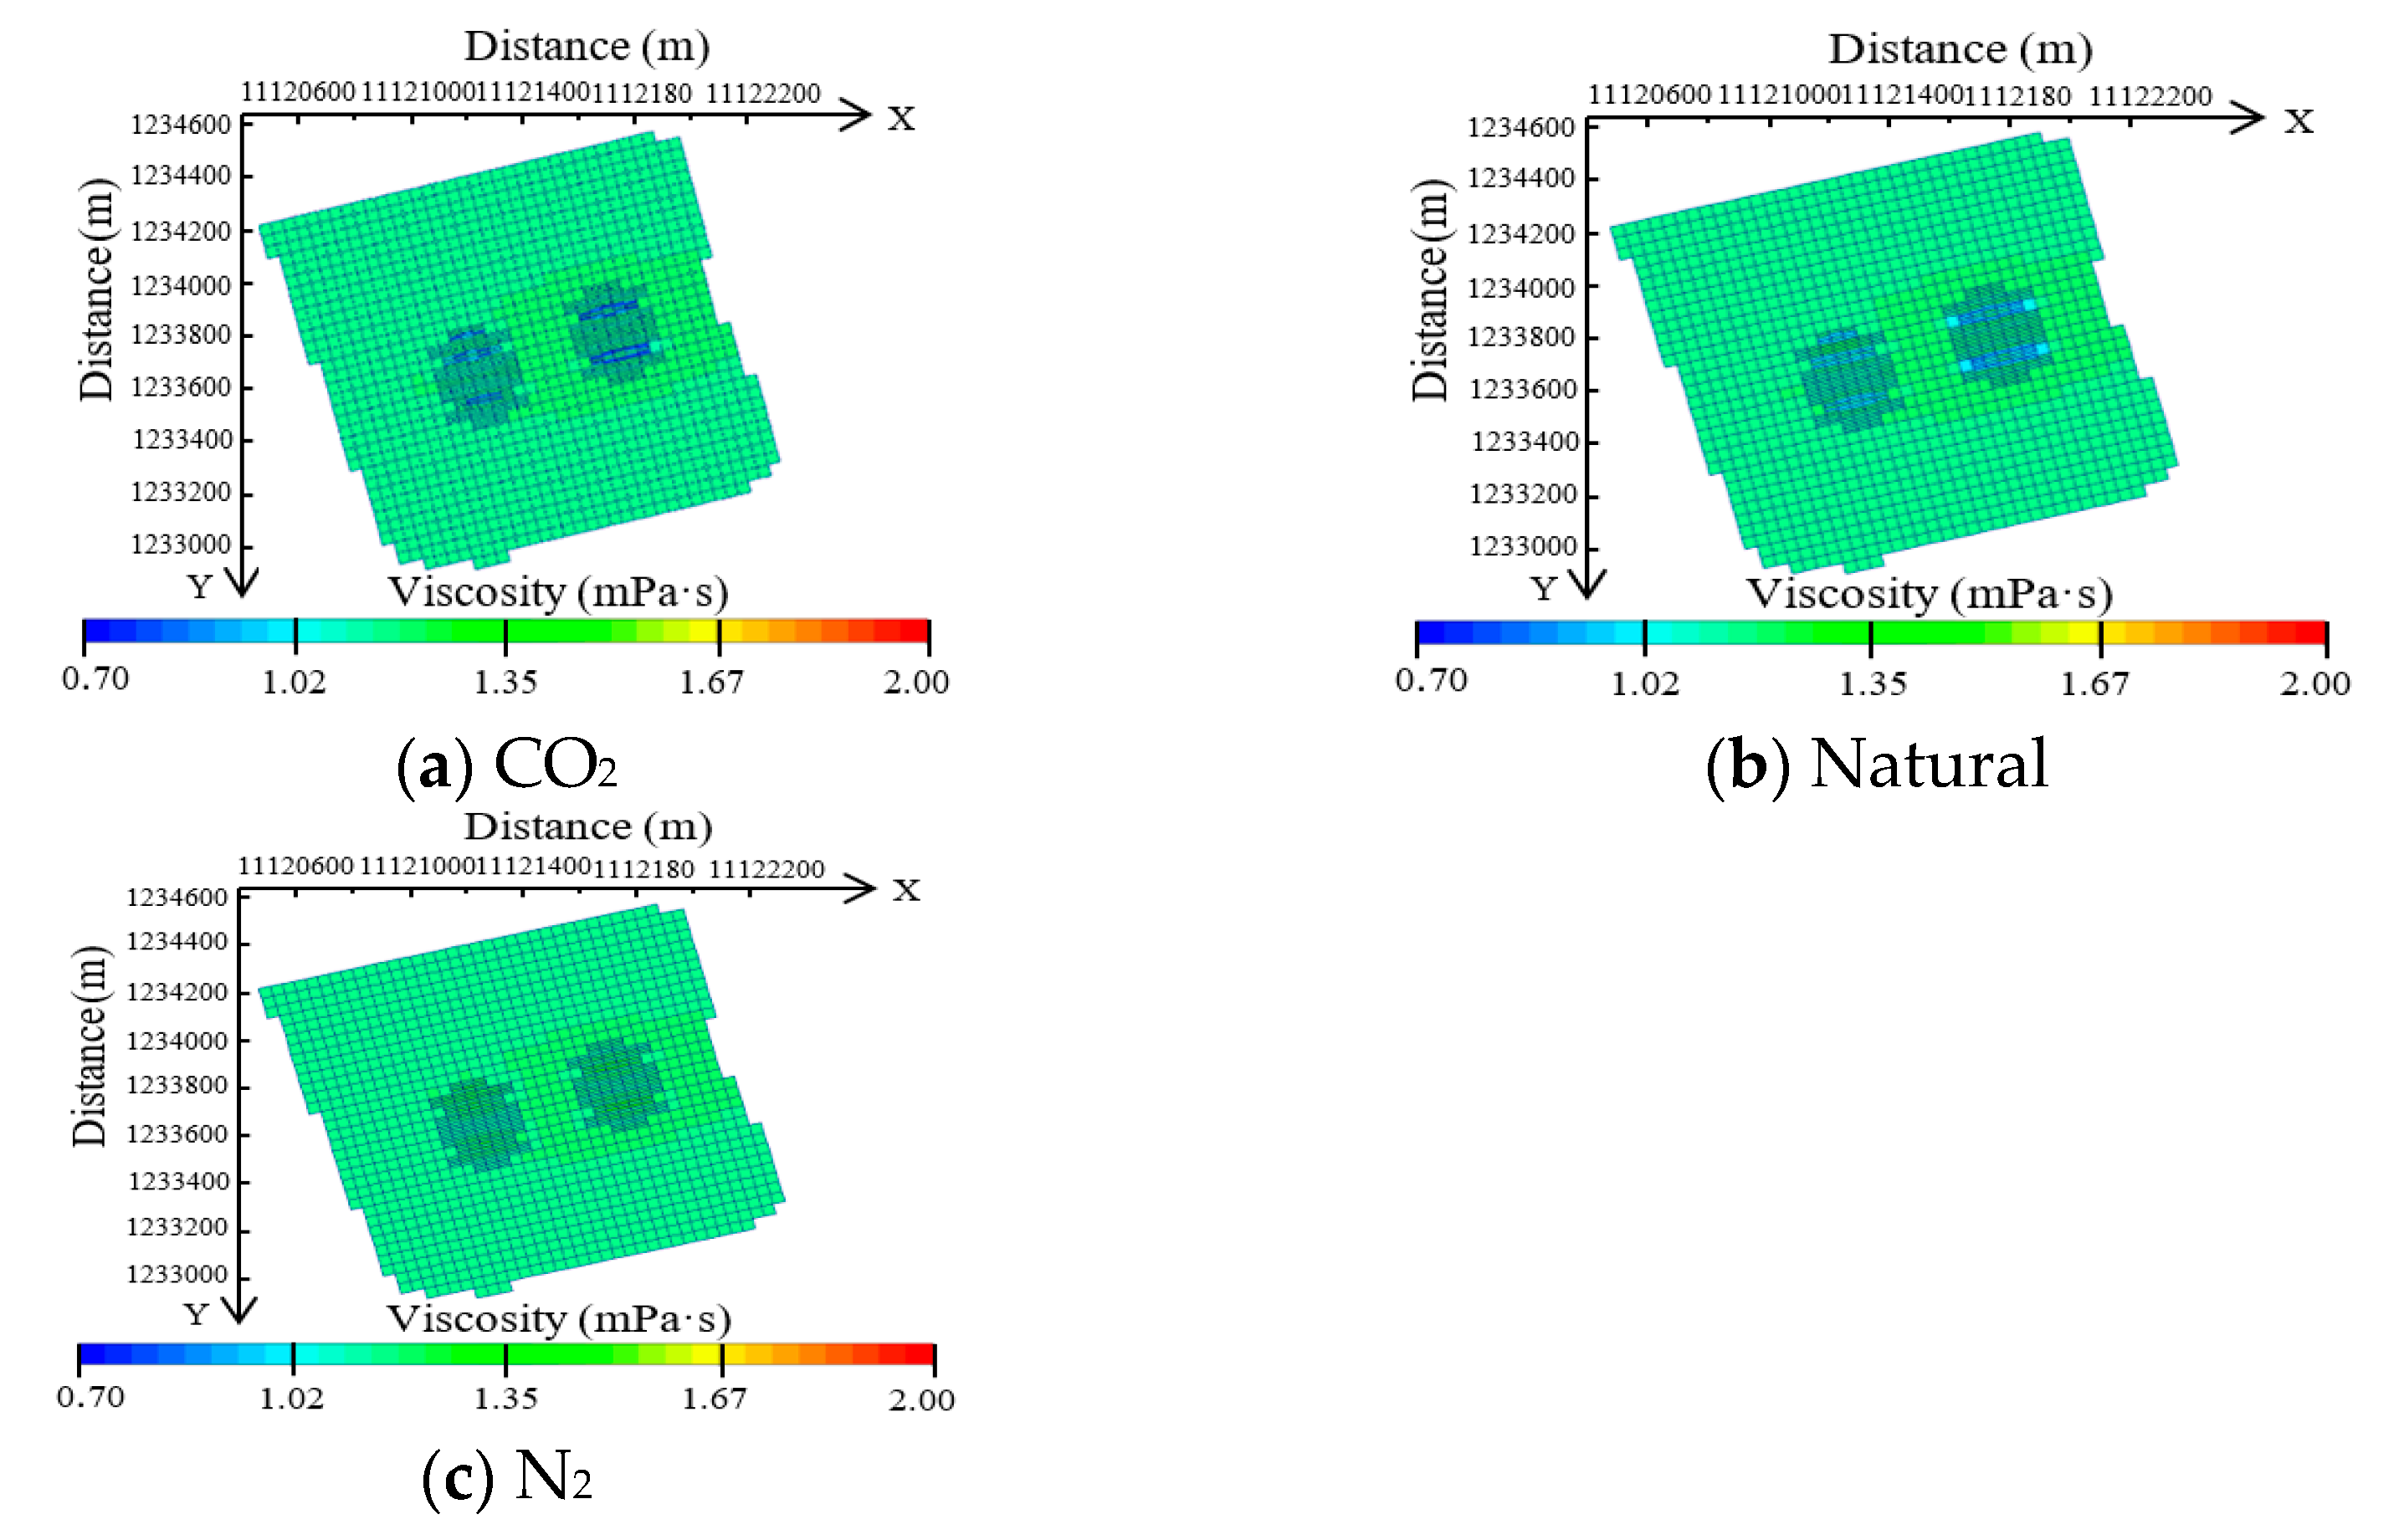
4.2.2. Physical Property Change Laws of Fluids

The viscosity and interfacial tension of fluids before production were analyzed to clarify the changes in the physical properties of fluids after the three different gases were injected into the reservoir. Lower viscosity and lower interfacial tension were associated with stronger flow ability.
(1)
Viscosity
CO2 injection reduced the viscosity of crude oil from 1.2 mP·s to 0.75 mP·s (a decrease of about 37.5%). Natural gas reduced the viscosity of crude oil from 1.2 mP·s to 1.0 mP·s (a decrease of about 16.7%). The viscosity of crude oil was almost unchanged after N2 injection.
(2)
Interfacial tension
With the injection of the three different gases, the lowest interfacial tension in some areas of the reservoir reached below 1 N/m. CO2 had the largest spread range, followed by that of natural gas, and N2 showed the smallest spread range. The change in PVT properties of formation oil depended on the amount of dissolved gas in oil, which is mainly related to the interfacial tension between oil and gas. Therefore, the numerical simulation results also demonstrated that CO2 flooding had the highest amount of dissolved gas in crude oil, and CO2 had the highest solubility in formation oil, followed by those of natural gas flooding and natural gas. N2 had the lowest solubility.

4.2.3. Pressure Change Pattern of Injection

The pressure change patterns in cases of the three different injected gases are shown in Figure 12. The formation pressure of CO2 injection decreased the fastest and dropped from 15.8 MPa to 12.2 MPa after 15 years of production. Natural gas injection was associated with the second fastest formation pressure decline—from 15.8 MPa to 12.6 MPa—after 15 years of production. N2 injection had the smallest reduction in formation pressure, with the pressure dropping from 15.8 MPa to 13.1 MPa after 15 years of production. The change of viscosity can be seen in Figure 12.
In view of the fluid flow ability, the law of pressure change was investigated. With the increasing fluid flow ability, the pressure dropped faster, and the oil recovery grew. After gas injection, the fluid flow ability through the reservoir was CO2 > natural gas > N2. Since CO2 can be easily dissolved into crude oil, it reduces the viscosity of crude oil and increases the fluid flow ability in tight reservoirs. Natural gas can also be dissolved into crude oil to improve fluid flow through the reservoir, but the effect is not as great as that of CO2 injection. Due to its chemical properties, N2 is fairly insoluble in crude oil and can only supplement formation energy.

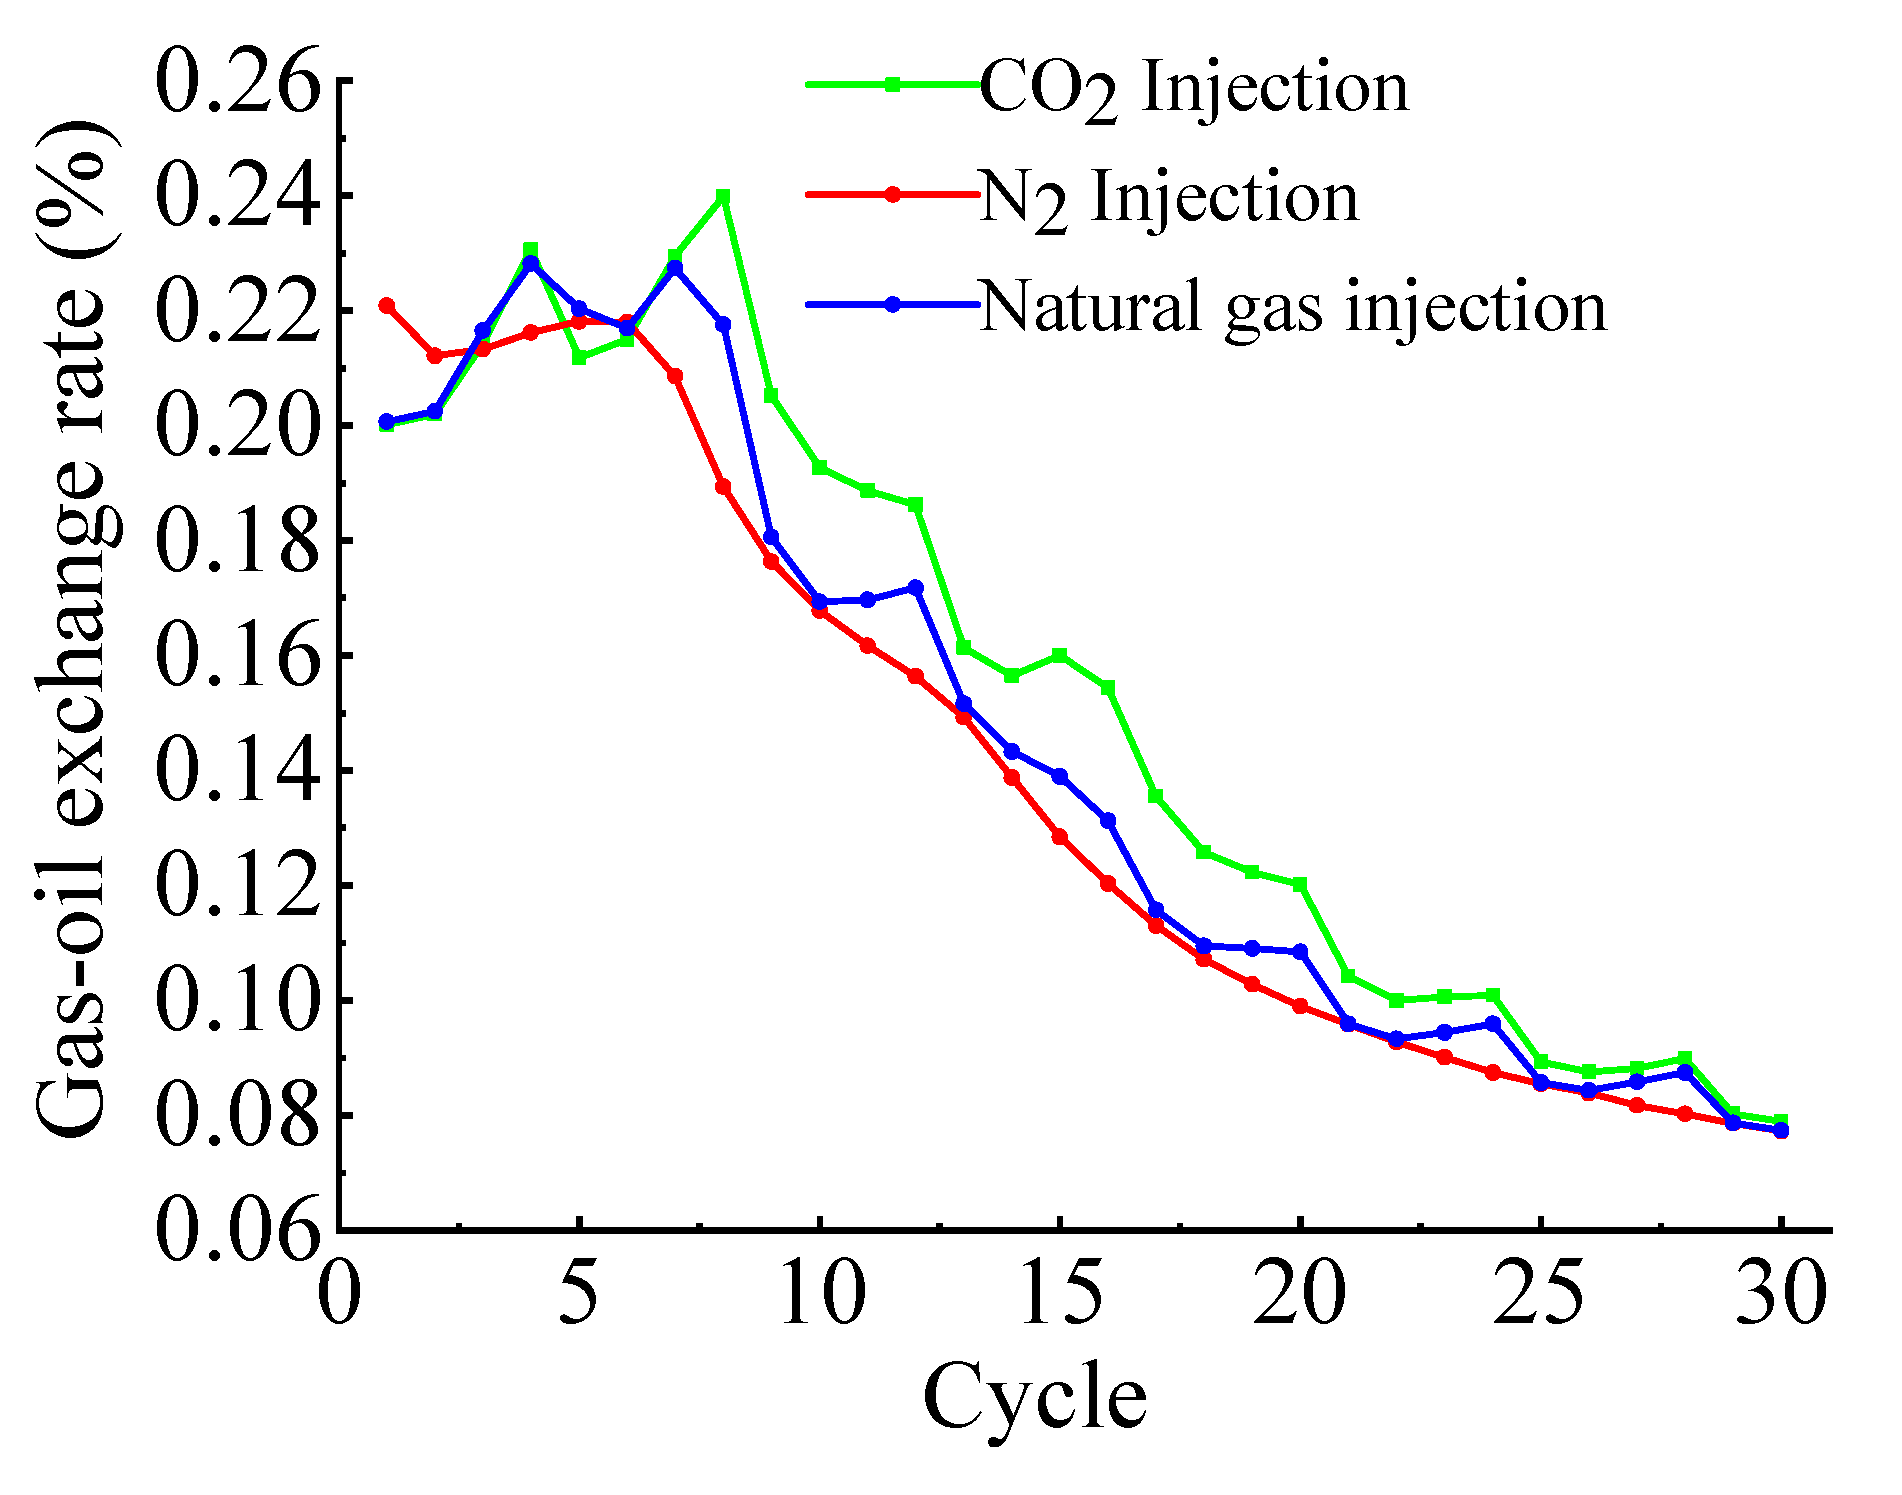
4.2.4. Gas–Oil Exchange Rate of Injection

A comparison among the gas–oil exchange rates of the three gases (Figure 13) indicates that for all of the three gas media, the overall trend of the gas–oil exchange rate decreased with the increasing cycles of injection and production; in other words, the utilization effect of injected gases gradually deteriorated. Among the three gases, CO2 had the highest gas–oil exchange rate, followed by those of natural gas and N2, successively (CO2 > natural gas > N2), because with the same amount of injected gas, the oil production of CO2 injection was the highest, and that of N2 injection was the lowest. The pressure change can be seen in Figure 14. The Gas–oil exchange rates change can be seen in Figure 15.

5. Conclusions

Compared with the depletion production and gas injection huff-n-puff, inter-fracture gas flooding can better improve the recovery factor of tight reservoirs. Through numerical simulation analysis, it is found that inter-fracture gas flooding has three important mechanisms to enhance oil recovery, which are as follows: (1) in inter-fracture gas flooding, injected gas dissolves into the reservoir fluid to reduce fluid viscosity and improve fluid flow through the reservoir; (2) inter-fracture gas flooding effectively supplements formation energy and increases formation pressure; and (3) inter-fracture gas flooding delivers simultaneous displacement, which effectively increases the swept area in tight reservoirs. Therefore, inter-fracture gas flooding is considered the most suitable method for the EOR of tight reservoirs.
Using CO2 as the injection medium of inter-fracture gas flooding delivers the maximal increment of the recovery factor. This is because (1) CO2 injection reduces the viscosity of crude oil by 37.5%, which is much higher than the viscosity reduction attributed to natural gas injection and N2 injection; (2) CO2 injection can greatly improve the swept area of the inter-fracture displacement process, compared with the cases of natural gas and N2; and (3) CO2 injection can maximize the fluid flow in the reservoir and increase the gas–oil exchange rate. Inter-fracture gas flooding is the preferred choice for EOR in tight reservoirs. Since gas can enter reservoirs with a permeability below 0.1 mD, inter-fracture gas flooding should also be considered an effective method for EOR in the future development of shale oil.

Author Contributions

Software, Y.X., Y.Q. and Z.S.; Writing—original draft, L.T.; Writing—review & editing, Y.Y.; Project administration, W.X. and R.S. All authors have read and agreed to the published version of the manuscript.

Funding

This research received no external funding.

Data Availability Statement

The original contributions presented in the study are included in the article, further inquiries can be directed to the corresponding author.

Conflicts of Interest

Authors Lingfang Tan, Wei Xiong, Rui Shen were employed by the company China National Petroleum Corporation. Author Yi Yang was employed by CNPC Engineering Technology R&D Company Limited. The remaining authors declare that the research was conducted in the absence of any commercial or financial relationships that could be construed as a potential conflict of interest.

References

  1. Li, Q.; Wang, Y.; Wang, F.; Ning, X.; Chuanbao, Z.; Zhang, J.; Zhang, C. Factor analysis and mechanism disclosure of supercritical CO2 filtration behavior in tight shale reservoirs. Environ. Sci. Pollut. Res. 2022, 29, 17682–17694. [Google Scholar] [CrossRef] [PubMed]
  2. Li, Q.; Liu, J.; Wang, S.; Guo, Y.; Han, X.; Li, Q.; Cheng, Y.; Dong, Z.; Li, X.; Zhang, X. Numerical insights into factors affecting collapse behavior of horizontal wellbore in clayey silt hydrate-bearing sediments and the accompanying control strategy. Ocean Eng. 2024, 297, 117029. [Google Scholar] [CrossRef]
  3. Khan, W.A.; Rui, Z.; Hu, T.; Liu, Y.; Zhang, F.; Zhao, Y. Application of Machine Learning and Optimization of Oil Recovery and CO2 Sequestration in the Tight Oil Reservoir. SPE J. 2024, 29, 2772–2792. [Google Scholar] [CrossRef]
  4. Du, S.; Shi, Y. Nanostructures in tight oil reservoirs: Multiple perspectives. Int. J. Hydrogen Energy 2024, 49, 884–896. [Google Scholar] [CrossRef]
  5. Zhou, X.; Wei, J.; Zhao, J.; Zhang, X.; Fu, X.; Shamil, S.; Abdumalik, G.; Chen, Y.; Wang, J. Study on pore structure and permeability sensitivity of tight oil reservoirs. Energy 2024, 288, 129632. [Google Scholar] [CrossRef]
  6. Storosten, H.B. US light tight oil supply flexibility-A multivariate dynamic model for production and rig activity. Energy Econ. 2024, 131, 107386. [Google Scholar] [CrossRef]
  7. Sheng, J.J. Enhanced oil recovery in shale reservoirs by gas injection. J. Nat. Gas Sci. Eng. 2015, 22, 252–259. [Google Scholar] [CrossRef]
  8. Yang, Y.; Xiong, W.; Liao, G.Z.; Gao, S.; Shen, R.; Zhang, J.; Li, Q. Flow mechanism of production decline during natural depletion after hydraulic fracturing of horizontal wells in tight oil reservoirs. Pet. Sci. Technol. 2022, 40, 383–400. [Google Scholar] [CrossRef]
  9. Thi Huong Vuong, G.; Nguyen, M.H.; Hoang, K. Oil price uncertainty, oil pricing reform, and corporate profitability: The case of China. PLoS ONE 2024, 19, e0297554. [Google Scholar] [CrossRef]
  10. Alharthy, N.; Teklu, T.W.; Kazemi, H.; Graves, R.M.; Hawthorne, S.B.; Braunberger, J.; Kurtoglu, B. Enhanced oil recovery in liquid-rich shale reservoirs: Laboratory to field. SPE Reserv. Eval. Eng. 2018, 21, 137–159. [Google Scholar] [CrossRef]
  11. Yu, H.; Fu, W.; Zhang, Y.; Lu, X.; Cheng, S.; Xie, Q.; Qu, X.; Yang, W.; Lu, J. Experimental study on EOR performance of CO2-based flooding methods on tight oil. Fuel 2021, 290, 119988. [Google Scholar] [CrossRef]
  12. Bhargav, B.J.; Economides, C.E. Simultaneous Multiple Plane to Plane Waterflooding in Fractured Tight Reservoirs. In Abu Dhabi International Petroleum Exhibition & Conference; Society of Petroleum Engineers: Richardson, TX, USA, 2017. [Google Scholar]
  13. Jiang, Z.; Liu, Z.; Zhao, P.; Chen, Z.; Mao, Z. Evaluation of tight waterflooding reservoirs with complex wettability by NMR data: A case study from Chang 6 and 8 members, Ordos Basin, NW China. J. Pet. Sci. Eng. 2022, 213, 110436. [Google Scholar] [CrossRef]
  14. Liang, T.; Zhao, X.; Yuan, S.; Zhu, J.; Liang, X.; Li, X.; Zhou, F. Surfactant-EOR in tight oil reservoirs: Current status and a systematic surfactant screening method with field experiments. J. Pet. Sci. Eng. 2021, 196, 108097. [Google Scholar] [CrossRef]
  15. He, Y.; Qiao, Y.; Qin, J.; Tang, Y.; Wang, Y.; Chai, Z. A Novel Method to Enhance Oil Recovery by Inter-Fracture Injection and Production Through the Same Multi-Fractured Horizontal Well. J. Energy Resour. Technol. 2021, 144, 043005. [Google Scholar] [CrossRef]
  16. Xiao, Z.; Ding, W.; Hao, S.; Taleghani, A.D.; Wang, X.; Zhou, X.; Sun, Y.; Liu, J.; Gu, Y. Quantitative analysis of tight sandstone reservoir heterogeneity based on rescaled range analysis and empirical mode decomposition: A case study of the Chang 7 reservoir in the Dingbian oilfield. J. Pet. Sci. Eng. 2019, 182, 106326. [Google Scholar] [CrossRef]
  17. Hu, J.; Sun, R.; Zhang, Y. Investigating the horizontal well performance under the combination of micro-fractures and dynamic capillary pressure in tight oil reservoirs. Fuel 2020, 269, 117375. [Google Scholar] [CrossRef]
  18. Yang, Y.; Liao, G.; Xiong, W.; Shen, R.; Zhang, J.; Li, Q.; Wang, S.; Zhang, J.; Tan, L.; Shao, G. Physical and numerical simulation of inter-fracture flooding in heterogeneous tight oil reservoirs. Energy Rep. 2022, 8, 12970–12978. [Google Scholar] [CrossRef]
  19. Yang, Y.; Liao, G.; Xiong, W.; Zhang, J.; Gao, S.; Shen, R.; Wang, S.; Zhang, J.; Tan, L.; Liu, Y. Evaluation of Enhanced Oil Recovery Potential using Interfracture Water Flooding in a Tight Oil Reservoir. Lithosphere 2022, 2022 (Special 12), 6606336. [Google Scholar] [CrossRef]
  20. Fu, X.; Bonifas, P.; Finley, A.; Lemaster, J.; He, Z.; Venepalli, K. Tight Oil EOR through Inter-Fracture Gas Flooding within a Single Horizontal Well. In Proceedings of the SPE Annual Technical Conference and Exhibition, Calgary, AB, Canada, 30 September–2 October 2019. [Google Scholar] [CrossRef]
  21. Lu, X.; Cao, B.; Xie, K.; Cao, W.; Liu, Y.; Zhang, Y.; Wang, X.; Zhang, J. Enhanced oil recovery mechanisms of polymer flooding in a heterogeneous oil reservoir. Pet. Explor. Dev. 2021, 48, 169–178. [Google Scholar] [CrossRef]
  22. Wang, J.; Song, H.; Wang, Y. Investigation on the micro-flow mechanism of enhanced oil recovery by low-salinity water flooding in carbonate reservoir. Fuel 2020, 266, 117156. [Google Scholar] [CrossRef]
  23. Gao, S.; Yang, Y.; Liao, G.; Xiong, W.; Liu, H.; Shen, R.; Ye, L.; Zhu, W.; An, W. Experimental research on inter-fracture asynchronous injection-production cycle for a horizontal well in a tight oil reservoir. J. Pet. Sci. Eng. 2022, 208, 109647. [Google Scholar] [CrossRef]
  24. Zhu, P.; Balhoff, M.T.; Mohanty, K.K. Simulation of fracture-to-fracture gas injection in an oil-rich shale. In Proceedings of the SPE Annual Technical Conference and Exhibition. Society of Petroleum Engineers, Houston, TX, USA, 28–30 September 2015. [Google Scholar] [CrossRef]
  25. Cheng, S.; Wang, Y.; Lang, H.; Yu, H.; Zhu, C.; Yang, B.; Zhang, H.; Sun, Z. feasibility of inter-fracture injection and production for the same multi-stage fractured horizontal. Acta Pet. Sin. 2017, 38, 1411–1419. [Google Scholar]
  26. Pu, H.; Li, Y. Novel capillarity quantification method in IOR process in Bakken shale oil reservoirs. In Proceedings of the SPE Improved Oil Recovery Conference, Tulsa, OK, USA, 11–13 April 2016; SPE: New York, NY, USA, 2016. [Google Scholar] [CrossRef]
  27. Han, B.; Cui, G.; Wang, Y.; Zhang, J.; Zhai, Z.; Shi, Y.; Yan, F.; Li, W. Effect of fracture network on water injection huff-puff for volume stimulation horizontal wells in tight oil reservoir: Field test and numerical simulation study. J. Pet. Sci. Eng. 2021, 207, 109106. [Google Scholar] [CrossRef]
  28. He, Y.; Cheng, S.; Sun, Z.; Chai, Z.; Rui, Z. Improving oil recovery through fracture injection and production of multiple fractured horizontal wells. J. Energy Resour. Technol. 2020, 142, 053002. [Google Scholar] [CrossRef]
  29. Abdulwarith, A.; Sinha, U.; Gautam, S.; Dindoruk, B. A New Physics-Based CO2 EOR Screening Tool for Offshore Applications. In Proceedings of the SPE Improved Oil Recovery Conference, Tulsa, OK, USA, 22–25 April 2024; SPE: New York, NY, USA, 2024; p. D031S022R001. [Google Scholar]
  30. Miłek, K.; Szott, W.; Tyburcy, J.; Lew, A. Reservoir Simulations of Hydrogen Generation from Natural Gas with CO2 EOR: A Case Study. Energies 2024, 17, 2321. [Google Scholar] [CrossRef]
  31. Roozbahani, A.; Soofivand, F.; Al-Tameemi, A.S.H.; Abdollahi, H.; Saatchi, S.; Ansari, A. A contrasting analysis of CO2 and N2 foam flood for enhanced oil recovery and geological storage of CO2. Pet. Res. 2024, 9, 55–60. [Google Scholar] [CrossRef]
  32. Wang, Z.; Lu, H.; Zhao, C.; Zhu, E. Investigating phase dynamics of reservoir fluids in CO2 huff-n-puff enhanced oil recovery. Geoenergy Sci. Eng. 2024, 238, 212925. [Google Scholar] [CrossRef]
  33. He, Y.; Cheng, S.; Chai, Z.; Patil, S.; Rui, R.; Yu, H. Application of Inter-Fracture Injection and Production in a Cluster Well to Enhance Oil Recovery. In Proceedings of the SPE Annual Technical Conference and Exhibition, Calgary, AB, Canada, 30 September–2 October 2019; OnePetro: Richardson, TX, USA, 2019. [Google Scholar] [CrossRef]
  34. Tang, W.; Zhou, F.; Zheng, X.; Wang, Q.; Wang, Y.; Hu, L.; Sheng, J.J.; Wang, X. Evaluation of matrix energization effect of pre-fracturing method in tight reservoirs—A comparative study of CO2, N2, and water. Geoenergy Sci. Eng. 2024, 233, 212535. [Google Scholar] [CrossRef]
  35. Páez, D.E. Natural gas production associated to oil from oil and gas reservoirs. In Advances in Natural Gas; Elsevier: Amsterdam, The Netherlands, 2024; pp. 125–168. [Google Scholar]
  36. He, Y.; Chai, Z.; Huang, J.; Li, P.; Cheng, S.; Killough, J. Simulation of Inter-Fracture Injection and Production in Tight Reservoirs Based on Compartmental Embedded Discrete Fracture Model. In Proceedings of the SPE Reservoir Simulation Conference, Galveston, TX, USA, 10–11 April 2019; OnePetro: Richardson, TX, USA, 2019. [Google Scholar] [CrossRef]
  37. Kang, S.; Pu, C.; Wang, K.; Ding, Q.; Jin, X. Study on mechanisms and influencing factors of the inter-fracture asynchronous huff-n-puff technology of horizontal well in the tight oil reservoir. In IOP Conference Series: Earth and Environmental Science, Proceedings of the Asia Conference on Geological Research and Environmental Technology, Kamakura, Japan, 21–22 August 2021; IOP Publishing: Bristol, UK, 2021; Volume 859, p. 012018. [Google Scholar] [CrossRef]
  38. Wang, G.; Chang, X.; Yin, W.; Li, Y.; Song, T. Impact of diagenesis on reservoir quality and heterogeneity of the Upper Triassic Chang 8 tight oil sandstones in the Zhenjing area, Ordos Basin, China. Mar. Pet. Geol. 2017, 83, 84–96. [Google Scholar] [CrossRef]
  39. Xu, Z.; Liu, L.; Wang, T.; Wu, K.; Dou, W.; Song, X.; Feng, C.; Li, X.; Ji, H.; Yang, Y.; et al. Characteristics and controlling factors of lacustrine tight oil reservoirs of the Triassic Yanchang Formation Chang 7 in the Ordos Basin, China. Mar. Pet. Geol. 2017, 82, 265–296. [Google Scholar] [CrossRef]
  40. Zhao, J. Sedimentary characteristics and development pattern of turbidity event of Chang 6 and Chang 7 oil reservoirs in the southern Ordos Basin. Acta Pet. Sin. 2008, 29, 389–394. [Google Scholar]
  41. Zhu, H.; Song, Y.; Lei, Z.; Tang, X. 4D-stress evolution of tight sandstone reservoir during horizontal wells injection and production:A case study of Yuan 284 block, Ordos Basin, NW China. Pet. Explor. Dev. 2022, 49, 156–169. [Google Scholar] [CrossRef]
  42. Shi, Y.; Wu, B.; Wang, H.; Li, Y.; Liu, Z.; Xu, C.; Qin, J.; Li, Y.; Song, Z.; Liu, H. Insights into CO2 huff-n-puff mechanisms from laboratory experiment and single-well pilot test in the Lucaogou tight oil reservoir, Jimsar sag, China. Geoenergy Sci. Eng. 2024, 232, 212456. [Google Scholar] [CrossRef]
Figure 1. Permeability in the X direction of well groups QP 49 and QP 50.
Energies 17 04254 g001
Figure 2. Relative permeability curves of oil and gas.
Energies 17 04254 g002
Figure 3. Relative permeability curves of oil and water.
Energies 17 04254 g003
Figure 4. The bubble point pressure fitting diagram.
Energies 17 04254 g004
Figure 5. Oil production history fitting map.
Energies 17 04254 g005
Figure 6. Pressure history fitting map.
Energies 17 04254 g006
Figure 7. Schematic diagram of the numerical simulation of inter-fracture gas flooding in a horizontal well.
Energies 17 04254 g007
Figure 8. Oil recovery of the QP 49 and QP 50 well groups in cases of different development modes.
Energies 17 04254 g008
Figure 9. Reservoir pressures of different production modes.
Energies 17 04254 g009
Figure 10. Gas–oil exchange rate: huff-n-puff vs. inter-fracture gas flooding.
Energies 17 04254 g010
Figure 11. Oil recovery in cases of different gas injection media.
Energies 17 04254 g011
Figure 12. Viscosity of crude oil after the injection of different gases.
Energies 17 04254 g012
Figure 13. Interfacial tension after the injection of different gases.
Energies 17 04254 g013
Figure 14. Reservoir pressures in cases of different gas injection media.
Energies 17 04254 g014
Figure 15. Gas–oil exchange rates in cases of different gas injection media.
Energies 17 04254 g015
Table 1. Basic reservoir properties of the Yuan 284 block [38,39,40].
ParameterValueParameterValue
Reservoir depth−2200 mInitial formation pressure15.8 MPa
Crude oil density0.72 g/cm3Reservoir temperature69.7 °C
Formation oil viscosity0.97 cpFormation oil compressibility13.9 × 10−4 MPa−1
Compressibility of formation water1.95 × 10−4 MPa−1Formation water viscosity0.7 cp
Table 2. Composition of well fluids.
ComponentContent FractionComposition
(mol%)
Molar Mass (g·mol−1)Critical Pressure (MPa)Critical Temperature (K)Deviation Factor
N20.07446587.4465828.0133.3944126.20.04
CO20.003430.34344.017.3866304.70.225
C10.112634211.2634216.0434.8042190.60.013
C20.0595.930.074.6839305.430.0986
C30.038433.84344.0974.2455369.80.1524
C40.016961.69658.1243.747419.50.1956
C5+0.03953.9577.0093.216482.960.26496
C7+0.1718517.185124.152.5798607.70.35834
C11+0.4837348.373275.031310000.4
Table 3. Parameter settings of the different development modes.
Development ModeGas Injection Time per Cycle (d)Gas Production Time per Cycle (d)CyclesInjection MediumInjection Rate (m3/d)
Depletion
Huff-n-puff306030CO230,000
Inter-fracture Gas flooding306030CO230,000
Table 4. Gas injection parameter settings for different injection media.
Injection MediumGas Injection Time per Cycle (d)Gas Production Time per Cycle (d)Injection-Production RatioCyclesInjection Rate (m3/d)
CO230600.53030,000
N230600.53030,000
Natural gas30600.53030,000
Disclaimer/Publisher’s Note: The statements, opinions and data contained in all publications are solely those of the individual author(s) and contributor(s) and not of MDPI and/or the editor(s). MDPI and/or the editor(s) disclaim responsibility for any injury to people or property resulting from any ideas, methods, instructions or products referred to in the content.

