Article

Influence of Microwave-Assisted Chemical Thermohydrolysis of Lignocellulosic Waste Biomass on Anaerobic Digestion Efficiency

1
Department of Environmental Engineering, Faculty of Geoengineering, University of Warmia and Mazury in Olsztyn, 10-720 Olsztyn, Poland
2
Department of Water Supply and Sewage Systems, Faculty of Civil Engineering and Environmental Sciences, Bialystok University of Technology, 15-351 Bialystok, Poland
*
Author to whom correspondence should be addressed.
Energies 2024, 17(17), 4207; https://doi.org/10.3390/en17174207
Submission received: 4 July 2024 / Revised: 20 August 2024 / Accepted: 21 August 2024 / Published: 23 August 2024
(This article belongs to the Special Issue Advanced Waste-to-Energy Technologies)

Abstract

:
To date, microwave radiation has been successfully used to support the chemical hydrolysis of organic substrates in the laboratory. There is a lack of studies on large-scale plants that would provide the basis for a reliable evaluation of this technology. The aim of the research was to determine the effectiveness of using microwave radiation to support the acidic and alkaline thermohydrolysis of lignocellulosic biomass prior to anaerobic digestion on a semi-industrial scale. Regardless of the pretreatment options, similar concentrations of dissolved organic compounds were observed, ranging from 99.0 ± 2.5 g/L to 115.0 ± 3.0 in the case of COD and from 33.9 ± 0.92 g/L to 38.2 ± 1.41 g/L for TOC. However, these values were more than twice as high as the values for the substrate without pretreatment. The degree of solubilisation was similar and ranged between 20 and 28% for both monitored indicators. The highest anaerobic digestion effects, ranging from 99 to 102 LCH4/kgFM, were achieved using a combined process consisting of 20 min of microwave heating, 0.10–0.20 g HCl/gTS dose, and alkaline thermohydrolysis. For the control sample, the value was only 78 LCH4/kgFM; for the other variants, it was between 79 and 94 LCH4/kgFM. The highest net energy gain of 3.51 kWh was achieved in the combined alkaline thermohydrolysis with NaOH doses between 0.10 and 0.20 g/gTS. The use of a prototype at the 5th technology readiness level made it possible to demonstrate that the strong technological effects of the thermohydrolysis process, as demonstrated in laboratory tests to date, do not allow for positive energy balance in most cases. This fact considerably limits the practical application of this type of solution.

1. Introduction

Methane fermentation is one of the most promising methods for converting organic substrates into biofuels, despite its high investment costs and considerable technical and technological complexity. The reason for this is that biogas can be produced from almost any biodegradable organic matter, including waste of different characteristics and origins [1]. However, it should be noted that the profitability of this process is directly related to the cost of obtaining the organic substrate, its methane production capacity, and the potential for energy utilisation [2]. Consequently, the methane fermentation of waste materials, mainly from agriculture, the municipal sector, and the food industry, is justified from an economic and environmental point of view [3]. At the same time, the viability of utilising energy crops is being increasingly questioned, mainly due to the agrotechnical costs of their production, harvesting, maintenance, and storage [4].
It is also generally accepted that appropriate pretreatment of the substrate prior to anaerobic digestion increases the biodegradation efficiency of organic matter and the gaseous metabolite yield of the fermentative bacteria [5]. This is directly related to the depolymerisation of the biomass, the breaking up of compact lignocellulosic structures, the transition of organic matter into the dissolved phase, and the intensification of solubilisation [6]. In addition, pretreatment often results in lower toxicity and resistance to biodegradation, which leads to increased cascade fermentation and the maintenance of efficient and stable methane (CH4) production [7]. Pretreatment accelerates the biochemical degradation of organic substances, thereby reducing the fermentation time by a quantitative value and limiting the hydraulic retention time. This stimulation leads directly to a reduction in the equipment volume required (quantitative value, if possible) and lower investment costs (quantitative value, if possible) [8]. The pretreatment of substrates largely enhances the availability of low-molecular, easily degradable organic material for acid-producing hydrolysing bacteria and microorganisms. The most important criterion for evaluating the effects achieved by pretreatment is the increase in biomethane yield. However, indirect process determinants, such as changes in the indicators characterising the organic material content or the concentration of molecular material in the dissolved phase, are also used [9]. Previous studies have presented a variety of processes and technological solutions for the pretreatment of organic substrates, including sonication [10], hydrothermal depolymerisation [11], hydrodynamic cavitation [12], electrokinetic disintegration [13], the use of acids [14], bases [15], strong oxidising agents [16], solid carbon dioxide [17], and many others [18]. Mankar et al. [19] summarised the effects of different pretreatment processes on the physical properties and chemical composition of lignocellulosic biomass. They stated that efforts still need to be made to develop an economical and environmentally friendly pretreatment approach that enables complete delignification and 100% conversion of biomass into value-added products. It was also suggested to use a combination of two or more biomass pretreatment approaches to maximise biomass degradation [19]. One of the promising solutions is the use of electromagnetic microwave radiation (EMR). Deng et al. [20] and Hoang et al. [21] have shown that MW induces changes in the ultrastructure of the lignocellulose complex, as evidenced by the appearance of several cracks on its surface. Mohan et al. [22] have demonstrated molecular changes, degradation of polymers, and disintegration of the crystalline arrangements of cellulose molecules. The fragmentation of the lignocellulose structure reduces the particle size and increases the outer surface area [23]. In the study by Peng et al. [24], the surface area of microcrystalline cellulose (180–200 μm) increased by 56% after 20 min of MW pretreatment at 800 W. Ha et al. [25] observed that when cellulose was pretreated in ionic liquids, polymerisation decreased when the microwave power increased to 50 W. Similarly, Hu et al. [26] found a 9.2% decrease in crystallinity index with MW pretreatment, reflecting the degradation of the crystalline structure of cellulose and showing the effectiveness of pretreatment. Passos et al. [27] found a high content of dissolved organic substances such as proteins, carbohydrates, and lipids in the hydrolysate. In the study by Amini et al. [28], MW pretreatment of eucalyptus sawdust increased enzymatic saccharification, releasing 88% of xylose within 30 min at 180 °C, which was 3.5 times higher than conventional heating. Nowicka et al. [29], in turn, found that a 20-min MW treatment at 150 °C increased the amount of glucose produced by a maximum of 62% compared to a sample without pretreatment. Conventional heating is based on heat exchange at the surface, whereas in EMR, heat is generated by the interaction of an object in an electromagnetic field. Balat (2011) [30] argues that the advantages of MW compared to conventional heating include the short process duration, the high selectivity, and the lower amount of energy input. The most commonly used EMR frequency in industrial applications is 2.45 GHz, with a corresponding wavelength of 12.2 cm and a quantum energy of 1.02 × 10⁻⁵ eV [31]. In the case of EMR, the interaction with bodies takes place at the molecular level due to the low quantum energy and is primarily based on the interaction between the electromagnetic field and the molecules [32].
Dielectric materials have dipoles that move, and they are subjected to the distortion motion of the electron cloud in non-polar molecules in the presence of an external electric field [33]. The dipole motion generates friction within the dielectric material, which is dissipated as heat [34]. Previous research has shown that EMR can promote chemical, acid, and alkaline thermohydrolysis reactions [35]. The great potential of this solution and its competitiveness compared to other conventional heating methods have been demonstrated [36]. Among other things, the non-thermal properties of MW increase its susceptibility to the biodegradation of organic substrates. Also, volume heating by EMR increases the heating rate inside the biomass, thereby reducing the temperature gradient between the surface and the interior of the heated object, resulting in reduced process time and appreciable energy savings [37,38]. Heat conduction in conventional heating processes is determined by thermal gradients; however, with MW heating, electromagnetic energy is converted into thermal energy inside the body, resulting in rapid heating of the materials [39].
A very important feature of EMR, in which energy transport occurs at the molecular level, is its selectivity. If the heated object has different dielectric properties, the MWs interact selectively with different materials; it is possible to heat selected objects directly [40]. MW heating also makes it possible to quickly start and stop the heating process. When you interrupt the radiation supply, heating is stopped immediately, allowing precise control of the time and amount of energy used in biological processes [41]. This functionality is critical for wastewater treatment processes, among others, where the MW energy is immediately directed to the bacterial biofilm, resulting in thermal and non-thermal radiation effects [42]. One phenomenon that occurs during MW heating is the possibility of the formation of so-called hot spots. These are spots in the heated material with a much higher temperature [43]. This is due to non-uniform heating caused by the non-linear relationship between the electromagnetic and thermal properties of the material. In addition to material heterogeneity, hot spots can also occur as a result of standing waves. These cause certain regions to be exposed to higher energy, which leads to increased heating. The shape and size of the microwave chamber have been shown to influence the development of this phenomenon, which is caused by the formation of a standing wave [44].
Although there is evidence of the great potential of using EMR in the pretreatment of biomass prior to anaerobic digestion, many verification studies still need to be carried out to confirm the application benefits of this solution. The work carried out so far has mainly involved small-scale experiments using laboratory microwave generators and fermentation bioreactors [45]. The results obtained are, of course, very valuable from a cognitive point of view, but their value for further commercialisation and final use in practice is insufficient. It is necessary to increase the scale and carry out the preliminary work in pilot plants where realistic conditions are guaranteed and the operating and working parameters of the device are reproduced as faithfully as possible. Above all, this increases the technological readiness level, enables a reliable energy balance, and provides a basis for assessing the failure rate of the system and the actual operating difficulties. In many cases, very optimistic results obtained on a laboratory scale cannot be transferred to the practical application possibilities of innovative solutions. Therefore, the results of laboratory tests must be verified on a pilot scale, where the operating conditions correspond to those in real installations. Such a procedure is in line with the commonly used method for assessing technology maturity, in which we distinguish between technology readiness levels (TRLs). This enables a coherent and standardised development scheme for different types of technologies. The aim of this research was to determine the effectiveness of EMR to support the acidic and alkaline thermohydrolysis of a mixture of cattle manure and straw during the pretreatment of this organic substrate prior to anaerobic digestion. In contrast to previous work, the present study was carried out using a microwave generator operated on a semi-industrial scale. This allowed the estimation of a reliable energy balance and the identification of potential operational difficulties. The specific objectives included determining the efficiency of the pretreatment process by assessing the concentrations of organic compounds in the dissolved phase and the degree of solubilisation; assessing the efficiency of anaerobic digestion by monitoring the amount and composition of biogas produced; determining the kinetics of the methane fermentation process; verifying the correlation between the indirect effects of pretreatment and the efficiency of anaerobic digestion; and estimating the energy balance of the process.

2. Materials and Methods

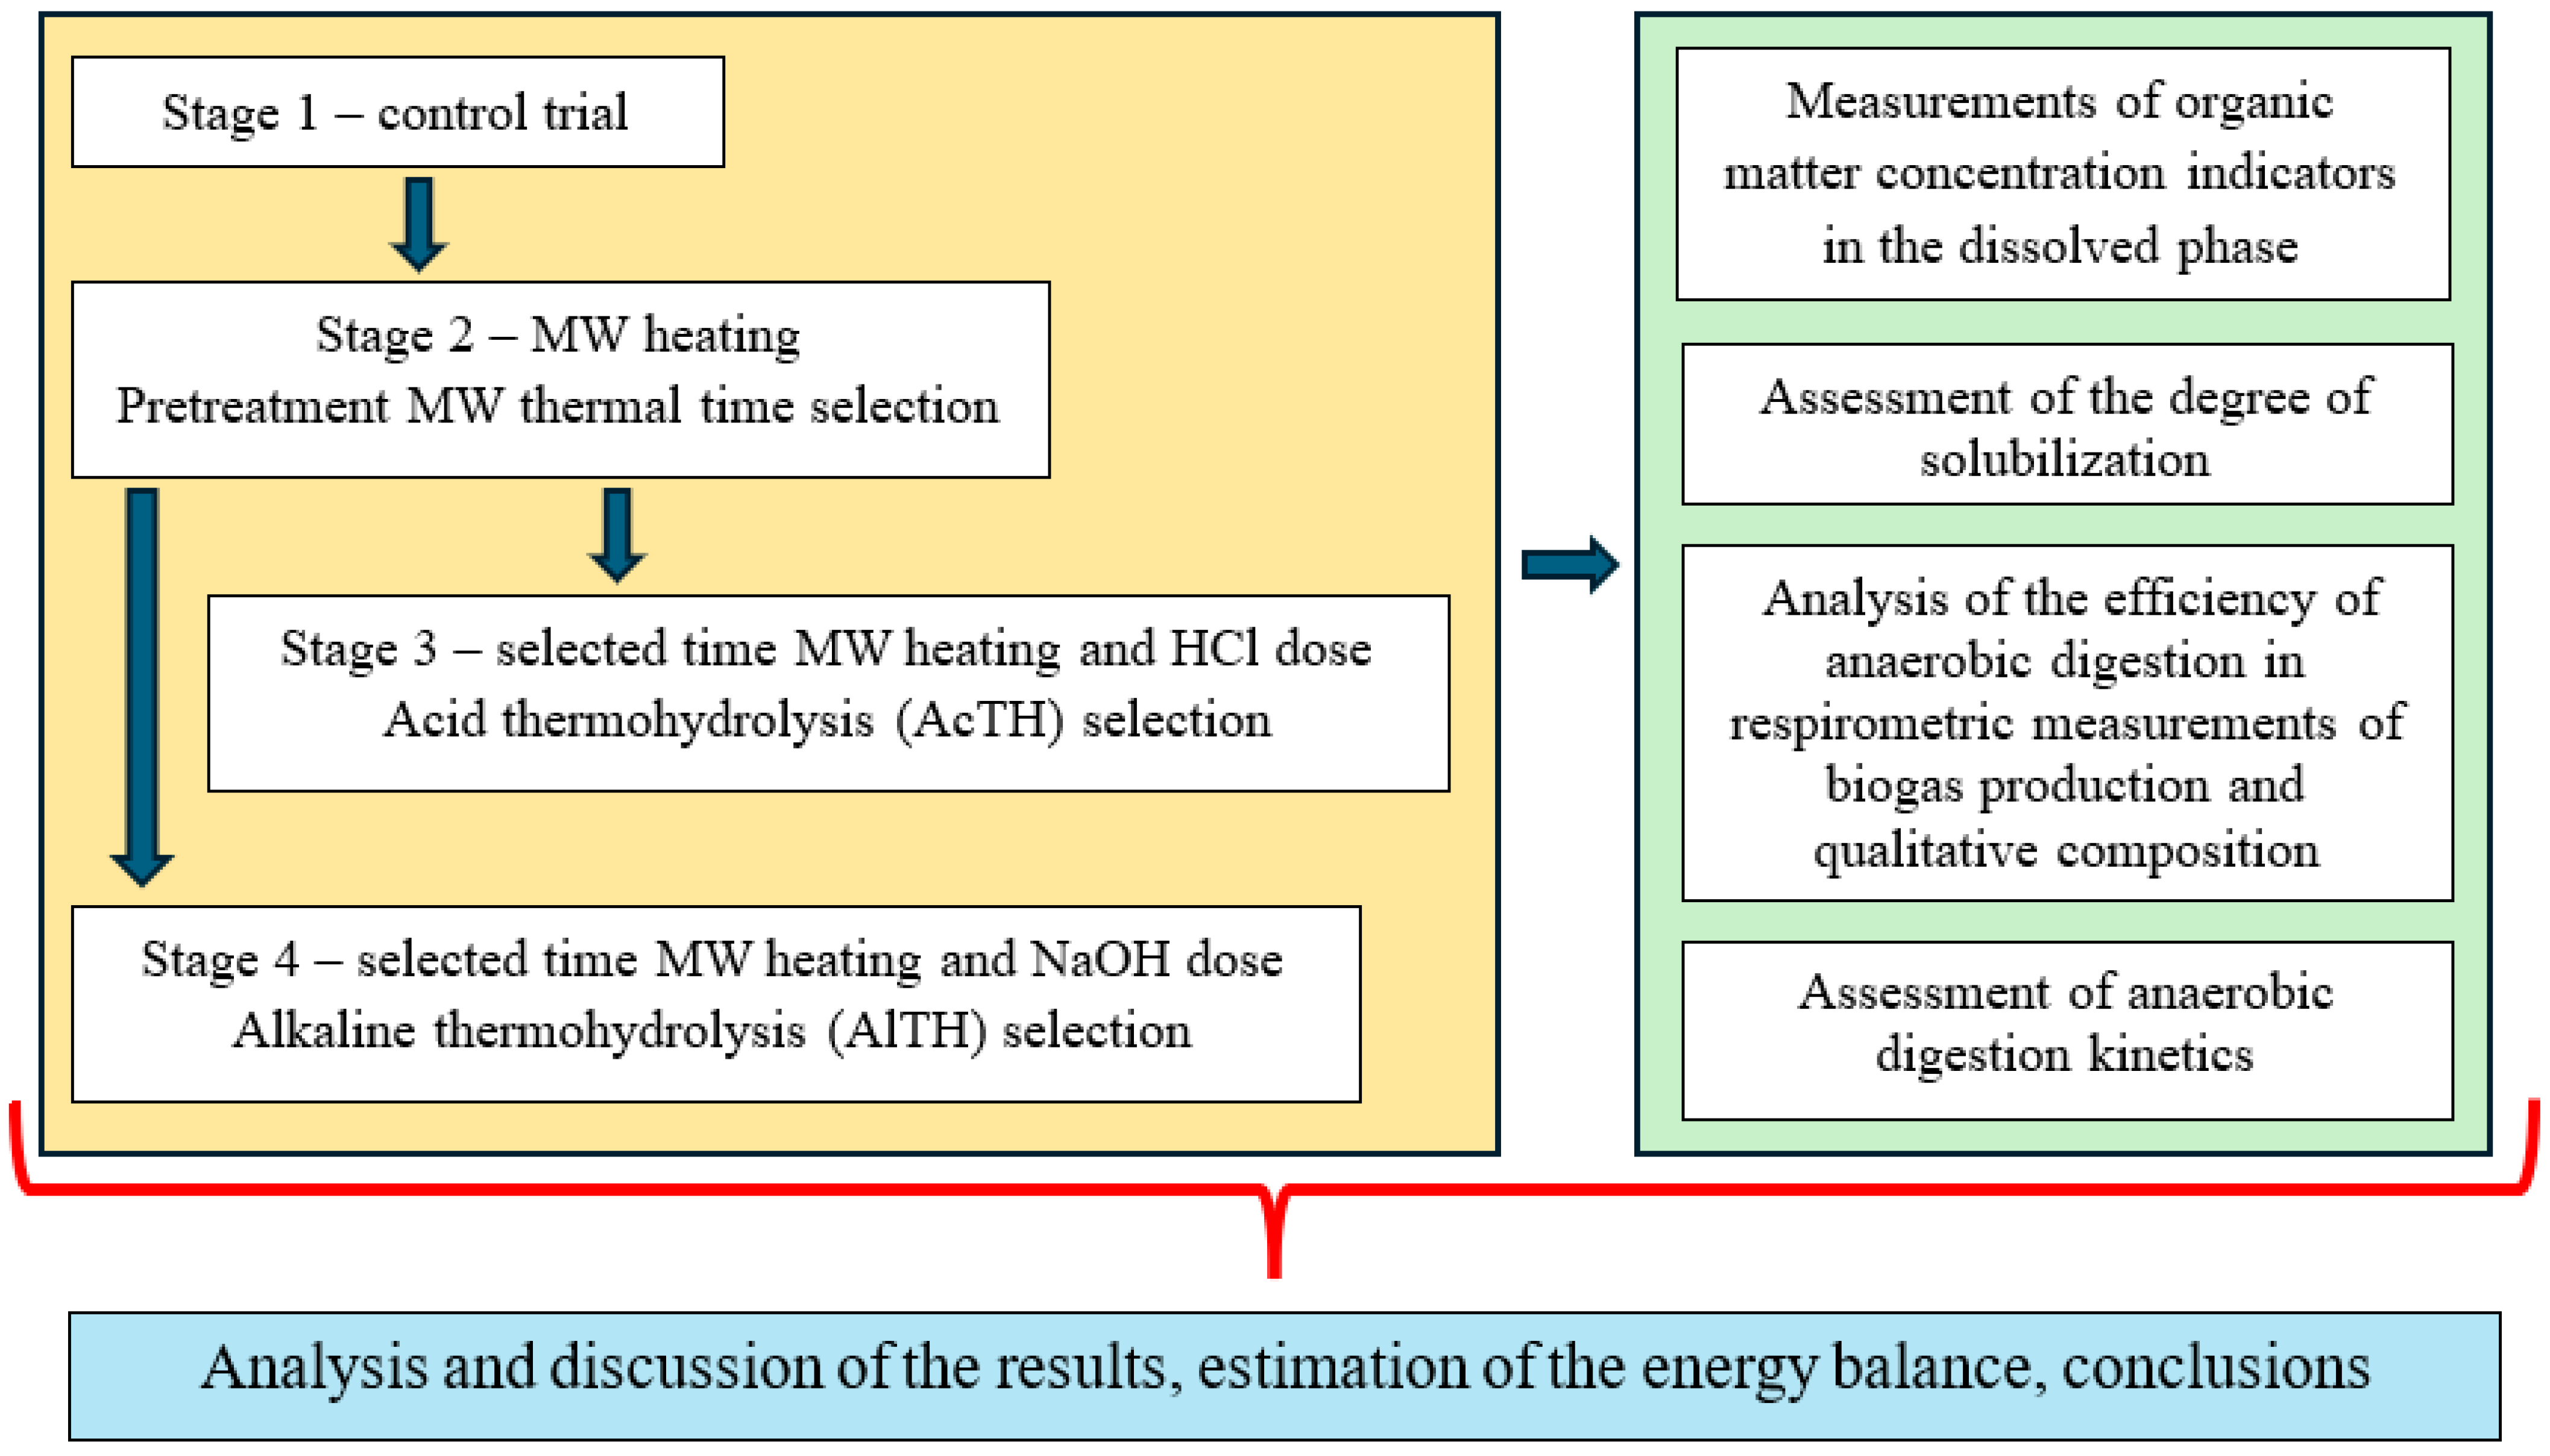
2.1. Organization of the Experiment

The experimental work was carried out with a pilot plant consisting of EMR for the thermohydrolysis process and respirometric bioreactors to evaluate the efficiency of anaerobic digestion. First, the tested lignocellulosic organic substrate, a mixture of cattle manure and straw, was subjected to pretreatment and then introduced into the respirometric bioreactors.
This study was divided into four stages (S), with the technological conditions of the pretreatment process’ serving as the criteria. The stages were carried out in three technological variants, depending on the time of MW heating (S2), the dose of hydrochloric acid HCl (S3), and the dose of sodium hydroxide NaOH (S4). In S1, the control variant (C) of the experiment, the raw substrate was not subjected to any pretreatment. In S2, only the effect of EMR on the hydrothermal depolymerisation process of the substrate was analysed. S2 was divided into three variants (V): V1—MW heating time 10 min; V2—MW heating time 20 min; and V3—MW heating time 30 min. The MW heating time is defined as the period in which the pretreated substrate reaches the assumed thermohydrolysis temperature of 150 °C, which made it possible to achieve a pressure of 400 kPa in the microwave reactor. The aim of S2 was to select the shortest possible MW heating time in order to ensure the highest indirect (degree of solubilisation of organic matter) and direct (anaerobic digestion efficiency) technological effects of the pretreatment on the tested lignocellulosic substrate. The selected MW heating time was then used in the subsequent S experiments.
In S3, a combined chemical thermohydrolysis process using EMR and hydrochloric acid (HCl) solution was used. Similar to S2, S3 was also divided into three variants (V), which were distinguished depending on the HCl dose used as follows: V1—MW heating time 20 min and 0.05 gHCl/gTS (total solids); V2—MW heating time 20 min and 0.10 gHCl/gTS; and V3—MW heating time 20 min and 0.20 gHCl/gTS. In S4, a combined chemical thermohydrolysis process using EMR and a sodium hydroxide (NaOH) solution was used. In S4, three Vs were also developed, depending on the amount of NaOH used as follows: V1—MW heating time 20 min and 0.05 gNaOH/gTS; V2—MW heating time 20 min and 0.10 gNaOH/gTS; and V3—MW heating time 20 min and 0.20 gNaOH/gTS.
After pretreatment, the chemical properties, particularly changes in the concentration of organic matter in the dissolved phase of the tested organic substrate, were analysed. The logical sequence of the experiments is shown in Figure 1. Periodic respirometric measurements were then used to evaluate the production efficiency and the qualitative composition of the biogas obtained, while the properties of the individual phases and experimental variants are listed in Table 1.

2.2. Materials

2.2.1. Lignocellulosic Biomass

The lignocellulosic organic substrate used in the experiments was a mixture of cattle manure, straw, and wastewater from the milking station. The substrate, which underwent acid/alkaline thermal hydrolysis with EMR equipment, was obtained from the Education and Research Centre of the University of Warmia and Mazury in Olsztyn. The centre is a university-wide farm in the town of Bałdy, 20 km south of Olsztyn (53°36′03.31427″ N, 020°36′12.86527″ E). The farm comprises almost 500 hectares of arable land and breeds 400 dairy cows and 40 horses. The mixture of fresh raw substrates was obtained from a retention and storage tank that supplies the existing agricultural microbiogas plant. Straw with manure was pre-chopped into an average 5 ± 1 mm fraction using the RDS-30 straw and hay chopper (TechnoMaszBud Ltd., Słupno, Poland). The properties of the organic substrate used for the trials are presented in Table 2.

2.2.2. Anaerobic Sludge

The inoculum of the anaerobic sludge used for the respirometric analyses of methane fermentation came from the fermentation chamber of the agricultural biogas plant located at the Education and Research Centre (53°45′14.03851″ N, 020°27′43.33475″ E). Therefore, the anaerobic sludge was adapted to the substrate used and did not require long-term adaptation. The microbiogas plant used an organic load rate (OLR) of 2.0 to 2.4 kgVS/m3·day, a hydraulic retention time (HRT) of 40 to 50 days, an anaerobic digester temperature of 40–42 °C, which corresponded to the conditions of mesophilic fermentation, and a concentration of 80–120 gTS/L of the mixture of anaerobic sludge and substrate in the bioreactor. Table 2 shows the basic properties of the anaerobic sludge inoculum.

2.2.3. Chemical Reagents

In the process of acid thermohydrolysis of waste lignocellulosic biomass (S3), a 10% solution of pure hydrochloric acid (HCl) (Pol-Aura Ltd., Dywity, Poland) was used, while in alkaline thermohydrolysis, a 10% solution of pure sodium hydroxide (NaOH) (Pol-Aura Ltd., Poland) was added to the tested organic substrate.

2.3. Chemical Pretreatment

The amounts of chemical reagents (HCl in S3 and NaOH in S4) added to the lignocellulosic biomass ranged from 0.05 to 0.20 g/gTS of substrate, depending on the stage/experiment variant. Detailed information on the dosages of chemical reagents used in selected variants is presented in Table 1. After the appropriate amount of chemical reagent was added to the substrate, it was mixed using a pneumatic mixer with a lid (P-37-750-INOX ATEX, Pneumatico Ltd., Kalisz, Poland) at a rotation speed of 100 rpm and then introduced into the prototype MW reactor to perform thermochemical hydrolysis. Due to the low dosage of chemical reagents used, the reaction of the substrate was almost neutral, and no neutralisation was required to correct the pH prior to the anaerobic digestion process.

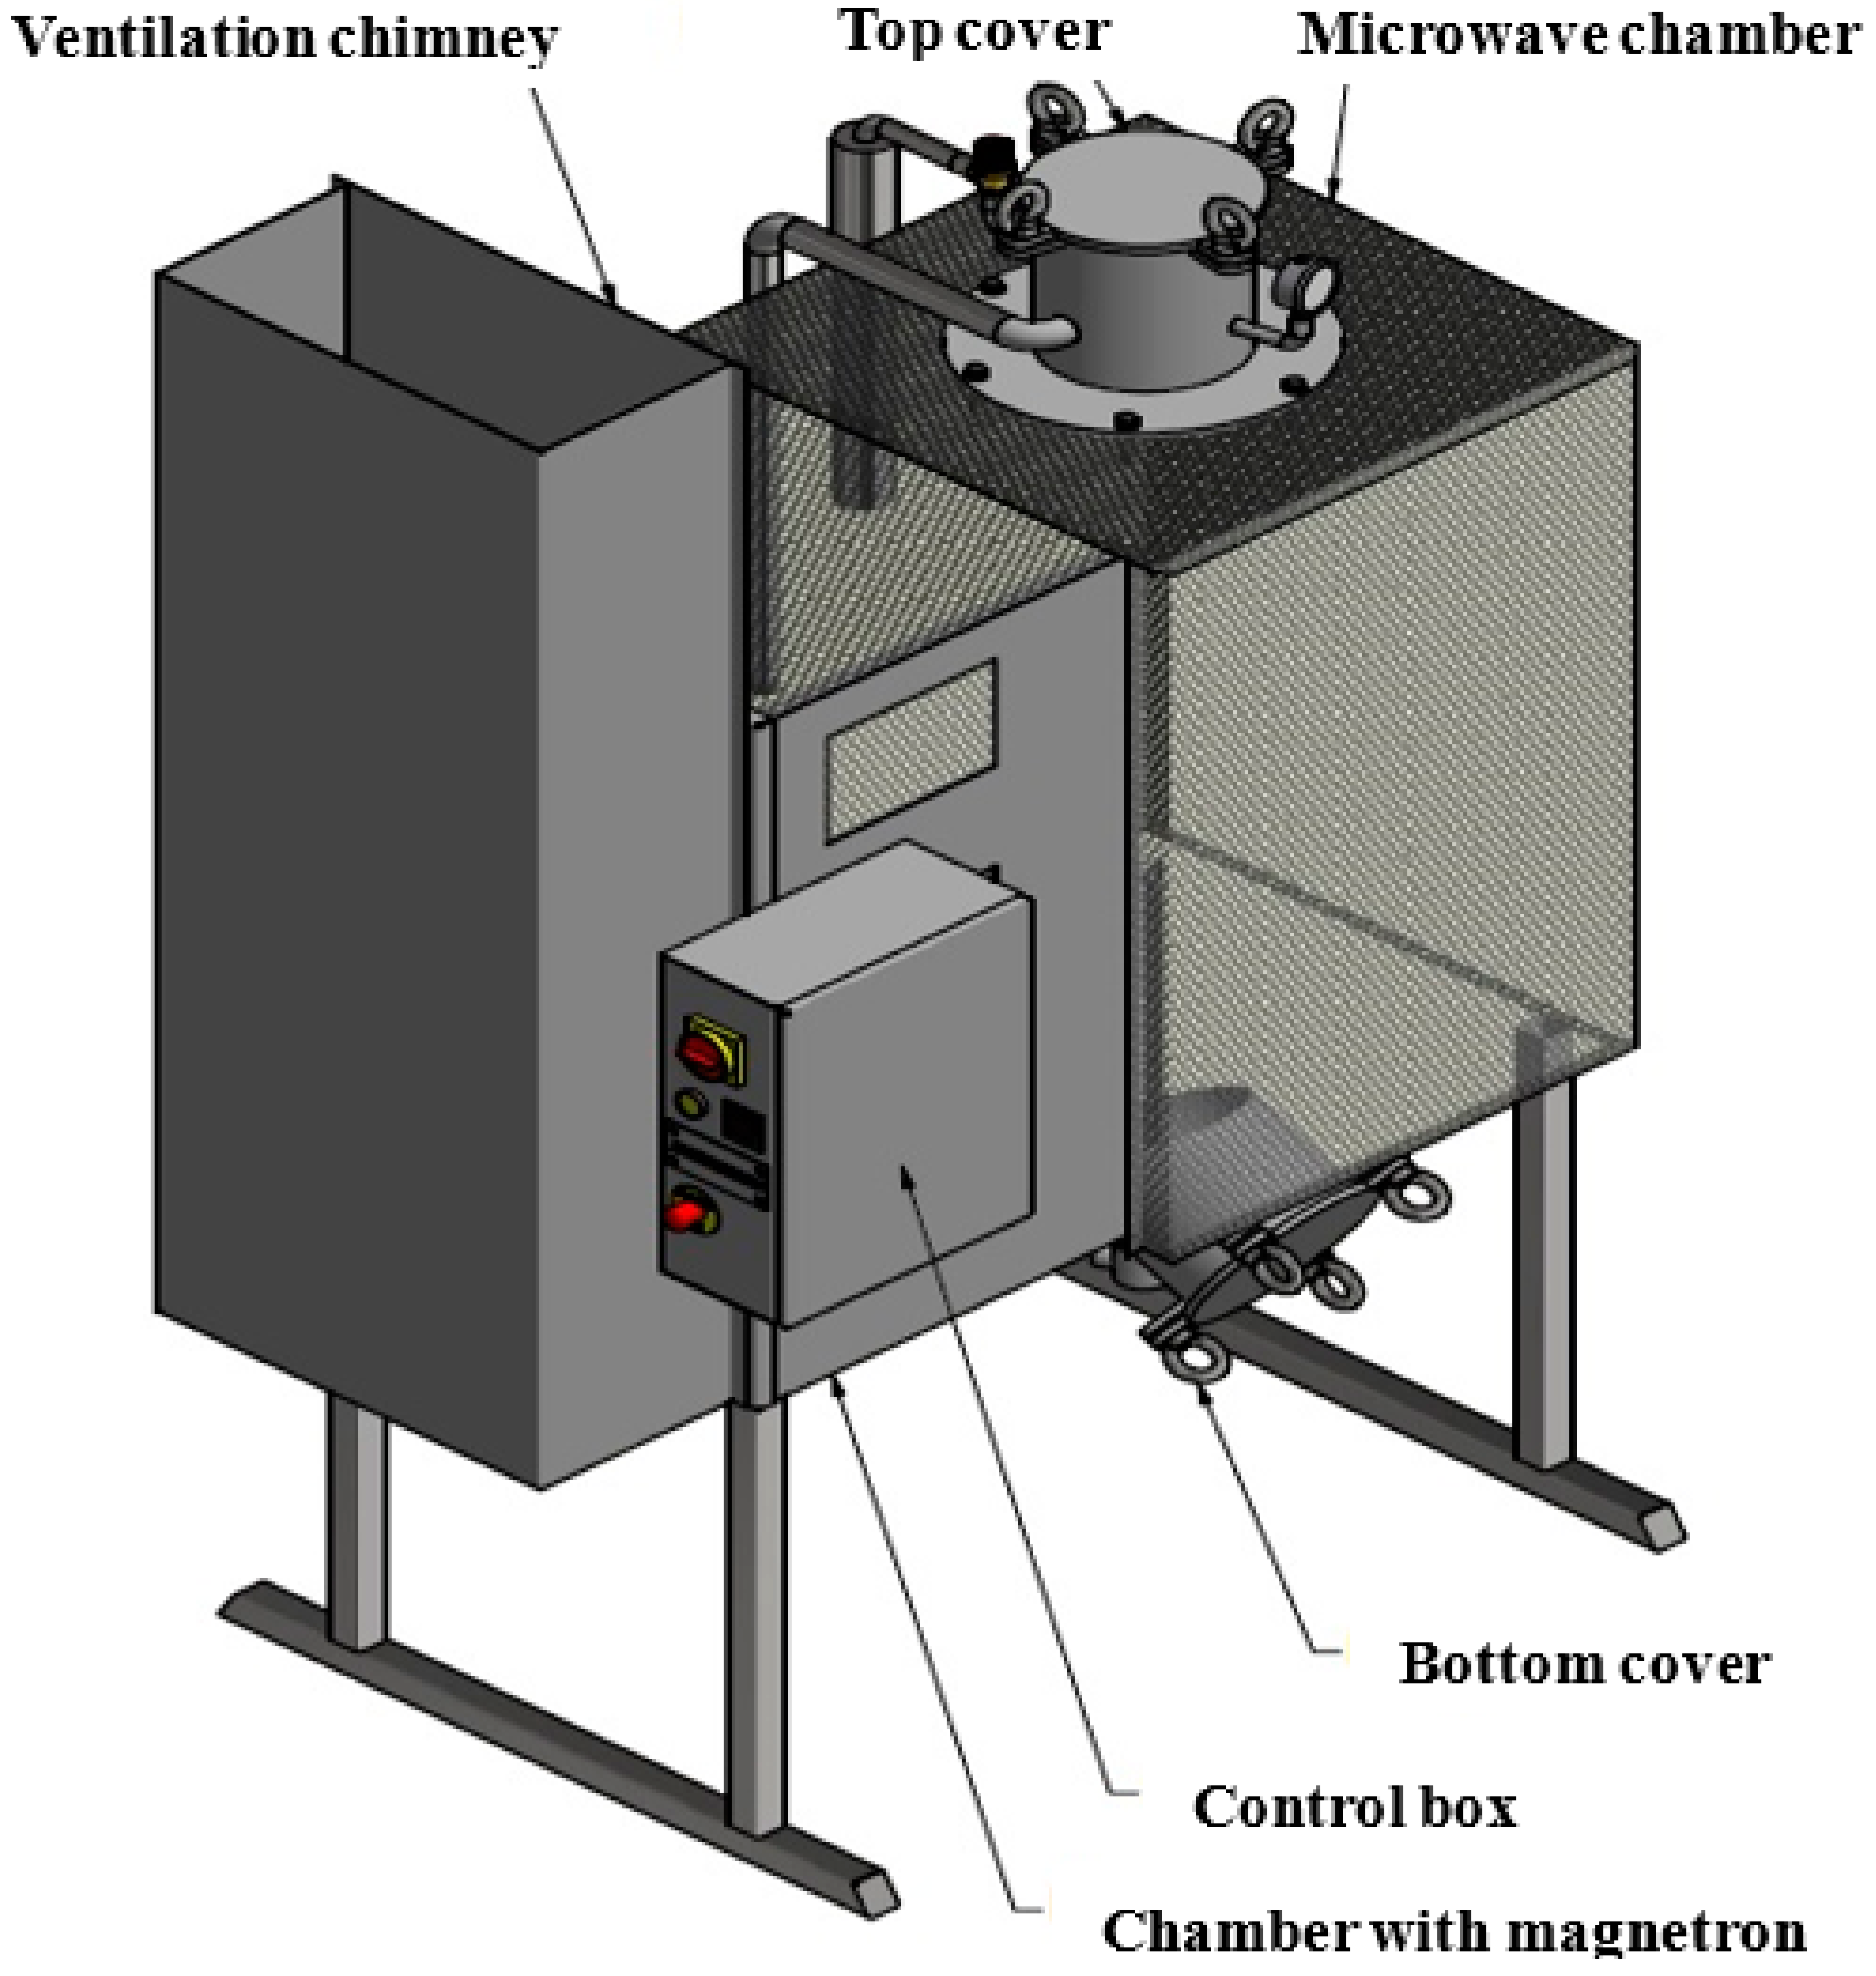
2.4. MW Hydrothermal Pretreatment Reactor

The reactor was resistant to acidic and alkaline media and was equipped with control and measuring devices (temperature sensor, manometer), which enabled the monitoring of process parameters. An energy consumption meter (Eaton EMI3P-Y2C0, Dublin, Ireland) was also installed. The dimensions of the reactor were as follows: the entire reactor: L—1400 mm, W—800 mm, H—2150 mm; MW heating chamber: D—310 mm, H—1000 mm; working dimensions of the MW heating chamber: D—240 mm, Hmax—1000 mm, Vmax—45 L max. Other parameters included the following: Supply voltage—3 × 240 V, 50 Hz; maximum power—12 kW; thermostat—20–150 °C; safety valve—400 kPa.
The device was made of 304 stainless steel in a welded frame. The appliance consists of a cylindrical polytetrafluoroethylene (PTFE) tank with a capacity of approx. 50 L, a stainless steel bottom and top cover, a resonant microwave chamber, six × WR430 waveguides with an antenna that radiates power into the microwave chamber, six × magnetrons with a microwave power of 800 W, a cover with an analogue pressure gauge and a safety valve, a temperature sensor in the top cover, a ventilation chimney equipped with fans that cool the magnetrons and the power supply system, an additional heater that supports the heating of the substrate, a power meter visible on the control box, and a control box with control panel. The MW diagram of the reactor for the hydrothermal depolymerisation of organic substrates is shown in Figure 2.

2.5. Respirometric Anaerobic Digestion

The effects of the pretreatment processes used on the production efficiency and the qualitative composition of the biogas in the anaerobic digestion were evaluated using batch bioreactors (OxiTop Control, WTW, Troistedt, Germany). The anaerobic respirometers were located in a thermostatic cabinet kept at 40 ± 0.5 °C. The bioreactors had a total volume of 500 mL, and at the start of the experiments, 200 mL was filled with the anaerobic sludge inoculum to which assumed amounts of pretreated organic substrate were added (assumed initial OLR = 5.0 gVS/L). The remaining volume was the gas phase of the bioreactors. Before the anaerobic sludge inoculum was introduced into the respirometers, it was incubated at 40 °C for 10 days without any organic substrate. This procedure aimed to achieve biodegradation of the organic matter contained in the raw inoculum and thus limit the influence of substrates from external sources on the final effects of anaerobic digestion. After the respirometers were filled with the anaerobic sludge inoculum and the tested organic substrate, the contents were flushed with pure nitrogen (2 min, 100 L/h) to ensure anaerobic conditions. The hydraulic retention time (HRT) of the substrate in anaerobic reactors was 20 days. The HRT used was sufficient to evaluate the potential for biogas production. In respirometric measurements, anaerobic digestion is complete when the difference between three consecutive measurements of daily biogas production does not exceed 1%. The respirometers include a measuring chamber with a liquid and a gas phase, a gas-tight biogas entry tube for qualitative chromatographic measurements, a device for monitoring and recording changes in partial pressure in the anaerobic chamber, and a system for mixing the chamber contents. The biogas production test results in the subsequent experimental variants used for further analysis were corrected by the values obtained in the control experiment, in which anaerobic sludge was incubated under analogue conditions but not fed with the tested organic substrate.

2.6. Calculation Methods

Based on the value of the universal gas constant and the partial pressure determined in the digester, as well as the known volume of the respirometer gas phase and the temperature, the number of moles of biogas produced was calculated using the ideal gas law (1):
n = (p·V)/(R·T)
where n is the number of moles of biogas [mol], p is the partial pressure of biogas in respirometer [Pa], V is the volume of gas phase in respirometer [m3], R is the universal gas constant [8.314 J/mol·K], and T is the anaerobic digestion temperature [K].
Avogadro’s law was used to calculate the volume of biogas produced, which assumes that under normal conditions (T—273 K and p—1013 hPa), one mole of biogas takes up 22.4 L (2):
V = n·Vmol
where V is the biogas volume [L], n is the number of moles of the biogas [mol], Vmol is the biogas molar volume [L].
The biogas production rate (r) was also determined for each of the experimental variants. The reaction rate constants (k) were determined based on experimental data obtained by non-linear regression using the STATISTICA 13.3 PL package (StatSoft, Inc., Tulsa, OK, USA).
The specific energy input (Es) of the MW thermal hydrolysis of the organic substrate in kWh was read from an energy input meter (Eaton EMI3P-Y2C0, Dublin, Ireland).
The gross energy output (EGout) in kWh generated from the CH4 was calculated as (3):
EGout = YCH4·MTS·CVCH4
where YCH4 is the CH4 production [m3/kgFM], CVCH4 is the CH4 calorific value [kWh/L], and MTS is the total fresh mass of substrate [kgFM].
The net energy output (ENout) in kWh was calculated as (4):
ENout = EGout − ES
The net energy gain (Enet) in kWh was calculated by subtracting the energy output in the n–variant and the energy output in S1 (control without pretreatment) as follows (5):
Enet= ENout Vn − ENout V0
where ENout Vn is the net energy output in the n–variant with microwave thermohydrolysis [kWh] and ENout V0 is the net energy output in variant without microwave thermohydrolysis [kWh].
Equations (6) and (7) present, respectively, the COD and TOC solubilization degree [%] calculation [46,47]:
COD solubilization degree = [(sCODS1 − sCODS0)/(CODT0 − sCODS0)] × 100,
TOC solubilization degree = [(sTOCS1 − sTOCS0)/(TOCT0 − sTOCS0)] × 100.
In these equations, sCODS0/sTOCS0 is the soluble COD/TOC before the microwave thermohydrolysis [g/L], sCODS1/sTOCS1 is the soluble COD/TOC after the microwave thermohydrolysis, and CODT0/TOCT0 is the total COD/TOC [g/L] in raw organic substrate.

2.7. Analytical Methods

The total content of solids and volatile solids in the organic substrates and the anaerobic sludge were analysed using the gravity method, COD in the organic substrate and dissolved phase (using a DR 5000 spectrophotometer with a HT 200 s mineraliser, Hach-Lange GmbH, Düsseldorf, Germany). TOC and TN in the dissolved phase were analysed using the TOC-L analyser (Shimadzu, Kyoto, Japan), and TC in the dissolved phase was analysed with a Thermo Flash 2000 elemental analyser (Thermo Scientific, Waltham, MA, USA). The concentrations of dissolved organic compounds (COD, TOC) were obtained from the supernatant after centrifugation of the samples (speed 4000 rpm, time 3 min) in a ROTINA 380 centrifuge (Hettich-Zentrifugen, Tuttlingen, Germany).
Total sugars were analysed using the DR 2800 spectrophotometer (Hach-Lange GmbH, Düsseldorf, Germany) and the qualitative composition of the biogas was analysed using a GC model 7890 A (Agilent Technologies, Santa Clara, CA, USA).

2.8. Statistical Analysis

Each variant of the experiment was carried out three times. The statistical analysis was carried out using the STATISTICA 13.3 PL package (StatSoft, Inc., Tulsa, OK, USA). A one-way ANOVA was used to determine the significance of the differences between the variables. After checking for the homogeneity of variances using the Levene test, the significance of the differences between the analysed variables was tested using the Tukey HSD test. The results were considered significant at p < 0.05.

3. Results and Discussion

3.1. Concentration of Dissolved Organic Matter

During this study, the changes in the properties of the organic substrate tested were analysed, allowing for an indirect evaluation of the pretreatment processes’ effectiveness (Table 3). Changes in the concentrations of organic compounds in the liquid/dissolved phase are commonly used indicators to verify the effectiveness of the technological solutions used [48]. The intensity of the release and the increase in the content of dissolved organic compounds directly indicate the efficiency of the biomass-based thermohydrolysis process [49,50]. The increase in the concentration of low-molecular-weight organics in the liquid phase determines the rate of anaerobic biochemical transformations, as these are the compounds that are most easily metabolised by the microorganisms in the first phase of fermentation [51]. As a result, this usually leads to an increase in the efficiency of methanogenesis, promotes greater mineralisation and stabilisation of the substrate, and ultimately determines the technological and economic efficiency of the process [52].
Results showed that the EMR (S2) as well as the combination of EMR—AcTH (S3) and EMR—AlTH (S4) significantly increased the concentration of dissolved organic compounds; the increase was characterised by an increase in COD, TOC, and sugars (p < 0.05). In S1 (C), the COD concentration in the dissolved phase was 47.3 ± 1.2 g/L on average. In the subsequent variants, these values were almost twice as high and ranged from 99 ± 2.5 g/L (T20-0.05 NaOH) to 115 ± 3.0 g/L (T20-0.10 NaOH). Regardless of whether the tested substrate underwent only the TH process with EMR or an additional chemical treatment, no statistically significant differences were found in the concentrations of this indicator (p > 0.05). The degree of COD solubilisation was within narrow limits, from 21.05 ± 1.75% (T20-0.05 NaOH) to 27.53 ± 1.72% (T20-0.10 NaOH) (p > 0.05). Similar changes were observed in the TOC solubilisation degree. In S1 (C), where the substrate was not subjected to any pretreatment, the concentration of dissolved TOC averaged 14.1 ± 0.81 g/L. In S2, where only the use of EMR was tested, the concentration of organic compounds in the dissolved phase, determined by TOC, ranged from 33.9 ± 0.92 g/L (T10) to 40.7 ± 1.25 g/L (T30). The degree of TOC solubilisation for these variants was 20.06 ± 1.31% and 26.91 ± 1.53%, respectively. The combined processes of EMR—AcTH (S3) and EMR—AlTH (S4) had no significant effect on the increase of TOC concentrations in the substrate’s liquid phase (p > 0.05). In S3, the content of this indicator was very uniform regardless of the variant tested and ranged from 38.1 ± 1.44 g/L (T20-0.05 HCl) to 39.1 ± 1.66 mg/L (T20-0.20 HCl) (p > 0.05). The degree of TOC solubilisation ranged from 24.25 ± 1.37% to 25.24 ± 1.66% (p > 0.05). In contrast, in S4, it ranged from 36.4 ± 1.21 mg/L (T20-0.10 NaOH) to 38.5 ± 1.09 mg/L (T20-0.20 NaOH), and solubilisation ranged from 22.54 ± 1.48% to 24.68 ± 1.38% (p > 0.05).
Other researchers have also evaluated the effectiveness of the pretreatment process and observed changes in the concentrations of organic compounds in the liquid phase. Kainthola et al. [53] evaluated the effect of thermal hydrolysis on the degradation capacity of rice straw. EMR was used at difference temperatures ranging from 130 to 230 °C and an exposure time of 2–5 min. Maximum solubilisation was observed at 190 °C for 4 min. In this variant, the COD concentration in the dissolved phase increased to about 14.5 g/L, compared to the untreated substrate, where this value was 5.91 ± 0.70 g/L [53]. In the study by Elalami et al. [35], the effect of MW, ultrasonic, and alkaline treatments on the properties of lignocellulose olive pomace was investigated. They found that all pretreatments increased the COD concentration in the dissolved phase, especially the alkaline treatment with a dose of 8% at 50 °C, which reached six times the sCOD compared to the untreated substrate (69 ± 1 mg/gVS). Microwave-assisted pretreatment led to a rise in COD concentration in the dissolved phase with the applied energy in the range of 102 ± 1 mg/gVS (200 W for 2 min) to 259 ± 1 mg/gVS (450 W for 10 min). The combined microwave and alkaline methods reduced the solubilisation of olive pomace more than the sum of the individual pretreatments. The concentration was 445 ± 1 mg/gVS using 4% NaOH (25 °C, 4 h) and microwaved at 450 W for 10 min [35].
The indicator that most clearly confirmed that the tested substrate was effectively decomposed was the concentration of dissolved sugars (p < 0.05). The sugar concentration in the control sample S1 (C) was 0.69 ± 0.12 g/L. The exclusive use of EMR in S2 resulted in a several-fold increase of this indicator in the liquid phase. The observed values ranged from 20.0 ± 0.85 g/L (T10) to 30.0 ± 0.87 g/L (T30) (p < 0.05). The other analysed parameters showed stable concentrations independent of the test series (p > 0.05). The highest concentration of dissolved sugars, which was 30.2 ± 0.98 g/L, was found in S3 (T20-0.20 HCl). In the other variants, the measured values ranged from 18.9 ± 0.65 g/L (S3, T20-0.05 HCl) to 28.1 ± 0.66 g/L (S4, T20-0.20 NaOH).
The concentration of soluble sugars after MW pretreatment was largely dependent on the energy consumed, which is also consistent with Binod et al. [54]. After MW pretreatment at 200 W for 2 min, the concentration of released sugars was similar to the concentration of released sugars in the non-pretreated substrate and was 10.1 ± 0.5 mg/gV. However, when the MW pretreatment time at 450 W was increased to 10 min, the concentration of released sugar increased to 24.8 ± 1.2 mg/gVS [54]. Other studies [55] have also attempted to evaluate the effects of EMR and hydrochloric acid (HCl), sulphuric acid (VI) (H2SO4), and phosphoric acid (V) (H3PO4) on the lignocellulosic biomass of maize silage. The influence of the decomposition of maize silage by MW and conventional heating was compared. A 10% concentration of each acid and doses of 0.02, 0.05, 0.10, 0.20, and 0.40 g/gTS were used. Results showed that the concentration of soluble sugars increased with the dose of acids, and heating with MW resulted in greater release than conventional heating, which was consistent with the studies presented in this manuscript. When MW and HCl acid were used, a maximum of 2049.5 mg/L was obtained, compared to 897.3 mg/L was obtained with conventional heating. In the control test without the use of acid, the values were 98.2 mg/L and 78.7 mg/L, respectively. Similar observations were made in the case of the H2SO4 and H3PO4 cavities. The maximum values for dissolved sugars were determined with MW and an acid dose of 0.40 g/gTS and were 2186.7 mg/L for H2SO4 and 1306.7 mg/L [55]. Example results of laboratory-scale tests to illustrate the effect of MW heating on biomass properties obtained in previous studies in this studyand other researchers are shown in Table S1.

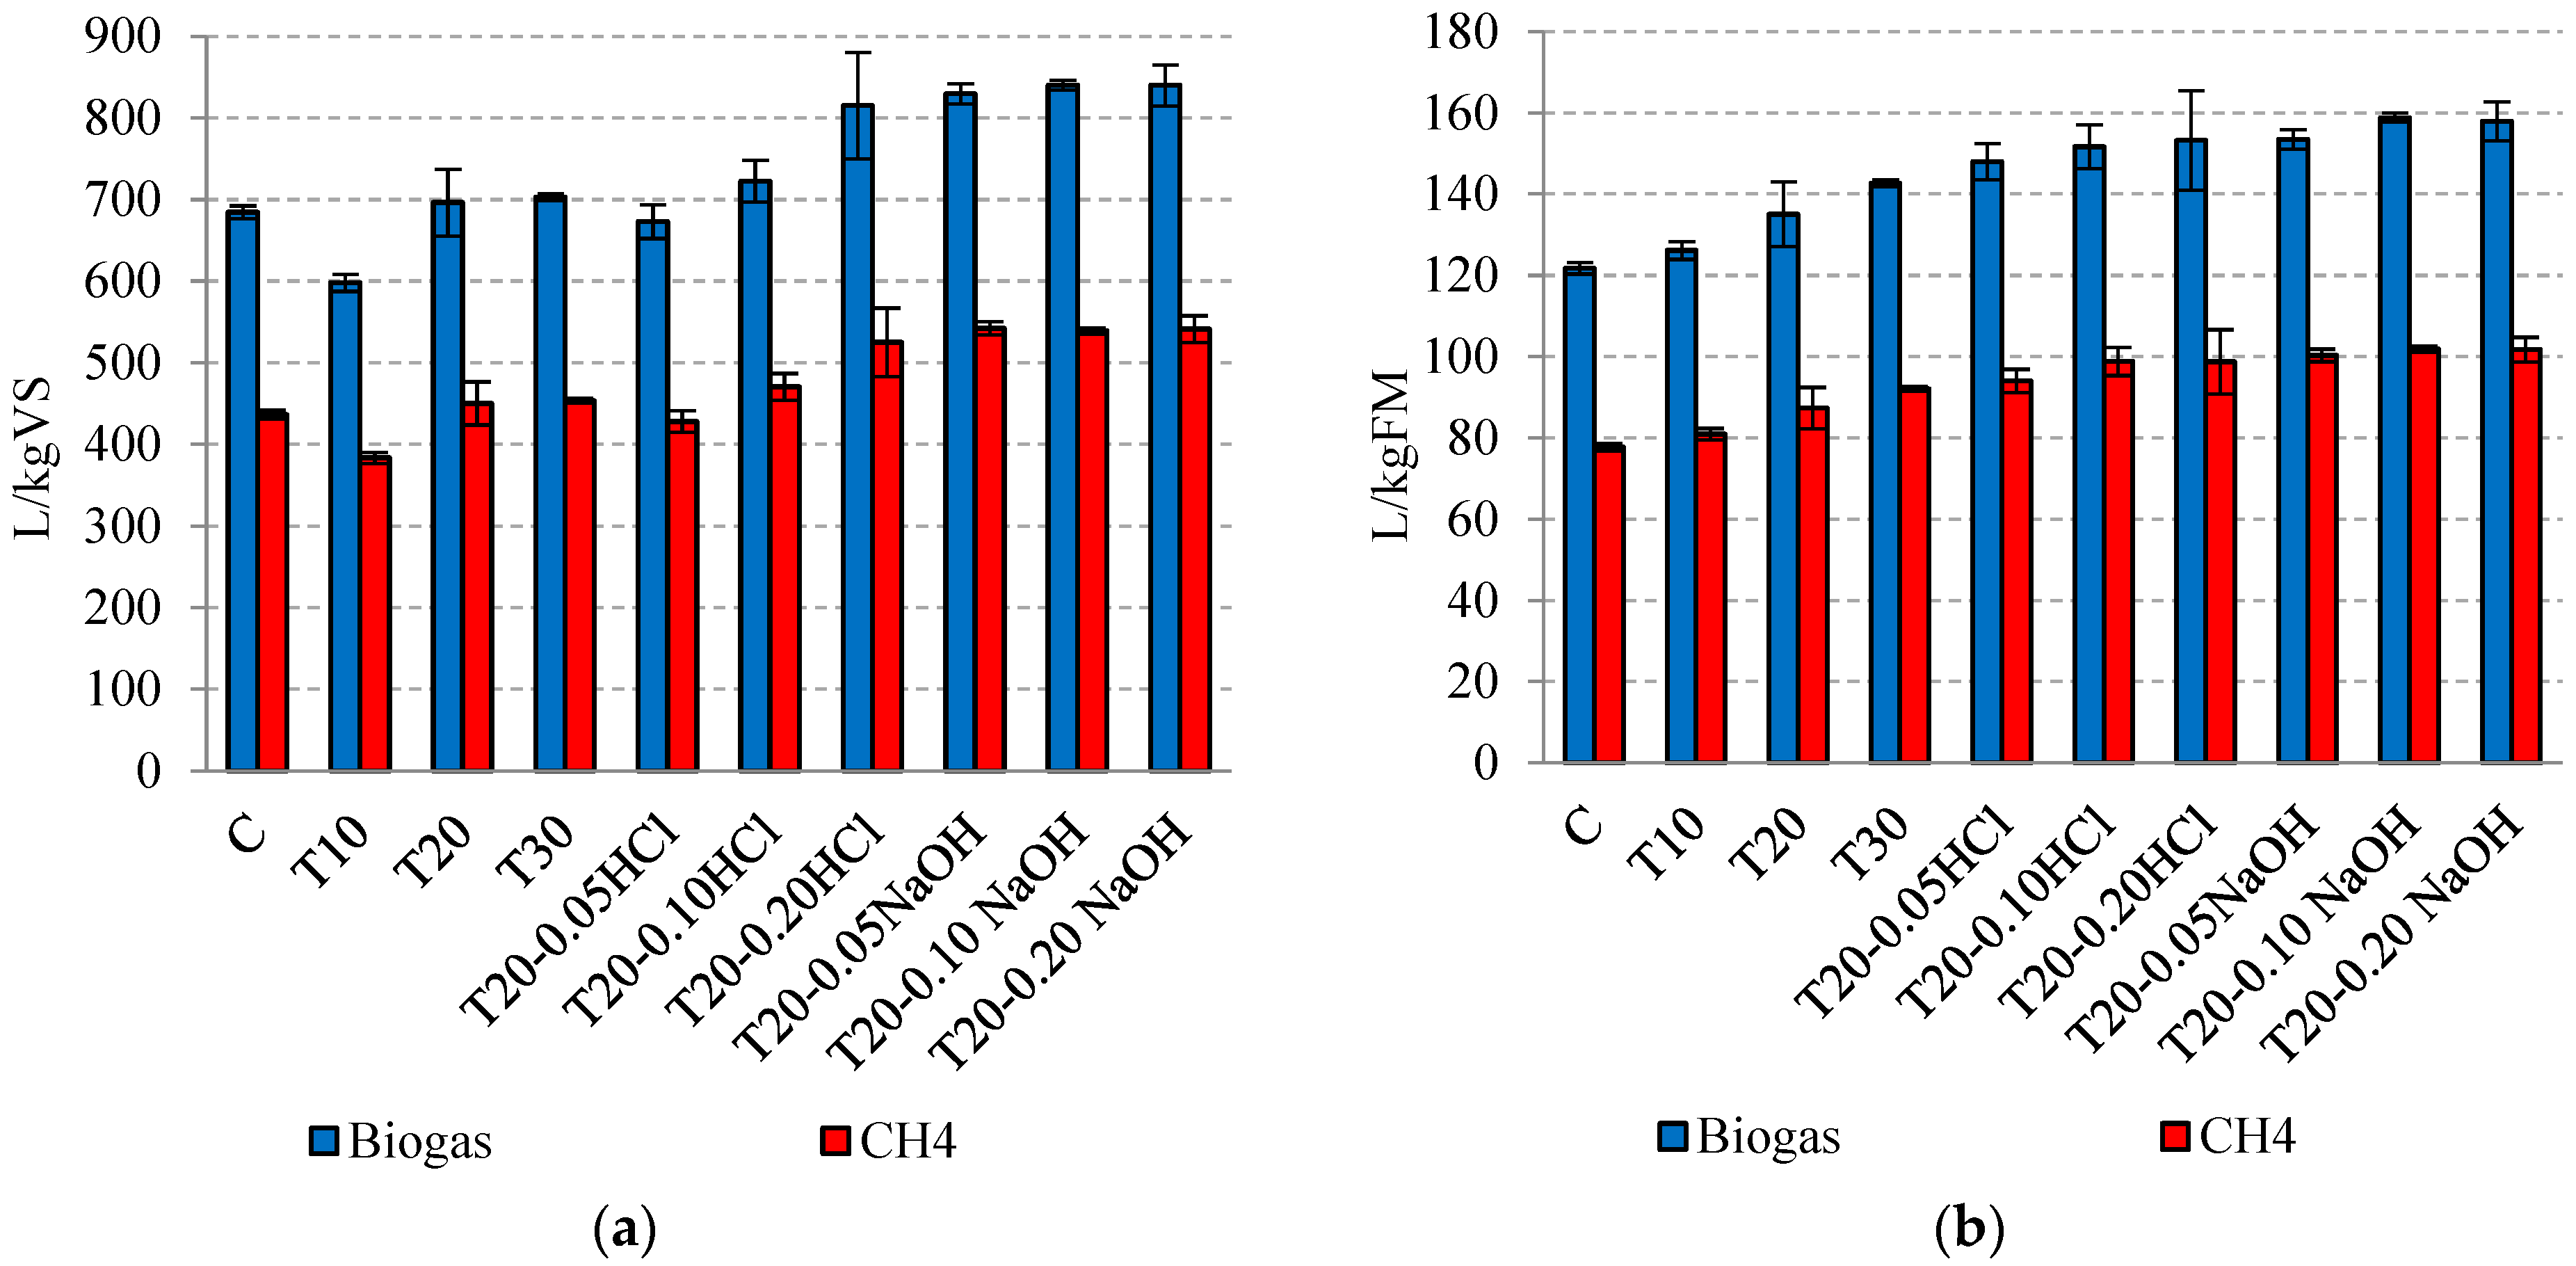
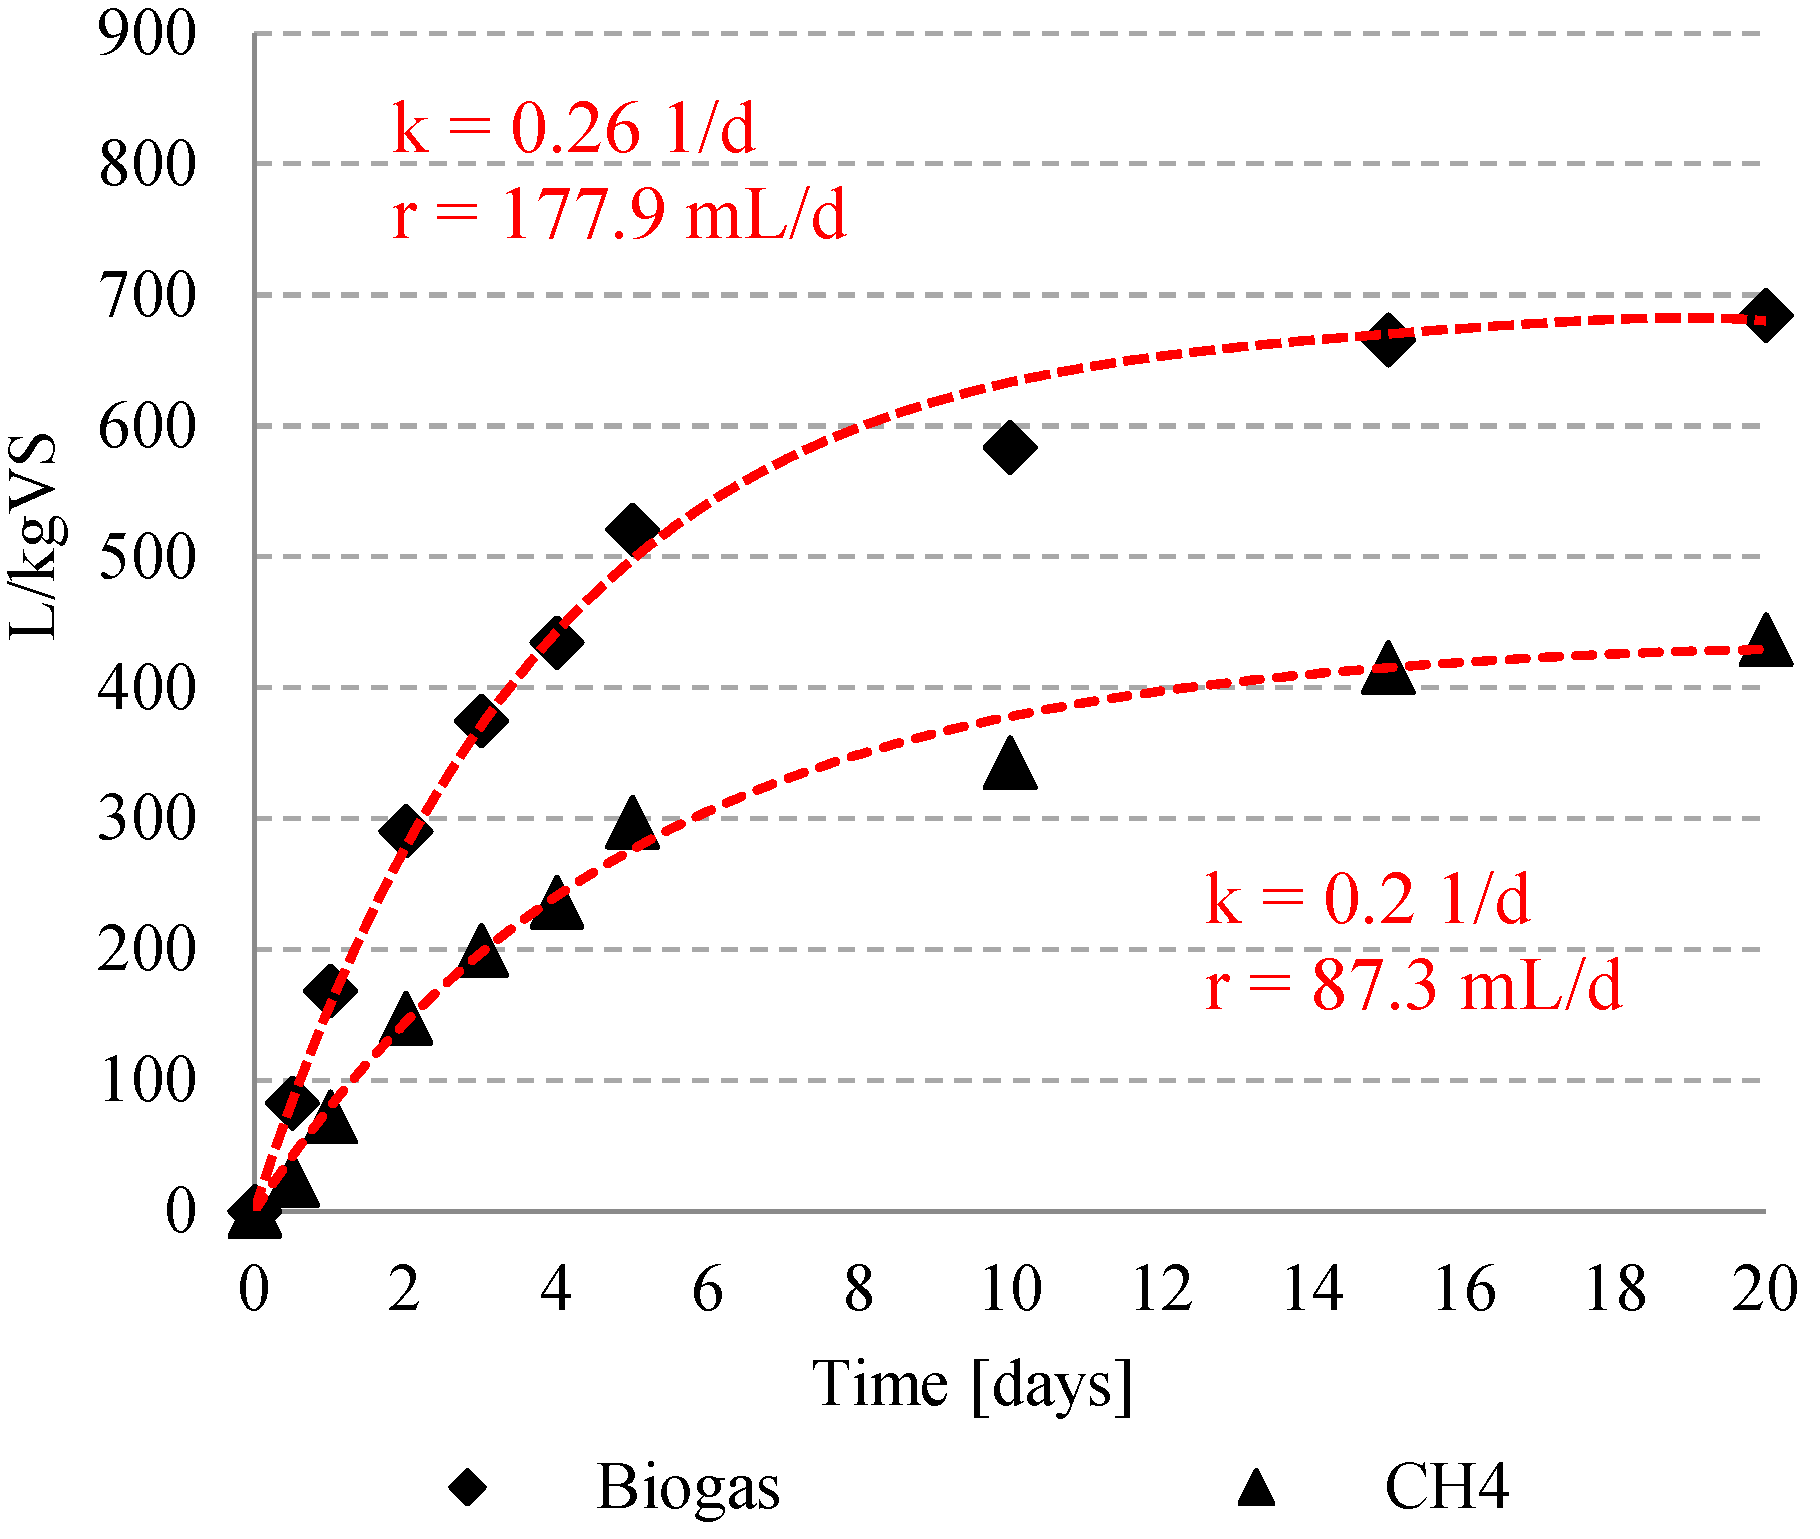
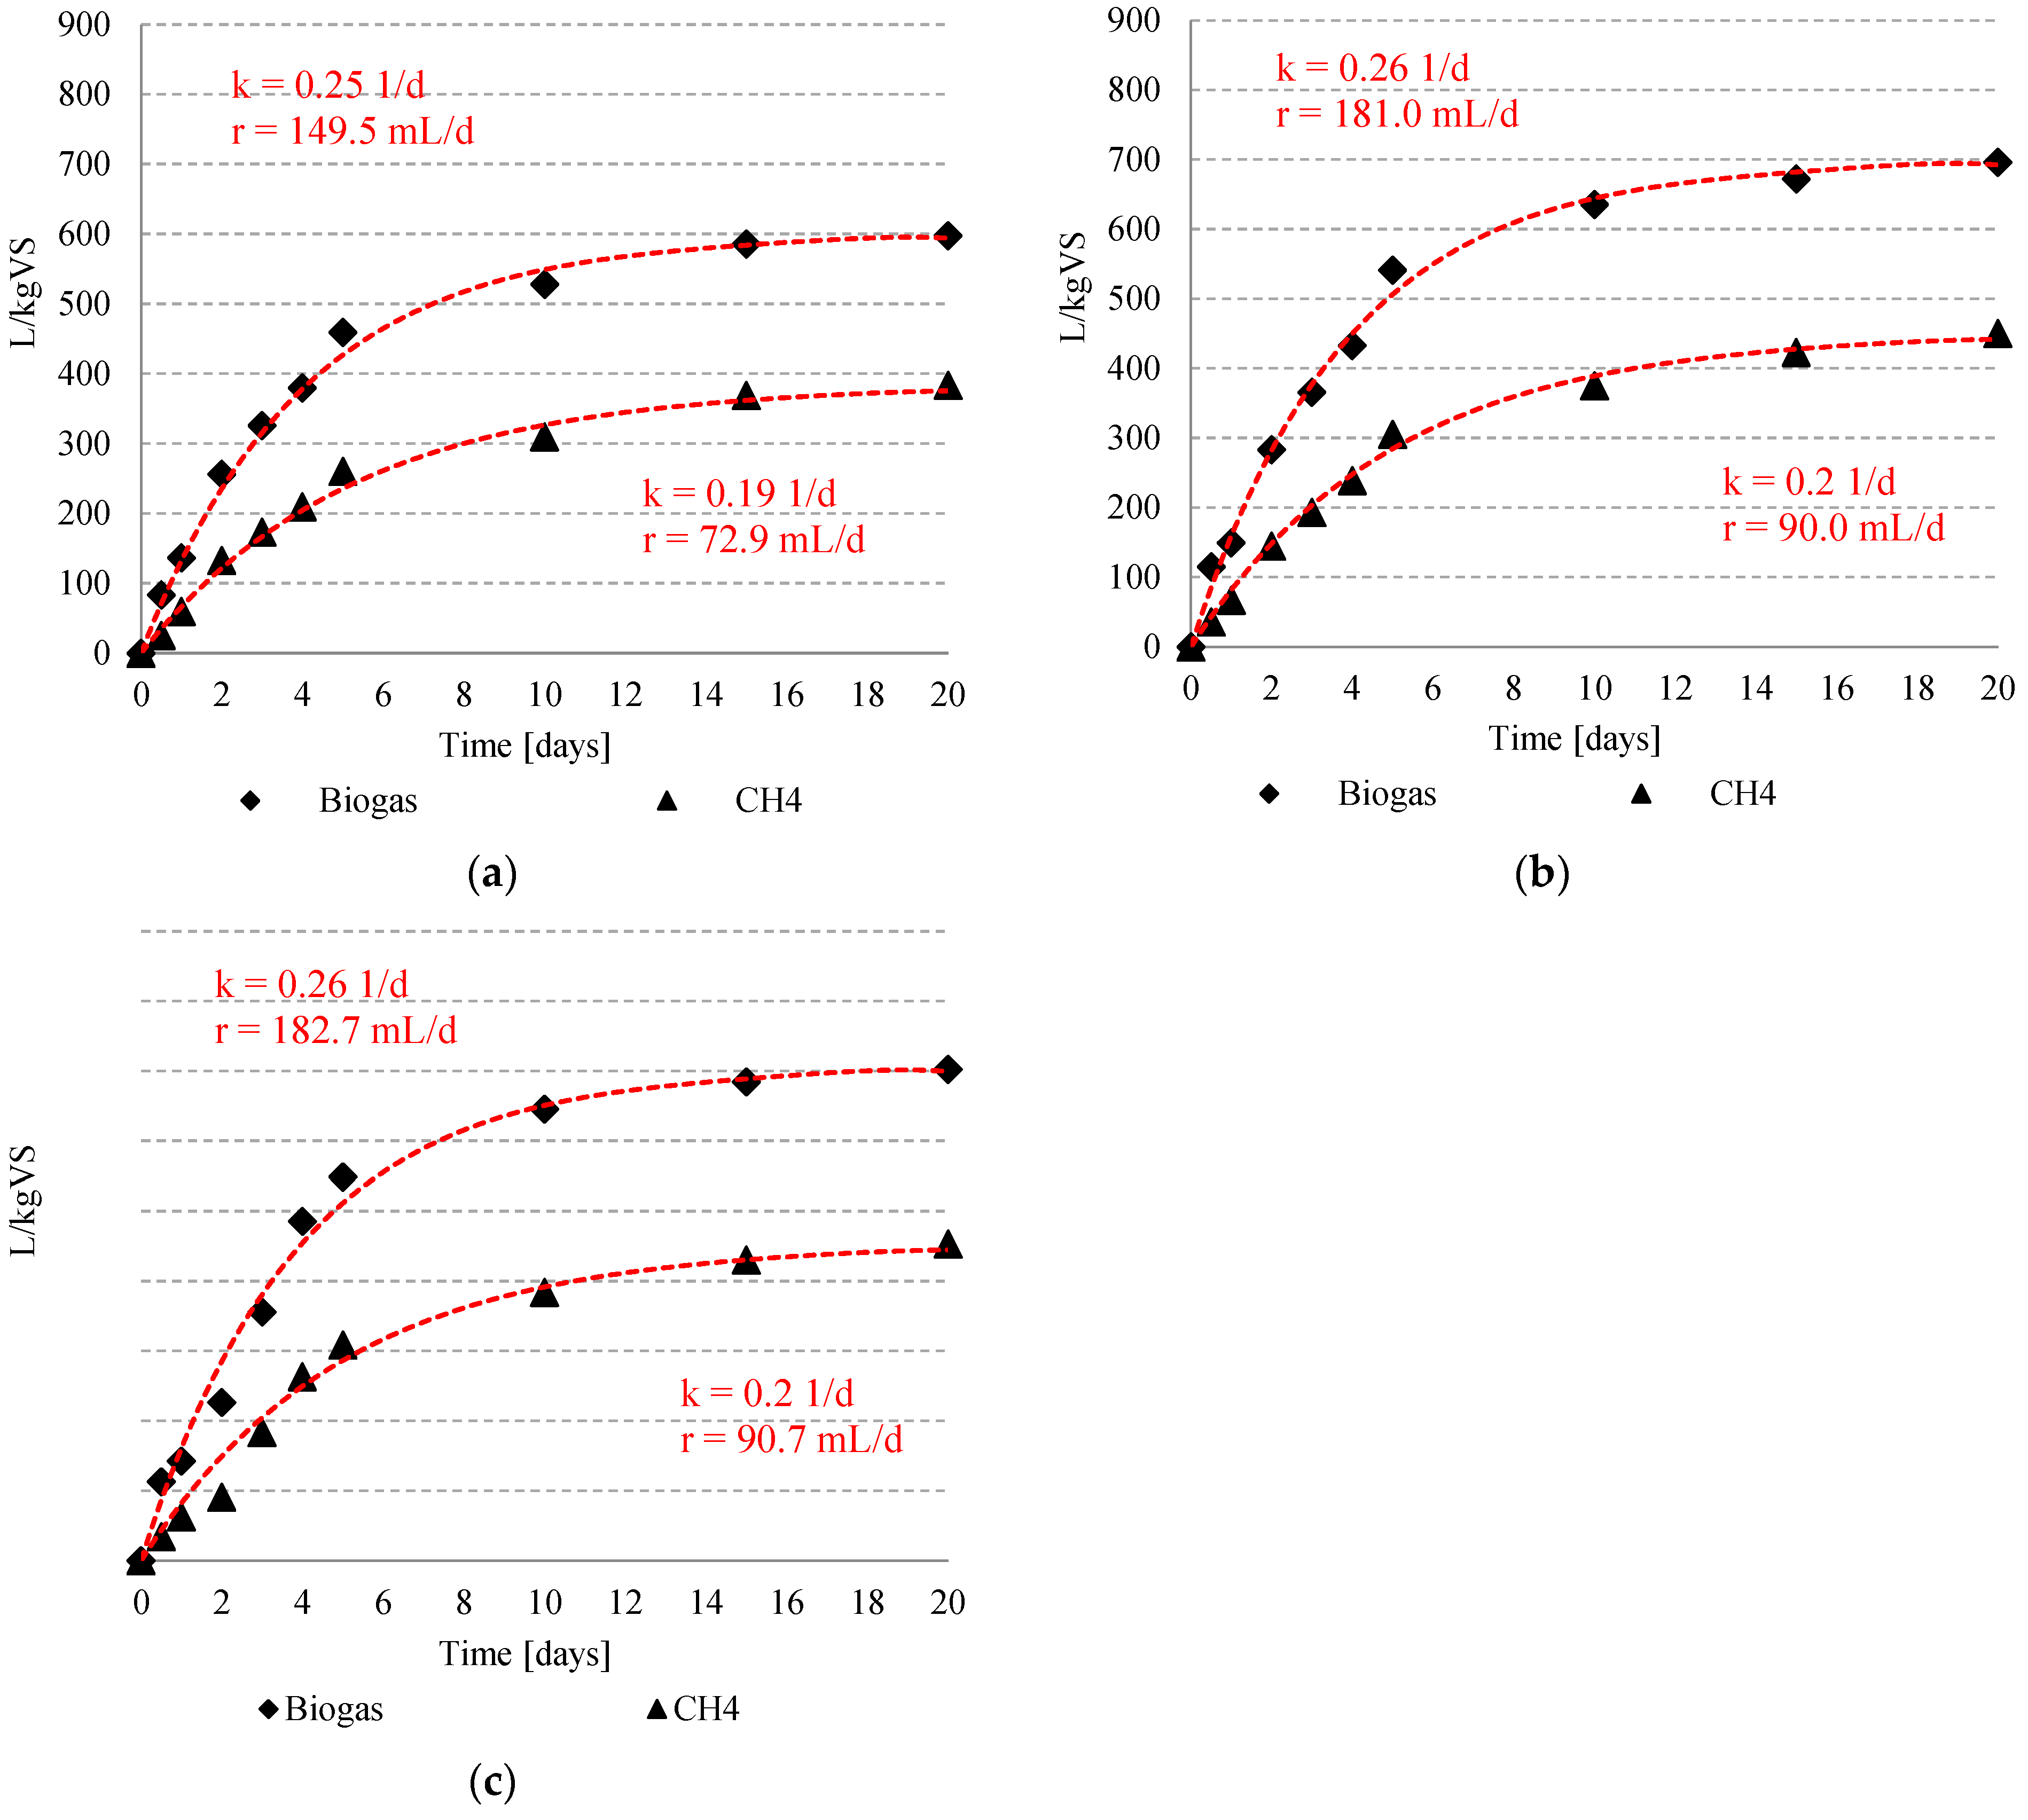
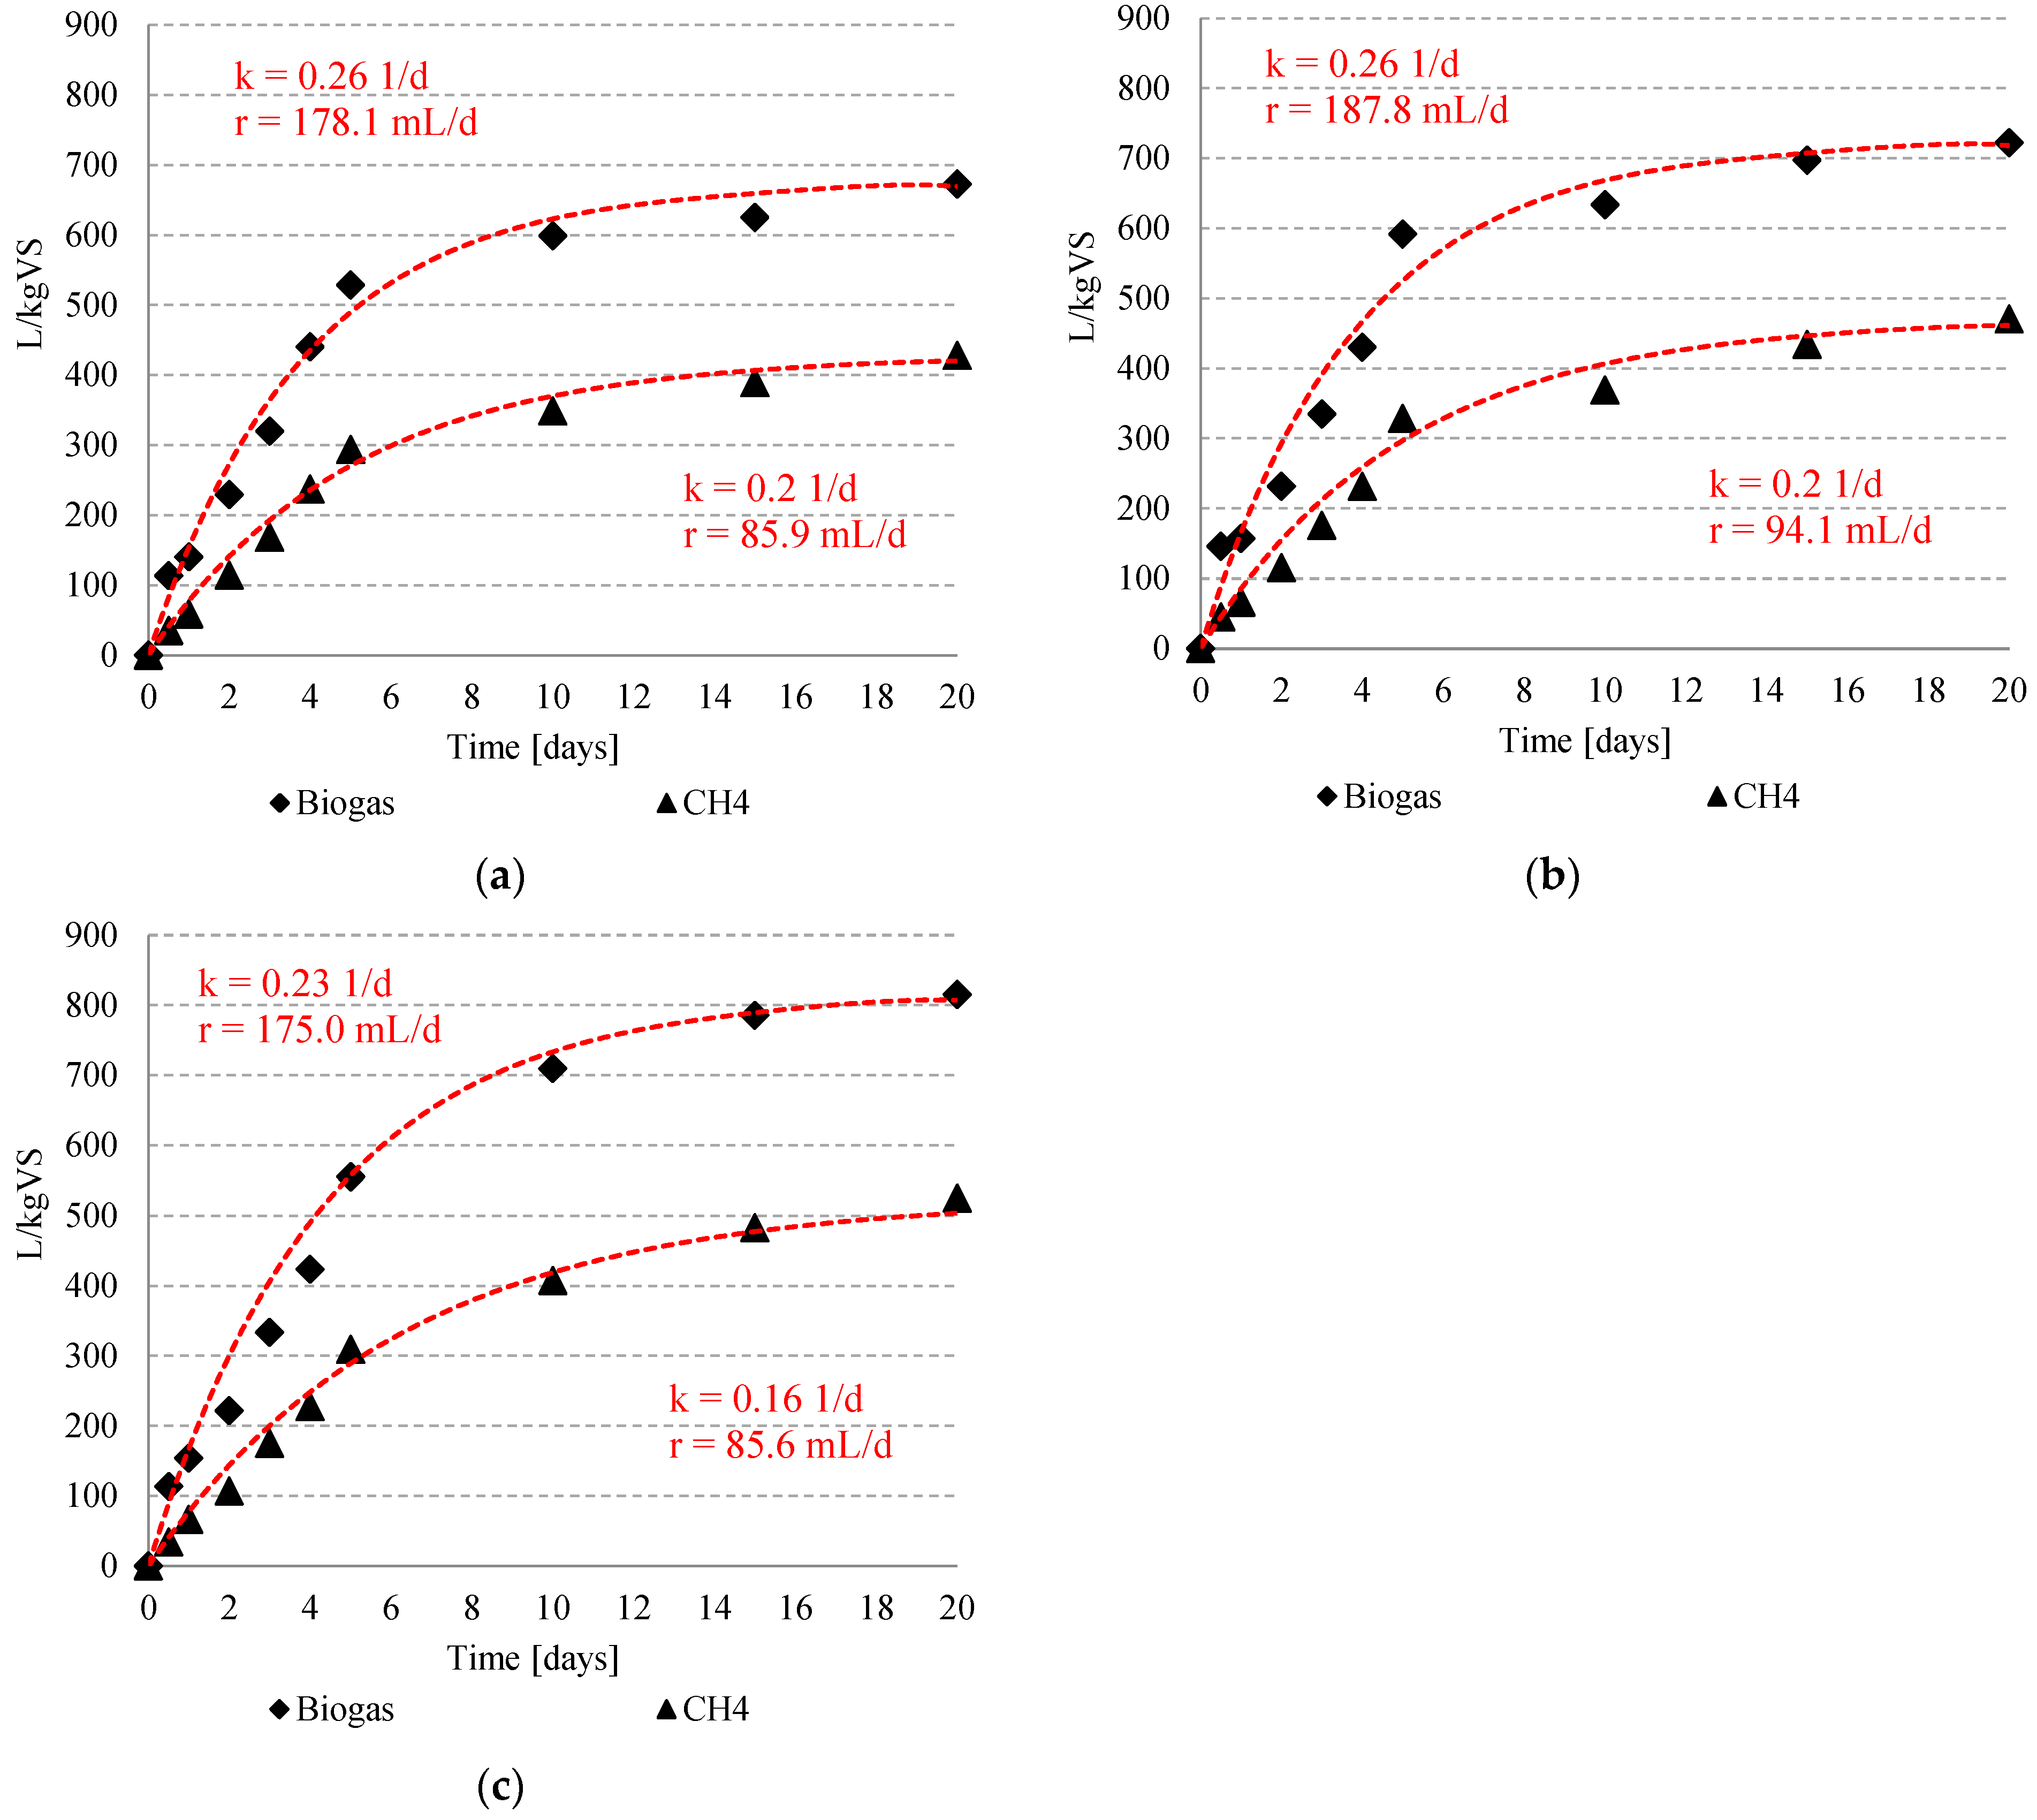
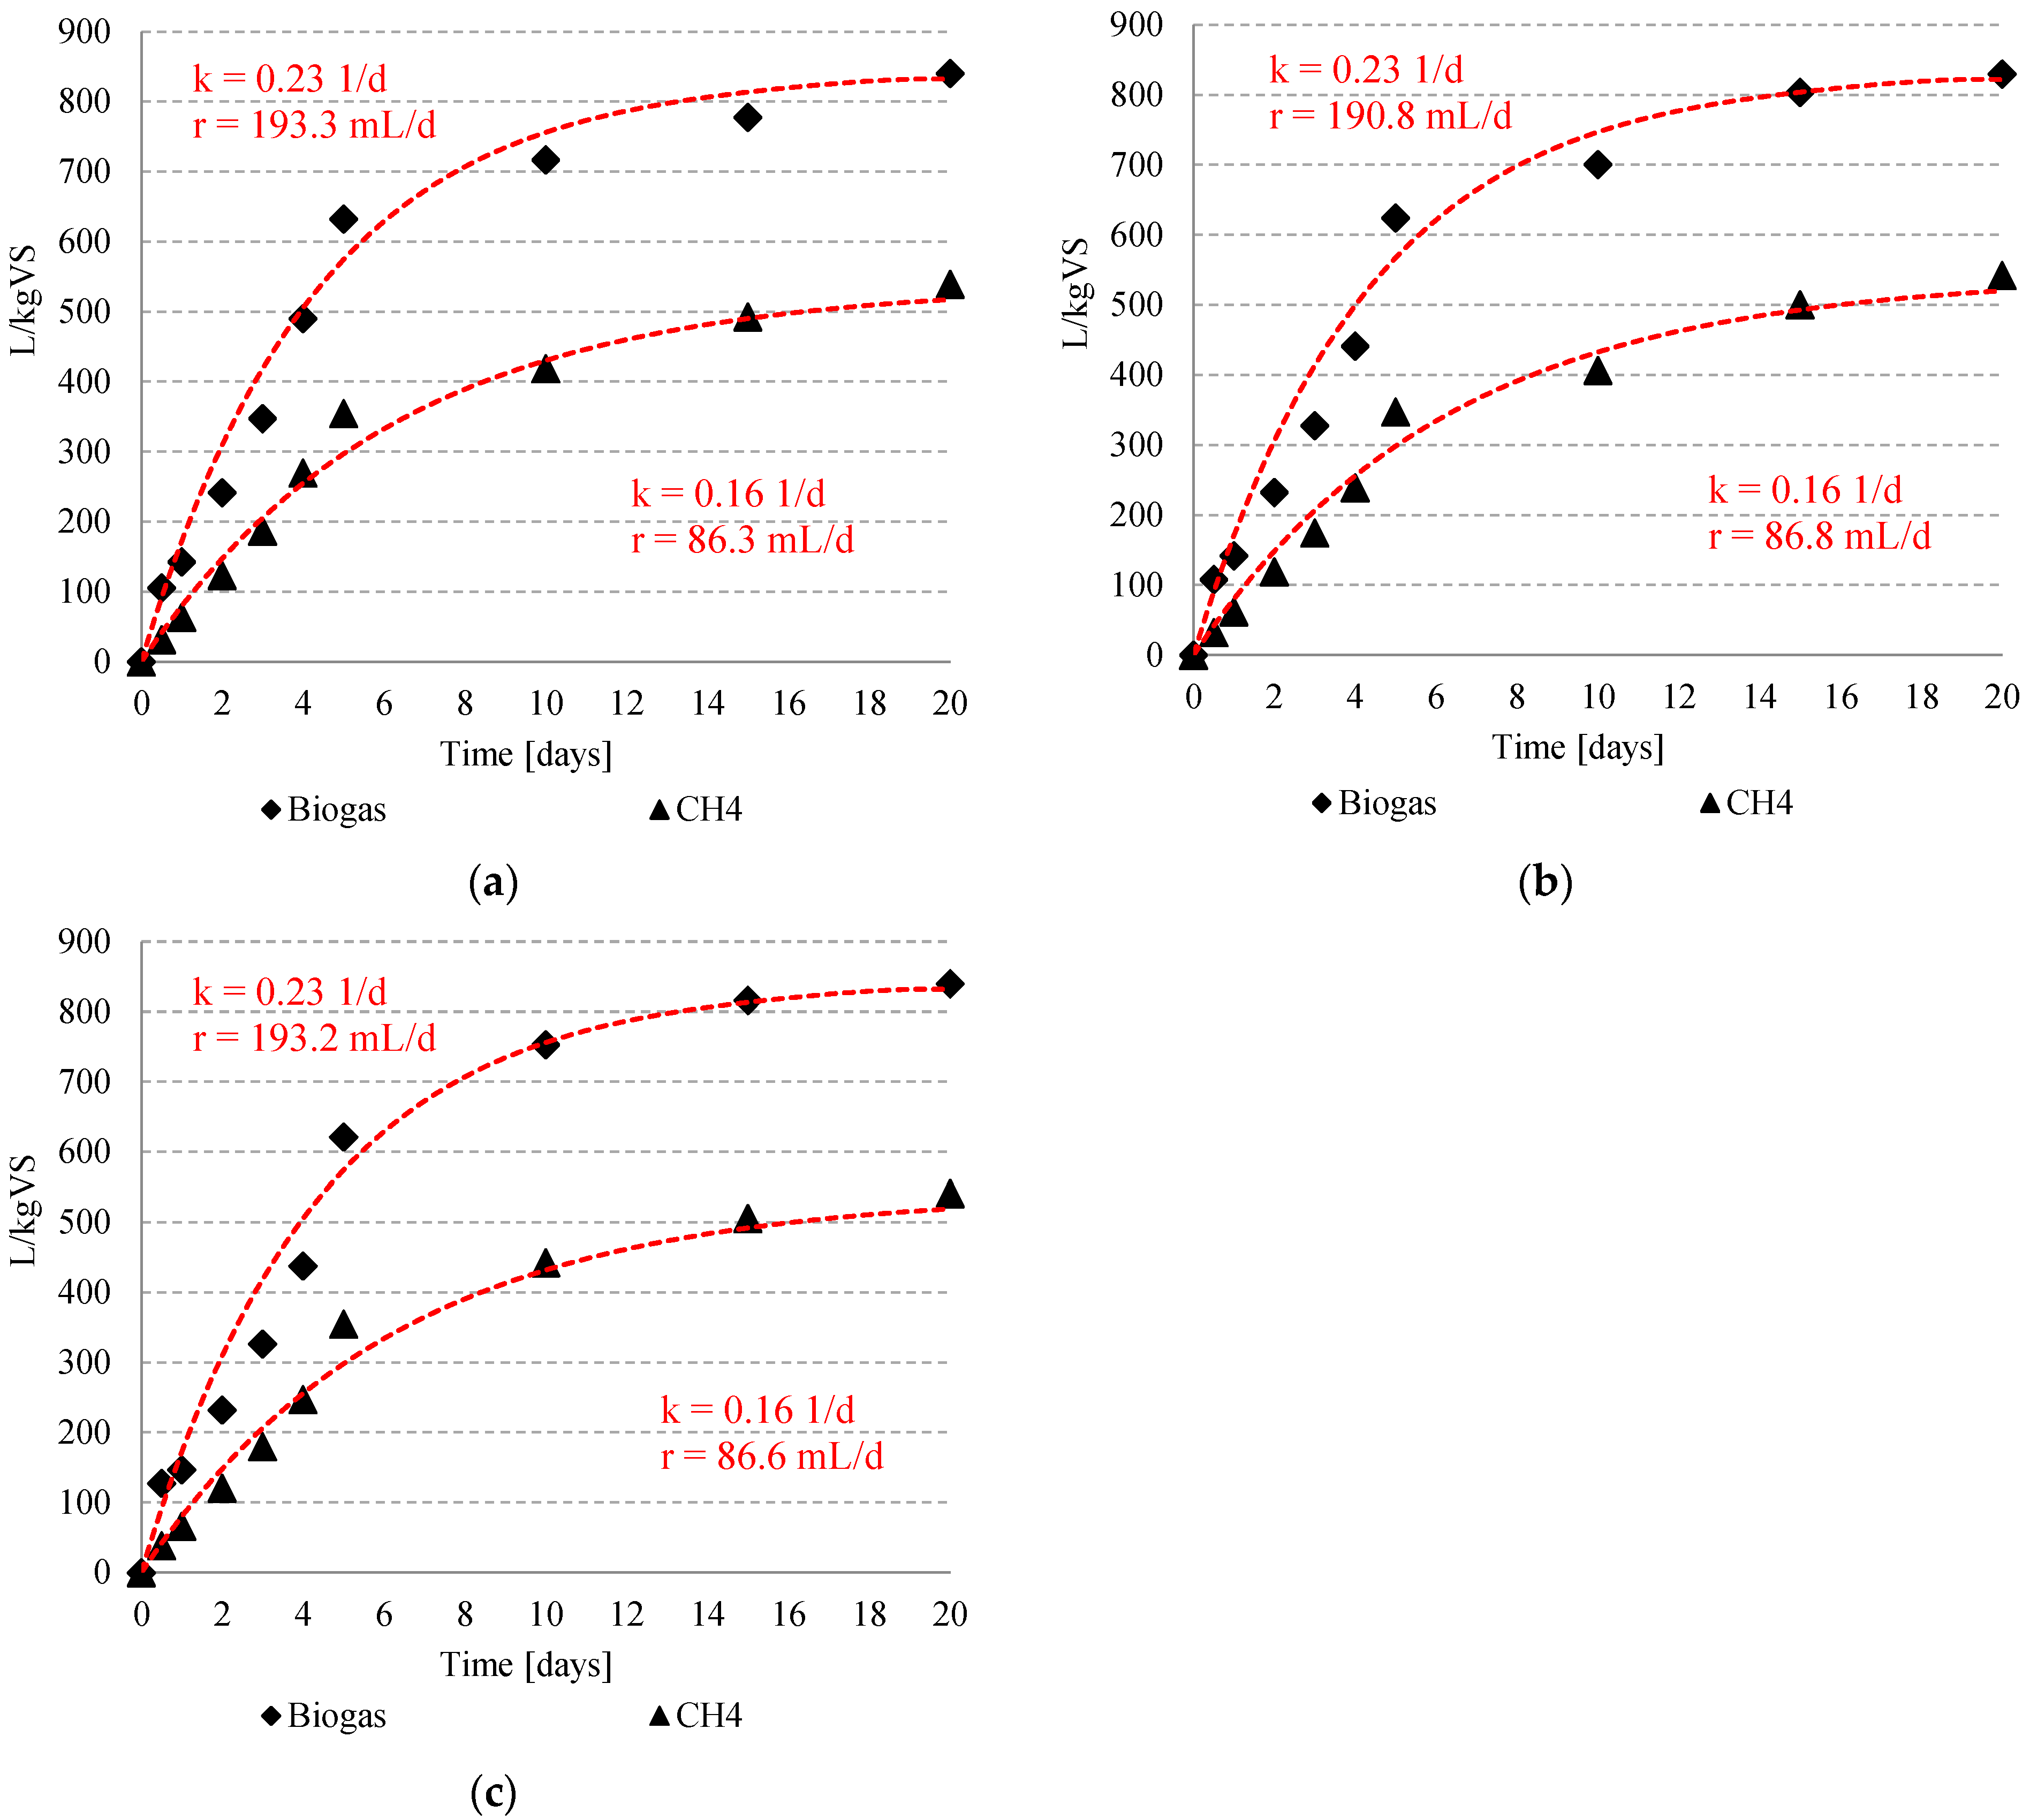
3.2. Biogas and Methane Production

The use of the pretreatment process with EMR as the only factor influencing the final effects of the anaerobic digestion process had no significant effect on the amount of methane produced or the qualitative composition of the biogas (p > 0.05) (Figure 3a). The results prove that the exclusive use of hydrothermal depolymerisation with MW influences the decomposition of the biomass and ensures an efficient transfer of the organic compounds into the dissolved phase. Despite the fragmentation, the structure of the substrate remains complex and is not susceptible to biodegradation under anaerobic conditions. Elalami et al. [35] have shown that microwave (MW) and ultrasonic (US) pretreatment have no effect on CH4 production, which is explained by their low effect on fibre degradation. It has been demonstrated that the cell structure of lignocellulosic biomass is inherently complex and difficult to penetrate by MW radiation, so that the degradation of matter requires mainly chemical reactions in addition to physical destruction [35]. The combination of MW and US with the addition of an alkaline reagent increased CH4 production by 13% and 16% to 244 ± 5 L/kgVS and 250 ± 13 L/kgVS, respectively. Results show that MW and US reduced the time required for alkaline pretreatment [35]. Although the indirect indicators of pretreatment efficiency were high in S2, the efficiency of gaseous metabolite production by the anaerobic bacteria was comparable to the values obtained in the control sample S1(C). In S1(C), the amount of biogas produced was 684 ± 8 L/kgVS, and the methane content was 63.8 ± 0.62% (Figure 3b and Figure 4). The production efficiency and the qualitative composition of the biogas were similar for all S2 variants (p > 0.05). The yield of gaseous metabolic products of the anaerobic bacteria ranged from 598 ± 10 L/kgVS (T10) to 696 ± 41 L/kgVS (T20) (p > 0.05) (Figure 3b and Figure 5). At T30, there was no significant increase in biogas production, which totalled 703 ± 4 L/kgVS (Figure 3b and Figure 5c) (p > 0.05). In all S2 trial variants, the methane concentration fluctuated by 64.5% (p > 0.05) (Figure 3b and Figure 5).
Other researchers have also tried to prove the influence, or lack thereof, of the applied pretreatment on the anaerobic fermentation of lignocellulosic substrates. In the study by Kainthola et al. [53], the high temperature of microwave heating (190 °C) of rice straw and its short duration (4 min) resulted in a CH4 yield of 325.2318 L/kgVS. In a control experiment without pretreatment, a CH4 production of 230.52 L/kgVS was achieved [53]. Studies by Elalami et al. [35] showed that alkaline pretreatment of olive pomace with a dose of 8% NaOH for 1 day resulted in a CH4 production of 30% compared to the unconditioned substrate and ensured a yield of 280 ± 13 L/kgVS.
The application of the combined EMR-AcTH procedure (S3) with a dosage of 0.05 g HCl/gTS substrate (T20-0.05 HCl) and 0.10 g HCl/gTS (T20-0.10 HCl) also had no significant effect on obtaining higher technological effects compared to those obtained in S1(C) (p > 0.05). In T20-0.05 HCl, the unit volume of biogas obtained was 673 ± 21 L/kgVS, while that of methane was 428 ± 13 LCH4/kgVS (Figure 3b and Figure 6a). In T20-0,10 HCl, it was 722 ± 25 L/kgVS and 470 ± 17 LCH4/kgVS (Figure 3b and Figure 6b). A significant increase in the efficiency of methane fermentation was observed in S3 (T20-0.30 HCl), where the amount of biogas was 815 ± 65 L/kgVS and methane was 525 ± 42 LCH4/kgVS (p < 0.05) (Figure 3b and Figure 6c). The kinetics of the biogas production process were characterised by a rate (r) of 175.0 mL/d and a rate constant (k) of 0.23 1/d. In the case of CH4, these values were 85.6 mL/d and 0.16 1/d, respectively (Figure 6c). In all S4 experimental variants in which the simultaneous effect of EMR-AcTH was analysed, the observed anaerobic digestion efficiency was high and very uniform (p > 0.05). At T20-0.05 NaOH, 830 ± 13 L/kgVS and 542 ± 8 LCH4/kgVS were achieved (Figure 3b and Figure 7). With T20-0.10 NaOH and T20-0.20 NaOH, the average biogas yield was 840 L/kgVS, and methane production was 539 ± 4 LCH4/kgVS and 541 ± 16 d LCH4/kgVS (Figure 3b and Figure 7). For all S4 variants, the rate constants (k) characterising the production of biogas and CH4 were 0.23 1/d and 0.16 1/d, respectively (Figure 7). However, the production rate (r) was over 190.0 mL/d for biogas and over 86 mL/d for CH4. Table 4 shows the results of the respirometric tests in terms of the daily increase in the amount of biogas and the changes in CH4 concentration.
Shah et al. [56] also investigated the effectiveness of microwave-assisted alkaline pretreatment to increase biogas production from agricultural waste. Three alkaline reagents were tested at concentrations of 1%, 2%, 3% and 5%, and Ca(OH)2 at a dose of 0.5%. Three different heating variants were used: a water bath, an autoclave, and a microwave oven. Results showed that pretreatment of wheat straw with 2% NaOH and MW heating (120 °C) provided the highest cumulative biogas yield of 560 L/kgVS, twice as much as unconditioned substrates [56]. Nowicka et al. [55] investigated the effect of microwave heating and HCl, H2SO4, and H3PO4 acids on the anaerobic degradation of maize silage in the methane fermentation process. Higher biogas production was demonstrated for all tested acids compared to the control sample. The largest amount of biogas, which exceeded 1800 L/kgVS, was achieved in the variant with HCl at a dose of 0.4 g/gTS [55]. Achinas et al. [57] also investigated the effect of acidic pretreatment (H2SO4) on the efficiency of anaerobic fermentation of potato peelings with the addition of cow manure at a ratio of 60:40. The acidic hydrolysis used made it possible to obtain 485.4 L/kgVS of biogas, of which 283.4 LCH4/kgVS. In the control sample, which was not subjected to conditioning, 423.1 L/kgVS of biogas was obtained, of which 237.4 LCH4/kgVS. Results showed pretreated potato peels have a great potential to improve biogas production and increase energy efficiency through co-fermentation with cow manure while ensuring a stable anaerobic digestion process [57].
The correlations between the concentration of COD and TOC in the dissolved phase and the amount of CH4 recovered were weak, as shown by the coefficients of determination of R2 = 0.0342 (Figure 8a) and R2 = 0.1221 (Figure 8b), respectively. This is a new observation, indicating that it is not always possible to directly link the indirect effects of the pretreatment process to the efficiency of biomethane production. Many previous studies have demonstrated strong correlations between the concentration of organic compounds in the dissolved phase, the degree of solubilisation, and the progression and final technological effects of anaerobic digestion [58,59]. Examples include the study by Islam and Ranade [59], in which hydrodynamic cavitation was used as a pretreatment method for dissolved air flotation (DAF) sludge from dairy processing waste streams prior to anaerobic digestion, as well as by Dębowski et al. [60], in which ultrasonic pretreatment of granulated microalgae-bacteria sludge was used prior to anaerobic digestion.
In this study, we have not been able to confirm these correlations, which indicates that a considerable proportion of the organic compounds transferred to the dissolved phase were not biodegradable under anaerobic conditions. This is most likely related to the structure of the lignocellulosic complex, which is a difficult organic substrate for anaerobic bacteria even after the application of a pretreatment procedure [61]. This is influenced by many specific factors, including the crystallinity of the cellulose, its available surface area, the porosity, the size of the substrate fraction, the thickness of the cell walls, the diversity of biomass molecules, and the content of lignin and hemicellulose [62]. The methane-fermentable carbohydrates contained in the biomass, such as cellulose and hemicellulose, are enclosed in the cross-linked structure of lignocellulose, which is resistant to biodegradation by enzymes and microorganisms [63]. An effective pretreatment should ensure the separation of lignin and cellulose, a high content of amorphous cellulose in the substrate, high porosity of the substrates, and, at the same time, low inhibitor production and energy consumption [64]. Other researchers also point to examples where there is not always a strong correlation between the indirect effects of pretreatment and the direct effects of methane fermentation. For example, research by Sapci [65] shows that microwave treatment of both dry and wet straw did not improve the efficiency of anaerobic digestion in terms of the amount of biogas and CH4 produced.
The reason for a lack of correlation between the concentration of dissolved organic compounds and the observed effects of fermentation is the presence of toxic substances in the environment [66]. Chemical pretreatment processes of substrates promote the production of furan derivatives (furfural and 5-hydroxymethylfurfural) or phenolic compounds (vanillin, 4-hydroxybenzaldehyde) [67]. Furan derivatives are formed during the dehydration of pentoses and hexoses, while phenolic compounds are the result of lignin decomposition [68]. These compounds are inhibitors of anaerobic fermentation, especially of the methanogenic phase. They inhibit enzymatic reactions, cause the formation of reactive oxygen species, and inhibit the growth of anaerobic microorganisms by damaging the DNA [69,70]. Phenolic compounds damage bacterial cells, disrupt the permeability of cell membranes, and thus lead to their mechanical destruction [71,72]. It has also been observed that phenolic compounds with a low molecular weight are more toxic than those with a higher molecular weight [72].

3.3. Energy Balance

The total MW energy consumption of the reactor ranged from 7.3 kWh (T10) to 7.8 kWh (T30). The gross energy yield contained in the biogas was directly dependent on the amount of CH4 produced, and its energy value was 9.17 kWh/m3. The highest value for this indicator was recorded in S4. In the T20-0.05 NaOH variant it was 48.85 kWh, while in the T20-0.10 NaOH and T20-0.20 NaOH variants it was 46.77 kWh. The highest net energy value after taking into account the energy consumption for the MW heating system was achieved in the T20-0.10 NaOH and T20-0.20 NaOH variants, and it totalled 39.27 kWh. A slightly lower energy efficiency was achieved with T20-0.05 NaOH, where it totalled 38.35 kWh. The most efficient Ac-TH variant recorded 37.89 kWh. The amount of energy per unit generated directly by using the tested pretreatment solution was also estimated. For this purpose, the gross energy gained was reduced by the energy consumption of the MW reactor and the amount of energy gained from the untreated substrate. The highest net energy gain of 3.51 kWh was achieved with the T20-0.10 NaOH and T20-0.20 NaOH variants. A negative final energy balance was determined for all variants S2 and S3 (T20-0.05 HCl). For S2, it was between −1.38 kWh (T30) and −5.92 kWh (T10), while for S3 (T20-0.05 HCl), it was −0.25 kWh. The energy balance is shown in Table 5.
Energy sustainability is one of the most important parameters that should be analysed to ensure the successful application of pretreatment processes [73]. Many researchers have attempted to tackle this task. Kainthola et al. [53], for example, used microwave heating as a pretreatment method for rice straw and achieved a total net energy gain of 9.13 × 10⁻⁴ kWh/gVS under optimal temperature conditions (190 °C, 4 min). This means that the energy demand in this study was lower than the energy recovery and therefore economically feasible from an energy point of view. It was found that the effectiveness of the process can be further increased by increasing the density of the pretreated biomass [53]. In the study by Elalami et al. [35], microwave pretreatment with low energy input slightly improved methane production from olive pomace, although the relative energy efficiency was negative. Ultrasonic pretreatment also gave a negative result. However, the combination of alkaline and US pretreatment led to an increase in relative energy efficiency values. At a dose of 8% NaOH, the highest relative energy efficiency of 25% was achieved [35]. It should be noted that biomass concentration is the most important parameter affecting the energy efficiency of MW pretreatment [74]. It has been demonstrated that a high VS concentration is necessary to achieve a positive energy balance for MW pretreatment [75].

4. Conclusions

Regardless of the pretreatment variant used, similar effects were observed in relation to the changes in the concentration of organic compounds characterised by the COD and TOC indicators in the dissolved phase. However, these values were more than twice as high as the content in the liquid phase of the substrate without pretreatment. The technological effects of pretreatment had a direct influence on the degree of solubilisation, which was very uniform and ranged between 20% and 28% for both monitored indicators.
The indicator that most clearly confirmed the efficient disintegration of the organic substrate was the concentration of dissolved sugars. The use of MW heating and combined chemical pretreatment increased the content of these compounds in the dissolved phase by more than 20 times.
The test results did not confirm the relationship between the concentration of organic compounds in the dissolved phase and the observed degree of solubilisation and anaerobic digestion efficiency achieved. This indicates that in the case of the lignocellulosic biomass tested, efficient disintegration of the substrate and its transfer to the liquid phase do not lead to increased susceptibility to biodegradation under anaerobic conditions.
The analysis of the efficiency of the fermentation process showed that the highest technological effects were achieved with 20-min MW heating and 0.10–0.20 gHCL/gTS, as well as with all variants of alkaline thermohydrolysis. The highest net energy gain of 3.51 kWhwas achieved in the combined alkaline thermohydrolysis with NaOH doses between 0.10 and 0.20 g/gTS. A negative energy balance was recorded for all variants of the stage in which only hydrothermal depolymerisation with MW heating was used.

Supplementary Materials

The following supporting information can be downloaded at: https://www.mdpi.com/article/10.3390/en17174207/s1, Table S1. Characteristics of the parameters of applied MW radiation and their influence on the properties of biomass of different origins and characteristics.

Author Contributions

Conceptualization, M.D. and M.Z.; methodology, M.D. and M.Z.; software, M.D.; validation, M.D.; formal analysis, M.D.; investigation, M.D., M.Z., A.N. and J.K.; resources, M.D., M.Z., A.N. and J.K.; data curation, M.D., M.Z., and A.N.; writing—original draft preparation, M.D. and J.K.; writing—review and editing, M.D. and J.K.; visualization, M.D. and J.K.; supervision, M.D.; project administration, M.D.; funding acquisition, M.D. All authors have read and agreed to the published version of the manuscript.

Funding

This research was financially supported by works no. 29.610.023-110 of the University of Warmia and Mazury in Olsztyn, and WZ/WB-IIŚ/3/2022 of the Bialystok University of Technology, funded by the Ministry of Science and Higher Education.

Data Availability Statement

Data are contained within the article.

Conflicts of Interest

The authors declare no conflicts of interest.

References

  1. Atelge, M.R.; Krisa, D.; Kumar, G.; Eskicioglu, C.; Nguyen, D.D.; Chang, S.W.; Atabani, A.E.; Al-Muhtaseb, A.H.; Unalan, S. Biogas Production from Organic Waste: Recent Progress and Perspectives. Waste Biomass Valorization 2020, 11, 1019–1040. [Google Scholar] [CrossRef]
  2. Ellacuriaga, M.; García-Cascallana, J.; Gómez, X. Biogas Production from Organic Wastes: Integrating Concepts of Circular Economy. Fuels 2021, 2, 144–167. [Google Scholar] [CrossRef]
  3. Kazimierowicz, J.; Dzienis, L.; Dębowski, M.; Zieliński, M. Optimisation of Methane Fermentation as a Valorisation Method for Food Waste Products. Biomass Bioenergy 2021, 144, 105913. [Google Scholar] [CrossRef]
  4. Sevillano, C.A.; Pesantes, A.A.; Peña Carpio, E.; Martínez, E.J.; Gómez, X. Anaerobic Digestion for Producing Renewable Energy—The Evolution of This Technology in a New Uncertain Scenario. Entropy 2021, 23, 145. [Google Scholar] [CrossRef] [PubMed]
  5. Ferdeş, M.; Dincă, M.N.; Moiceanu, G.; Zabava, B.Ş.; Paraschiv, G. Microorganisms and Enzymes Used in the Biological Pretreatment of the Substrate to Enhance Biogas Production: A Review. Sustainability 2020, 12, 7205. [Google Scholar] [CrossRef]
  6. Ahmed, B.; Kumar Tyagi, V.; Kazmi, A.A.; Khursheed, A. New Insights into Thermal-Chemical Pretreatment of Organic Fraction of Municipal Solid Waste: Solubilization Effects, Recalcitrant Formation, Biogas Yield and Energy Efficiency. Fuel 2022, 319, 123725. [Google Scholar] [CrossRef]
  7. Xu, H.; Li, Y.; Hua, D.; Zhao, Y.; Chen, L.; Zhou, L.; Chen, G. Effect of Microaerobic Microbial Pretreatment on Anaerobic Digestion of a Lignocellulosic Substrate under Controlled PH Conditions. Bioresour. Technol. 2021, 328, 124852. [Google Scholar] [CrossRef] [PubMed]
  8. Shrestha, B.; Hernandez, R.; Fortela, D.L.B.; Sharp, W.; Chistoserdov, A.; Gang, D.; Revellame, E.; Holmes, W.; Zappi, M.E. A Review of Pretreatment Methods to Enhance Solids Reduction during Anaerobic Digestion of Municipal Wastewater Sludges and the Resulting Digester Performance: Implications to Future Urban Biorefineries. Appl. Sci. 2020, 10, 9141. [Google Scholar] [CrossRef]
  9. Kang, Y.R.; Su, Y.; Wang, J.; Chu, Y.X.; Tian, G.; He, R. Effects of Different Pretreatment Methods on Biogas Production and Microbial Community in Anaerobic Digestion of Wheat Straw. Environ. Sci. Pollut. Res. 2021, 28, 51772–51785. [Google Scholar] [CrossRef]
  10. Kisielewska, M.; Rusanowska, P.; Dudek, M.; Nowicka, A.; Krzywik, A.; Dębowski, M.; Kazimierowicz, J.; Zieliński, M. Evaluation of Ultrasound Pretreatment for Enhanced Anaerobic Digestion of Sida Hermaphrodita. Bioenergy Res. 2020, 13, 824–832. [Google Scholar] [CrossRef]
  11. Lee, J.; Park, K.Y. Impact of Hydrothermal Pretreatment on Anaerobic Digestion Efficiency for Lignocellulosic Biomass: Influence of Pretreatment Temperature on the Formation of Biomass-Degrading Byproducts. Chemosphere 2020, 256, 127116. [Google Scholar] [CrossRef] [PubMed]
  12. Szaja, A.; Montusiewicz, A.; Pasieczna-Patkowska, S.; Grządka, E.; Montusiewicz, J.; Lebiocka, M. Pre-Treatment of Spent Coffee Grounds Using Hydrodynamic Cavitation. Energies 2024, 17, 2229. [Google Scholar] [CrossRef]
  13. Paul Choudhury, S.; Kalamdhad, A.S. Optimization of Electrokinetic Pretreatment for Enhanced Methane Production and Toxicity Reduction from Petroleum Refinery Sludge. J. Environ. Manag. 2021, 298, 113469. [Google Scholar] [CrossRef] [PubMed]
  14. Fu, S.F.; Chen, K.Q.; Zhu, R.; Sun, W.X.; Zou, H.; Guo, R.B. Improved Anaerobic Digestion Performance of Miscanthus Floridulus by Different Pretreatment Methods and Preliminary Economic Analysis. Energy Convers. Manag. 2018, 159, 121–128. [Google Scholar] [CrossRef]
  15. Deng, Y.; Qiu, Y.; Yao, Y.; Ayiania, M.; Davaritouchaee, M. Weak-Base Pretreatment to Increase Biomethane Production from Wheat Straw. Environ. Sci. Pollut. Res. 2020, 27, 37989–38003. [Google Scholar] [CrossRef] [PubMed]
  16. Wang, D.; He, D.; Liu, X.; Xu, Q.; Yang, Q.; Li, X.; Liu, Y.; Wang, Q.; Ni, B.J.; Li, H. The Underlying Mechanism of Calcium Peroxide Pretreatment Enhancing Methane Production from Anaerobic Digestion of Waste Activated Sludge. Water Res. 2019, 164, 114934. [Google Scholar] [CrossRef] [PubMed]
  17. Kazimierowicz, J.; Dębowski, M.; Zieliński, M. Long-Term Pre-Treatment of Municipal Sewage Sludge with Solidified Carbon Dioxide (SCO2)—Effect on Anaerobic Digestion Efficiency. Appl. Sci. 2023, 13, 3075. [Google Scholar] [CrossRef]
  18. Poddar, B.J.; Nakhate, S.P.; Gupta, R.K.; Chavan, A.R.; Singh, A.K.; Khardenavis, A.A.; Purohit, H.J. A Comprehensive Review on the Pretreatment of Lignocellulosic Wastes for Improved Biogas Production by Anaerobic Digestion. Int. J. Environ. Sci. Technol. 2021, 19, 3429–3456. [Google Scholar] [CrossRef]
  19. Mankar, A.R.; Pandey, A.; Modak, A.; Pant, K.K. Pretreatment of lignocellulosic biomass: A review on recent advances. Bioresour. Technol. 2021, 334, 125235. [Google Scholar] [CrossRef]
  20. Deng, S.; Zhang, G.; Wang, X.; Zheng, T.; Wang, P. Preparation and performance of polyacrylonitrile fiber functionalized with iminodiacetic acid under microwave irradiation for adsorption of Cu(II) and Hg(II). Chem. Eng. J. 2015, 276, 349–357. [Google Scholar] [CrossRef]
  21. Hoang, A.T.; Nižetić, S.; Ong, H.C.; Mofijur, M.; Ahmed, S.F.; Ashok, B.; Bui, V.T.V.; Chau, M.Q. Insight into the Recent Advances of Microwave Pretreatment Technologies for the Conversion of Lignocellulosic Biomass into Sustainable Biofuel. Chemosphere 2021, 281, 130878. [Google Scholar] [CrossRef]
  22. Mohan, M.; Deshavath, N.N.; Banerjee, T.; Goud, V.V.; Dasu, V.V. Ionic liquid and sulfuric acid-based pretreatment of bamboo: Biomass delignification and enzymatic hydrolysis for the production of reducing sugars. Ind. Eng. Chem. Res. 2018, 57, 10105–10117. [Google Scholar] [CrossRef]
  23. Hassan, S.S.; Williams, G.A.; Jaiswal, A.K. Emerging technologies for the pretreatment of lignocellulosic biomass. Bioresour. Technol. 2018, 262, 310–318. [Google Scholar] [CrossRef]
  24. Peng, H.; Chen, H.; Qu, Y.; Li, H.; Xu, J. Bioconversion of different sizes of microcrystalline cellulose pretreated by microwave irradiation with/without NaOH. Appl. Energy 2014, 117, 142–148. [Google Scholar] [CrossRef]
  25. Ha, S.H.; Mai, N.L.; An, G.; Koo, Y.-M. Microwave-assisted pretreatment of cellulose in ionic liquid for accelerated enzymatic hydrolysis. Bioresour. Technol. 2011, 102, 1214–1219. [Google Scholar] [CrossRef] [PubMed]
  26. Hu, Z.-H.; Yue, Z.-B.; Yu, H.-Q.; Liu, S.-Y.; Harada, H.; Li, Y.-Y. Mechanisms of microwave irradiation pretreatment for enhancing anaerobic digestion of cattail by rumen microorganisms. Appl. Energy 2012, 93, 229–236. [Google Scholar] [CrossRef]
  27. Passos, F.; Carretero, J.; Ferrer, I. Comparing pretreatment methods for improving microalgae anaerobic digestion: Thermal, hydrothermal, microwave and ultrasound. Chem. Eng. J. 2015, 279, 667–672. [Google Scholar] [CrossRef]
  28. Amini, N.; Haritos, V.S.; Tanksale, A. Microwave Assisted Pretreatment of Eucalyptus Sawdust Enhances Enzymatic Saccharification and Maximizes Fermentable Sugar Yield. Renew. Energy 2018, 127, 653–660. [Google Scholar] [CrossRef]
  29. Nowicka, A.; Zieliński, M.; Dębowski, M. Microwave support of the alcoholic fermentation process of cyanobacteria Arthrospira platensis. Environ. Sci. Pollut. Res. 2020, 27, 118–124. [Google Scholar] [CrossRef]
  30. Balat, M. Production of Bioethanol from Lignocellulosic Materials via the Biochemical Pathway: A Review. Energy Convers. Manag. 2011, 52, 858–875. [Google Scholar] [CrossRef]
  31. Tung, T.T.; Pereira, A.L.C.; Poloni, E.; Dang, M.N.; Wang, J.; Le, T.S.D.; Kim, Y.J.; Pho, Q.H.; Nine, M.J.; Shearer, C.J.; et al. Irradiation Methods for Engineering of Graphene Related Two-Dimensional Materials. Appl. Phys. Rev. 2023, 10, 031309. [Google Scholar] [CrossRef]
  32. Nowicka, A.; Zieliński, M.; Dębowski, M.; Dudek, M.; Rusanowska, P. Progress in the production of biogas from Virginia mallow after alkaline-heat pretreatment. Biomass Bioenergy 2019, 126, 174–180. [Google Scholar] [CrossRef]
  33. Abdel-Hay, M.M. Principles of Microwave Heating for the Food Industry. Emerg. Therm. Process. Food Ind. 2023, 95–117. [Google Scholar] [CrossRef]
  34. Tan, D.; Zhou, J.; Wang, K.; Cai, C.; Xu, D. Modeling and Analysis of the Friction in a Non-Linear Sliding-Mode Triboelectric Energy Harvester. Acta Mech. Sin. Xuebao 2022, 38, 521330. [Google Scholar] [CrossRef]
  35. Elalami, D.; Carrere, H.; Abdelouahdi, K.; Garcia-Bernet, D.; Peydecastaing, J.; Vaca-Medina, G.; Oukarroum, A.; Zeroual, Y.; Barakat, A. Mild Microwaves, Ultrasonic and Alkaline Pretreatments for Improving Methane Production: Impact on Biochemical and Structural Properties of Olive Pomace. Bioresour. Technol. 2020, 299, 122591. [Google Scholar] [CrossRef] [PubMed]
  36. Li, H.; Zhao, Z.; Xiouras, C.; Stefanidis, G.D.; Li, X.; Gao, X. Fundamentals and Applications of Microwave Heating to Chemicals Separation Processes. Renew. Sustain. Energy Rev. 2019, 114, 109316. [Google Scholar] [CrossRef]
  37. Zhong, G.; Xu, S.; Chen, C.; Kline, D.J.; Giroux, M.; Pei, Y.; Jiao, M.; Liu, D.; Mi, R.; Xie, H.; et al. Synthesis of Metal Oxide Nanoparticles by Rapid, High-Temperature 3D Microwave Heating. Adv. Funct. Mater. 2019, 29, 1904282. [Google Scholar] [CrossRef]
  38. Chhanwal, N.; Bhushette, P.R.; Anandharamakrishnan, C. Current Perspectives on Non-Conventional Heating Ovens for Baking Process—A Review. Food Bioprocess. Technol. 2019, 12, 1–15. [Google Scholar] [CrossRef]
  39. El Khaled, D.; Novas, N.; Gazquez, J.A.; Manzano-Agugliaro, F. Microwave Dielectric Heating: Applications on Metals Processing. Renew. Sustain. Energy Rev. 2018, 82, 2880–2892. [Google Scholar] [CrossRef]
  40. Dębowski, M.; Zieliński, M.; Kisielewska, M.; Kazimierowicz, J. Evaluation of Anaerobic Digestion of Dairy Wastewater in an Innovative Multi-Section Horizontal Flow Reactor. Energies 2020, 13, 2392. [Google Scholar] [CrossRef]
  41. Bhaskar, T.; Bhavya, B.; Singh, R.; Naik, D.V.; Kumar, A.; Goyal, H.B. Thermochemical Conversion of Biomass to Biofuels. In Biofuels Alternative Feedstocks and Conversion Processes; Academic Press: Cambridge, MA, USA, 2011; pp. 51–77. [Google Scholar] [CrossRef]
  42. Zieliński, M.; Dębowski, M.; Rusanowska, P.; Kazimierowicz, J. Influence of Microwave Radiation on Pollutant Removal and Biomethane Production Efficiency in Anaerobic Treatment of High-Load Poultry Wastewater. Appl. Sci. 2023, 13, 3553. [Google Scholar] [CrossRef]
  43. Komarov, V.V. A Review of Radio Frequency and Microwave Sustainability-Oriented Technologies. Sustain. Mater. Technol. 2021, 28, e00234. [Google Scholar] [CrossRef]
  44. Demianchuk, B.; Huliiev, S.; Ugol’nikov, A.; Kliat, Y.; Kosenko, A. Development of Microwave Technology of Selective Heating the Components of Heterogeneous Media. East.-Eur. J. Enterp. Technol. 2022, 1, 43–52. [Google Scholar] [CrossRef]
  45. Yue, L.; Cheng, J.; Tang, S.; An, X.; Hua, J.; Dong, H.; Zhou, J. Ultrasound and Microwave Pretreatments Promote Methane Production Potential and Energy Conversion during Anaerobic Digestion of Lipid and Food Wastes. Energy 2021, 228, 120525. [Google Scholar] [CrossRef]
  46. Zou, X.; Yang, R.; Zhou, X.; Cao, G.; Zhu, R.; Ouyang, F. Effects of Mixed Alkali-Thermal Pretreatment on Anaerobic Digestion Performance of Waste Activated Sludge. J. Clean. Prod. 2020, 259, 120940. [Google Scholar] [CrossRef]
  47. Zieliński, M.; Dębowski, M.; Kazimierowicz, J.; Nowicka, A.; Dudek, M. Application of Hydrodynamic Cavitation in the Disintegration of Aerobic Granular Sludge—Evaluation of Pretreatment Time on Biomass Properties, Anaerobic Digestion Efficiency and Energy Balance. Energies 2024, 17, 335. [Google Scholar] [CrossRef]
  48. Klein, M.; Griess, O.; Pulidindi, I.N.; Perkas, N.; Gedanken, A. Bioethanol production from Ficus religiosa leaves using microwave irradiation. J. Environ. Manag. 2016, 177, 20–25. [Google Scholar] [CrossRef]
  49. Maceiras, R.; Alfonsín, V.; Seguí, L.; González, J.F. Microwave Assisted Alkaline Pretreatment of Algae Waste in the Production of Cellulosic Bioethanol. Energies 2021, 14, 5891. [Google Scholar] [CrossRef]
  50. Tsegaye, B.; Balomajumder, C.; Roy, P. Optimization of microwave and NaOH pretreatments of wheat straw for enhancing biofuel yield. Energy Convers. Manag. 2019, 186, 82–92. [Google Scholar] [CrossRef]
  51. Liang, T.; Elmaadawy, K.; Liu, B.; Hu, J.; Hou, H.; Yang, J. Anaerobic Fermentation of Waste Activated Sludge for Volatile Fatty Acid Production: Recent Updates of Pretreatment Methods and the Potential Effect of Humic and Nutrients Substances. Process Saf. Environ. Prot. 2021, 145, 321–339. [Google Scholar] [CrossRef]
  52. Parra-Orobio, B.A.; Girón-Bol, L.M.; Gómez-Muñoz, D.F.; Marmolejo-Rebellón, L.F.; Torres-Lozada, P. Thermal Pre-Treatment as a Tool for Energy Recovery from Food Waste through Anaerobic Digestion. Effect on Kinetic and Physicochemical Characteristics of the Substrate. Environ. Technol. Innov. 2021, 21, 101262. [Google Scholar] [CrossRef]
  53. Kainthola, J.; Shariq, M.; Kalamdhad, A.S.; Goud, V.V. Enhanced Methane Potential of Rice Straw with Microwave Assisted Pretreatment and Its Kinetic Analysis. J. Environ. Manag. 2019, 232, 188–196. [Google Scholar] [CrossRef] [PubMed]
  54. Binod, P.; Satyanagalakshmi, K.; Sindhu, R.; Janu, K.U.; Sukumaran, R.K.; Pandey, A. Short Duration Microwave Assisted Pretreatment Enhances the Enzymatic Saccharification and Fermentable Sugar Yield from Sugarcane Bagasse. Renew. Energy 2012, 37, 109–116. [Google Scholar] [CrossRef]
  55. Nowicka, A.; Zieliński, M.; Dębowski, M.; Dudek, M. Progress in the Production of Biogas from Maize Silage after Acid-Heat Pretreatment. Energies 2021, 14, 8018. [Google Scholar] [CrossRef]
  56. Shah, T.A.; Ali, S.; Afzal, A.; Tabassum, R. Effect of Alkali Pretreatment on Lignocellulosic Waste Biomass for Biogas Production. Int. J. Renew. Energy Res. 2018, 8, 1318–1326. [Google Scholar] [CrossRef]
  57. Achinas, S.; Li, Y.; Achinas, V.; Euverink, G.J.W. Biogas Potential from the Anaerobic Digestion of Potato Peels: Process Performance and Kinetics Evaluation. Energies 2019, 12, 2311. [Google Scholar] [CrossRef]
  58. Dębowski, M.; Kazimierowicz, J.; Świca, I.; Zieliński, M. Ultrasonic Disintegration to Improve Anaerobic Digestion of Microalgae with Hard Cell Walls—Scenedesmus sp. and Pinnularia sp. Plants 2023, 12, 53. [Google Scholar] [CrossRef]
  59. Islam, M.S.; Ranade, V. Enhancing Bmp and Digestibility of Daf Sludge via Hydrodynamic Cavitation; SSRN: Rochester, NY, USA, 2023; pp. 1–33. [Google Scholar] [CrossRef]
  60. Dębowski, M.; Kisielewska, M.; Zieliński, M.; Kazimierowicz, J. The Influence of the Ultrasound Disintegration of Microalgal–Bacterial Granular Sludge on Anaerobic Digestion Efficiency. Appl. Sci. 2023, 13, 7387. [Google Scholar] [CrossRef]
  61. Mohammad Rahmani, A.; Gahlot, P.; Moustakas, K.; Kazmi, A.A.; Shekhar Prasad Ojha, C.; Tyagi, V.K. Pretreatment Methods to Enhance Solubilization and Anaerobic Biodegradability of Lignocellulosic Biomass (Wheat Straw): Progress and Challenges. Fuel 2022, 319, 123726. [Google Scholar] [CrossRef]
  62. Rahmati, S.; Doherty, W.; Dubal, D.; Atanda, L.; Moghaddam, L.; Sonar, P.; Hessel, V.; Ostrikov, K. Pretreatment and Fermentation of Lignocellulosic Biomass: Reaction Mechanisms and Process Engineering. React. Chem. Eng. 2020, 5, 2017–2047. [Google Scholar] [CrossRef]
  63. Xu, N.; Liu, S.; Xin, F.; Zhou, J.; Jia, H.; Xu, J.; Jiang, M.; Dong, W. Biomethane Production from Lignocellulose: Biomass Recalcitrance and Its Impacts on Anaerobic Digestion. Front. Bioeng. Biotechnol. 2019, 7, 191. [Google Scholar] [CrossRef]
  64. Kucharska, K.; Rybarczyk, P.; Hołowacz, I.; Łukajtis, R.; Glinka, M.; Kamiński, M. Pretreatment of Lignocellulosic Materials as Substrates for Fermentation Processes. Molecules 2018, 23, 2937. [Google Scholar] [CrossRef] [PubMed]
  65. Sapci, Z. The Effect of Microwave Pretreatment on Biogas Production from Agricultural Straws. Bioresour. Technol. 2013, 128, 487–494. [Google Scholar] [CrossRef] [PubMed]
  66. Sayara, T.; Sánchez, A. A Review on Anaerobic Digestion of Lignocellulosic Wastes: Pretreatments and Operational Conditions. Appl. Sci. 2019, 9, 4655. [Google Scholar] [CrossRef]
  67. Sivagurunathan, P.; Kumar, G.; Mudhoo, A.; Rene, E.R.; Saratale, G.D.; Kobayashi, T.; Xu, K.; Kim, S.H.; Kim, D.H. Fermentative Hydrogen Production Using Lignocellulose Biomass: An Overview of Pre-Treatment Methods, Inhibitor Effects and Detoxification Experiences. Renew. Sustain. Energy Rev. 2017, 77, 28–42. [Google Scholar] [CrossRef]
  68. Xu, C.; Paone, E.; Rodríguez-Padrón, D.; Luque, R.; Mauriello, F. Recent Catalytic Routes for the Preparation and the Upgrading of Biomass Derived Furfural and 5-Hydroxymethylfurfural. Chem. Soc. Rev. 2020, 49, 4273–4306. [Google Scholar] [CrossRef]
  69. Fernández-Sandoval, M.T.; García, A.; Teymennet-Ramírez, K.V.; Arenas-Olivares, D.Y.; Martínez-Morales, F.; Trejo-Hernández, M.R. Removal of Phenolic Inhibitors from Lignocellulose Hydrolysates Using Laccases for the Production of Fuels and Chemicals. Biotechnol. Prog. 2024, 40, e3406. [Google Scholar] [CrossRef] [PubMed]
  70. Jilani, S.B.; Olson, D.G. Mechanism of Furfural Toxicity and Metabolic Strategies to Engineer Tolerance in Microbial Strains. Microb. Cell Factories 2023, 22, 221. [Google Scholar] [CrossRef]
  71. Milledge, J.J.; Nielsen, B.V.; Harvey, P.J. The Inhibition of Anaerobic Digestion by Model Phenolic Compounds Representative of Those from Sargassum Muticum. J. Appl. Phycol. 2019, 31, 779–786. [Google Scholar] [CrossRef]
  72. Ahmed, B.; Aboudi, K.; Tyagi, V.K.; álvarez-Gallego, C.J.; Fernández-Güelfo, L.A.; Romero-García, L.I.; Kazmi, A.A. Improvement of Anaerobic Digestion of Lignocellulosic Biomass by Hydrothermal Pretreatment. Appl. Sci. 2019, 9, 3853. [Google Scholar] [CrossRef]
  73. Barrios, J.A.; Cano, A.; Rivera, F.F.; Cisneros, M.E.; Durán, U. Efficiency of Integrated Electrooxidation and Anaerobic Digestion of Waste Activated Sludge. Biotechnol. Biofuels 2021, 14, 81. [Google Scholar] [CrossRef] [PubMed]
  74. Tang, B.; Yu, L.; Huang, S.; Luo, J.; Zhuo, Y. Energy Efficiency of Pre-Treating Excess Sewage Sludge with Microwave Irradiation. Bioresour. Technol. 2010, 101, 5092–5097. [Google Scholar] [CrossRef] [PubMed]
  75. Zieliński, M.; Kisielewska, M.; Dudek, M.; Rusanowska, P.; Nowicka, A.; Krzemieniewski, M.; Kazimierowicz, J.; Dębowski, M. Comparison of Microwave Thermohydrolysis and Liquid Hot Water Pretreatment of Energy Crop Sida Hermaphrodita for Enhanced Methane Production. Biomass Bioenergy 2019, 128, 105324. [Google Scholar] [CrossRef]
Figure 1. Organisational chart of the research carried out.
Energies 17 04207 g001
Figure 2. Schematic of the MW reactor used to carry out the thermohydrolysis of organic substrates prior to the anaerobic digestion process.
Energies 17 04207 g002
Figure 3. Specific yield of biogas and CH4 from fresh mass (FM); (a) and volatile solids (VS); (b) in subsequent experimental variants.
Energies 17 04207 g003
Figure 4. The course of specific biogas and CH4 production in S1.
Energies 17 04207 g004
Figure 5. The course of specific biogas and CH4 production in subsequent S2 variants: T10 (a), T20 (b), T30 (c).
Energies 17 04207 g005
Figure 6. The course of specific biogas and CH4 production in subsequent S3 variants: T20-0.05 HCl (a), T20-0.10 HCl (b), T20-0.20 HCl (c).
Energies 17 04207 g006
Figure 7. The course of specific biogas and CH4 production in subsequent S4 variants: T20-0.05 NaOH (a), T20-0.10 NaOH (b), T20-0.20 NaOH (c).
Energies 17 04207 g007
Figure 8. Correlations between the concentration of COD (a) and TOC (b) in the dissolved phase and the production of CH4 in S2–S4.
Energies 17 04207 g008
Table 1. Characteristics of the individual stages and experimental variants.
StageVariantMw Heating Time
[min]
HCl Dose
[g/gTS]
NaOH Dose
[g/gTS]
S1C---
S2T1010--
T2020--
T3030--
S3T20-0.05 HCl200.05-
T20-0.10 HCl200.10-
T20-0.20 HCl200.20-
S4T20-0.05 NaOH20-0.05
T20-0.10 NaOH20-0.10
T20-0.20 NaOH20-0.20
Table 2. Basic properties of the organic substrate and anaerobic sludge inoculum used in the experiments.
IndicatorFull NameUnitValue
SubstrateAnaerobic Sludge
TSTotal solidsmg/gFM (fresh mass)90 ± 1586 ± 12
VSVolatile solidsmg/gFM (fresh mass)78 ± 665 ± 4
Hydration-%91.0 ± 1.591.4 ± 1.2
CODsolDissolved Chemical Oxygen Demandg/L47.3 ± 1.241.8 ± 3.9
TOCsolDissolved Total Organic Carbong/L14.1 ± 0.8111.5 ± 0.91
TCsolDissolved Total Carbong/L15.2 ± 0.8413.7 ± 1.10
TNsolDissolved Total Nitrogeng/L3.78 ± 0.214.02 ± 0.51
SugarssolDissolved Sugarsg/L0.69 ± 0.120.12 ± 0.02
Table 3. Values of chemical indicators that indirectly characterise the effectiveness of the pretreatment process used.
ParameterUnitStage/Variant
S1S2S3S4
CT10T20T30T20-0.05 HClT20-0.10 HClT20-0.20 HClT20-0.05 NaOHT20-0.10 NaOHT20-0.20 NaOH
CODsolg/L47.3
±1.2
105
±2.6
104
±2.9
114
±2.1
107
±3.1
112
±2.8
109
±3.2
99
±2.5
115
±3.0
113
±3.2
TOCsolg/L14.1
±0.81
33.9
±0.92
37.3
±1.32
40.7
±1.25
38.1
±1.44
38.2
±1.41
39.1
±1.66
37.7
±1.53
36.4
±1.21
38.5
±1.09
TCsolg/L15.2
±0.84
35.1
±1.01
41.8
±1.25
38.0
±1.33
37.2
±1.14
39.3
±1.13
36.2
±1.24
39.6
±1.55
37.5
±1.18
38.9
±1.25
TNsolmg/L3.78
±0.21
3.82
±0.26
3.98
±0.23
3.70
±0.19
3.51
±0.22
3.40
±0.24
3.09
±0.16
3.81
±0.26
3.72
±0.24
3.48
±0.21
Sugarsolg/L0.69
±0.12
20.0
±0.85
23.6
±0.93
30.0
±0.87
18.9
±0.65
23.7
±0.74
30.2
±0.98
19.6
±0.54
19.8
±0.63
28.1
±0.66
COD
solubilization degree
%-23.48
±1.55
23.08
±1.42
27.13
±1.65
24.29
±1.32
26.32
±1.54
25.10
±1.61
21.05
±1.75
27.53
±1.72
26.72
±1.51
TOC
solubilization degree
%-20.06
±1.31
23.50
±1.36
26.91
±1.53
24.25
±1.37
24.33
±1.48
25.24
±1.66
23.88
±1.52
22.54
±1.48
24.68
±1.38
Table 4. Absolute amount of biogas and changes in CH4 concentrations in respirometric tests.
Time (Day)Biogas
L
%CH4
S1S2S3S4S1S2S3S4
CT10T20T30T20-0.05 HClT20-0.10 HClT20-0.20 HClT20-0.05 NaOHT20-0.10 NaOHT20-0.20 NaOHCT10T20T30T20-0.05 HClT20-0.10 HClT20-0.20 HClT20-0.05 NaOHT20-0.10 NaOHT20-0.20 NaOH
00.00
±0
0.00
±0
0.00
±0
0.00
±0
0.00
±0
0.00
±0
0.00
±0
0.00
±0
0.00
±0
0.00
±0
0.0
±0
0.0
±0
0.0
±0
0.0
±0
0.0
±0
0.0
±0
0.0
±0
0.0
±0
0.0
±0
0.0
±0
0.50.22
±0.01
0.25
±0.03
0.29
±0.02
0.30
±0.01
0.30
±0.01
0.38
±0.02
0.28
±0.02
0.27
±0.01
0.27
±0.01
0.31
±0.01
28.5
±4.0
30.5
±2.27
31.3
±1.20
30.6
±2.52
31.1
±2.15
31.1
±2.15
30.1
±1.87
30.2
±0.85
30.1
±1.15
30.1
±0.17
10.46
±0.02
0.45
±0.01
0.45
±0.01
0.45
±0.01
0.44
±0.02
0.49
±0.01
0.45
±0.04
0.42
±0.02
0.43
±0.02
0.44
±0.02
42.8
±1.58
43.8
±2.08
45.0
±0.57
44.0
±3.14
42.2
±1.73
42.2
±
43.1
±1.39
43.4
±1.16
44.6
±0.51
45.2
±1.10
20.74
±0.06
0.76
±0.01
0.77
±0.01
0.68
±0.01
0.68
±0.02
0.71
±0.02
0.64
±0.02
0.65
±0.01
0.68
±0.01
0.66
±0.02
50.8
±2.14
51.8
±2.47
51.2
±2.73
40.2
±0.91
49.9
±1.25
49.9
±1.25
48.3
±4.24
51.3
±1.03
51.1
±1.84
52.0
±2.25
30.98
±0.01
1.00
±0.02
1.02
±0.01
1.03
±0.03
0.96
±0.08
1.01
±0.03
0.94
±0.03
0.92
±0.02
0.97
±0.01
0.92
±0.02
53.2
±2.16
53.2
±1.42
52.8
±2.27
51.5
±1.25
52.5
±1.15
52.5
±1.15
52.6
±1.17
53.3
±1.15
53.8
±0.45
55.2
±1.21
41.15
±0.03
1.18
±0.04
1.22
±0.01
1.37
±0.06
1.27
±0.14
1.28
±0.03
1.18
±0.02
1.20
±0.02
1.31
±0.02
1.20
±0.01
54.3
±2.57
55.2
±2.38
55.2
±0.87
54.2
±1.25
53.9
±1.42
53.9
±1.42
53.7
±0.68
54.2
±1.01
55.0
±0.51
56.4
±0.72
51.34
±0.04
1.38
±0.06
1.46
±0.01
1.52
±0.04
1.48
±0.07
1.65
±0.03
1.45
±0.04
1.56
±0.11
1.61
±0.04
1.58
±0.04
57.1
±1.95
56.8
±1.44
56.4
±0.20
56.2
±0.85
55.5
±0.66
55.5
±0.66
55.7
±1.10
55.7
±0.21
56.1
±0.53
57.1
±1.64
101.54
±0.03
1.61
±0.08
1.73
±0.05
1.81
±0.01
1.62
±0.02
1.83
±0.04
2.23
±0.58
1.80
±0.02
1.86
±0.03
1.92
±0.04
58.7
±1.46
58.7
±1.80
59.0
±1.96
59.5
±1.97
58.2
±0.70
58.2
±0.70
57.4
±0.71
58.0
±1.07
58.4
±1.48
58.8
±0.75
151.70
±0.02
1.76
±0.02
1.82
±0.06
1.91
±0.01
1.71
±0.01
1.98
±0.02
2.48
±0.83
2.01
±0.04
1.99
±0.05
2.05
±0.02
62.4
±1.18
63.0
±0.66
62.9
±2.38
62.9
±1.80
62.3
±1.05
62.3
±1.05
61.5
±1.99
62.3
±2.50
63.3
±0.12
61.9
±0.96
201.75
± 0.01
1.79
±0.42
1.88
±0.05
1.96
±0.01
1.77
±0.01
2.05
±0.01
2.55
±0.84
2.06
±0.03
2.12
±0.03
2.11
±0.01
63.8
±0.62
64.2
±0.42
64.7
±2.06
64.5
±0.89
63.6
±0.21
65.1
±0.35
64.4
±1.10
65.4
±1.07
64.2
±0.60
64.4
±1.17
Table 5. Energy balance.
StageVariantAmount of CH4
[dm3/kgVS]
Amount of CH4
[dm3/kgFM]
FM of the Substrate Introduced into the MW Reactor
[kgFM]
Total CH4 Production from the Substrate Feed to the MW Reactor
[m3]
Energy Value CH4 [kWh/m3]The Gross Energy Output (EGout) [kWh/gVS]The Gross Energy Output (EGout) [kWh]Specific Energy Input (Es) [kWh]The Net Energy Output (ENout) [kWh]The Net Energy Gain (Enet) [kWh]
S1C43778-3.909.174.00 × 10−235.760.035.760
S2T1038481504.053.52 × 10−237.147.329.84−5.92
T20450874.354.12 × 10−239.897.532.39−3.37
T30453924.604.15 × 10−242.187.834.38−1.38
S3T20-0.05 HCl428944.703.92 × 10−243.017.535.51−0.25
T20-0.10 HCl470994.954.31 × 10−245.3937.892.13
T20-0.20 HCl525994.954.81 × 10−245.3937.892.13
S4T20-0.05 NaOH5421005.004.97 × 10−245.8538.352.59
T20-0.10 NaOH5391025.104.94 × 10−246.7739.273.51
T20-0.20 NaOH5411025.104.96 × 10−246.7739.273.51
Disclaimer/Publisher’s Note: The statements, opinions and data contained in all publications are solely those of the individual author(s) and contributor(s) and not of MDPI and/or the editor(s). MDPI and/or the editor(s) disclaim responsibility for any injury to people or property resulting from any ideas, methods, instructions or products referred to in the content.

