Abstract
In order to reduce the influence of environmental noise and different operating conditions on the accuracy of motor fault diagnosis, this paper proposes a capsule network method combining multi-channel signals and the efficient channel attention (ECA) mechanism, sampling the data from multiple sensors and visualizing the one-dimensional time-frequency domain as a two-dimensional symmetric dot pattern (SDP) image, then fusing the multi-channel image data and extracting the image using a capsule network combining the ECA attention mechanism features to match eight different fault types for fault classification. In order to guarantee the universality of the suggested model, data from Case Western Reserve University (CWRU) is used for validation. The suggested multi-channel signal fusion ECA attention capsule network (MSF-ECA-CapsNet) model fault identification accuracy may reach 99.21%, according to the experimental findings, which is higher than the traditional method. Meanwhile, the method of multi-sensor data fusion and the use of the ECA attention mechanism make the diagnosis accuracy much higher.
1. Introduction
Three-phase motors are commonly used in industrial production. Given the uncertainty of the motor’s working environment, it is inevitable that the motor will experience structural or performance faults such as bearing damage and phase loss during operation. Motor faults may not only lead to a production line shutdown, resulting in production interruption, but also trigger a local power outage, which has a great impact on production, life, and the national economy [1,2]. Quickly identifying the fault parts and responding accordingly can greatly save manpower and material resources, as well as improve the reliability and stability of power grid operation. Fault diagnosis is drawing more and more engineers’ attention. In-depth study of motor fault monitoring and diagnosis has very important practical significance in engineering and practice.
Vibration [3], current [4], electromagnetic [5], temperature [6], and acoustic signals [7] are widely used signals for fault monitoring. Vibration signals are often used for the diagnosis of mechanical faults, and magnetic field signals are often used to monitor whether misalignment occurs on the stator-rotor structure. Different faults have different characteristics in the signal, and the use of vibration, current, or electromagnetic signals can all represent the characteristics of fault signals and be used for fault classification. By analyzing the characteristics of the signals, motor fault states can be effectively classified. With the complexity of the motor environment and the large size of the system, the analysis of motor faults is not limited to a single signal. Data-driven fault diagnostic techniques are frequently employed in production, and multi-sensor data fusion techniques are a topic of much discussion. Feature fusion of signals captured by multiple sensors can fully extract the features of fault signals, thus improving the robustness, accuracy, and universality of fault detection. Xia [8] fused the operating conditions of the equipment through multiple sensors and automatically extracted the representative features from the original signals. Li [9] proposed a multi-layer deep fusion network with attention mechanism (AMMFN) model using the bearing fault data of Paderborn University and their own data, whose average accuracy is 98.72%. Gong [10] performed the diagnosis of mechanical faults by improving the technique of CNN and multi-channel data fusion.
Traditional methods such as wavelet transform (WT) [11], spectral analysis (SA) [12], fast fourier transform (FFT) [13], empirical mode decomposition (EMD) [14], and other time-frequency domain analysis methods are commonly used in signal processing. Although it can somewhat extract features with representative fault information and achieve fault diagnosis, due to the complexity of the motor operating environment, the signals received by the sensors under different working conditions are easily affected by the environmental noise, so the weak feature signals are easily covered by the interference signals [15]. Besides, the above methods rely on the manual extraction of the features, and the detection accuracy is greatly dependent on the staff’s personal experience. In recent years, the application of image processing to the analysis of fault diagnosis has been widely discussed. Zhu [16] converted the time-frequency domain vibration signals into a two-dimensional symmetric dot pattern (SDP) and used CNN for fault identification, whose SDP image can intuitively show the different vibration states of the motor with a diagnostic accuracy of 96.50%. Xu [17] used picture similarity matching to diagnose faults by gathering vibration signals from various operating states and creating SDP mode templates for those states. By matching the visual image with the fault type through the SDP method, the characteristic signal is transformed into a snowflake map with obvious differences in radius and angle, which is able to visualize the nonlinear, unstable signal characteristics.
With the increasing maturity of intelligent fault diagnosis techniques, algorithms such as convolutional neural networks [18] (CNN), extreme learning machines [19] (ELM), support vector machine (SVM) [20], deep belief networks [21] (DBN), and so on have been gradually used in the field of fault classification. Jegadeeshwaran [22] classified hydraulic brake defects using SVM and decision tree algorithms, allowing for brake condition monitoring and, to some extent, preserving passenger safety. Convolutional neural network is mainly based on shallow features for learning, through the convolution operation to extract local features in the image, but lacks representation and judgement of the positional relationship between structures. When the image is rotated or tilted, it will often be unable to be identified. Compared with convolutional neural network, Hinton [23] further proposed a capsule network (CapsNet) and an inter-capsule dynamic routing algorithm used to train the capsule network to improve the CNN, which is able to retain the coupling relationship between the internal elements of the data, which can effectively identify and differentiate the positional relationship of the image. It is more suitable for small samples, dealing with the overlapping of the object, and other complex scenarios. Numerous academics have expressed interest in the capsule network, which has been used in the fault diagnostic sector. Zhu [24] put forward an initial capsule network with initial blocks and regression branches for bearing fault diagnosis. He used bearing fault data from CWRU under a 1 HP (horse power) load and conducted experiments based on vibration signals, and the average accuracy of diagnosis is 97.15%. In order to diagnose faults in rotating equipment, Li [25] presented a capsule network with two convolutional layers and two pooling layers. This network performed exceptionally well in tests involving various rotating machines and defective components.
Due to CNN having the same weight for all feature extraction, high computing power, and resource consumption, combining the attention mechanism with a deep learning network and multi-channel data can adaptively learn the data features, dynamically focus on the input data, and adjust the weights to improve the generalization ability of the model. Wang [26] proposed a deep subdomain adaptive sub-attention network that obtains the feature maps of time-frequency domain signals through continuous wavelet transform and combines multi-channel data and channel attention mechanisms for feature extraction. With just a few parameters, Wang’s [27] Efficient Channel Attention (ECA) module significantly boosts CNN performance by implementing a non-dimensionality-reducing local cross-channel interaction technique through one-dimensional convolution. In a similar vein, adding the ECA mechanism to CapsNet can further strengthen the model’s capacity to learn and incorporate new features, as well as improve feature representation.
In the capsule network, the use of multi-channel sensor signals processed by the SDP methodology allows for a more adequate characterization of fault signals, and by introducing the ECA mechanism, key features in the input data can be more accurately identified and highlighted. Based on this, a capsule network approach that combines multi-channel signal and ECA attention mechanisms is proposed. The experiment is based on early diagnosis of faults, and the experimental motor will not stop running due to the presence of faults. By learning about abnormal conditions during motor operation, it can provide convenience for maintenance personnel and avoid power outages caused by faults. The main work is as follows:
(1) Adopt the SDP image method to visualize the sampled vibration signals on the time-frequency domain as a 2-D snowflake image, which intuitively shows the different fault types, classifies them, and matches them.
(2) Propose a multi-channel sensor signal fusion method to fully learn the characteristics of the original signal.
(3) Propose a method combining the ECA attention mechanism and a capsule network, which can effectively improve fault diagnosis accuracy.
2. Materials and Methods
2.1. SDP Method
The SDP method [17] maps time-domain signals to scatter points in polar coordinate space, uses mirror symmetry to create a snowflake diagram, and converts 1-D signals into 2-D pictures, which can reflect the differences in different time series. The SDP method normalizes 1-D signals and converts them into polar coordinate form. The principle of SDP method is shown in Figure 1.
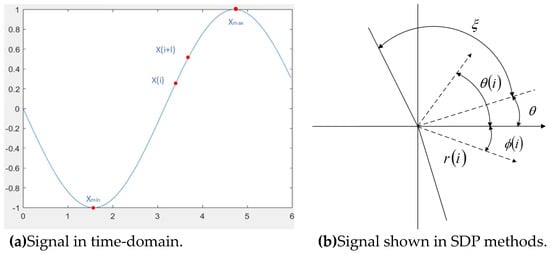
Figure 1.
The principle of SDP method.
The formula for calculating scatter coordinates is as follows:
where the polar radius, clockwise angle along the polar plane, and counterclockwise angle along the polar plane are, respectively, represented by the values , , and . The maximum and lowest amplitudes of the signal are denoted by and , respectively. The signal’s ith sample point is denoted by . The parameter for the time interval is l. The mirror plane of symmetry rotates at an angle of . is the factor of angular amplification.
In order to make SDP images contain more multidimensional information, the following formula is used for multi-dimensional information fusion, and Figure 2 shows the fusion diagram of vibration signal:
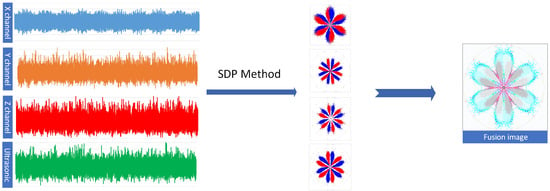
Figure 2.
Fusion of vibration signal.
2.2. ECA Mechanism
ECA improves feature representation by introducing channel attention mechanisms in convolutional operations to capture the relationships between different channels [27]. Adaptively adjusting the weights of channel characteristics is crucial to the channel attention mechanism because it helps the network better focus on significant features and suppress irrelevant ones. Figure 3 illustrates the principle of ECA:
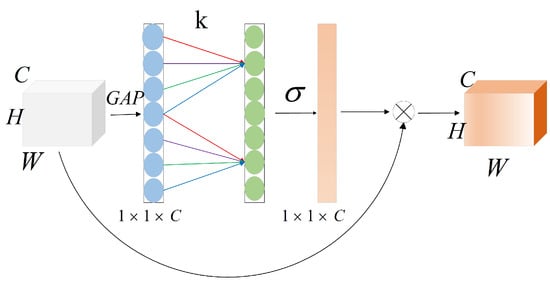
Figure 3.
Model of ECA mechanism. H is the height, W is the width, and C is the number of channels.
Where and b are hyperparameters and is the sigmoid function. The input feature mapping is transformed from a matrix [H, W, C] to a vector [1, 1, C] through a global average pooling (GAP) operation. The adaptive 1-D convolution kernel size K is obtained by the equation. It is utilized to determine the weights for each feature map channel in the 1-D convolution. To create the weighted feature map, the sigmoid function multiplies each channel weight of the feature layer by the original input feature map, channel by channel.
For aggregated features without dimensionality reduction, capture local cross channel interaction is achieved through fast 1D convolution with kernel size , where refers to convolution:
Among them, the size of is proportional to the channel dimension , and there is a mapping between and , denoted as :
If an exponential function with a base of 2 is used to represent the nonlinear mapping relationship, that is:
Based on this, the size of the kernel can be adaptively determined by the following formula:
2.3. Capsule Network
Unlike a convolutional neural network, a capsule network can express the relationships between substructures and make corresponding adjustments based on changes in image content. The input and output of CapsNet are both vectors. CNN shares the weights, and iterative dynamic routing algorithms decide the values of the capsules. The process of obtaining feature values for capsules is essentially convolution, but only when a series of low-level capsules that meet the conditions are sequentially arranged will the high-level capsules be activated. Traditional CNN is made up of three parts: convolutional layers, pooling layers, and fully connected layers. However, the maximum pooling layer of CNN will make neurons selectively focus on the most active neurons in the previous layer’s local pool while ignoring the effects of other neurons, meaning that only the most important information will be extracted. Hinton’s proposed capsule network, including an intercapsule dynamic routing method, iteratively updates the weights of capsules by comparing the similarity of capsules at different levels, effectively solving the shortcomings of the maximum pooling layer. The framework is illustrated in Figure 4.
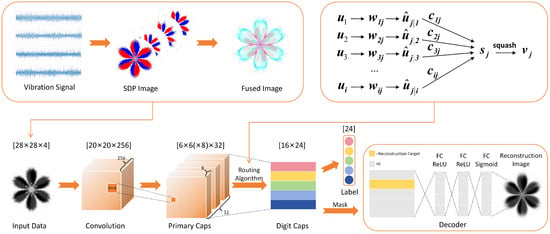
Figure 4.
The structure of Capsnet.
Using dynamic routing, we repeatedly determine the coupling coefficient in the capsule to determine the output. Procedure 1 displays the dynamic routing algorithm’s pseudocode. Input vector is the feature vector of the bottom capsule, and is the weight of the bottom capsule about the top capsule. The bottom capsule is predicted based on the read features. And if it matches a top capsule that has features similar to the prediction result, it can be considered a possible representative of the content of that top capsule. The weight matrix determines which high-level capsule the content of the bottom capsule will be sent to through the inter-capsule dynamic routing algorithm.
| Algorithm 1 Routing algorithm |
|
Matrix multiplication is performed on each input vector with the weight matrix to generate new prediction vectors .
Taking the first layer as an example, the temporary variable has an initial value of 0, which is transformed into a non-zero weight after the softmax function, and sums to 1. Repeat the above operation for layers 2 to n to obtain the routing coefficient matrix . The initial value of is 0.5, and the formula for the computation of is as follows:
The prediction vector and the routing coefficients are matrix multiplied, weighted, and summed to obtain the intermediate vector :
The capsule network compresses the intermediate vector between [0, 1] to obtain the normalized prediction vector through a nonlinear activation function (squash function) that performs nonlinear operations without changing the direction. The intermediate vector is defined as
The input vector is inner product with the high-level prediction vector to find the similarity between the high-level capsule and the input vector and is added with the temporary variable to get the new temporary variable , which achieves the updating of the weights:
The predicted high-level capsule prediction vector’s output after r iterations.
2.4. Fault Diagnosis Method
In this section, a motor fault diagnosis method based on the multi-channel signal fusion ECA attention capsule network (MSF-ECA-CapsNet) architecture and its framework are listed in Figure 5. The experiment is proposed with the following steps:
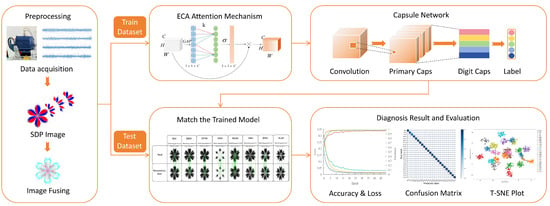
Figure 5.
Framework of MSF-ECA-CapsNet.
Step 1: Collect the original 1-D vibration signals under different operating conditions when the motor undergoes seven faults and normal modes.
Step 2: Convert the 1-D feature signals into 2-D snowflake diagrams using the SDP algorithm.
Step 3: Import the SDP-processed image, normalize and grayscale it, squash it with 28 × 28 pixels, and fuse the four-channel SDP image data to get a 4 × 28 × 28 tensor.
Step 4: Split the dataset in an 8:2 ratio across the training and test datasets, then feed the 4 × 28 × 28 tensor to the capsule network. The inter-channel information interaction is completed, the weights are continually updated, and the optimum training model corresponding to the 24 optimal training models representing the 3 × 8 fault states is generated using the ECANet channel attention mechanism.
Step 5: Utilizing the test dataset, evaluate the trained model, and provide the test accuracy.
2.5. Experiments
As seen in Figure 6, the PT600 motor current analysis test bench produced by VALENIAN in Suzhou, China, is used to gather vibration data in order to verify the experiment’s validity. The proposed method is not limited to faults related to motor vibration modes, nor is it limited to vibration signals. A current signal can also reflect fault type, but its accuracy is not as good as a vibration signal. Therefore, a vibration signal is selected as the research object. The experimental platform is made up of a motor, a vibration sensor, a balancing disk, a planet gear, a magnetic powder brake, a sensor adapter, and a data collection device. The three-phase induction motor’s specifications are displayed in Table 1. Table 2 displays the technical details of the vibration sensor, which uses the triaxial piezoelectric acceleration sensor CT1002L produced by CHENGTEC in Shanghai, China.
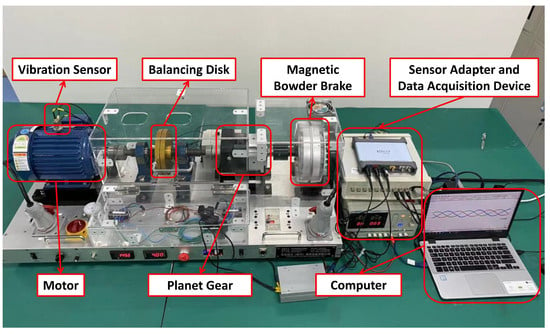
Figure 6.
PT600 motor current analysis test bench.

Table 1.
Parameters of Motor.

Table 2.
Vibration sensor parameters.
The experiment is set up with eight different fault states, which are normal motor (NM), broken bar motor (BBM), winding fault motor (WFM), single phase motor (SPM), rotor misalignment motor (RMM), fault bearing motor (FBM), bow rotor motor (BRM), and rotor unbalanced motor (RUM). All the fault types are listed in Figure 7. The experimental faults are set up as follows. BBM creates a rotor broken bar fault by removing 4 of the 28 rotor bars and adding a compensating mass to compensate for the unbalanced mass distribution due to the lack of rotor bars. WFM simulates a short-circuit fault in the winding by drawing out one of the coils in the stator winding and connecting a switch on the coil line. SPM simulates a single-phase operation by means of a switch mounted on the power plug. RMM faults are controlled by jack bolts mounted on the left and right sides of the end cap, and horizontal misalignment is introduced by turning the front jack bolts one turn and locking the rear jack bolts, then moving the bearings about 0.5 mm. FBM simulates faults by removing a good bearing from both ends of the motor, with the inner bearing assembled to an inner-ring fault and the outer bearing assembled to an outer-ring fault. BRM uses a special bent rotor, but the tests must also use a diaphragm-type coupling because the shaft will oscillate during operation and make the shaft misaligned. RUM installs unbalanced mass rotors on the inside (coupling side) and outside (lower half) of the motor.
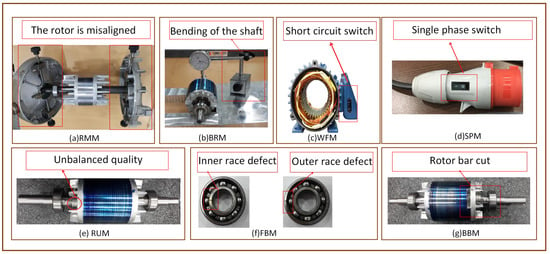
Figure 7.
Types of fault motor.
The motor is subjected to experiments on 8 fault types in three states: no load, half load, and full load; a total of 24 fault signals are obtained. In the 24 experiments, each experiment was conducted under the same load state, and there was no situation of variable load operation. One million data points are collected in the periodic time domain signals for each case with a sampling frequency of 200 kHz, and the experiment is repeated five times for sampling. Each fault type contains 500 samples with 80% and 20% of the training and test datasets, respectively. The datasets are categorized as shown in Table 3.

Table 3.
Data classification and labeling.
3. Results
All experiments were conducted on a 13th Gen Intel (R) Core (TM) i9-13900KF (32 CPUs) processor with 64 GB of memory. The graphics card model is NVIDIA GeForce RTX 4090. Each experiment is iterated for 50 epochs. Five full training and testing sessions were conducted under identical conditions in order to confirm that the model results were not random. The average accuracy of the five trials was then used as the experimental result. Experiments on multi-channel and single-channel data, CapsNet, and other networks, with and without the attention mechanism, were carried out in the comparison studies. To further confirm the model’s universality, more bearing fault data from CWRU is added to the vibration dataset. These tests are repeated in parallel. Table 4 and Table 5 display the defect diagnosis model experiments’ accuracy across various datasets and techniques.

Table 4.
Fault identification accuracy of Vibration dataset.

Table 5.
Fault identification accuracy of CWRU dataset.
3.1. SDP Images
In this method, the vibration data of the motor were used to analyze eight different motor fault states at 1500 r/min. The x, y, z, and ultrasonic channel signals of the vibration data are the 1-D time-domain signals that are captured and transformed into bit SDP pictures. Figure 8 shows the fused images of the four channels of vibration data under different motor states, and it can be seen that the SDP images corresponding to the vibration signals of the x, y, and z channels have obvious differences. For example, in the case of the RMM, the SDP image of the x channel is a hexagonal symmetric image, and the SDP images of the y, z, and ultrasonic channels have more white space compared to the x channel; the characteristics of the y and z channels are still evident in the fuzed images. The fused images clearly retain the features of the y and z channels. Characteristics of SDP pictures in various fault situations of the motor are more obvious, and under the same fault state and different load conditions, the change in SDP images is small, which indicates that the SDP method is robust.
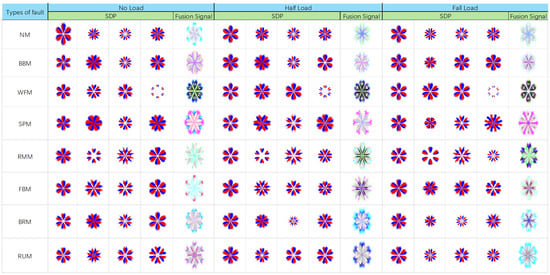
Figure 8.
Typical images under different fault states.
3.2. Reconstruction of Capsule Network
The capsule network’s image reconstruction is based on dynamic routing and feature extraction. Firstly, the input image is feature extracted by a convolutional layer, then it is converted into a high-level feature vector by the dynamic routing algorithm, and a vector is selected to be put into the reconstruction network (a fully connected network) to reconstruct the input image. Figure 9 shows the original input image with its corresponding reconstructed image for different motor states under no-load conditions, using scale-invariant feature extraction method. Their matching points show that each fault state’s features are more pronounced after reconstruction and that the reconstructed image still has the majority of the original image’s features.
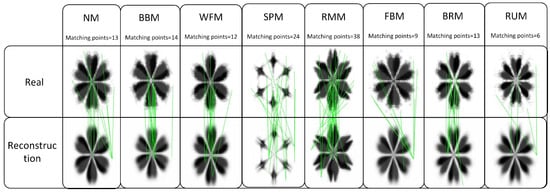
Figure 9.
Matching points between real images and reconstruction images in 0HP.
4. Discussion
4.1. Comparison between Multi-Sensor Data Fusion and Single Channel Data
To confirm the impact of multi-sensor fusion data on the accuracy of fault classification, CNN, AlexNet, LSTM, LENET, and other networks were introduced, using multi-channel data and single-channel data as input datasets, respectively. The multi-channel data were prefixed with “MSF-” to distinguish the experiments under multi-channel and single-channel conditions. By comparing the effect of each channel of data on the accuracy of the experiment, the Y-axis direction is the most effective, so the Y-axis data is used as the single-channel data input.
For the proposed model, three sets of experiments were conducted to quantitatively compare the impact of the ECA attention mechanism and multi-channel data fusion on detection accuracy: the multi-channel signal fusion capsule network with ECA attention mechanism (MSF-ECACaps), the multi-channel signal fusion capsule network(MSF-Caps), and the single-channel capsule network (Caps).
Table 4 and Table 5 show that diagnostic accuracy is much higher than single-channel data when data fused from multiple channels of data is used as input, and that recognition accuracy is higher with an attention mechanism than without. That means both the method of multi-channel data fusion and the attention mechanism are able to more accurately detect the fault state of the motor.
Figure 10 displays the accuracy and loss curves for each training period for the model, allowing for an analysis of its performance. On average, each epoch requires 108 s of iteration. The model proposed in this paper can relatively converge after the 12th epoch, reaching a steady state earlier than traditional Capsule Networks. The experiment, with a total sample size of 12,000 and a batch size of 24, also shows a significantly faster convergence speed of the loss curve than traditional capsule networks. This suggests that under data fusion, the ECA Capsule Network suggested in this paper has a notable improvement in network performance.
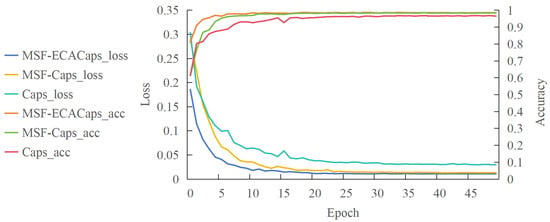
Figure 10.
Comparison of accuracy and loss between MSF-ECACaps, MSF-Caps, and Caps.
4.2. Comparison of CapsNet and Different Methods
The fused data was examined in other networks to confirm the model network’s superiority in fault diagnosis. Figure 11 demonstrates that, out of all the comparable trials, MSF-ECACaps has the highest fault recognition accuracy, and that accuracy following data fusion is higher than accuracy following unfused data. Compared to MSF-CNN, MSF-LENET, MSF-AlexNet, and MSF-LSTM, the average accuracy of fault identification has been improved by 1.62%, 3.63%, 1.44%, and 2.78%, respectively, indicating the superior performance of MSF-ECACaps in fault diagnosis. The evaluation metrics of the model, besides accuracy, precision, recall, and F1 score, would provide a more comprehensive evaluation. Accuracy refers to the ratio of correctly classified samples to the total number of samples; precision refers to the proportion of correctly predicted positive results; recall refers to the proportion of correctly judged positive samples; and the F1 score is the harmonic mean of precision and recall. Figure 12 shows the precision, recall, and F1 scores of vibration datasets. We can draw the same conclusion: MSF-ECACaps has the best performance. Compared with Zhu’s [24] Capsule network based on the CWRU dataset, MSF-ECACaps has achieved a 2.06% improvement in accuracy compared to its 97.15% accuracy. Compared with the AMMFN model proposed by Li [9], the accuracy of fault diagnosis has increased from 98.72% to 99.21%, which also reflects the superior performance of MSF-ECACaps.
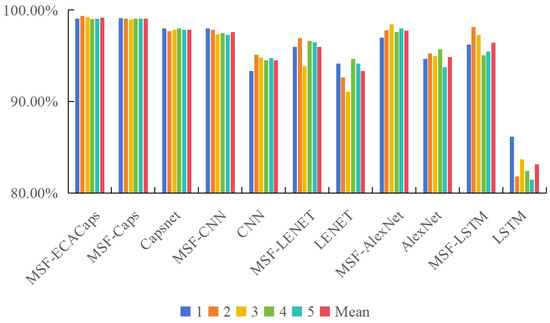
Figure 11.
Accuracy of vibration dataset.
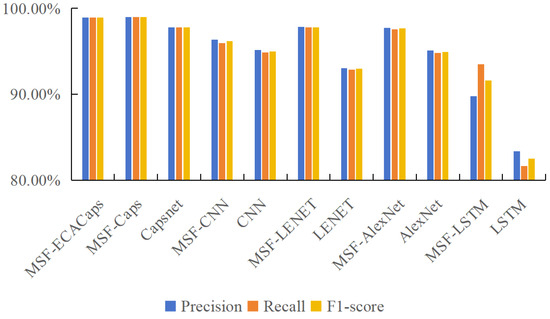
Figure 12.
Precision, Recall, and F1-score of vibration dataset.
By visualizing the experimental results using the t-SNE method, it can be seen in Figure 13 that MSF-ECACaps have the best discrimination effect on fault types, with the most obvious differentiation between different fault types.
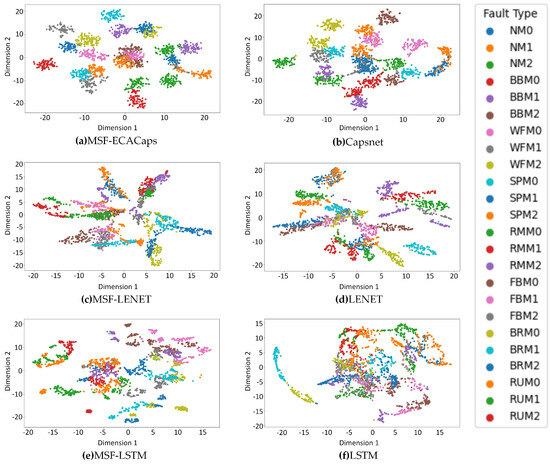
Figure 13.
Feature distribution visualization of 6 typical methods.
A 24 × 24 confusion matrix corresponding to different motor fault states is drawn from the test dataset, and the vertical and horizontal axes of the matrix represent the true motor state labels and predicted motor state labels, respectively. If the labels representing the predicted and real distributions are distributed on the diagonal, it means that the predicted labels and the real labels match. The more the matrix elements are concentrated on the diagonal, and the more the elements on the diagonal and the darker the colors are, the better the model effect is. Figure 14 illustrates that MSF-ECACapsNet, the model suggested in this work, performs better than MSF Caps, Capsnet, and other methods.
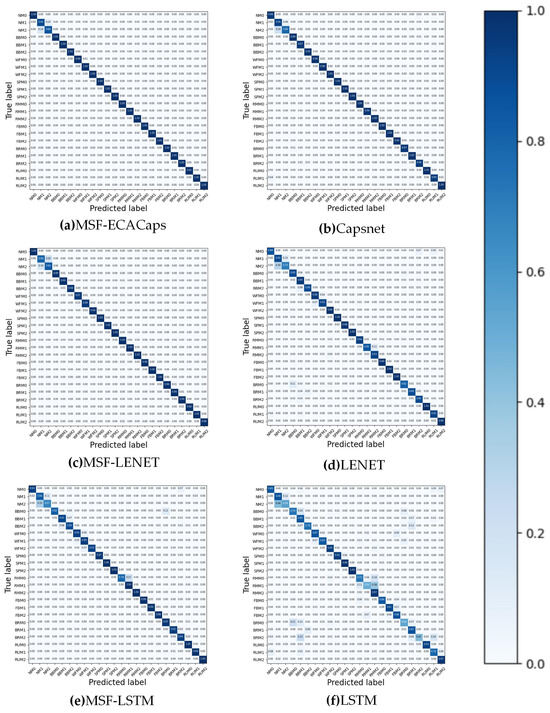
Figure 14.
Confusion matrix of 6 typical methods.
4.3. Western Reserve University Dataset Validation
The data from Case Western Reserve University (CWRU) were utilized as a comparison dataset to confirm the model’s generalizability. In Figure 15, the CWRU test stand is shown. As the dataset for the comparison tests, we used 12 k Drive End Bearing Fault Data with fault diameters of 0.007 mm, 0.014 mm, and 0.021 mm under 1 HP and fault types of Inner Race Fault, Ball Fault, and Outer Race Fault. Here, the bearing fault’s magnitude and severity are indicated by the fault diameter.
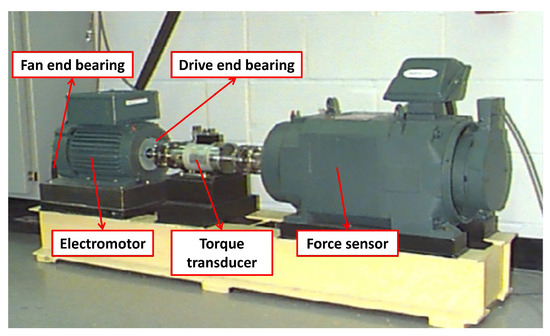
Figure 15.
Test stand of CWRU.
122,136 data points are collected in the time domain for each case with a sampling frequency of 12 kHz. Three sensors provide the data: the BA-base accelerometer, the FE-fan end accelerometer, and the DE-drive end accelerometer. The experiment set up 9 working conditions and its corresponding labels are listed in Table 6.

Table 6.
Corresponding labels for CWRU dataset.
The average accuracy of fault recognition using the Western Reserve University dataset for experiments is 88.89%. Among them, 82.07% is the diagnostic accuracy of single channel data, and 94.57% is the accuracy after fusion. The identification accuracy of multi-channel signals following data fusion is noticeably higher than that of single-channel signals, as Figure 16 illustrates. This suggests that data fusion plays a beneficial role in raising fault recognition accuracy.
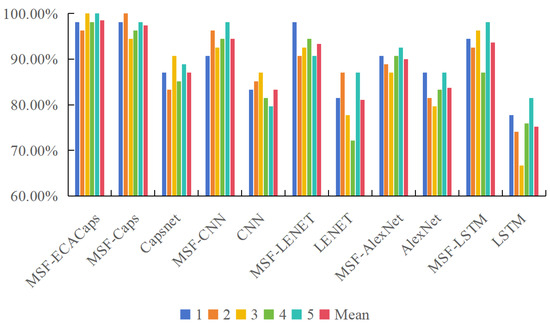
Figure 16.
Accuracy of CWRU dataset.
Due to the fact that SDP images are generated based on the frequency and amplitude of signals for different experimental conditions, SDP images drawn based on signals with similar frequencies and amplitudes are similar and can be recognized by the model as having the same type of fault. Therefore, the model proposed in the experiment has certain generalizability.
5. Conclusions
A capsule network model based on the ECA channel attention mechanism and multi-sensor data fusion is proposed for identifying eight types of motor faults, such as broken bar motor. The model learns SDP images, filters image features through a dynamic routing algorithm, constantly and dynamically attends to the input data, and adjusts the weights of the model. The function of fault classification is achieved by matching the input signals with the fault templates learned by the model. Through the above operations, the method proposed in this article can be extended and applied to the fault diagnosis of any three-phase motor.
The experimental results show that:
(1) The SDP method creates a 2-D picture from the 1-D vibration signal, allowing for the visualization of nonlinear, unstable signal characteristics and a reduction in the impact of ambient noise on signal extraction.
(2) By improving the model’s feature extraction capabilities, the suggested feature extraction method—which is based on the ECA attention mechanism and the multi-sensor data fusion strategy—can successfully raise the accuracy of fault classification.
(3) The capsule network outperforms CNN, ALEXNET, LENET, LSTM, and other networks in fault identification accuracy, reaching 99.21%. Additionally, the capsule network uses less data, resulting in higher fault diagnostic accuracy and efficiency.
Author Contributions
Conceptualization, Z.M. and Z.L.; methodology, Z.M. and Z.L.; software, W.F.; validation, L.D. and X.Z.; formal analysis, W.F.; investigation, Z.M. and Z.L.; resources, G.W. and L.X.; data curation, X.Z.; writing—original draft preparation, Z.M. and W.F.; writing—review and editing, Z.M. and L.X.; visualization, L.D.; supervision, G.W.; project administration, Z.L.; funding acquisition, Z.L. and G.W. All authors have read and agreed to the published version of the manuscript.
Funding
This research was funded by the General Project of Hunan Provincial Department of Education, grant number 22C0138, and by the Hunan Provincial Natural Science Excellent Youth Fund Project, grant number 2024JJ4001.
Data Availability Statement
The data presented in this study are available on request from the corresponding author. The data are not publicly available due to privacy restrictions.
Acknowledgments
The authors would like to express their gratitude to all those who helped them during the writing of this paper. The authors would like to thank the reviewers for their valuable comments and suggestions.
Conflicts of Interest
The authors declare no conflicts of interest.
References
- Jiang, H.; Li, C.; Li, H. An improved EEMD with multiwavelet packet for rotating machinery multi-fault diagnosis. Mech. Syst. Signal Process. 2013, 36, 225–239. [Google Scholar] [CrossRef]
- Sun, C.; Zhang, Z.; He, Z.; Shen, Z.; Chen, B. Manifold learning-based subspace distance for machinery damage assessment. Mech. Syst. Signal Process. 2016, 70, 637–649. [Google Scholar] [CrossRef]
- Tang, H.; Lu, S.; Qian, G.; Ding, J.; Liu, Y.; Wang, Q. IoT-based signal enhancement and compression method for efficient motor bearing fault diagnosis. IEEE Sensors J. 2020, 21, 1820–1828. [Google Scholar] [CrossRef]
- Hoang, D.T.; Kang, H.J. A motor current signal-based bearing fault diagnosis using deep learning and information fusion. IEEE Trans. Instrum. Meas. 2019, 69, 3325–3333. [Google Scholar] [CrossRef]
- Minervini, M.; Mognaschi, M.E.; Di Barba, P.; Frosini, L. Convolutional neural networks for automated rolling bearing diagnostics in induction motors based on electromagnetic signals. Appl. Sci. 2021, 11, 7878. [Google Scholar] [CrossRef]
- Meiwei, Z.; Weili, L.; Haoyue, T. Demagnetization fault diagnosis of the permanent magnet motor for electric vehicles based on temperature characteristic quantity. IEEE Trans. Transp. Electrif. 2022, 9, 759–770. [Google Scholar] [CrossRef]
- Glowacz, A.; Glowacz, W.; Glowacz, Z.; Kozik, J. Early fault diagnosis of bearing and stator faults of the single-phase induction motor using acoustic signals. Measurement 2018, 113, 1–9. [Google Scholar] [CrossRef]
- Xia, M.; Li, T.; Xu, L.; Liu, L.; De Silva, C.W. Fault diagnosis for rotating machinery using multiple sensors and convolutional neural networks. IEEE/ASME Trans. Mechatronics 2017, 23, 101–110. [Google Scholar] [CrossRef]
- Li, X.; Wan, S.; Liu, S.; Zhang, Y.; Hong, J.; Wang, D. Bearing fault diagnosis method based on attention mechanism and multilayer fusion network. ISA Trans. 2022, 128, 550–564. [Google Scholar] [CrossRef]
- Gong, W.; Chen, H.; Zhang, Z.; Zhang, M.; Wang, R.; Guan, C.; Wang, Q. A novel deep learning method for intelligent fault diagnosis of rotating machinery based on improved CNN-SVM and multichannel data fusion. Sensors 2019, 19, 1693. [Google Scholar] [CrossRef]
- Shao, S.; Yan, R.; Lu, Y.; Wang, P.; Gao, R.X. DCNN-based multi-signal induction motor fault diagnosis. IEEE Trans. Instrum. Meas. 2019, 69, 2658–2669. [Google Scholar] [CrossRef]
- Ciabattoni, L.; Ferracuti, F.; Freddi, A.; Monteriu, A. Statistical spectral analysis for fault diagnosis of rotating machines. IEEE Trans. Ind. Electron. 2017, 65, 4301–4310. [Google Scholar] [CrossRef]
- Sun, L.; Xu, B. An improved method for discerning broken rotor bar fault and load oscillation in induction motors. Energies 2018, 11, 3130. [Google Scholar] [CrossRef]
- Zhao, H.; Zuo, S.; Hou, M.; Liu, W.; Yu, L.; Yang, X.; Deng, W. A novel adaptive signal processing method based on enhanced empirical wavelet transform technology. Sensors 2018, 18, 3323. [Google Scholar] [CrossRef] [PubMed]
- Shao, H.; Jiang, H.; Lin, Y.; Li, X. A novel method for intelligent fault diagnosis of rolling bearings using ensemble deep auto-encoders. Mech. Syst. Signal Process. 2018, 102, 278–297. [Google Scholar] [CrossRef]
- Zhu, X.; Hou, D.; Zhou, P.; Han, Z.; Yuan, Y.; Zhou, W.; Yin, Q. Rotor fault diagnosis using a convolutional neural network with symmetrized dot pattern images. Measurement 2019, 138, 526–535. [Google Scholar] [CrossRef]
- Xu, X.; Liu, H.; Zhu, H.; Wang, S. Fan fault diagnosis based on symmetrized dot pattern analysis and image matching. J. Sound Vib. 2016, 374, 297–311. [Google Scholar] [CrossRef]
- Rawat, W.; Wang, Z. Deep convolutional neural networks for image classification: A comprehensive review. Neural Comput. 2017, 29, 2352–2449. [Google Scholar] [CrossRef] [PubMed]
- Gou, B.; Xu, Y.; Xia, Y.; Wilson, G.; Liu, S. An intelligent time-adaptive data-driven method for sensor fault diagnosis in induction motor drive system. IEEE Trans. Ind. Electron. 2018, 66, 9817–9827. [Google Scholar] [CrossRef]
- Yao, G.; Pang, S.; Ying, T.; Benbouzid, M.; Ait-Ahmed, M.; Benkhoris, M.F. VPSO-SVM-based open-circuit faults diagnosis of five-phase marine current generator sets. Energies 2020, 13, 6004. [Google Scholar] [CrossRef]
- Hinton, G.E.; Osindero, S.; Teh, Y.W. A fast learning algorithm for deep belief nets. Neural Comput. 2006, 18, 1527–1554. [Google Scholar] [CrossRef] [PubMed]
- Jegadeeshwaran, R.; Sugumaran, V. Fault diagnosis of automobile hydraulic brake system using statistical features and support vector machines. Mech. Syst. Signal Process. 2015, 52, 436–446. [Google Scholar] [CrossRef]
- Sabour, S.; Frosst, N.; Hinton, G.E. Dynamic routing between capsules. Adv. Neural Inf. Process. Syst. 2017, 30, 3856–3866. [Google Scholar]
- Zhu, Z.; Peng, G.; Chen, Y.; Gao, H. A convolutional neural network based on a capsule network with strong generalization for bearing fault diagnosis. Neurocomputing 2019, 323, 62–75. [Google Scholar] [CrossRef]
- Li, D.; Zhang, M.; Kang, T.; Li, B.; Xiang, H.; Wang, K.; Pei, Z.; Tang, X.; Wang, P. Fault diagnosis of rotating machinery based on dual convolutional-capsule network (DC-CN). Measurement 2022, 187, 110258. [Google Scholar] [CrossRef]
- Wang, H.; Pu, L. Bearing Fault Diagnosis of Split Attention Network Based on Deep Subdomain Adaptation. Appl. Sci. 2022, 12, 12762. [Google Scholar] [CrossRef]
- Wang, Q.; Wu, B.; Zhu, P.; Li, P.; Zuo, W.; Hu, Q. ECA-Net: Efficient channel attention for deep convolutional neural networks. In Proceedings of the IEEE/CVF Conference on Computer Vision and Pattern Recognition, Seattle, WA, USA, 13–19 June 2020; pp. 11534–11542. [Google Scholar]
Disclaimer/Publisher’s Note: The statements, opinions and data contained in all publications are solely those of the individual author(s) and contributor(s) and not of MDPI and/or the editor(s). MDPI and/or the editor(s) disclaim responsibility for any injury to people or property resulting from any ideas, methods, instructions or products referred to in the content. |
© 2024 by the authors. Licensee MDPI, Basel, Switzerland. This article is an open access article distributed under the terms and conditions of the Creative Commons Attribution (CC BY) license (https://creativecommons.org/licenses/by/4.0/).