Abstract
In response to the fracturing disturbance problem in the Mahu 18 block, based on the production data of on-site fracturing disturbance well groups, the actual fracturing disturbance cases in the block were first statistically divided. The complex fracturing disturbance situation in the block was divided according to the relationship between the number of fracturing wells and the number of production wells. Then, the disturbance types were classified based on the production dynamic response characteristics of the disturbed wells, and the degree of disturbance was quantitatively evaluated for the different types. The results indicate two main types of fracturing interference in the Mahu 18 block: the fracture communication type, and the pressure wave interference type formed through inter-well connectivity through the reservoir matrix. The fracturing disturbance dominated by fracture communication can cause serious water channeling to the production well through the direct connection of inter-well fractures, leading to a surge in water production. This type of fracturing disturbance often has a severe negative impact on the production well. In addition, the pressure and production (water production, liquid production, oil production) in the production dynamic response characteristics of disturbed wells during fracturing disturbance were used as evaluation indicators to quantify the impact of different types of fracturing disturbance from multiple perspectives.
1. Introduction
Long horizontal wells combined with large-area volumetric fracture network fracturing technology are the most economical and effective means to develop tight reservoirs. This method forms a large-scale complex fracture network in the reservoir, and the contact area between hydraulic fractures and the reservoir matrix is increased to realize efficient development of oil and gas resources [1]. Volumetric fracturing mainly refers to segmented multi-cluster fracturing technology, which changes the original stress field between fractures through multi-stage and multi-cluster perforation fracturing together and causes fractures to turn under stress interference, thus forming a complex fracture network [2]. However, with the large-scale development of horizontal well networks in increasingly tight oil and gas reservoirs, well network deployment is becoming more and more dense. The hydraulic fracture is easy to communicate, leading to the increased risk of cross-well flow. The phenomenon of fracturing interference to adjacent production wells in large-scale hydraulic fracturing is increasing. Fracturing disturbance mainly manifests as abnormal changes in wellhead pressure and the daily fluid volume of production wells, and even abnormal production of wells, such as flooding, mud backflow, or sand production, which ultimately affects overall productivity [3].
Regarding qualitative analysis, Sardinha et al. [4] believe that in the closed well state, fracturing disturbance during the fracturing process of a new well can be identified by monitoring the pressure of the mother well. Molina [5] established a pressure transient analysis model for evaluating the impact of hydraulic fracturing in stress-sensitive multi-fracture systems. Al-RBeawi [6] analyzed the pressure derivative curves generated by the model and described how the production interference caused by hydraulic fracturing impacts unconventional and conventional reservoirs. Feng et al. [7] suggested that the linear flow state of fractures can be determined based on the relationship between pressure and cumulative production, and the types of hydraulic fracturing disturbances can be distinguished accordingly. In terms of quantitatively evaluating the impact of fracturing disturbance, Agarwal et al. [8] demonstrated through case studies how to extract different information using boundary-dominated flow periods for evaluating fracturing disturbance. Ajani et al. [9] proposed a quantitative disturbance identification method based on production capacity impact when studying inter-well disturbance in the Woodford shale gas field, quantifying the production loss in the Arkoma Basin. Liu [3] improved the Ajani method to analyze the production performance and fracturing data of production wells in the Fuling shale gas field over five years from 2013. Kurtoglu et al. [10] believe that using decline curve analysis (DCA) to conduct a production review of production wells can confirm reservoir properties and productivity changes. Moreover, it has been demonstrated that the decline curve analysis can be used to determine the impact of fracturing operations on the estimated final recovery rate (EUR). Taghavinejad et al. [11] point out that rate transient analysis (RTA) is an effective method for quantifying the impact of adjacent well fracturing disturbance and can reveal changes in reservoir properties, such as modified volume and oil well productivity.
However, there has been no in-depth research on the classification and quantification of complex fracturing disturbance between multiple horizontal wells, and qualitative analysis and quantitative evaluation have yet to form a comprehensive evaluation method. Since the implementation of horizontal well volume fracturing in the Mahu block in 2017, due to factors such as small well spacing, large renovation scale, multiple cluster fracturing within the section, poor interlayer conditions, and reduced formation pressure in adjacent wells, hydraulic fracturing has caused widespread production disturbance and seriously affected production efficiency. Taking the Mahu 18 block as an example, based on on-site fracturing construction and adjacent well production data, this article first qualitatively analyzes the fracturing disturbance events. Subsequently, an identification model was established to quantitatively evaluate the degree of impact of the fracturing disturbance.
2. Overview of Fracturing Disturbance in the Mahu 18 Block
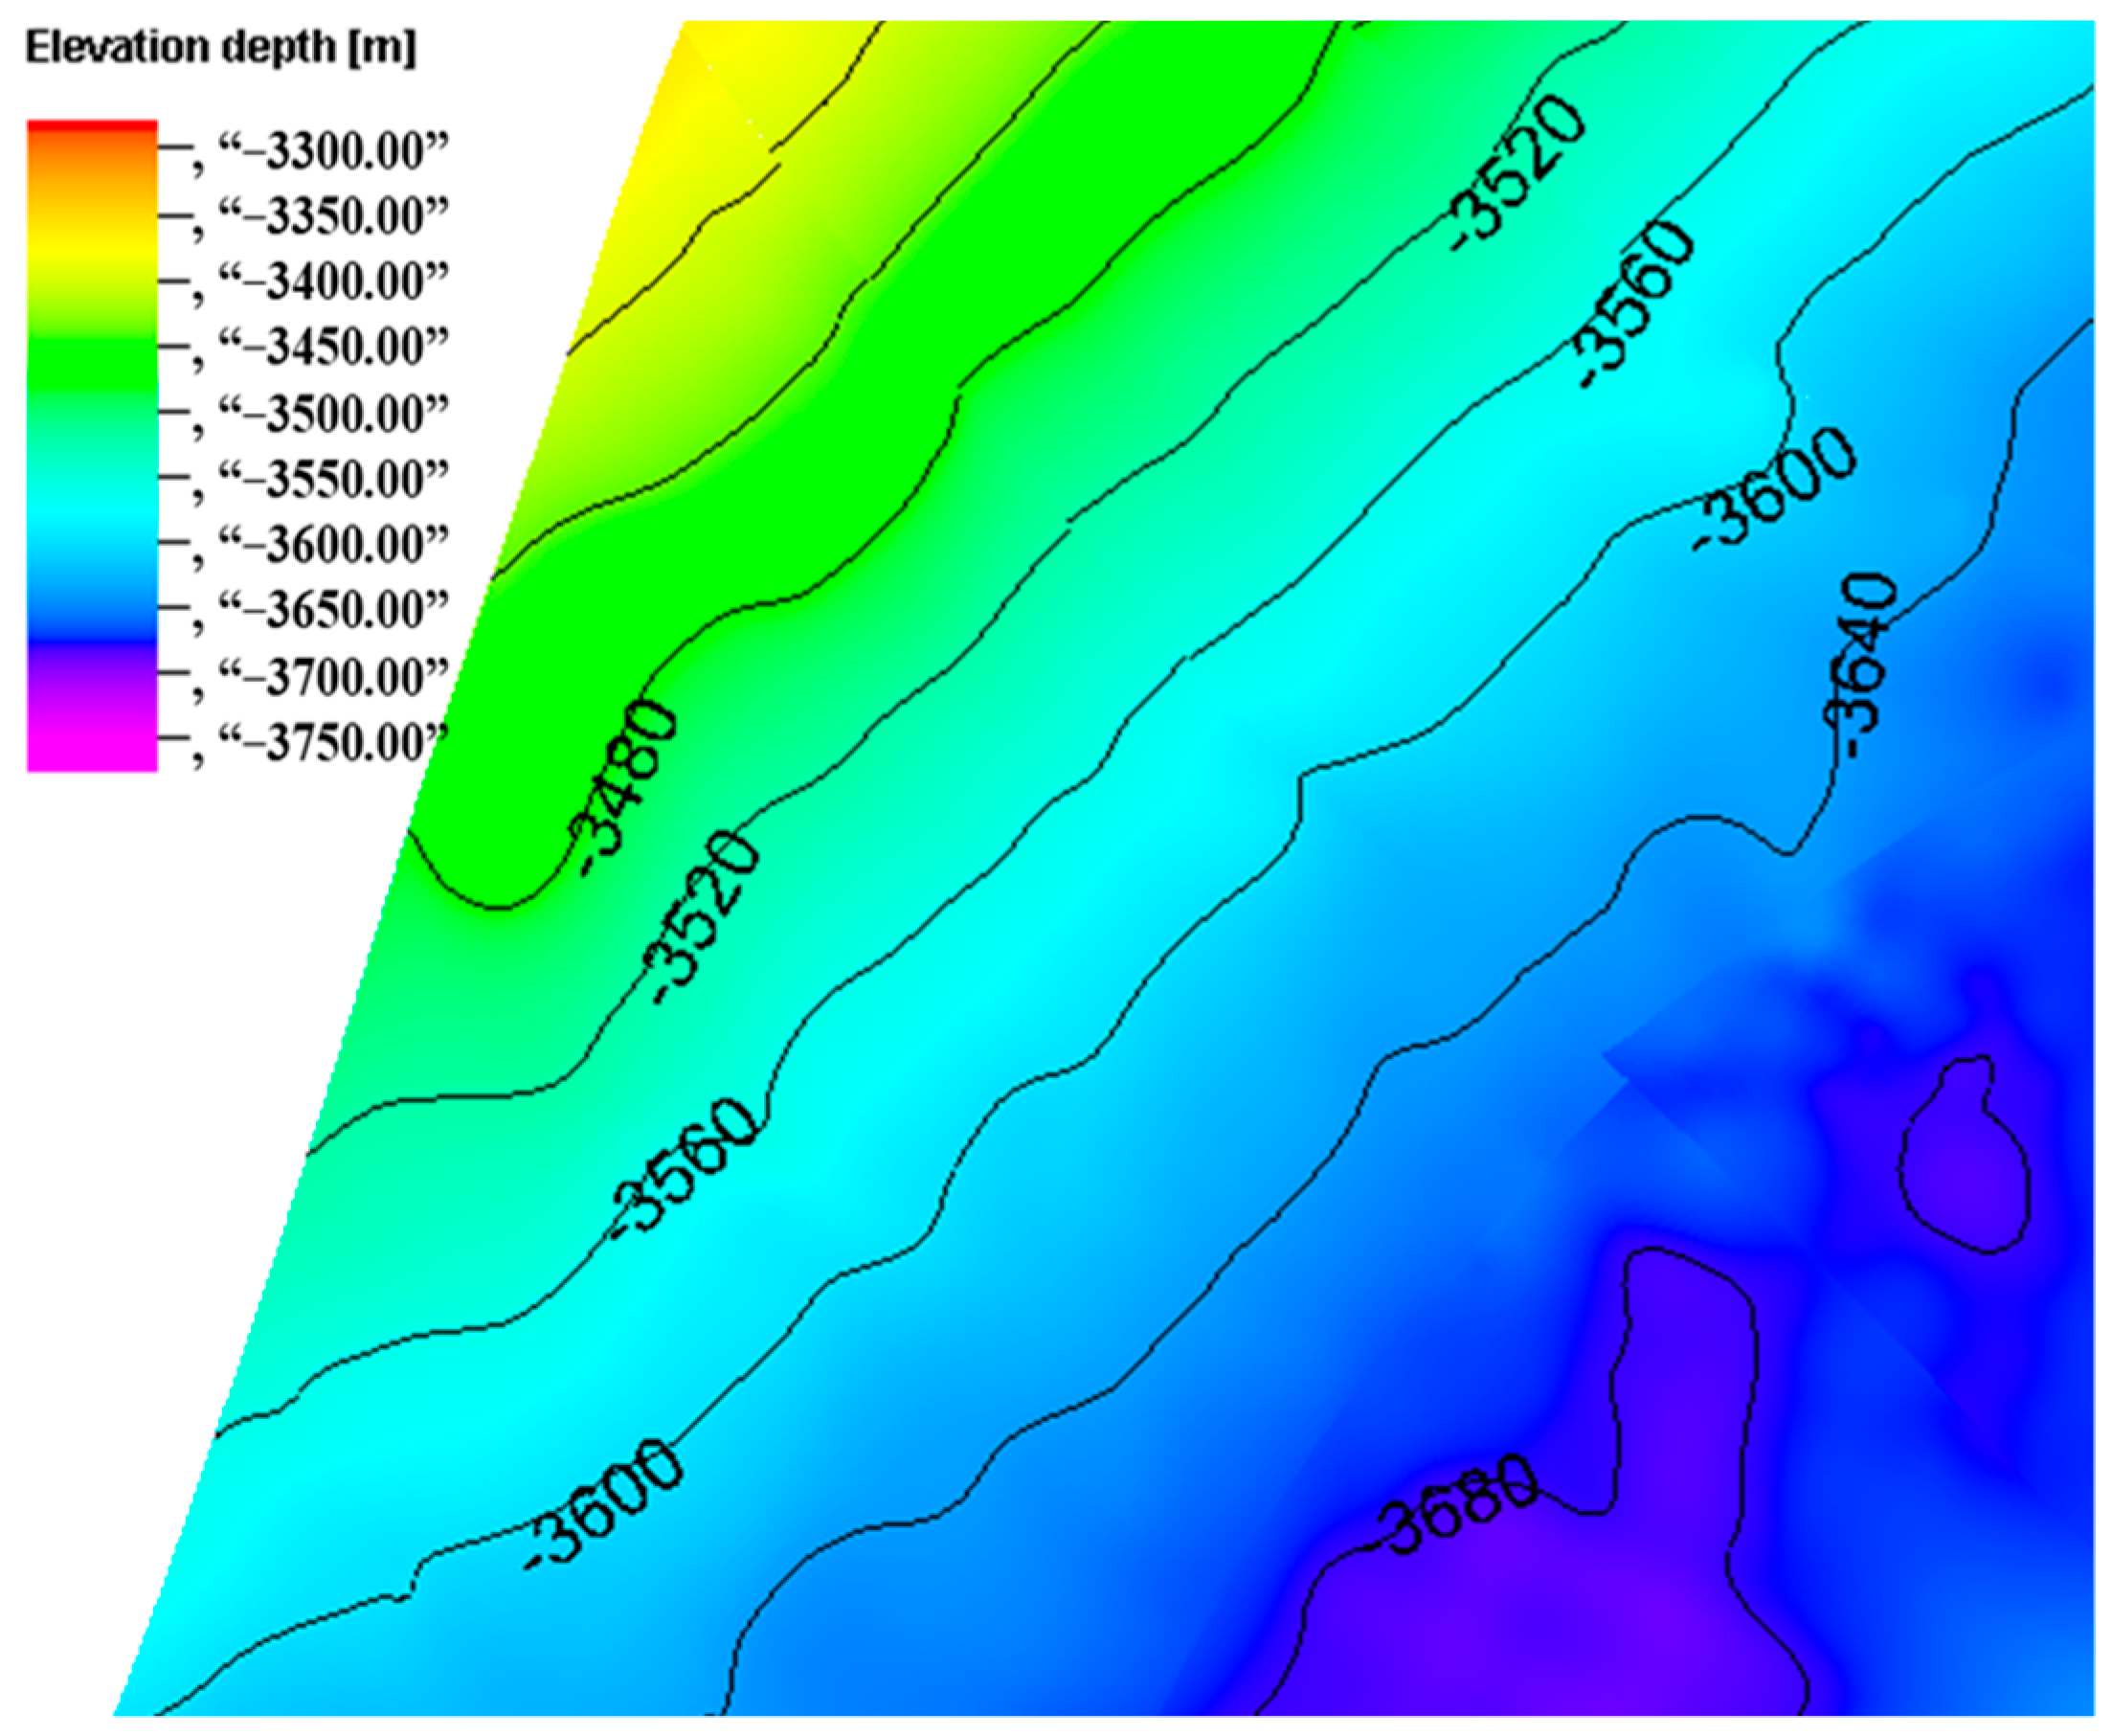
Xinjiang Mahu tight gravel oil reservoir is a mega tight gravel oil reservoir discovered in recent years with estimated total oil geological reserves exceeding one billion tons, of which the Mahu 18 block is located in the eastern part of the Mahu oil field. The Mahu 18 block in Xinjiang, China is composed of one section of Baikouquan Formation, two sections of Baikouquan Formation, and three sections of Baikouquan Formation from the bottom up, of which one section of Baikouquan Formation and two sections of Baikouquan Formation are the main oil-bearing sections. At present, the Mahu 18 block has been reformed by large-scale volumetric fracturing technology, so the fracture interference phenomenon is increasing. Figure 1 shows the stratigraphic profile of the Mahu 18 block where the fracturing interference phenomenon is studied in this paper.
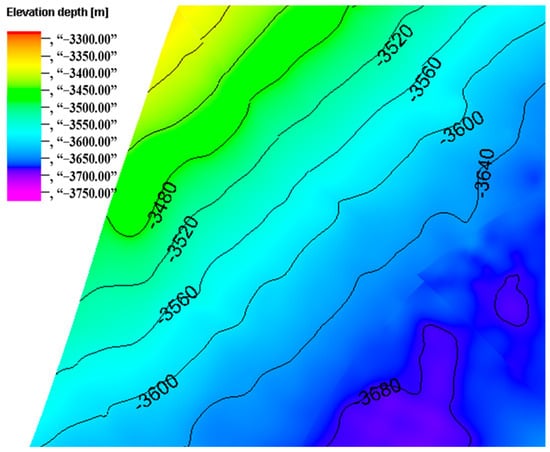
Figure 1.
The stratigraphic profile of the Mahu 18 block.
Statistical analysis of fracturing disturbance events in the Mahu 18 block from 2018 to 2021, combined with on-site fracturing construction plans and well group spatial relationships, were used to classify typical fracturing disturbance cases in the Mahu 18 block. Preliminary fracturing disturbance cases in the Mahu 18 block from 2018 to 2021 were obtained, and production wells that were repeatedly disturbed and severely affected were selected in sequence. These events were classified into four categories based on the relationship between the number of production wells and the number of fracturing wells in the disturbance events: single fracturing well affecting a single production well, multiple fracturing wells affecting a single production well, multiple fracturing wells affecting multiple production wells, and a single fracturing well affecting multiple production wells, as shown in Table 1. Well spacing in Table 1 is expressed as the distance between one disturbance well and one or more differently fracturing wells.

Table 1.
Typical case of fracturing disturbance in the Mahu 18 block.
The overall fracturing disturbance situation in the Mahu 18 block is quite complex, with cases where fracturing wells simultaneously affect multiple production wells and cause disturbance to adjacent production wells. For the complex interference situation in the Mahu 18 block, it is necessary to clarify the inter-well disturbance relationship, determine the type of fracturing disturbance, and quantitatively analyze the degree of disturbance in the affected wells.
3. Qualitative Analysis of the Type of Fracturing Disturbance
The previous text classifies typical fracturing disturbance events in the Mahu 18 block based on the quantity relationship between production wells and fracturing wells, their well network position relationship, and the fracturing construction plan. The inter-well disturbance relationship in fracturing disturbance events was preliminarily clarified, but qualitative analysis and quantitative evaluation of each fracturing disturbance event have yet to be conducted. Usually, during fracturing, a large amount of fracturing fluid is injected into the formation, and pressure waves will spread around the fracturing well with these fluids at the center. In addition, due to different forms of connectivity between wells, there will be specific differences in the production dynamic response characteristics of the disturbed wells after fracturing interference occurs, mainly involving the production of fluid and pressure changes in the disturbed wells. These differences can be divided into two types: the fracture communication type (fracturing disturbance formed by direct communication of hydraulic fractures between wells), and the pressure wave disturbance type (fracturing disturbance formed by pressure transmission from the formation matrix between wells). This section analyzes the dynamic response characteristics of the disturbed wells one by one in order to qualitatively analyze the types of fracturing disturbance and quantify the degree of impact of different types of fracturing disturbance.
3.1. Fluid Production Performance during Fracturing Disturbance
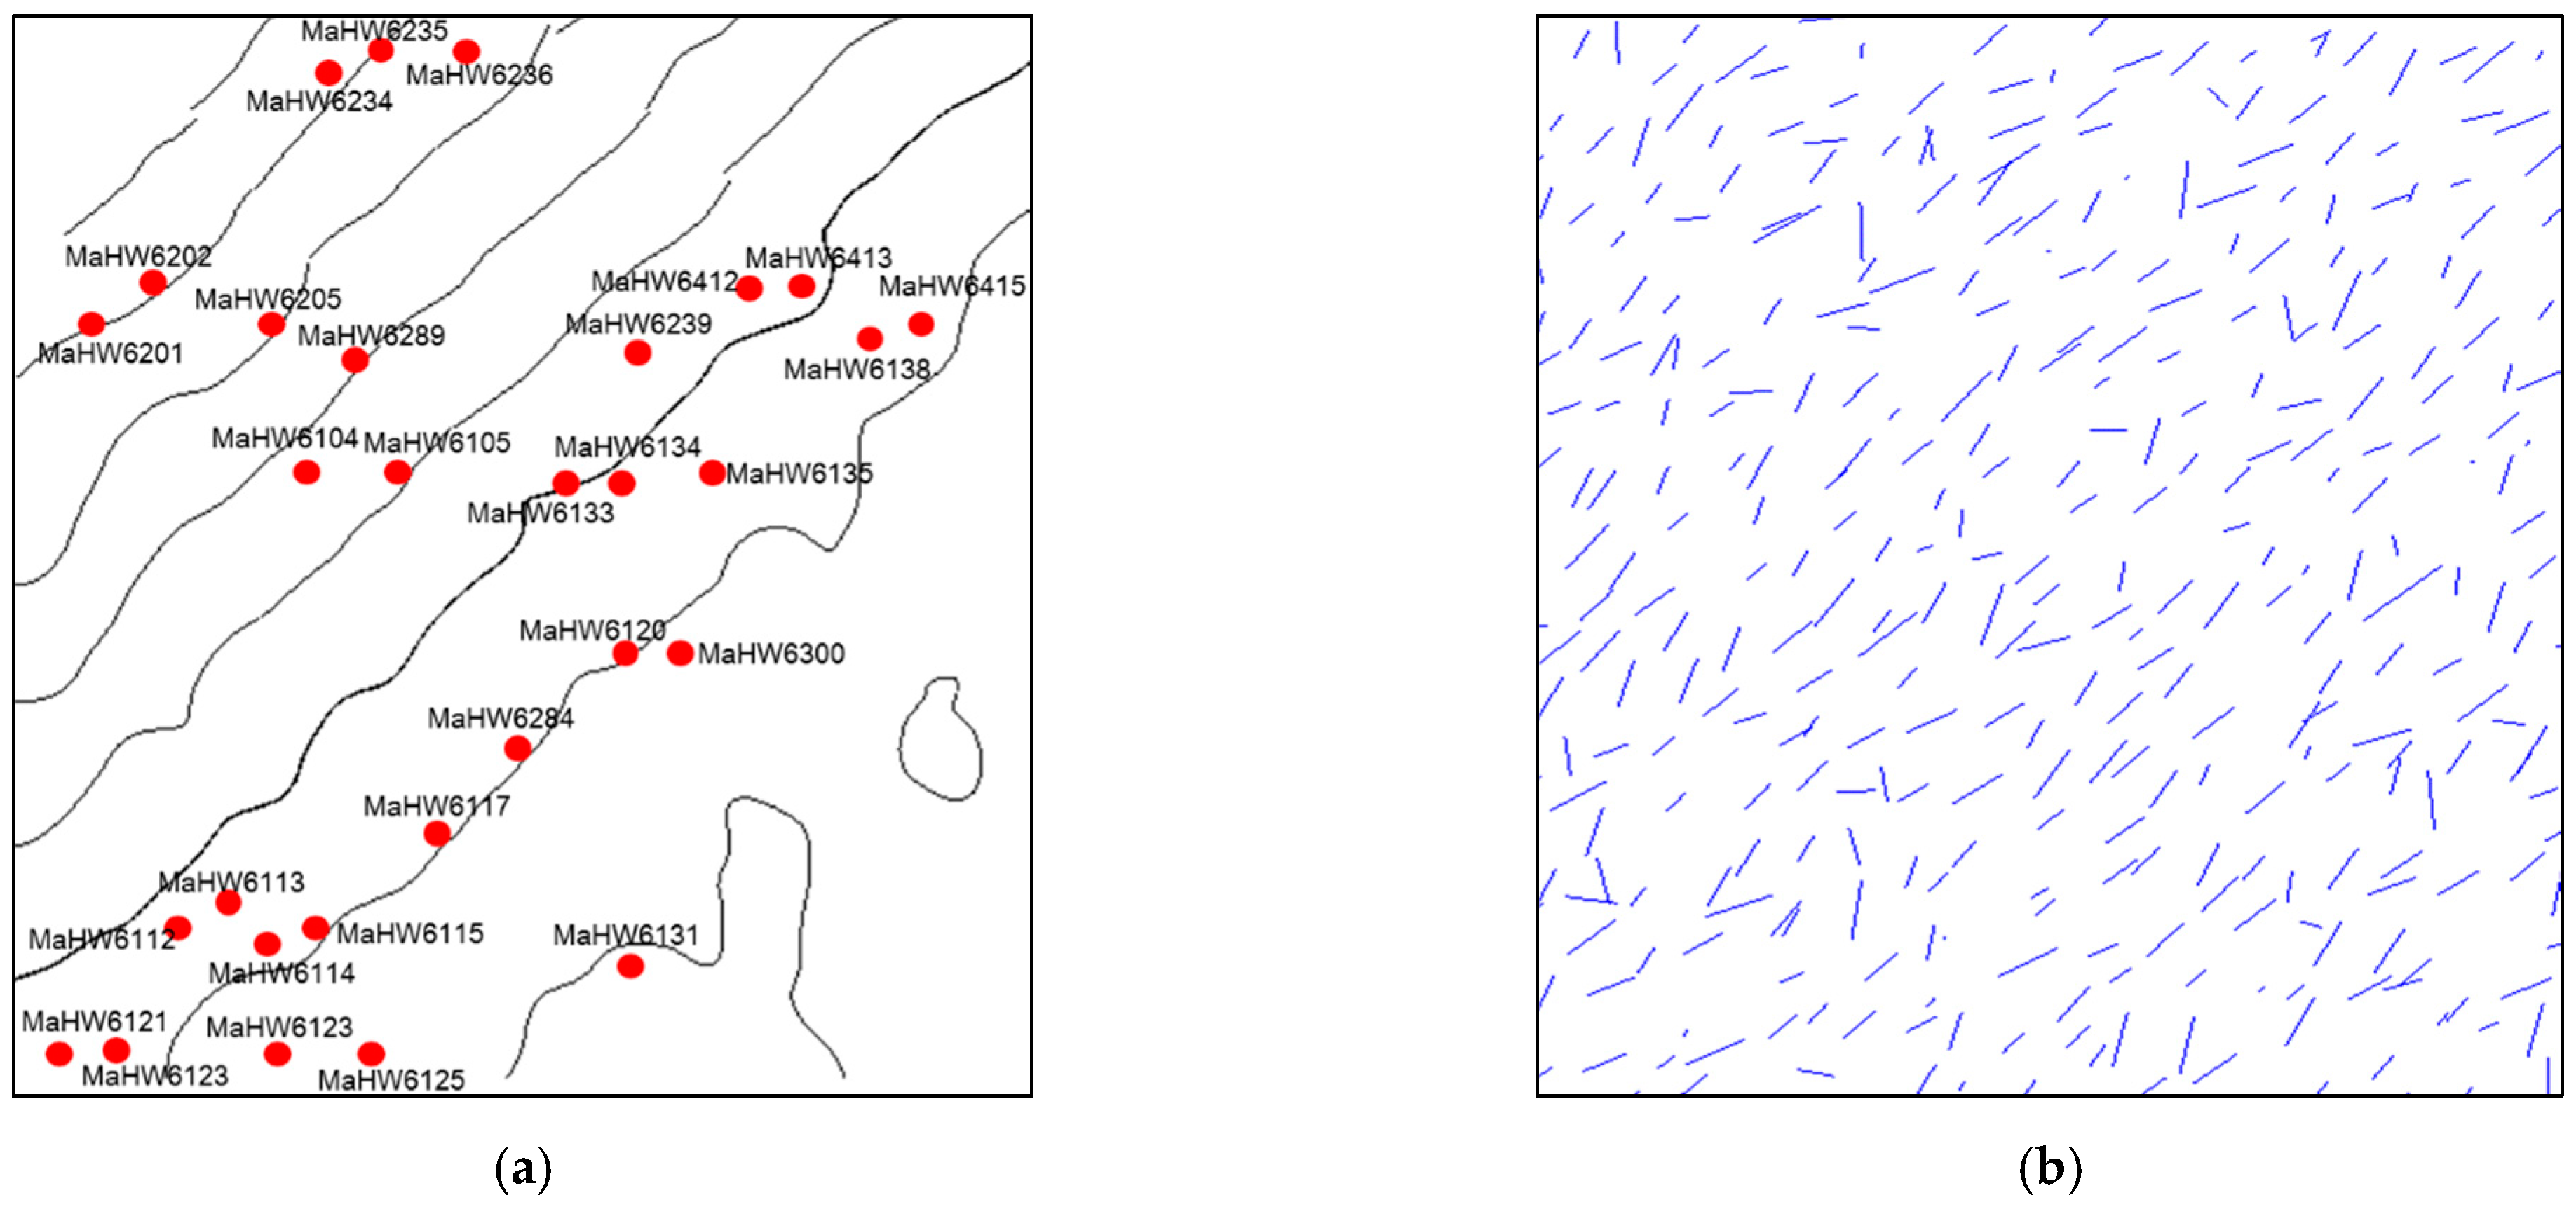
Figure 2 shows the wellbore layout of the wells for the 10 cases (Cases 2, 3, 6, 9, 11, 13, 15, 16, 18, 19) and the distribution of natural fractures in the area. The natural fractures in the Ma 18 block are developed to different degrees in all directions, showing a bimodal distribution, with the largest number of natural fractures in the range of 200°~230° azimuth, and more natural fractures are developed in the length of 200~400 m, which are easy to connect with hydraulic fractures and induce tampering.
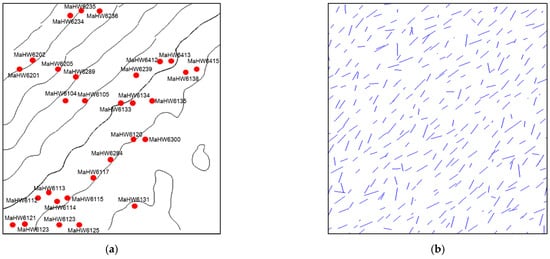
Figure 2.
Wellbore layout of the wells for the 10 cases and the distribution of natural fractures. (a) Wellbore layout; (b) distribution of natural fractures.
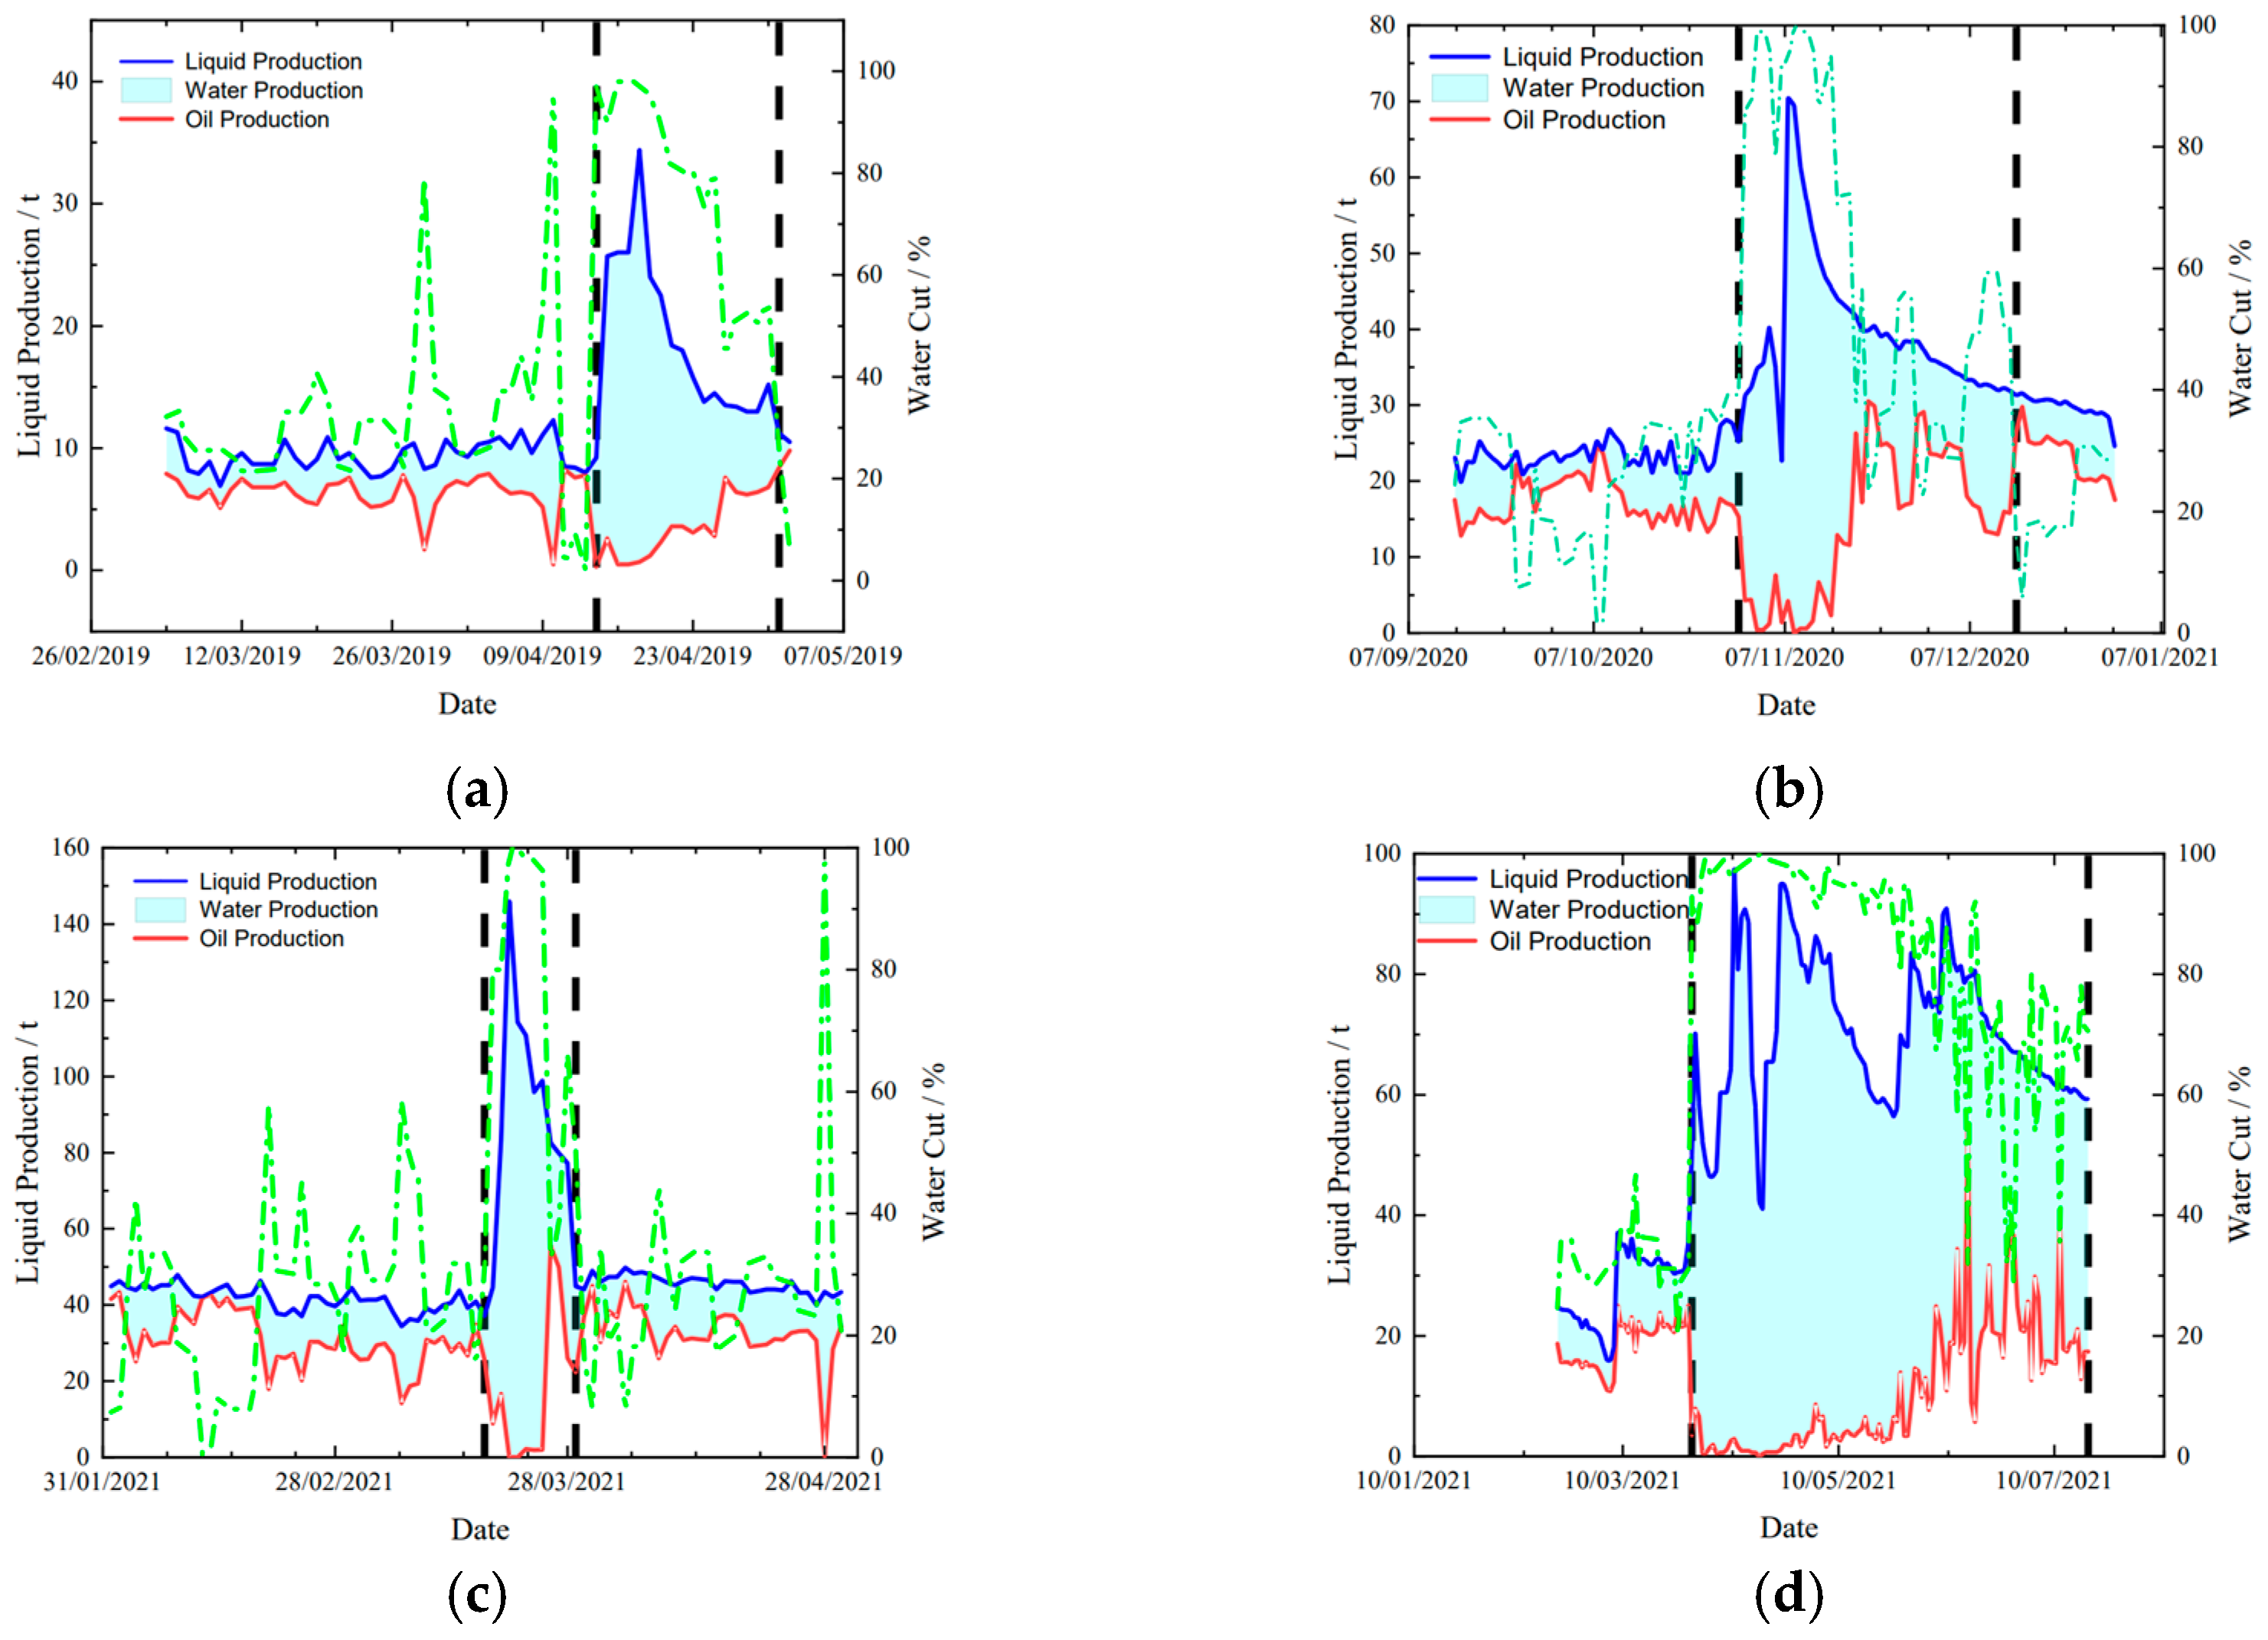
To highlight the performance characteristics, typical examples were selected from Table 1 for comparative analysis (Cases 2, 3, 6, 9, 11, 15, 16, 18, 19). Based on the characteristics of liquid production performance, these nine cases were divided into three groups, including two groups of similar fracturing disturbance events and an undisturbed event as a comparison, as shown in Figure 3.
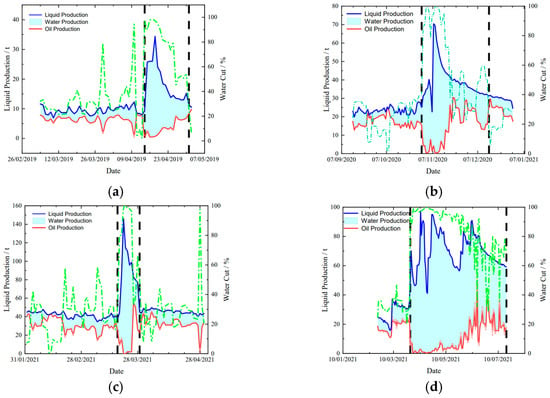
Figure 3.
Fracture connections: The production data curve of horizontal wells affected by fracturing disturbance (the two black dashed lines in the figure indicate the start and end times of disturbance to wells; the green dotted lines in the figure indicate the water cut curve). (a) Case 2: the production data curve of MaHW6202; (b) Case 3: the production data curve of MaHW120; (c) Case 6: the production data curve of MaHW6117; (d) Case 9: the production data curve of MaHW6415.
As shown in Figure 3, in all four cases, the production wells were not shut in during the new well fracturing. As the fracturing construction of the new well progresses, hydraulic fractures in the adjacent well extend to the vicinity of the production well, leading to fracture communication. The production and fracturing well formed inter-well communication within the dotted line range. The fracture communication type of fracturing disturbance manifests as a sharp increase in the well’s liquid production and a water content of almost 100%. During the disturbance period, the daily oil production sharply decreased and approached zero, severely affecting the production.
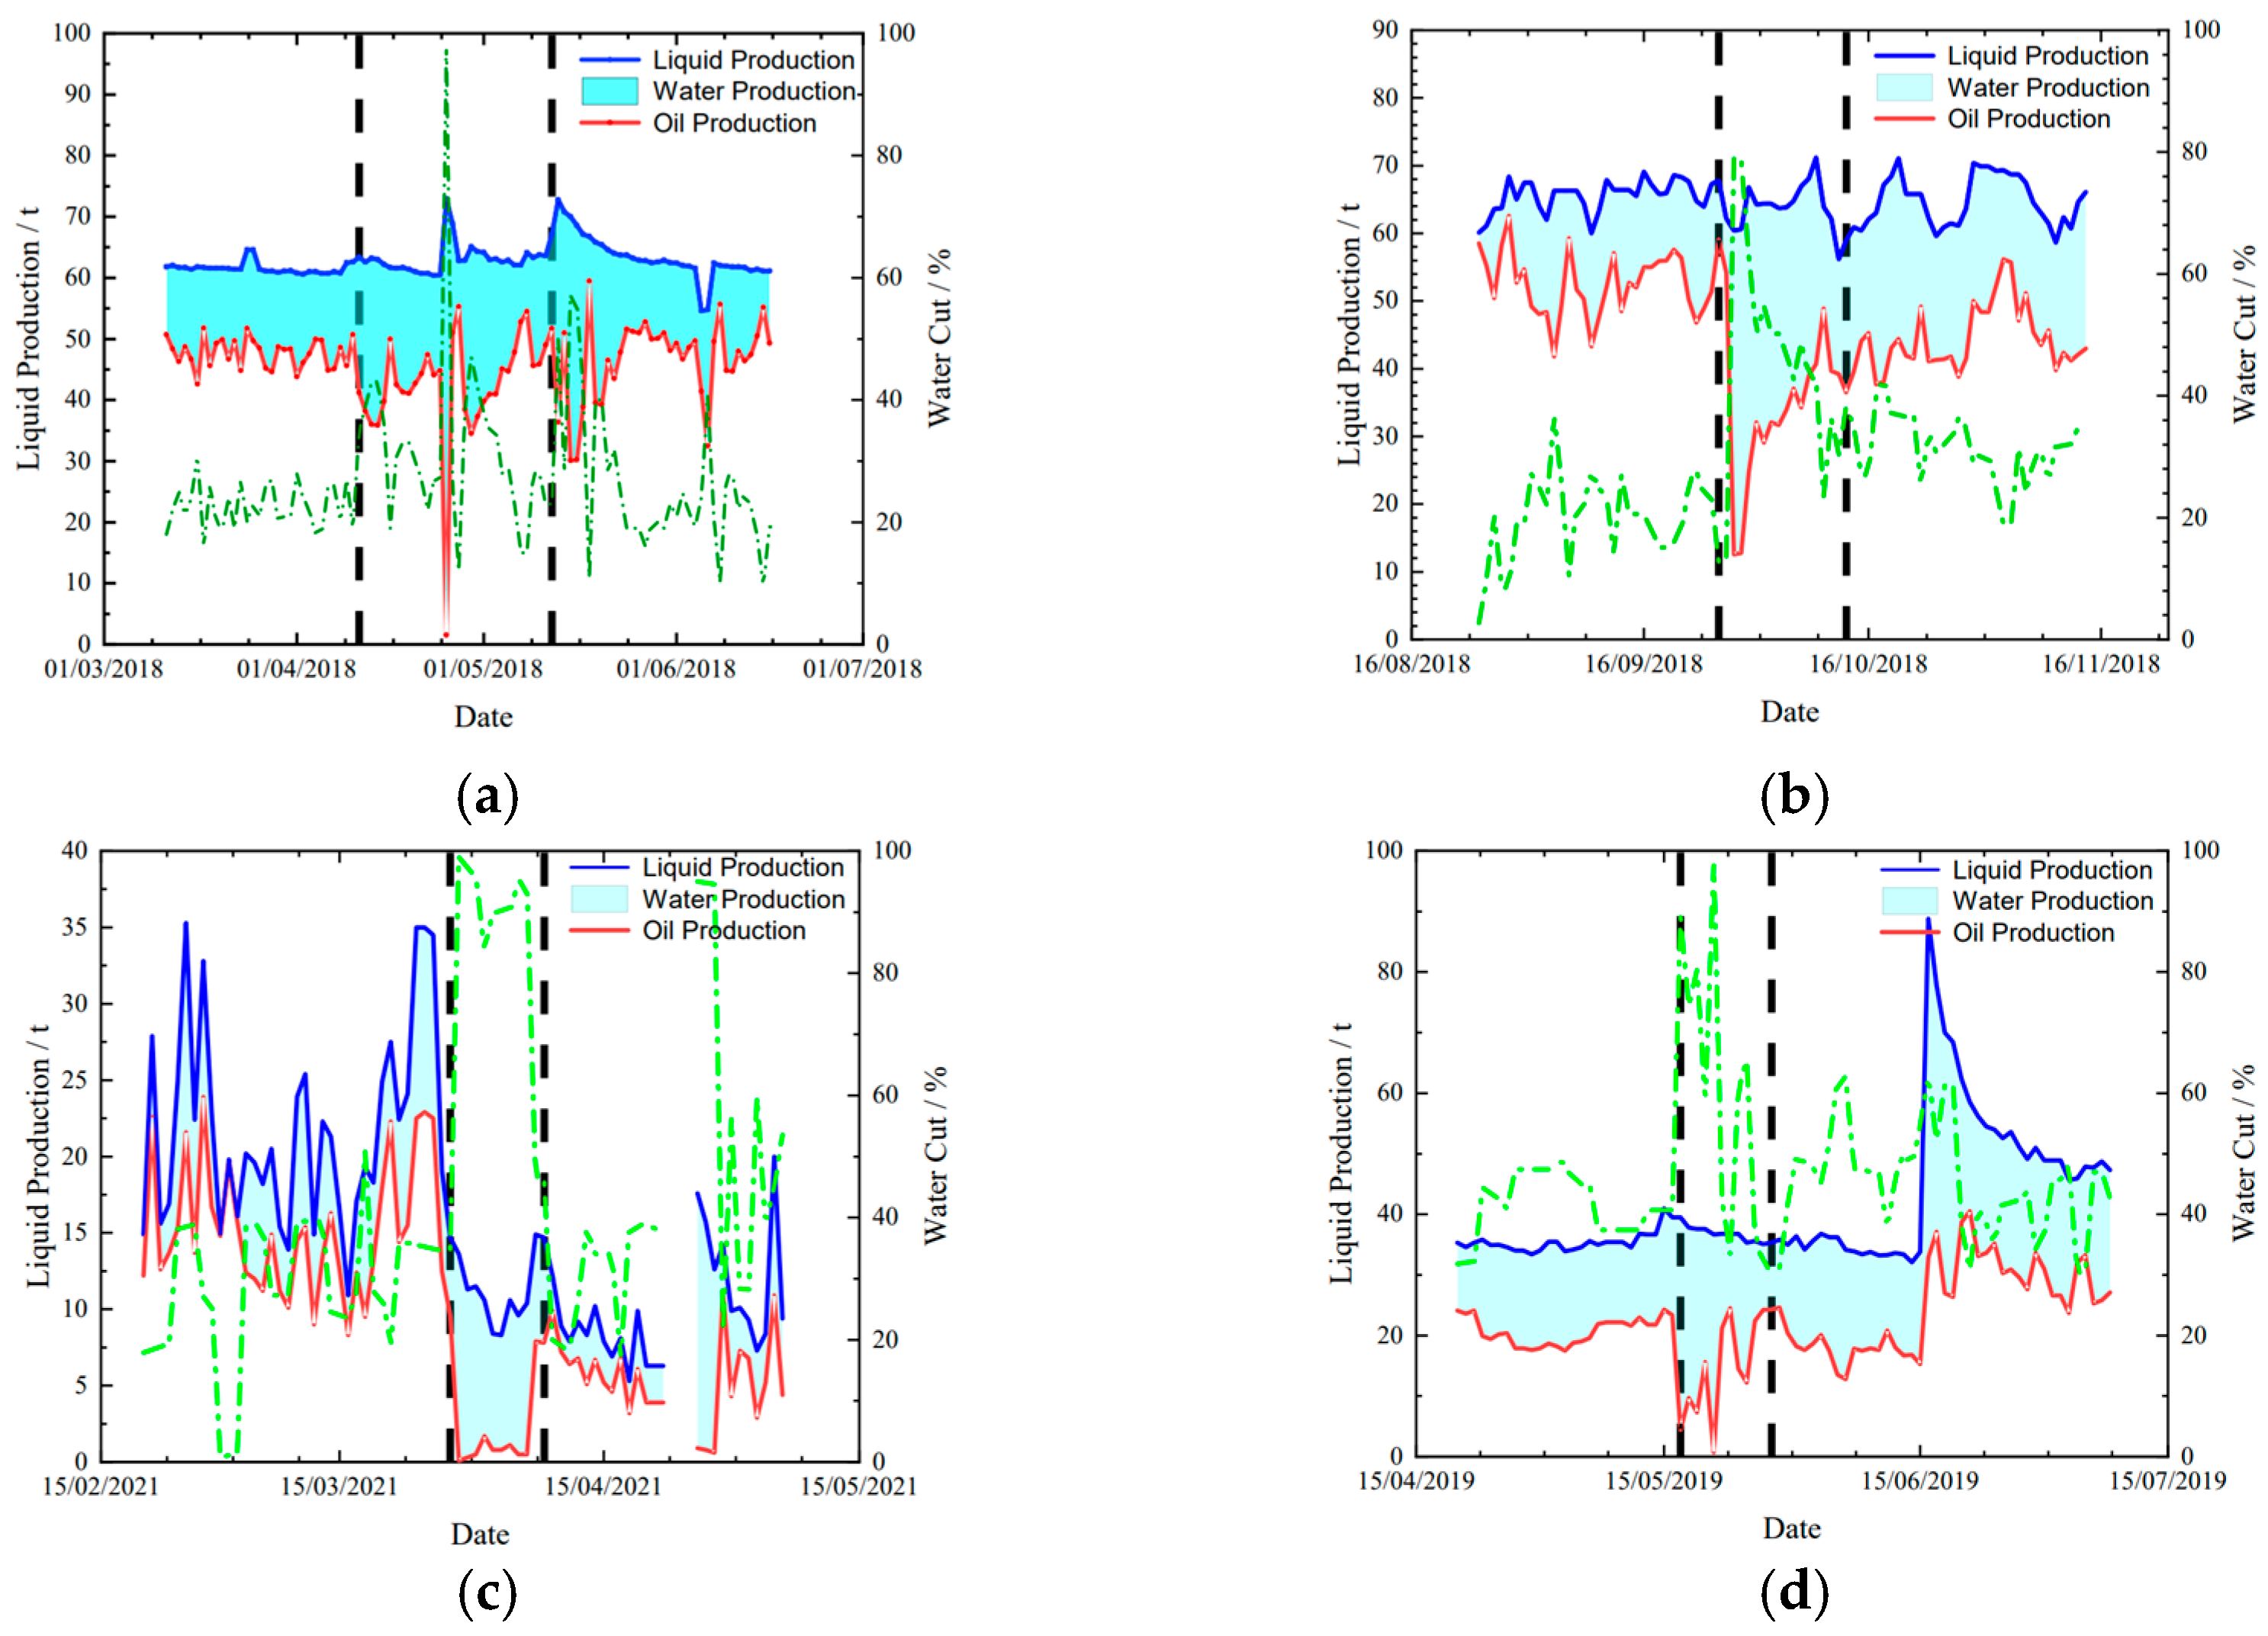
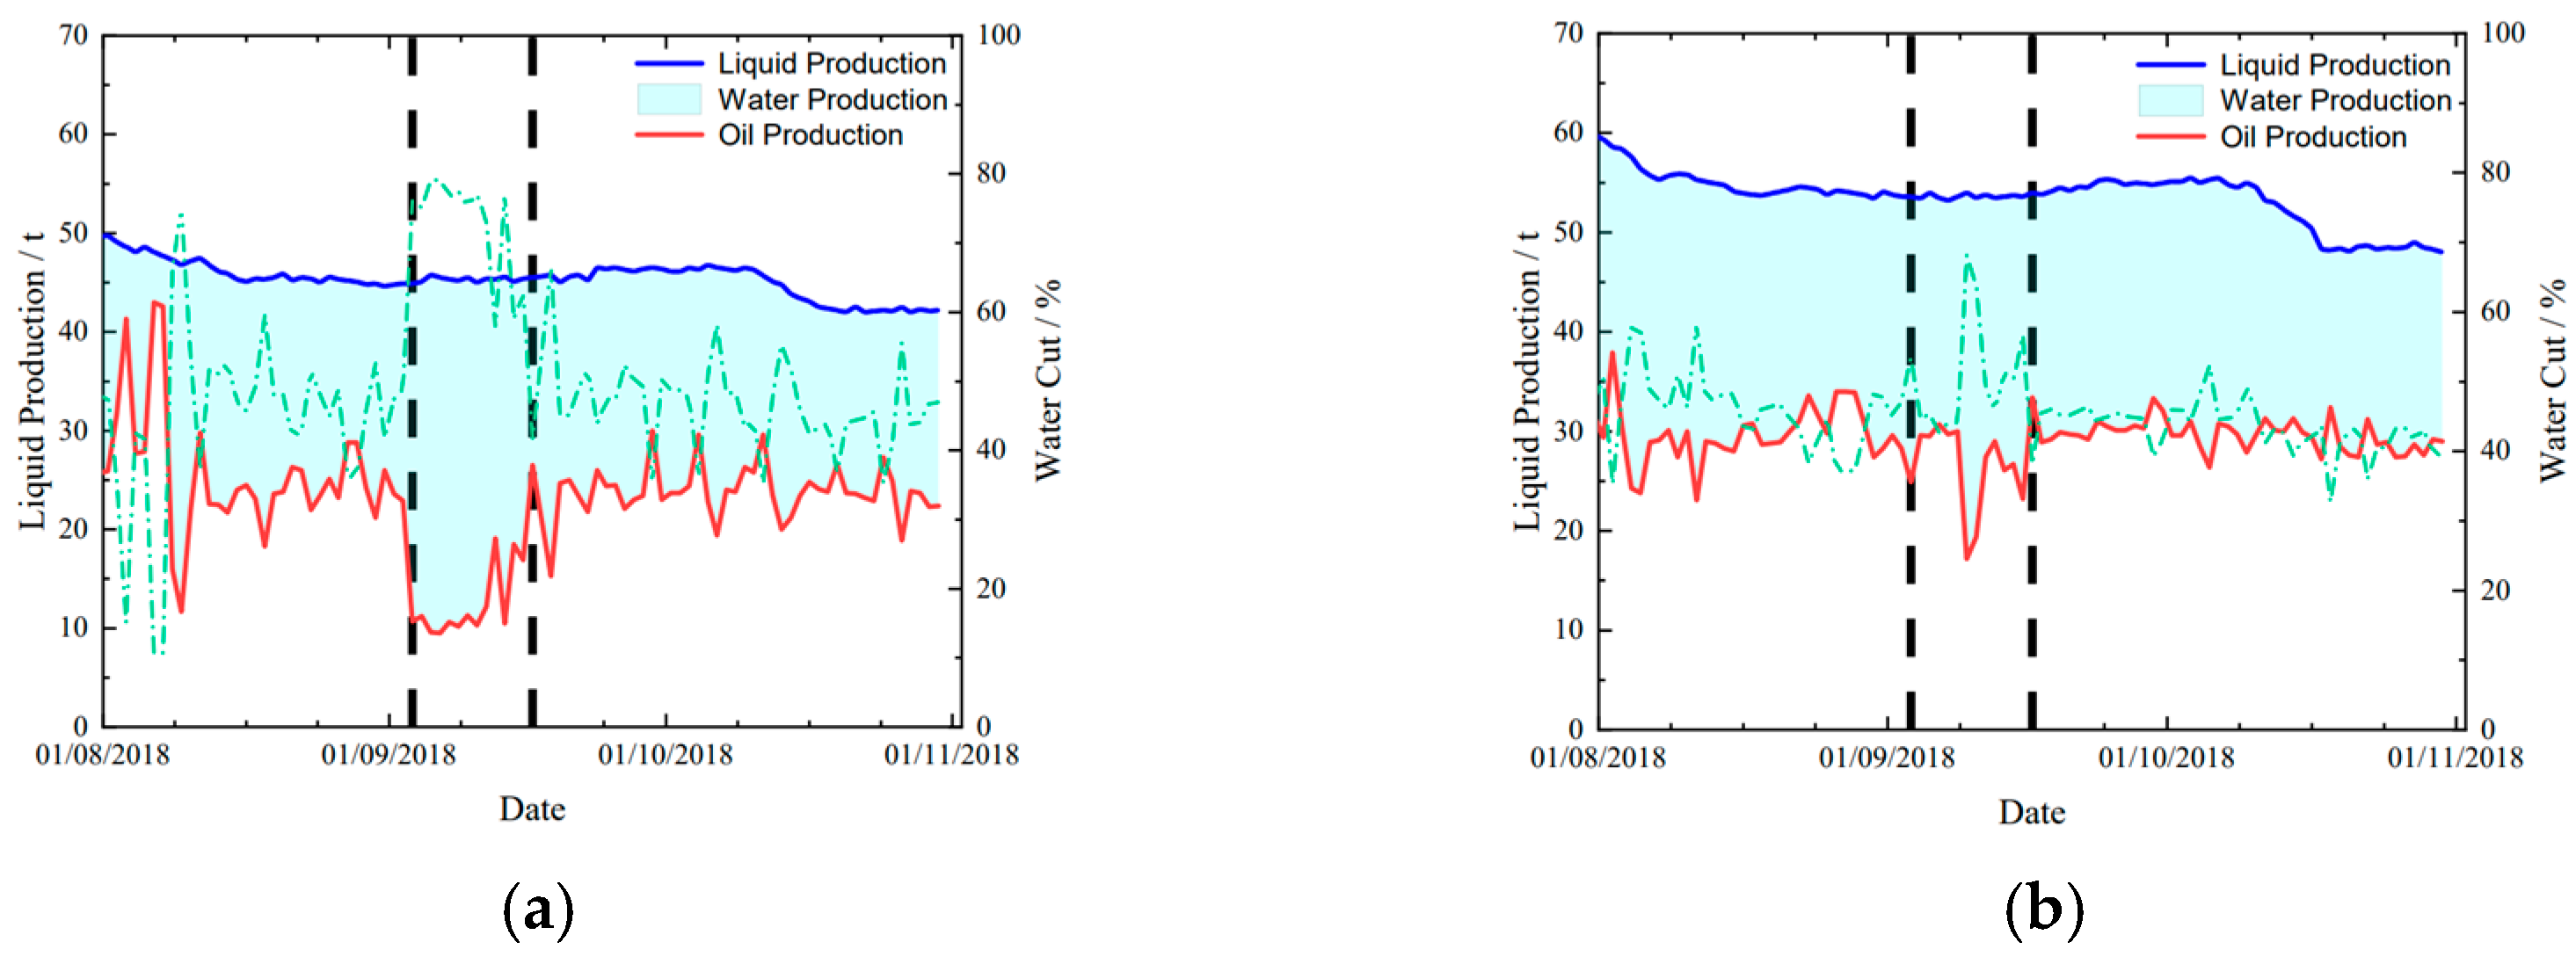
The difference between the pressure wave disturbance type of fracturing disturbance and the fracture communication type of fracturing disturbance is that they are not seriously negatively affected, as shown in Figure 4. After being affected by adjacent well fracturing, the daily liquid production of the production well fluctuates slightly without a sharp increase. Although oil production is negatively affected and leads to an increase in water production, the degree is relatively light and can be restored quickly. This is because tight reservoirs usually have poor porosity and permeability properties, and fluid diffusion in the formation could be slower. The formation compression coefficient also affects the diffusion process, which finally forms connectivity through the rock matrix. This type of well-to-well connectivity could be slower.
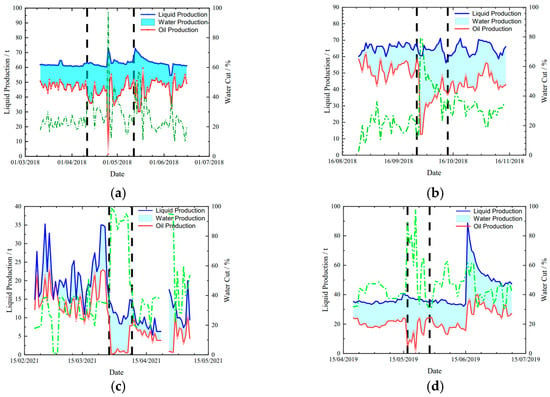
Figure 4.
Pressure wave interference: the production data curve of horizontal wells is affected by fracturing disturbance (the two black dashed lines in the figure indicate the start and end times of disturbance to wells; the green dotted lines in the figure indicate the water cut curve). (a) Case 11: the production data curve of MaHW6134; (b) Case 15: the production data curve of MaHW6131; (c) Case 19: the production data curve of MaHW6205; (d) Case 18: the production data curve of MaHW6235.
For comparative analysis, the last type is not even slightly affected by pressure waves. As shown in Figure 5, the liquid production remains stable during the disturbance period, and there are slight fluctuations in oil and water production. However, it remains to be debated whether the impact was caused by adjacent well fracturing. So, this fracturing disturbance is classified as not being disturbed by fracturing or even slightly disturbed by pressure waves.
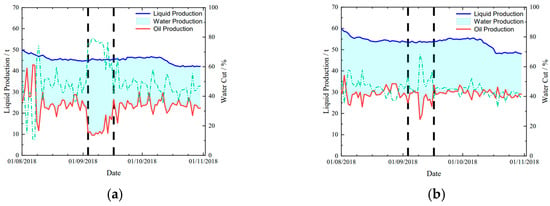
Figure 5.
The production data curve of horizontal wells is not affected by fracturing disturbance (the two black dashed lines in the figure indicate the start and end times of disturbance to wells; the green dotted lines in the figure indicate the water cut curve). (a) Case 16: the production data curve of MaHW6234; (b) Case 16: the production data curve of MaHW6235.
3.2. Pressure Variation Trend during Fracturing Disturbance
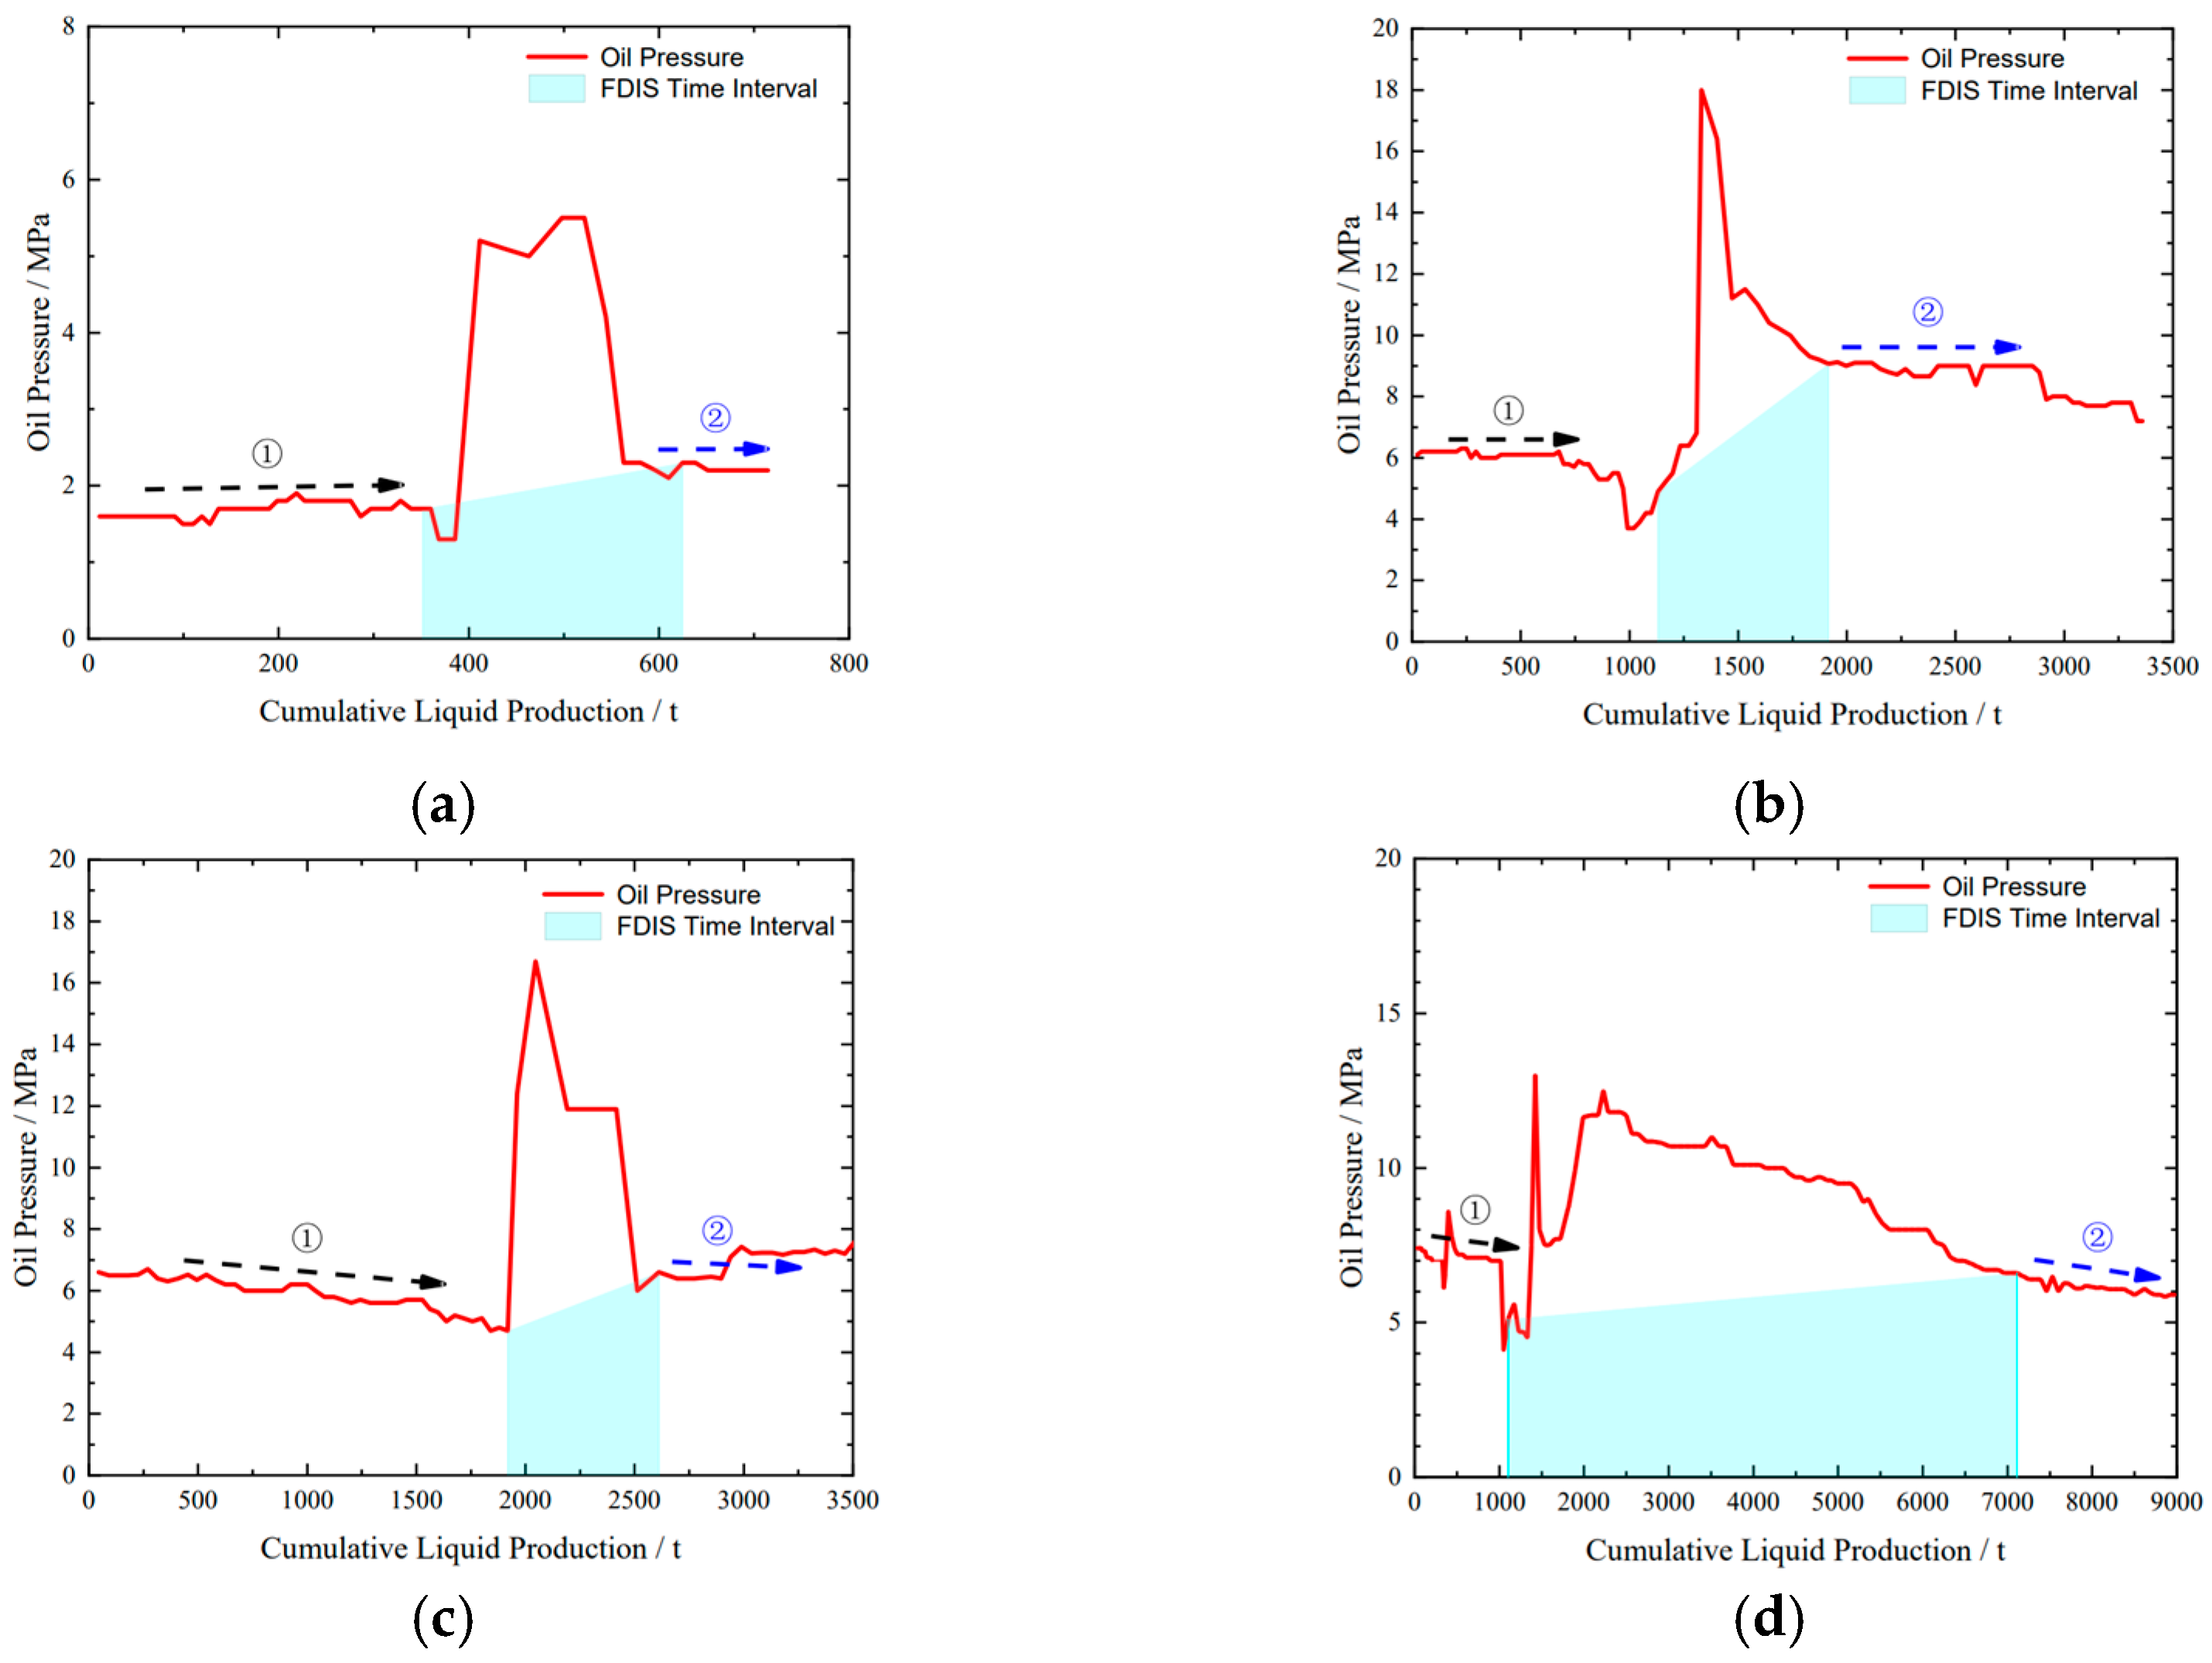
Different types of fracturing disturbance can also cause different pressure change trends. Feng et al. [7] believe that the linear flow state of fractures can be determined by plotting the relationship between oil pressure and accumulated production fluid before and after fracturing disturbance in production wells. The type of fracturing disturbance can then be determined based on whether its shape changes before and after interference. Generally, the slope of the oil pressure curve changing with accumulated production fluid can represent the linear flow state of the fractures. There are two types of specific manifestations: the linear flow slope of the fracture before and after the communication type disturbance of the fracturing fracture will not change, and the linear flow slope of the fracture before and after the pressure wave interference disturbance will change.
Typical cases from Table 1 were selected for comparative analysis (Cases 2, 3, 6, 9, 11, 13, 15, 16, 19). Based on the characteristics of liquid production performance, these nine cases were divided into three groups, including two groups of similar fracturing disturbance events and an undisturbed event as a comparison, as shown in Figure 6.
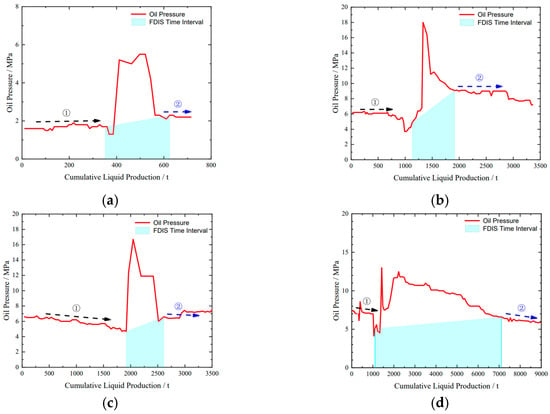
Figure 6.
Fracture connections: the changing trends of oil pressure/accumulated fluid in horizontal wells are affected by fracturing channeling (arrows represent linear flow state). (a) Case 2: the oil pressure curve of MaHW6202; (b) Case 3: the oil pressure curve of MaHW6120; (c) Case 6: the oil pressure curve of MaHW6117; (d) Case 9: the oil pressure curve of MaHW6415.
Figure 6 shows that in all four cases, the oil pressure of the production wells increased sharply after being disturbed by fracturing. However, the pressure dropped after some time, and the linear flow of the fractures returned to the same level as before the disturbance. In Figure 6, ① represents the linear flow pattern of the fractures before the disturbance, and ② represents the linear flow state after the disturbance. It can be observed that the slope has not changed significantly. In addition, production wells disturbed by fracture communication type fracturing usually experience an increase in oil pressure level after the pressure drops compared to before the disturbance. This is because after hydraulic fractures are formed between the fracturing well and the production well, the fracturing fluid often causes strong pressure shocks around the production well, which directly increases the bottom hole flow pressure of the production well, ultimately increasing oil pressure. In summary, it can be seen that the fracturing disturbance caused by fracture communication often has a more significant impact on the pressure of the production wells.
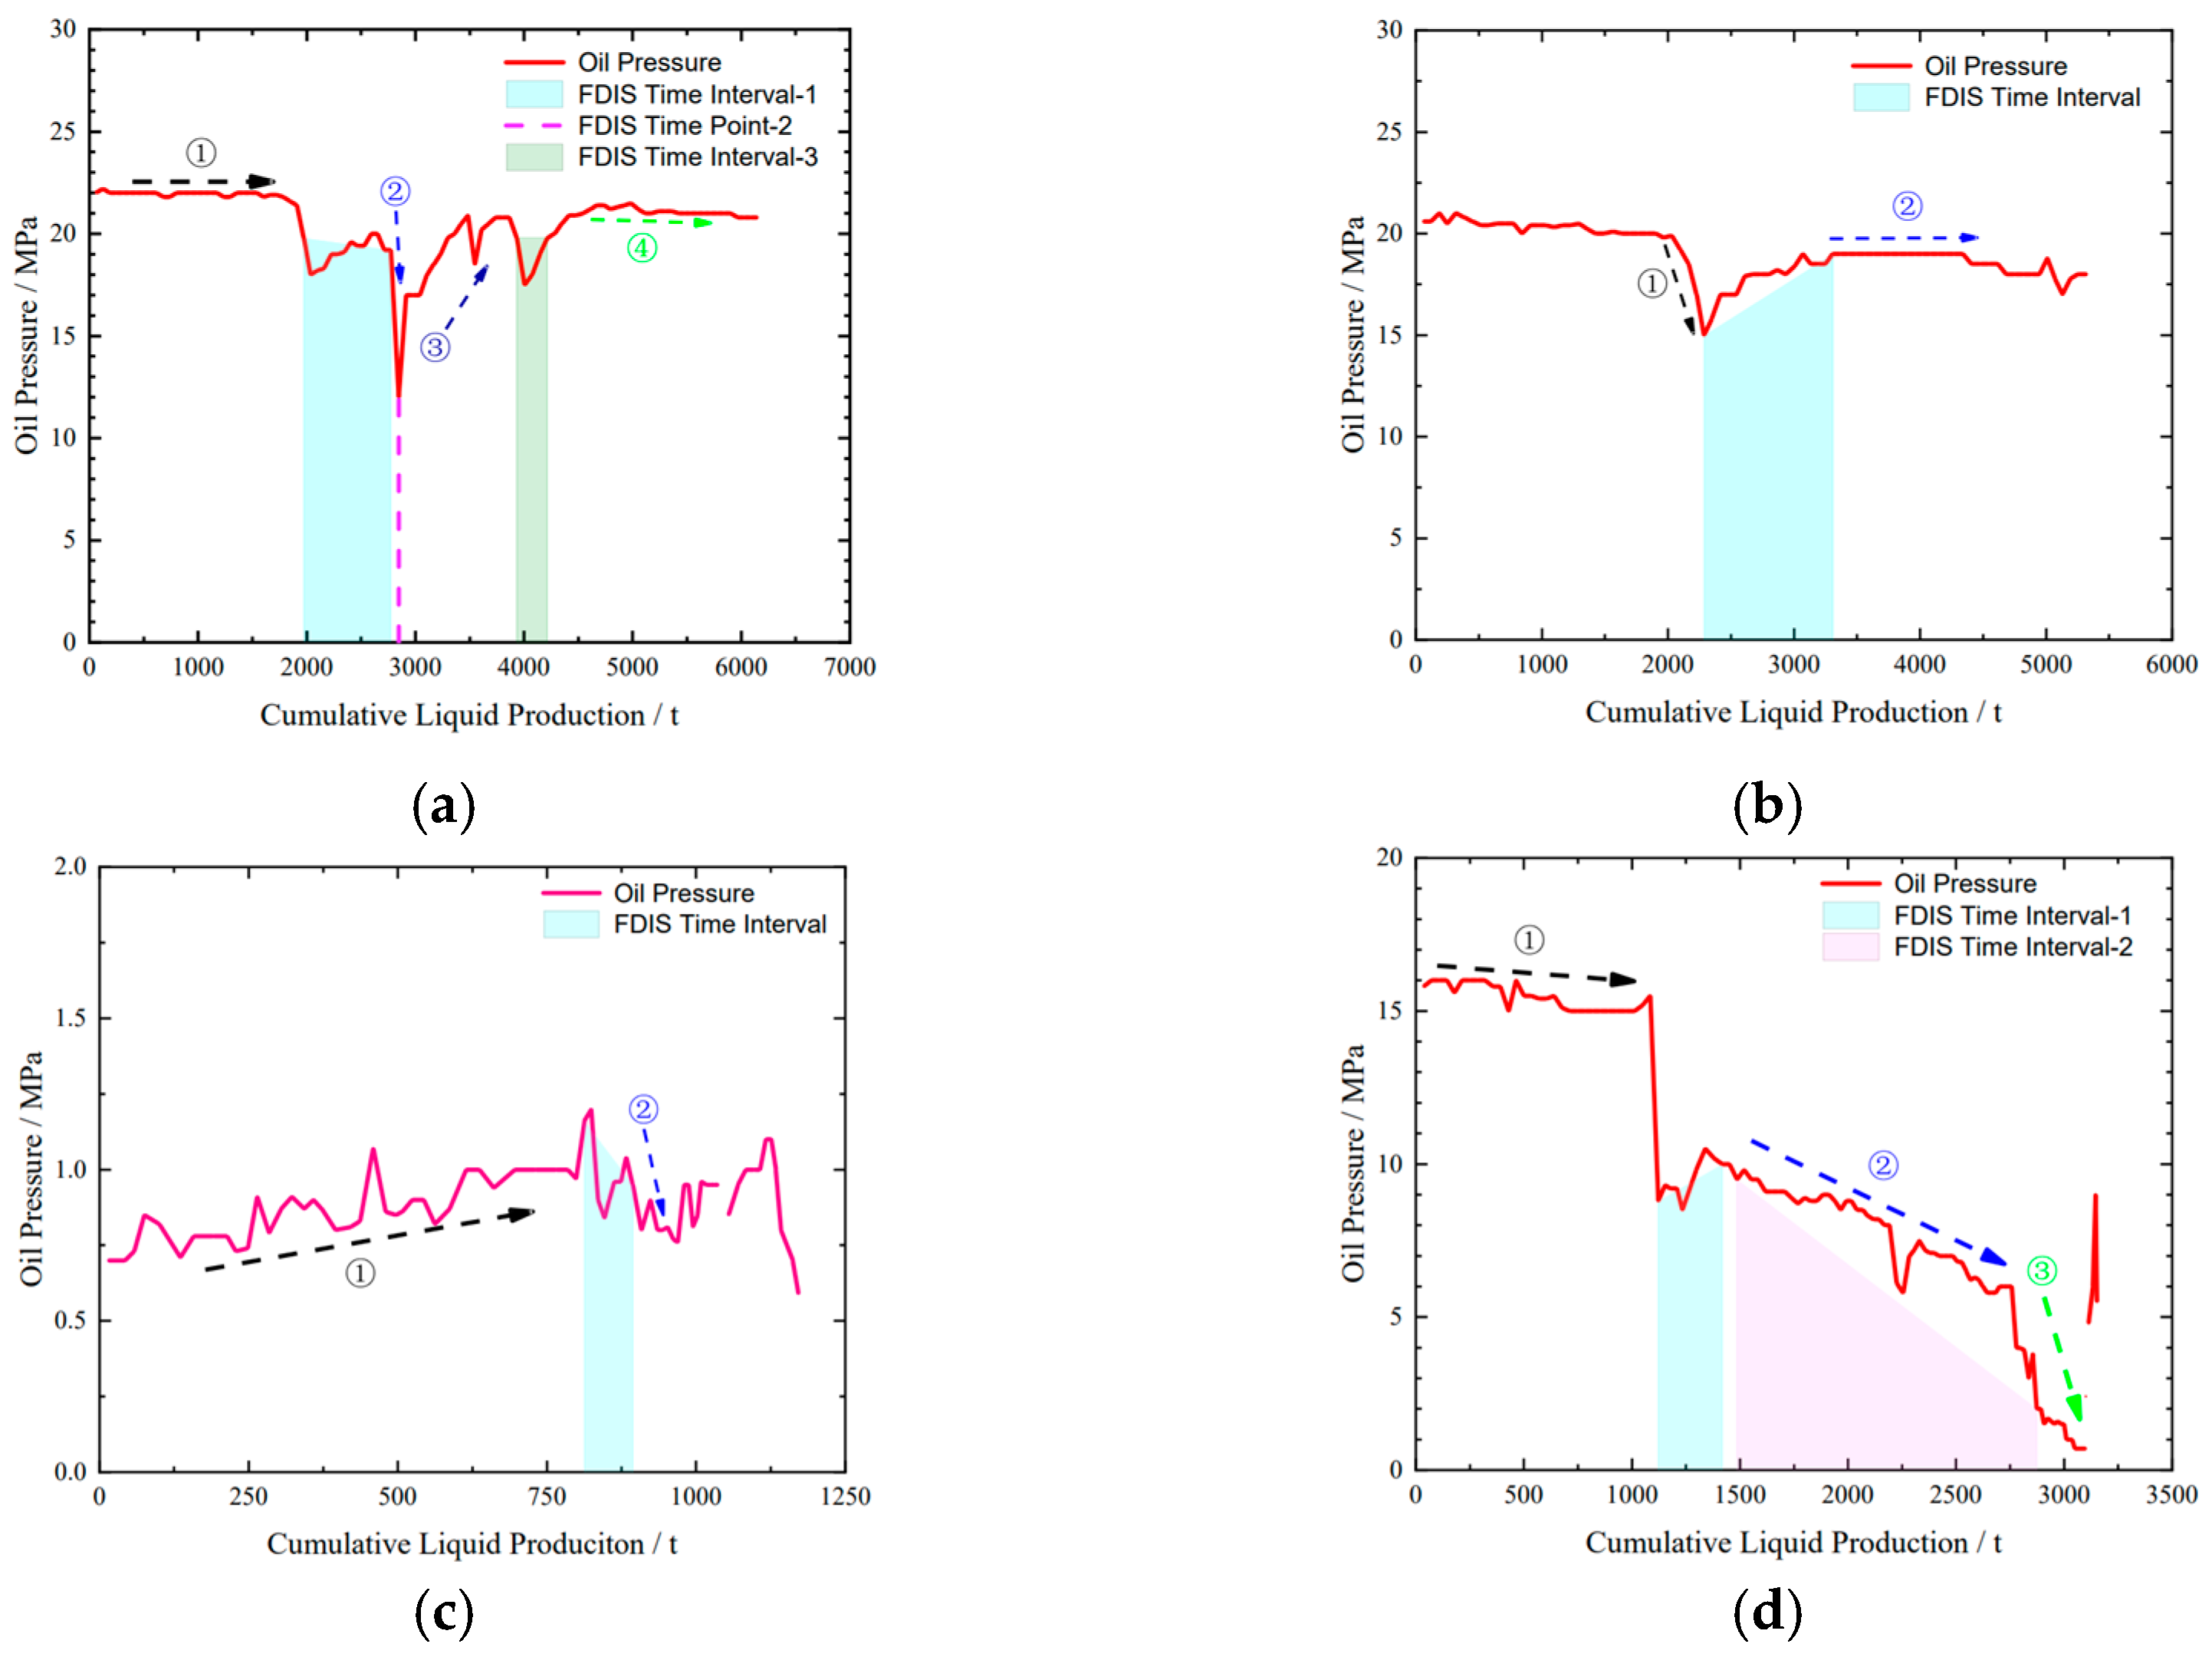
For the pressure wave communication type of fracturing disturbance, as shown in Figure 7, whether the production well is disturbed multiple times during production or only once, the linear flow characteristics of the fracture will change after the fracturing disturbance is completed, manifested as a change in the slope. Moreover, after being disturbed, the oil pressure of the production well often does not experience a sudden increase, is usually manifested as small fluctuations, and then tends to stabilize. In addition, the oil pressure of the production well often does not rise after a fracturing disturbance. This is because the pressure waves transmitted through the reservoir matrix are often slow to propagate and cannot cause direct and strong pressure shocks to the production well due to the influence of the reservoir compression coefficient or permeability.
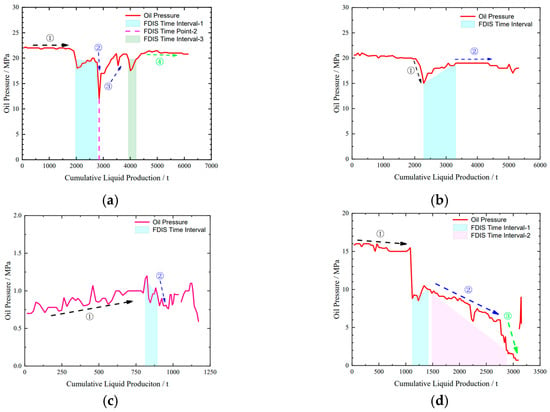
Figure 7.
Pressure wave interference: the changing trend of oil pressure/accumulated fluid in horizontal wells is affected by fracturing channeling (arrows represent linear flow state). (a) Case 11: the oil pressure curve of MaHW6134; (b) Case 15: the oil pressure curve of MaHW6131; (c) Case 19: the oil pressure curve of MaHW6205; (d) Case 13: the oil pressure curve of MaHW6125.
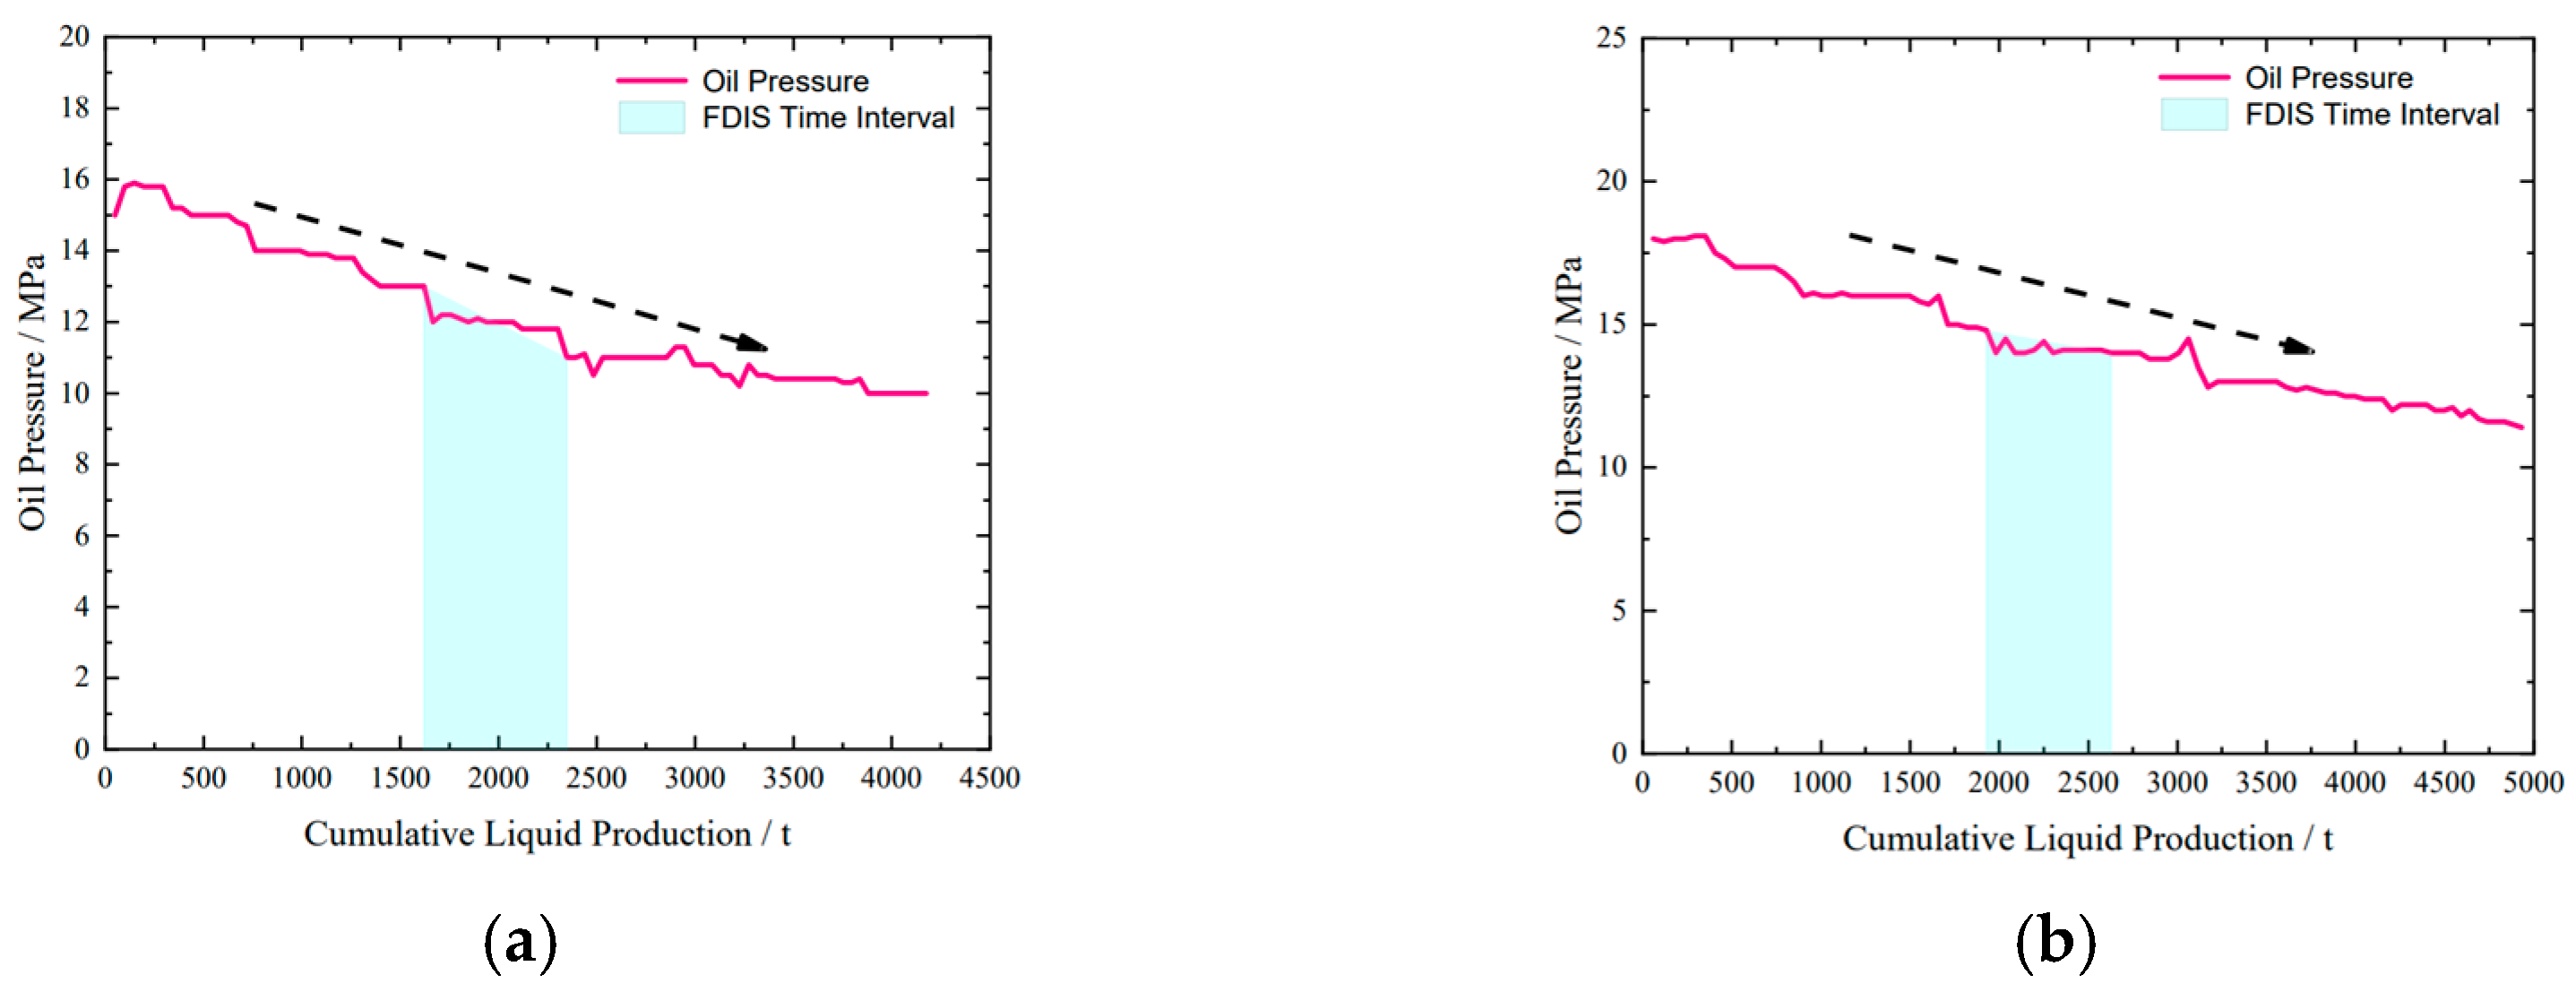
Finally, two production wells that were not disturbed or had very slight pressure wave disturbance were listed as a comparison. As shown in Figure 8, it is suspected that during the disturbance period, the oil pressure showed a stable decrease without any pressure fluctuations, and the linear flow of the crack did not change. So, this fracturing disturbance is classified as not being disturbed by fracturing or slightly disturbed by pressure waves.
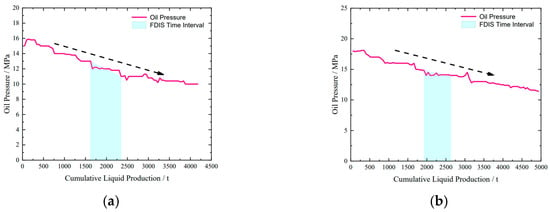
Figure 8.
The variation trend of oil pressure/accumulated fluid in horizontal wells is not affected by fracturing channeling (arrows represent linear flow state). (a) Case 16: the oil pressure curve of MaHW6234; (b) Case 16: the oil pressure curve of MaHW6235.
3.3. Proportion of Different Fracturing Disturbance
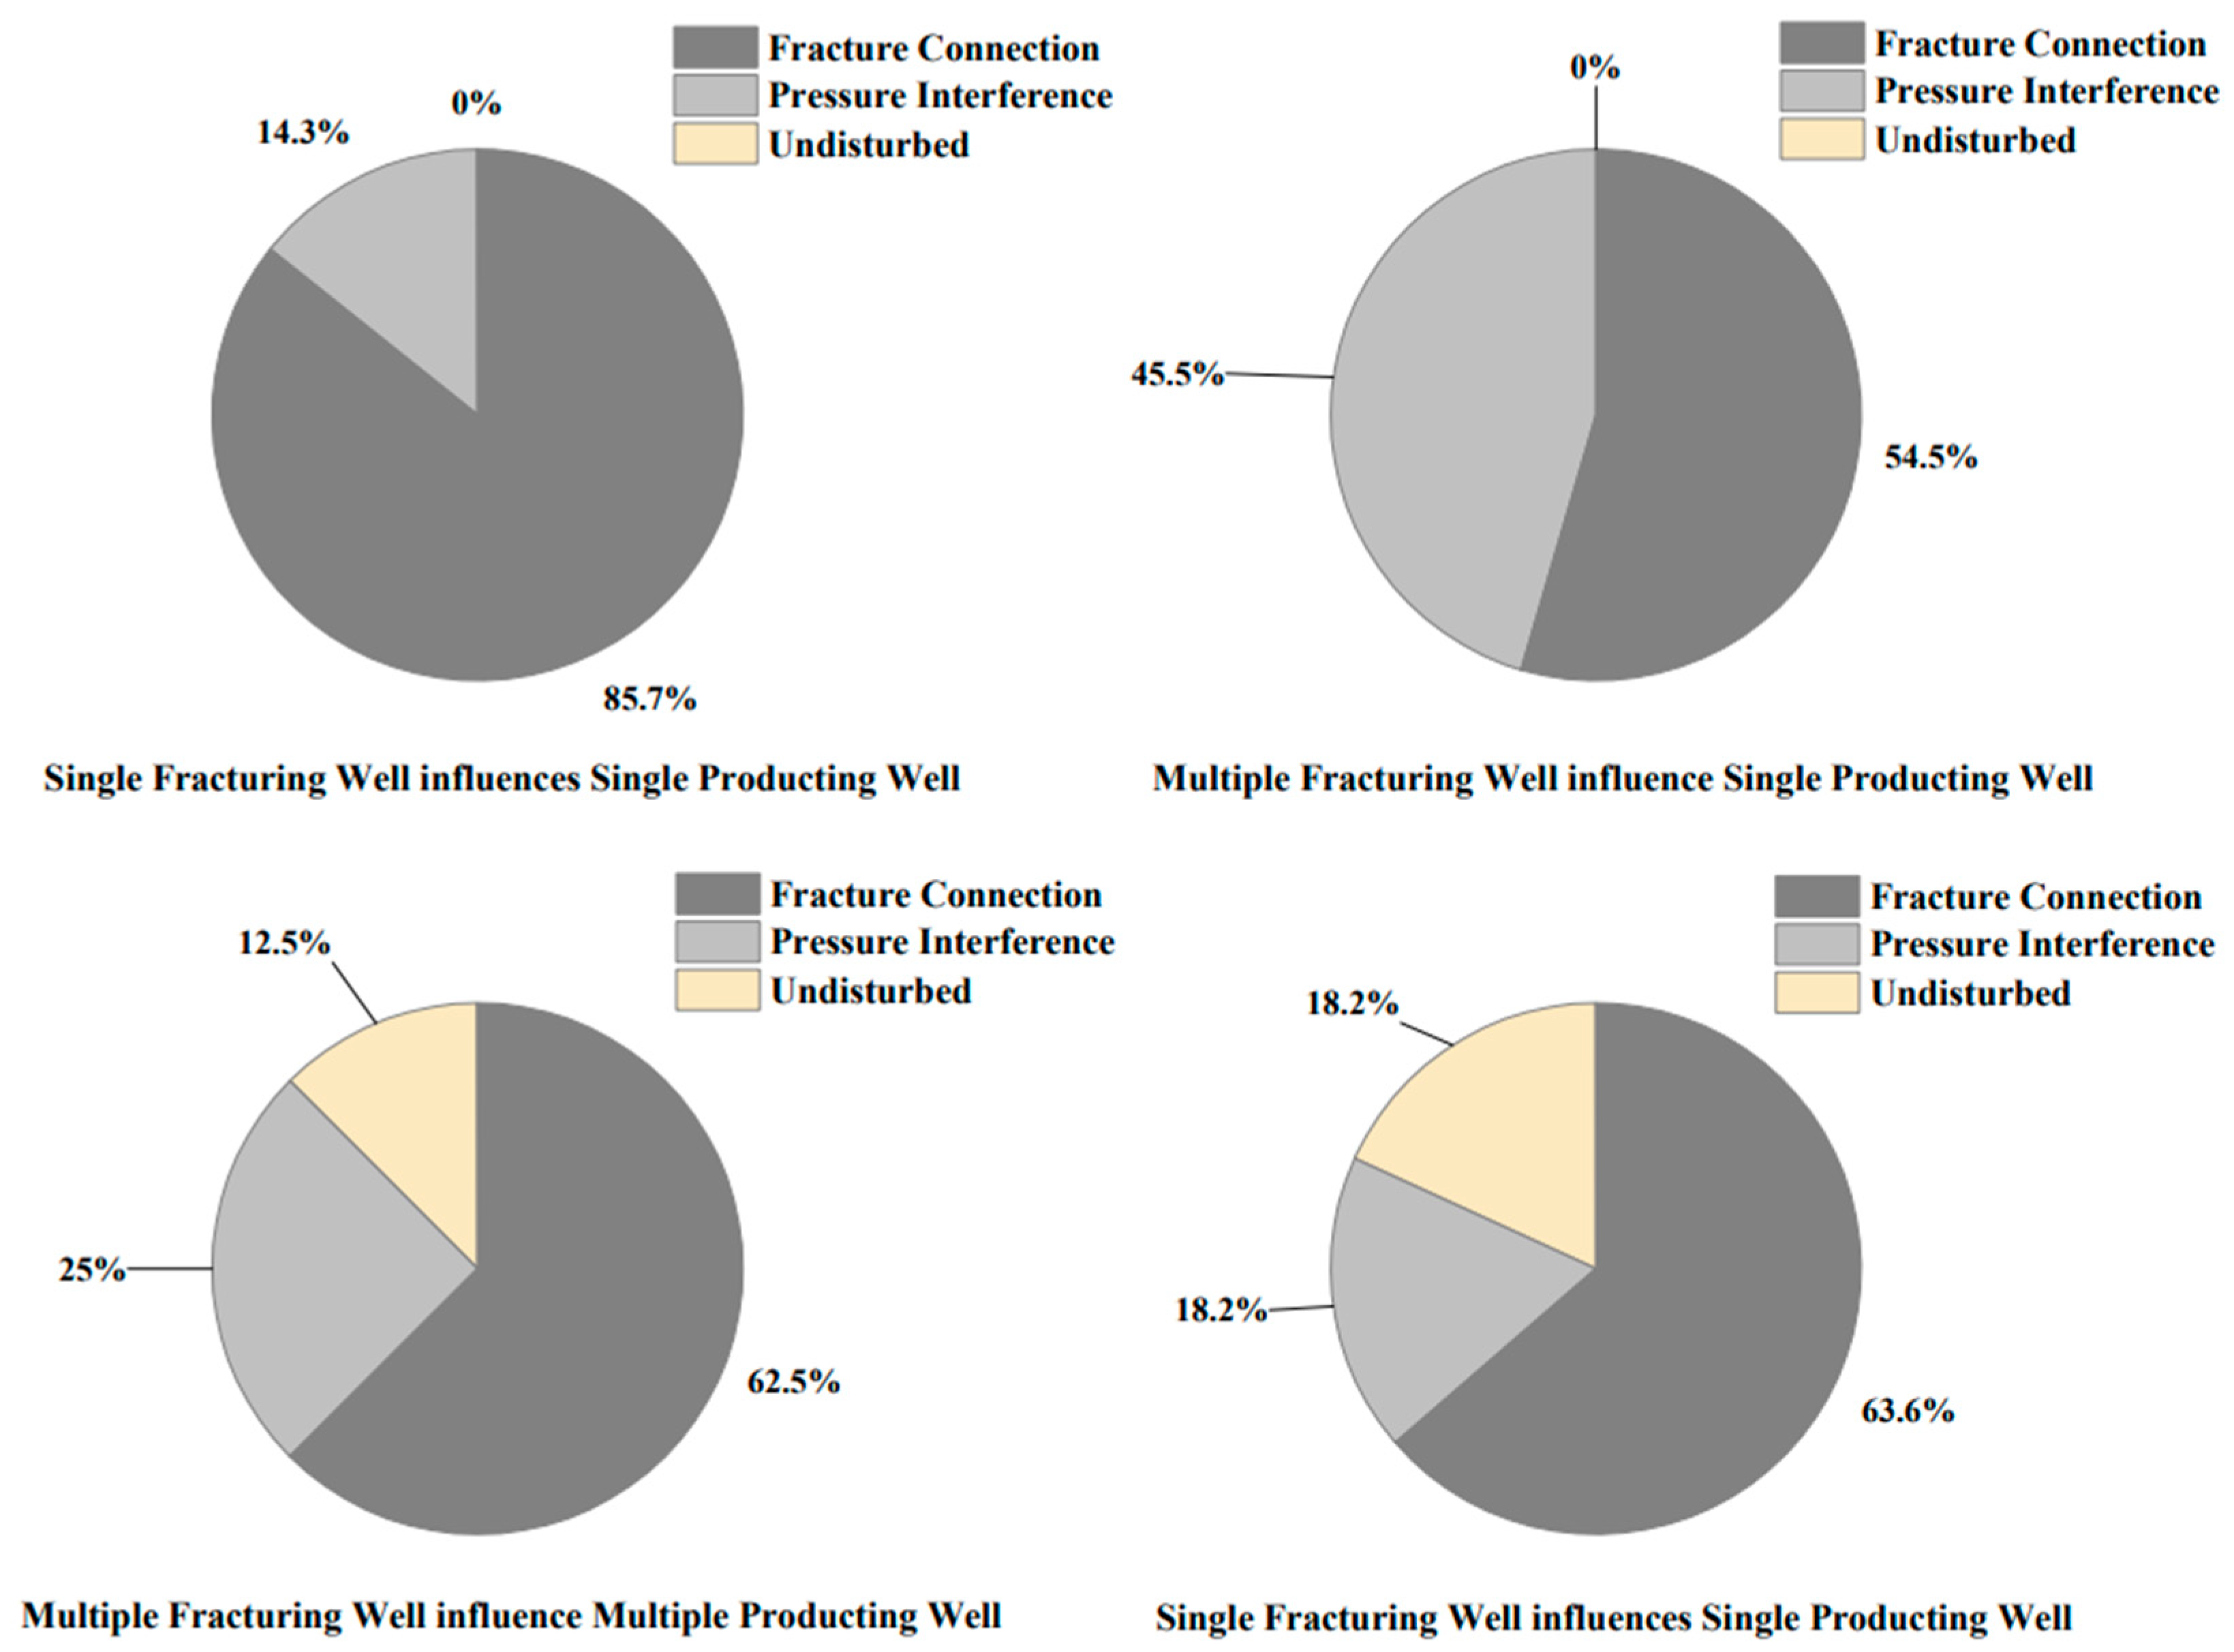
In the first two sections, a qualitative analysis was conducted on the typical fracturing disturbance events in the Mahu 18 block during the production well disturbance period, focusing on the liquid performance and pressure change trend. Based on the typical characteristics of different fracturing disturbance types, the fracturing disturbance events in the Mahu 18 block were analyzed individually, and the corresponding fracturing disturbance types were finally obtained.
According to the statistical results, the proportions of each type of fracturing disturbance are listed separately, as shown in Figure 9. It can be seen that the overall type of fracturing disturbance in the Mahu 18 block is mainly the fracture communication type. After analyzing the four types of fracturing disturbance events separately, it can be concluded that in the case of a single fracturing well affecting a single producting well in the Mahu 18 block, fracture communication disturbance is the most severe and needs to be focused on. When there are single or multiple fracturing wells around multiple production wells, there are multiple pressure systems in the formation, and with sufficient well spacing, the impact of pressure waves from fracking wells is transmitted in the direction of individual production wells, which equates to energy being absorbed by multiple wells collectively, rather than impacting only a single well. Therefore, there exists a certain chance that it will not be disturbed.
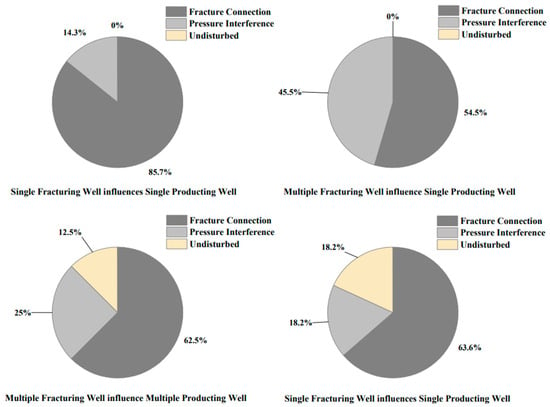
Figure 9.
Proportion of four types of fracturing in Mahu 18 block.
4. Quantitative Evaluation of the Impact of Fracturing Disturbance
4.1. Calculation Method
Ajani [9] proposed a quantitative disturbance identification method based on the impact of production capacity when studying the inter-well fracturing disturbance in the Woodford shale gas field, which can be used to quantify the production loss of production wells. Subsequently, Liu [3] improved the Ajani method, to quantify the degree of disturbance based on the pressure and water production changes during the production well being disturbed, but did not quantify the oil production used to characterize production capacity and the liquid production used to characterize comprehensive production. Therefore, the following text further improves the Ajani method by quantifying the impact of different types of fracturing disturbances on production wells from multiple perspectives, which are mainly from four aspects: pressure, water production, liquid production, and oil production.
- (1)
- Pressure influence degree:
Based on the pressure decrease of the production well 30 days before disturbance, the pressure reduction rate of the well during the disturbance period is compared to identify the impact of fracturing disturbance. The difference between the predicted value and the actual pressure represents the disturbance, and the pressure increase and decrease amplitude is calculated using a formula to quantify the disturbance.
① Pressure decrease rate calculation:
where Dc is the rate of pressure decrease, MPa/d; Pj is the selected pressure, MPa; Pa is the average pressure at the selected time, MPa; tj is the corresponding time; j is the production day after fracturing, with values ranging from 1 to 30; and ta is the average time, d.
② Predictive pressure calculation:
where pt is the predicted pressure, MPa; tf is the time corresponding to the predicted pressure, d; and po is the highest pressure 30 days before fracturing, MPa.
③ Pressure influence degree calculation:
where Δp is the increase or decrease in pressure, MPa; pa is the actual pressure after interference, MPa; and pt is the predicted pressure after interference, MPa.
- (2)
- Production influence degree calculation:
The degree of impact on production mainly includes daily water production, daily liquid production, and daily oil production. Based on the daily production of the production well 30 days before disturbance, the impact of pressure fracturing on the well is evaluated by comparing the daily production of the disturbed well during the new well fracturing period. The ratio of daily average production during disturbance to daily average production before disturbance is calculated to quantify the impact of new well fracturing disturbance on the production of the disturbed old well. The degree of influence of daily water production, daily liquid production, and daily oil production is calculated as follows:
where Δ(w,l,o) is the degree of influence on daily production, dimensionless; q(w,l,o)i is the daily production of the production well 30 days before being disturbed by fracturing, m3; q(w,l,o)j is the actual daily production after fracturing, m3; t is the cumulative time of fracturing, d; and i is the production days before fracturing, with values ranging from 1 to 30.
4.2. Calculation Result
Selecting some production wells with continuous production data from the statistical fracturing disturbance events for quantitative evaluation, the calculation results are shown in Table 2.

Table 2.
Some typical examples of tampering influence degree calculation results.
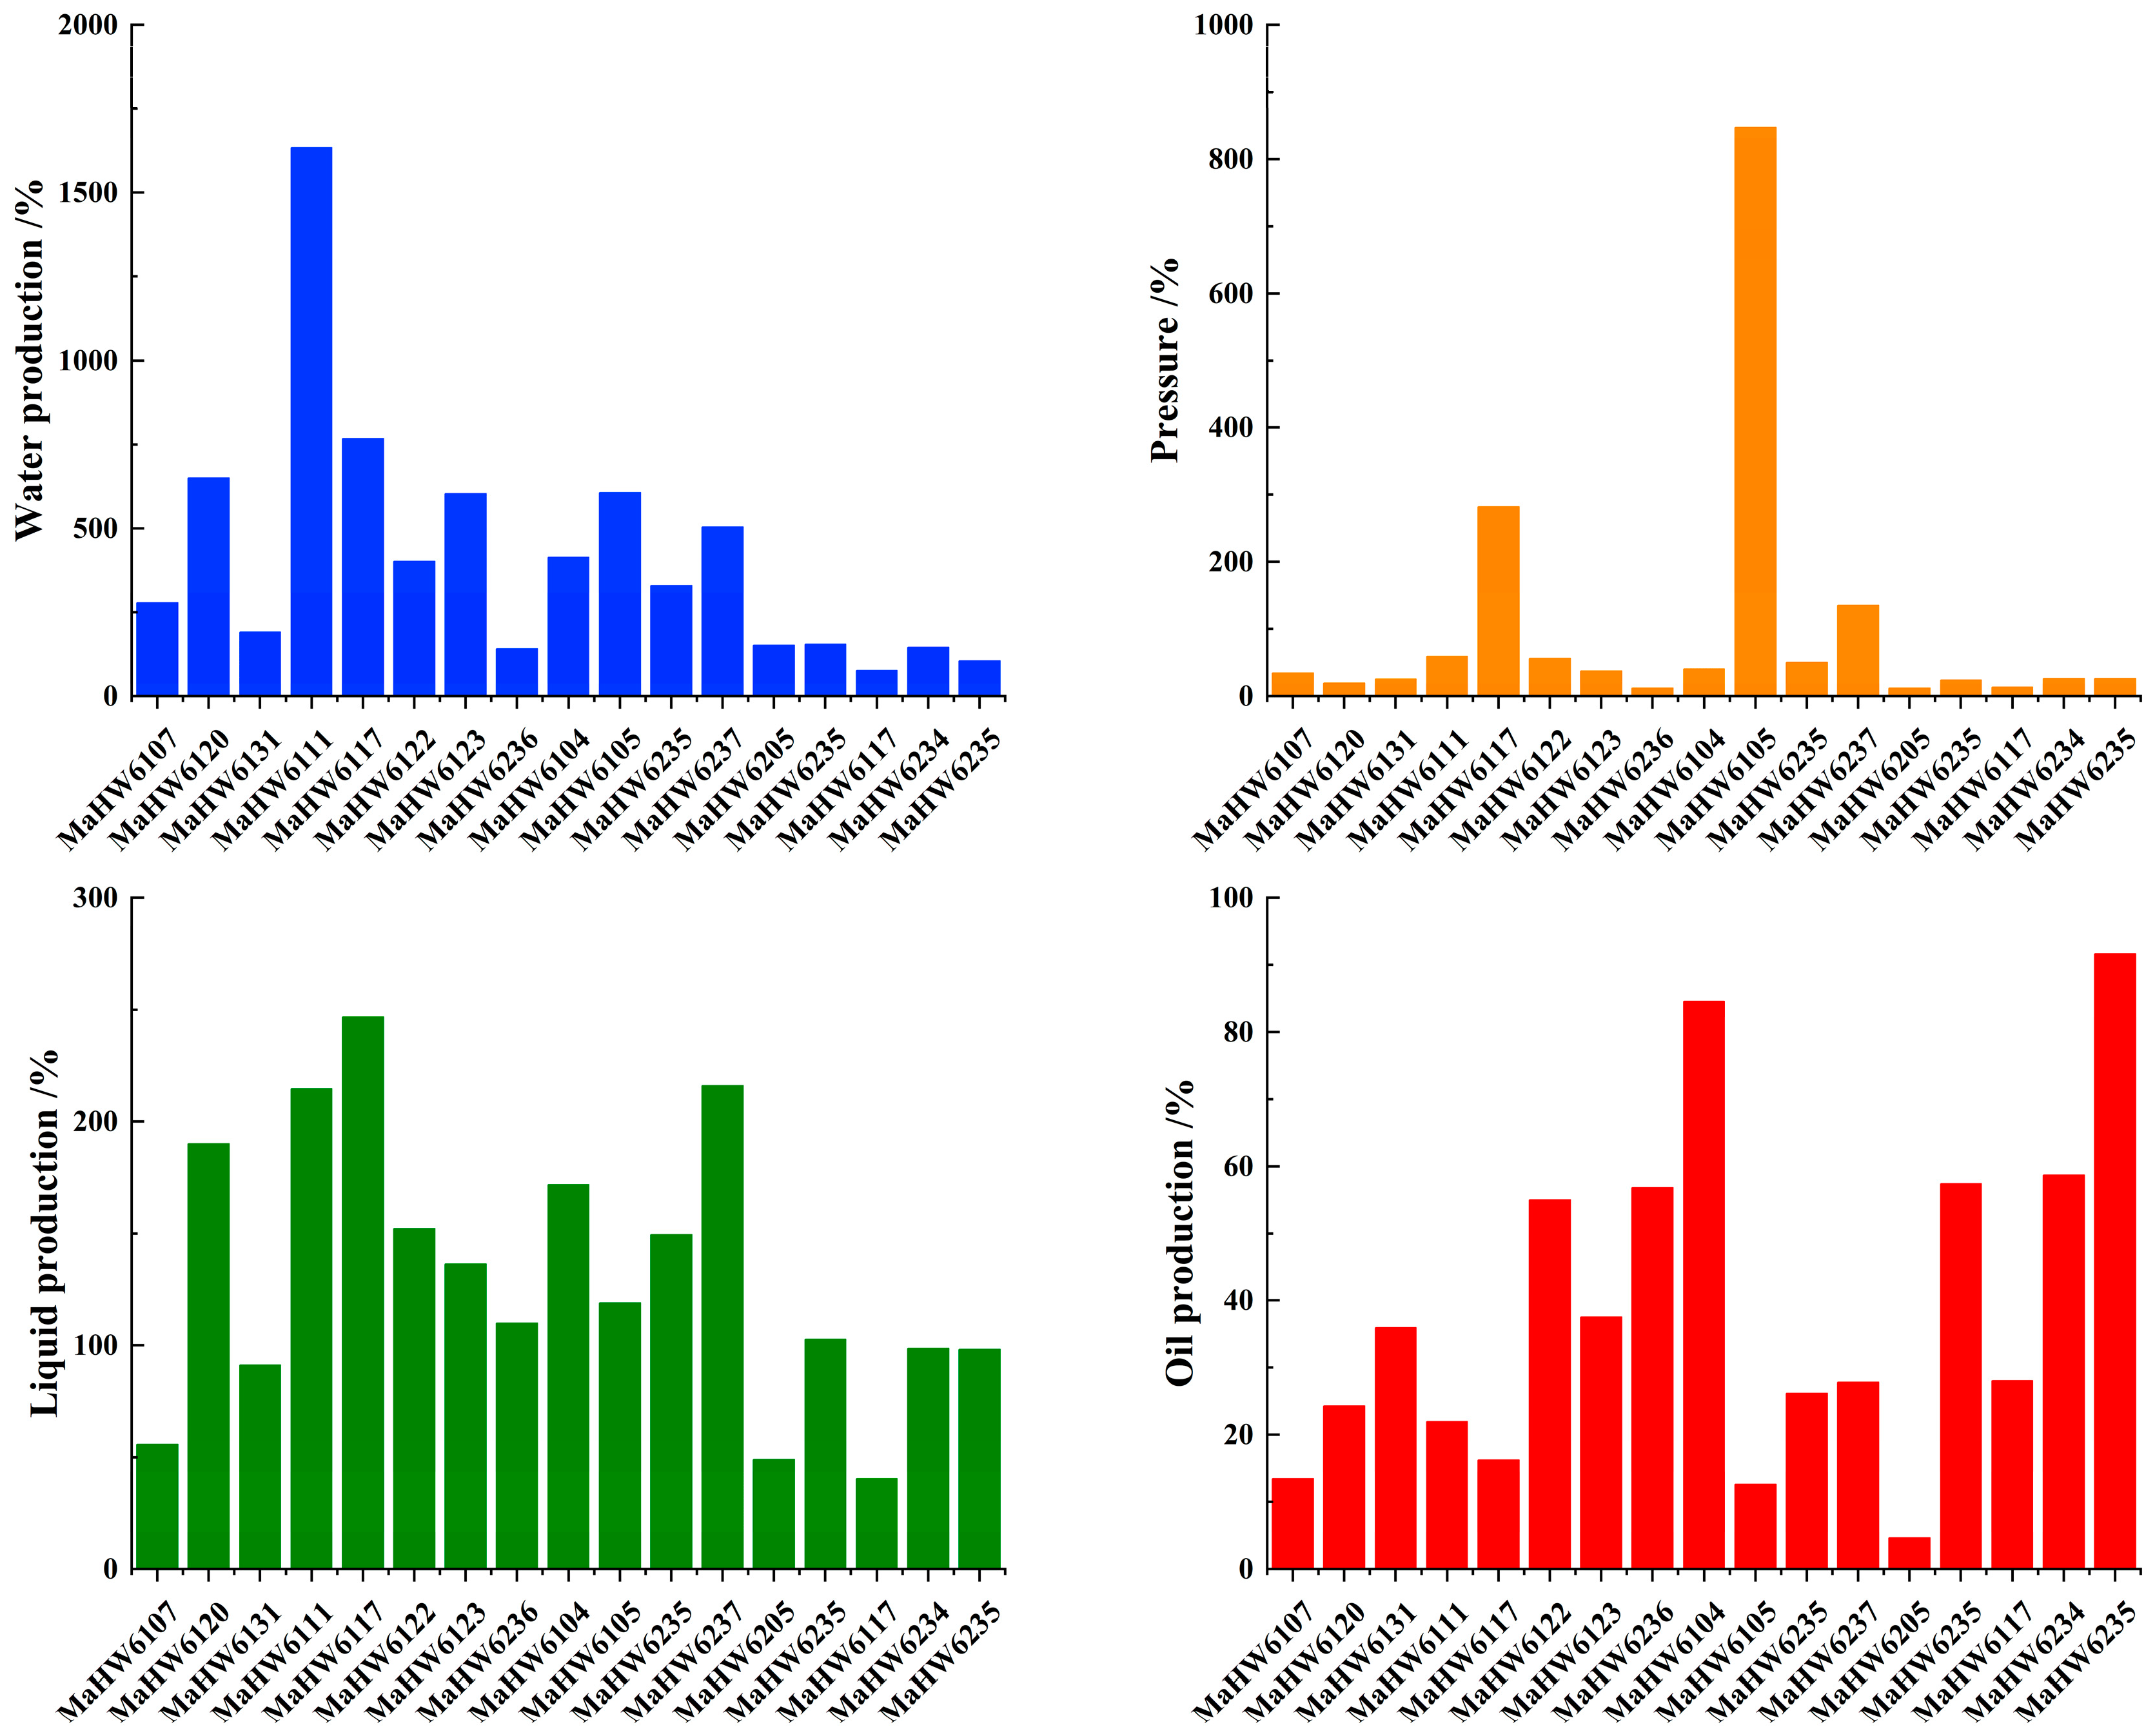
According to the calculation results of the appeal, the schematics in Figure 10 show the degree of impact of different types of fracturing disturbance on water production, pressure, liquid production, and oil production. The analysis shows that:
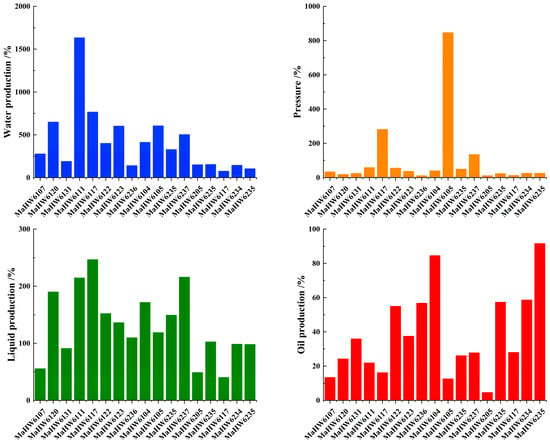
Figure 10.
Quantitative evaluation of different types of fracturing disturbance and the degree of disturbance in the Mahu 18 block without disturbance.
① Water and liquid production: Compared to the pressure wave interference type of disturbance, fracture communication disturbance is more likely to cause a sharp increase in liquid and water production in production wells, especially regarding the impact of fluid production; the influence of the fracture communication type of disturbance is more significant.
② Pressure: Due to the formation of a direct flow channel with the disturbed well, the impact of the fracture communication type of fracturing disturbance on pressure is generally higher than that of the pressure wave disturbance type.
③ Oil production: Both types of fracturing disturbance can hurt oil production, especially in fracture communication disturbance, which has a negative impact of 100%. However, the impact on oil production in some wells is relatively tiny for pressure wave communication.
Taking into account the impact of water production and pressure, the degree of disturbance from all disturbed wells can be divided into three levels:
- A-level (the impact of water production and pressure is more significant than 100%);
- B-level (with a water production impact more significant than 100% and a pressure impact less than 100%);
- C-level (pressure and oil production are less than 100% affected).
Interference level: A-level > B-level > C-level.
By comparing the hydraulic fracturing disturbance under three levels of disturbance (Figure 11), it can be concluded that the Mahu 18 block has more and more disturbance wells. The quantitative evaluation involved 17 disturbed wells, with most being B-level and a small number being A-level. The impact of the fracture communication type of fracturing disturbance is much more significant than that of the pressure wave disturbance type.

Figure 11.
The proportion of different fracturing disturbance types and the level of disturbance in the Mahu 18 block.
5. Conclusions
A multi-well complex fracturing disturbance evaluation method was established based on the tight reservoir in the Mahu 18 block. Firstly, based on the relationship between the number of disturbed wells and the number of fractured wells, the basic types of typical horizontal well fracturing disturbance events in the block were classified. Then, qualitative analysis was conducted on these fracturing disturbance events, and finally, the degree of impact of different types of fracturing disturbance was quantified. The conclusions reached are as follows:
(1) By analyzing the characteristics of fluid production and pressure changes at the wellhead of the production well, it is concluded that there are two main types of fracturing disturbance in the Mahu 18 block, namely the fracture communication type and the pressure wave disturbance type formed by the formation of inter-well communication through the reservoir matrix. The fracturing disturbance dominated by fracture communication can cause serious water channeling to the production well through the direct connection of inter-well fractures, leading to a surge in water production. This type of fracturing disturbance often has a serious negative impact on the production well.
(2) On the basis of the qualitative classification of fracturing disturbance events in the Mahu 18 block, the pressure and production (water production, liquid production, oil production) in the production dynamic response characteristics of the disturbed wells during the fracturing disturbance period were used as evaluation indicators to quantify the impact of different types of fracturing disturbance from multiple perspectives. Finally, the conclusion was drawn that the Mahu 18 block has more and more disturbance wells; A total of 17 disturbed wells were used for quantitative evaluation, with most being B-level and a small number being A-level; the impact of the fracture communication type of fracturing disturbance is much greater than that of the pressure wave disturbance type.
Author Contributions
Conceptualization, X.M.; Methodology, J.L., Q.W. and X.M.; Formal analysis, J.L. and Q.W.; Investigation, J.L. and Q.W.; Resources, X.H., Y.J., Y.L., J.Z., X.C., F.C. and L.W.; Data curation, X.H., J.L., Y.J. and Y.L.; Writing—original draft, J.L.; Writing—review & editing, X.H., Q.W. and X.M.; Supervision, X.H., Y.J., Y.L. and X.M.; Project administration, X.H., Y.L., J.Z., X.C., F.C. and L.W.; Funding acquisition, X.H. All authors have read and agreed to the published version of the manuscript.
Funding
This research received no external funding.
Data Availability Statement
The original contributions presented in the study are included in the article, further inquiries can be directed to the corresponding author.
Conflicts of Interest
Authors Xianzhu Han, Yongjun Ji, Yang Liu, Jizhuo Zhang, Xianjiang Chen, Fushan Cheng and Lifeng Wang were employed by the company PetroChina. The remaining authors declare that the research was conducted in the absence of any commercial or financial relationships that could be construed as a potential conflict of interest.
References
- Mayerhofer, M.J.; Lolon, E.P.; Warpinski, N.R.; Cipolla, C.L.; Walser, D.; Rightmire, C.M. What Is Stimulated Reservoir Volume? SPE Prod. Oper. 2010, 25, 89–98. [Google Scholar] [CrossRef]
- Wei, H.F.; Fan, Z.Y.; Yuan, X.C. Review on New Advances in Foreign Tight oil Development Technology and their Enlightenment. Pet. Geol. Recovery Effic. 2013, 20, 62–66. [Google Scholar]
- Liu, F.Y. The Influenee of Quantitative Analysis of Adjacent Fracturing Well on the Production of Shale Gas Wells. J. Yangtze Univ. (Nat. Sci. Ed.) 2018, 15, 60–63. [Google Scholar]
- Sardinha, C.M.; Petr, C.; Lehmann, J.; Pyecroft, J.F.; Merkle, S. Determining Interwell Connectivity and Reservoir Complexity through Frac Pressure Hits and Production Interference Analysis. In Proceedings of the SPE/CSUR Unconventional Resources Conference, Calgary, AB, Canada, 30 September–2 October 2014. [Google Scholar]
- Molina, O.M. Analytical Model to Estimate the Fraction of Frac Hits in Multi-well Pads. In Proceedings of the SPE/AAPG/SEG Unconventional Resources Technology Conference, Denver, CO, USA, 22–24 July 2019. [Google Scholar]
- Al-Rbeawi, S. An Approach for the Performance-impact of Parent-child Wellbores Spacing and Hydraulic Fractures Cluster Spacing in Conventional and Unconventional Reservoirs. J. Pet. Sci. Eng. 2020, 185, 106570. [Google Scholar] [CrossRef]
- Feng, M.; Hu, G.W.; Ding, X.L.; Liu, H.; Hu, Z.; Lu, D. Well Interference Analysis during Horizontal Well Fracturing of Dense Reservoirs in Jimusar Sag. Pet. Geol. Eng. 2018, 32, 108–110. [Google Scholar]
- Agarwal, R.G. Direct Method of Estimating Average Reservoir Pressure for Flowing Oil and Gas Wells. In Proceedings of the SPE Annual Technical Conference and Exhibition, Florence, Italy, 19–22 September 2010. [Google Scholar]
- Ajani, A.; Kelkar, M. Interference Study in Shale Plays. In Proceedings of the SPE Hydraulic Fracturing Technology Conference, The Woodlands, TX, USA, 6–8 February 2012. [Google Scholar]
- Kurtoglu, B.; Salman, A. How to Utilize Hydraulic Fracture Interference to Improve Unconventional Development. In Proceedings of the Abu Dhabi International Petroleum Exhibition and Conference, Abu Dhabi, United Arab Emirates, 9–12 November 2015. [Google Scholar]
- Taghavinejad, A.; Sharifi, M. Investigation of Rock Properties Distribution Effect on Pressure Transient Analysis of Naturally Fractured Reservoirs. J. Pet. Sci. Eng. 2021, 204, 108714. [Google Scholar] [CrossRef]
Disclaimer/Publisher’s Note: The statements, opinions and data contained in all publications are solely those of the individual author(s) and contributor(s) and not of MDPI and/or the editor(s). MDPI and/or the editor(s) disclaim responsibility for any injury to people or property resulting from any ideas, methods, instructions or products referred to in the content. |
© 2024 by the authors. Licensee MDPI, Basel, Switzerland. This article is an open access article distributed under the terms and conditions of the Creative Commons Attribution (CC BY) license (https://creativecommons.org/licenses/by/4.0/).

