Article

Optimal Configuration Method of Primary and Secondary Integrated Intelligent Switches in the Active Distribution Network Considering Comprehensive Fault Observability

1
Electric Power Research Institute of Yunnan Electric Power Grid Co., Ltd., Kunming 650217, China
2
The Key Laboratory of Smart Grid of Ministry of Education, Tianjin University, Tianjin 300072, China
*
Author to whom correspondence should be addressed.
Energies 2024, 17(16), 3945; https://doi.org/10.3390/en17163945
Submission received: 5 July 2024 / Revised: 3 August 2024 / Accepted: 5 August 2024 / Published: 9 August 2024
(This article belongs to the Section A1: Smart Grids and Microgrids)

Abstract

:
As the demand for power supply stability and reliability in the active distribution network (ADN) increases, the primary and secondary integrated intelligent switch (PSIIS) has become the primary choice for smart grid transformation in many weak infrastructure areas. However, the number of PSIISs that can be configured is often limited. It is necessary to comprehensively utilize the measurement data and sectional capabilities of PSIISs through the optimal configuration method to find the optimal configuration scheme. Therefore, fault observability-related indexes (FORIs) are proposed based on the functional characteristics of PSIISs. These indexes include fault type observability, fault location observability, fault current distribution characteristics observability, transition resistance observability, and weak infrastructure area observability. An optimization configuration model of PSIISs considering the comprehensive fault observability (CFO) is constructed. The adaptive genetic algorithm (AGA) is selected as the model-solving method. Subsequently, an optimal configuration method of PSIISs considering CFO is proposed. Finally, an example analysis is conducted in MATLAB to verify the effectiveness and feasibility of the proposed method. This optimal configuration method aims to maximize the use of a limited number of PSIISs by considering CFO, and the AGA proves to be an effective tool in solving the optimal configuration scheme.

1. Introduction

As the demand for power supply stability and reliability in the active distribution network (ADN) increases, the integration of primary and secondary distribution network equipment has become an inevitable industry trend, and the primary and secondary integrated intelligent switch (PSIIS) has also become the primary choice for the smart grid transformation in many weak infrastructure areas [1,2]. PSIISs combine the functions of measuring devices and sectional switches. PSIISs can measure and upload electrical data and fault information after a distribution network (DN) fault occurs. Simultaneously, PSIISs can receive open or close commands, identify fault sections, and achieve rapid fault isolation. The uploaded electrical data and fault information can also be used for fault tracing and inversion in the ADN, identifying the causes of faults and troubleshooting vulnerabilities. This process can enhance the operational reliability of the ADN and strengthen infrastructure development in weak infrastructure areas.
However, when installing PSIISs in the ADN, economic and technological constraints often limit comprehensive installation at all necessary points. Instead, installation is typically limited to selected positions and a limited number of PSIISs. Therefore, it is necessary to identify the optimal configuration scheme of PSIISs under economic and technical constraints through optimization methods.
Research on the traditional optimal configuration of DN devices can be categorized into two main categories based on different optimization objects and objectives. The first category involves the optimal configuration method for measuring devices, such as phasor measurement units (PMUs) [3] and harmonic measuring devices [4], primarily aimed at online monitoring and analysis. The optimization objectives typically include enhancing system observability, state estimation, redundancy, and related factors. Considering the uncertainty of the parameter values of different types of components in the power system, Reference [5] defined and quantified the resonance observability index and the observability–cost trade-off factor and proposed an optimal configuration method for potential parallel harmonic resonance monitoring points in the power system. Taking into account the various operation modes of DN reconfiguration, Reference [6] proposed a configuration optimization method for micro-phasor measurement units (μPMUs). Configuration nodes for various operation modes are evaluated by K-means grouping according to the shortest distance, improving the state estimation accuracy for each DN operation mode. Reference [7] proposed a voltage sag state estimation method based on the similarity coefficient of voltage sag frequency to simplify the state estimation process. An optimal configuration model is constructed with the constraint of voltage sag panoramic observability, aiming for the lowest configuration cost and the maximum similarity of voltage sag characteristics in configuration schemes. Reference [8] established a mathematical model with the minimum number of device configurations as the objective function, ultimately obtaining the optimal configuration scheme based on redundancy evaluation.
The second category involves the optimization configuration method for distribution switches, such as interconnection switches and sectional switches. The goal of this configuration is generally to support the functionality of the DN and to enhance its operational capabilities, including reliability, flexibility, and other operational abilities. The optimization objectives typically encompass power supply reliability, resilience, self-healing capability, outage duration, and similar factors. Considering the investment cost of equipment and the differentiated reliability requirements of users, Reference [9] established a mixed-integer linear programming model for the unified optimal allocation of multiple pieces of equipment in DNs. Reference [10] analyzed the calculation method of user outage time in different fault scenarios of DNs and proposed an optimal configuration model for DN sectional switches and automatic terminal devices, considering branch lines with the goal of optimal economy. Reference [11] described the analysis process and quantitative method for DN resilience and established a mixed-integer linear programming model for optimizing the configuration of DN switches to maximize the resilience index. Reference [12] proposed an evaluation index for the self-healing ability of smart DNs and a block calculation method for load self-healing rate from the perspectives of self-healing time, user, and load. The interruption cost of power outages was added to the objective function of traditional switch optimization configuration, and a minimum self-healing rate constraint was included to construct an optimal configuration model for DN switches suitable for self-healing requirements.
With the development of fault location algorithms, the configuration methods for related devices have gradually gained attention. The concept of fault observability (FO) has been proposed by scholars, and some related research has been carried out. For the power quality monitor (PQM), Reference [13] defined the observability level index and proposed an optimal configuration method to minimize the cost of installing PQMs, reduce the number of fault identification blind spots, and maximize the FO level of the network. Considering the limitations of measurement equipment in distribution systems and the constraints of cost and data transmission capacity for limited μPMUs, Reference [14] proposed an optimal configuration strategy and solution algorithm for fault diagnosis and location based on limited μPMUs. Reference [15] defined fault location in the planning stage as the problem of FO in DNs and attributed the configuration problem of feeder terminal units (FTUs) to the problem of realizing observable meter configuration. An FO process was established using the breadth-first traversal method. Reference [16] analyzed the contribution rate of FTUs to the FO of DNs and defined the sum of the contribution rates of all configured FTUs in a system as the FO rate of the DN. An optimal configuration model for FTUs in DNs was proposed, taking the reliability and economy of power supply as constraints and maximizing the FO rate as the goal. Based on the principle of traveling wave double-ended positioning, Reference [17] proposed the observable index of the whole network fault. By taking the observability of the whole network fault as the constraint, a mathematical model with the minimum number of devices as the objective function was established, and an optimal configuration method for traveling wave positioning devices based on the observability of the whole network fault was proposed.
It can be observed from the current state of research on device optimization configuration methods that there is a lack of studies considering FO. In the existing literature, FO is typically understood as the observability of fault section location, which does not comprehensively account for fault information such as fault type, fault current, and transition resistance. Power system personnel require diverse fault information when tracing the causes of faults. Therefore, focusing solely on fault section location is not conducive to the monitoring and investigation of fault events in the ADN.
Current research primarily targets the configuration methods of measuring devices such as FTUs and PQMs, and there is a notable lack of research on the optimal configuration method of PSIISs. The integration of PSIISs represents a major development trend in the modern ADN. PSIISs combine the functions of measuring devices and sectional switches, allowing for the extraction of more detailed fault information.
Furthermore, weak infrastructure areas often exhibit large fault ranges and frequent power outages. During the intelligent transformation of the ADN in these areas, it is essential to consider more fault information characteristics and the typical features of weak infrastructure areas. This ensures more effective fault tracing and enhances the overall reliability and efficiency of the ADN.
Therefore, based on the characteristics of PSIISs, this paper considers the weak infrastructure areas of the ADN and the characteristics of various types of fault information, conducting an in-depth analysis of fault observability-related indexes (FORIs). Under the premise of configuring a limited number of PSIISs, the effective identification of multiple fault information in the ADN can be maximized through an optimal configuration method. The main contributions are summarized as follows:
(1) Based on the functional characteristics of PSIISs, five FORIs are proposed considering the fault information requirements of the ADN. These indexes include the fault type observability index (FTOI), the fault location observability index (FLOI), the fault current distribution characteristics observability index (FCDCOI), the transition resistance observability index (TROI), and the weak infrastructure area observability index (WIAOI). Using a linear weighting method, these five FORIs are transformed into the comprehensive fault observability index (CFOI).
(2) Based on comprehensive fault observability (CFO), an optimal configuration method for a limited number of PSIISs in the ADN is proposed. By maximizing CFOI as the objective and considering economic cost constraints, an optimal configuration model of PSIISs is constructed. The active genetic algorithm (AGA) is employed as the solution method. This optimal configuration method can be applied to PSIISs using any fault diagnosis method, providing an optimal configuration scheme for a limited number of PSIISs, enhancing the fault tracing and inversion capabilities of the ADN, and strengthening infrastructure development in weak infrastructure areas.
The structure of the paper is as follows. Section 2 presents five FORIs of the ADN based on the functional characteristics of PSIISs. These indexes include the FTO, FLOI, FCDCOI, TROI, and WIAOI. Section 3 presents an optimal configuration method of PSIISs in the ADN considering CFO. Using a linear weighting method, the five FORIs are integrated into CFOI. An optimal configuration model of PSIISs considering CFO is then constructed, with the AGA employed as the model-solving method. Section 4 conducts an example analysis to compare and validate the proposed optimal configuration method, demonstrating its validity and feasibility. Section 5 concludes the whole paper and describes the future work finally.

2. Definition of FORIs

The traditional definition of FO is generally defined as follows: If after a fault occurs in the DN, according to the measurement information of the switches, it can be determined that the fault is located in an area surrounded by several switches; the distribution network is then called fault observability [14]. In this section, the meaning of traditional FO is extended. Based on the functional characteristics of PSIISs, five FORIs are proposed and defined.
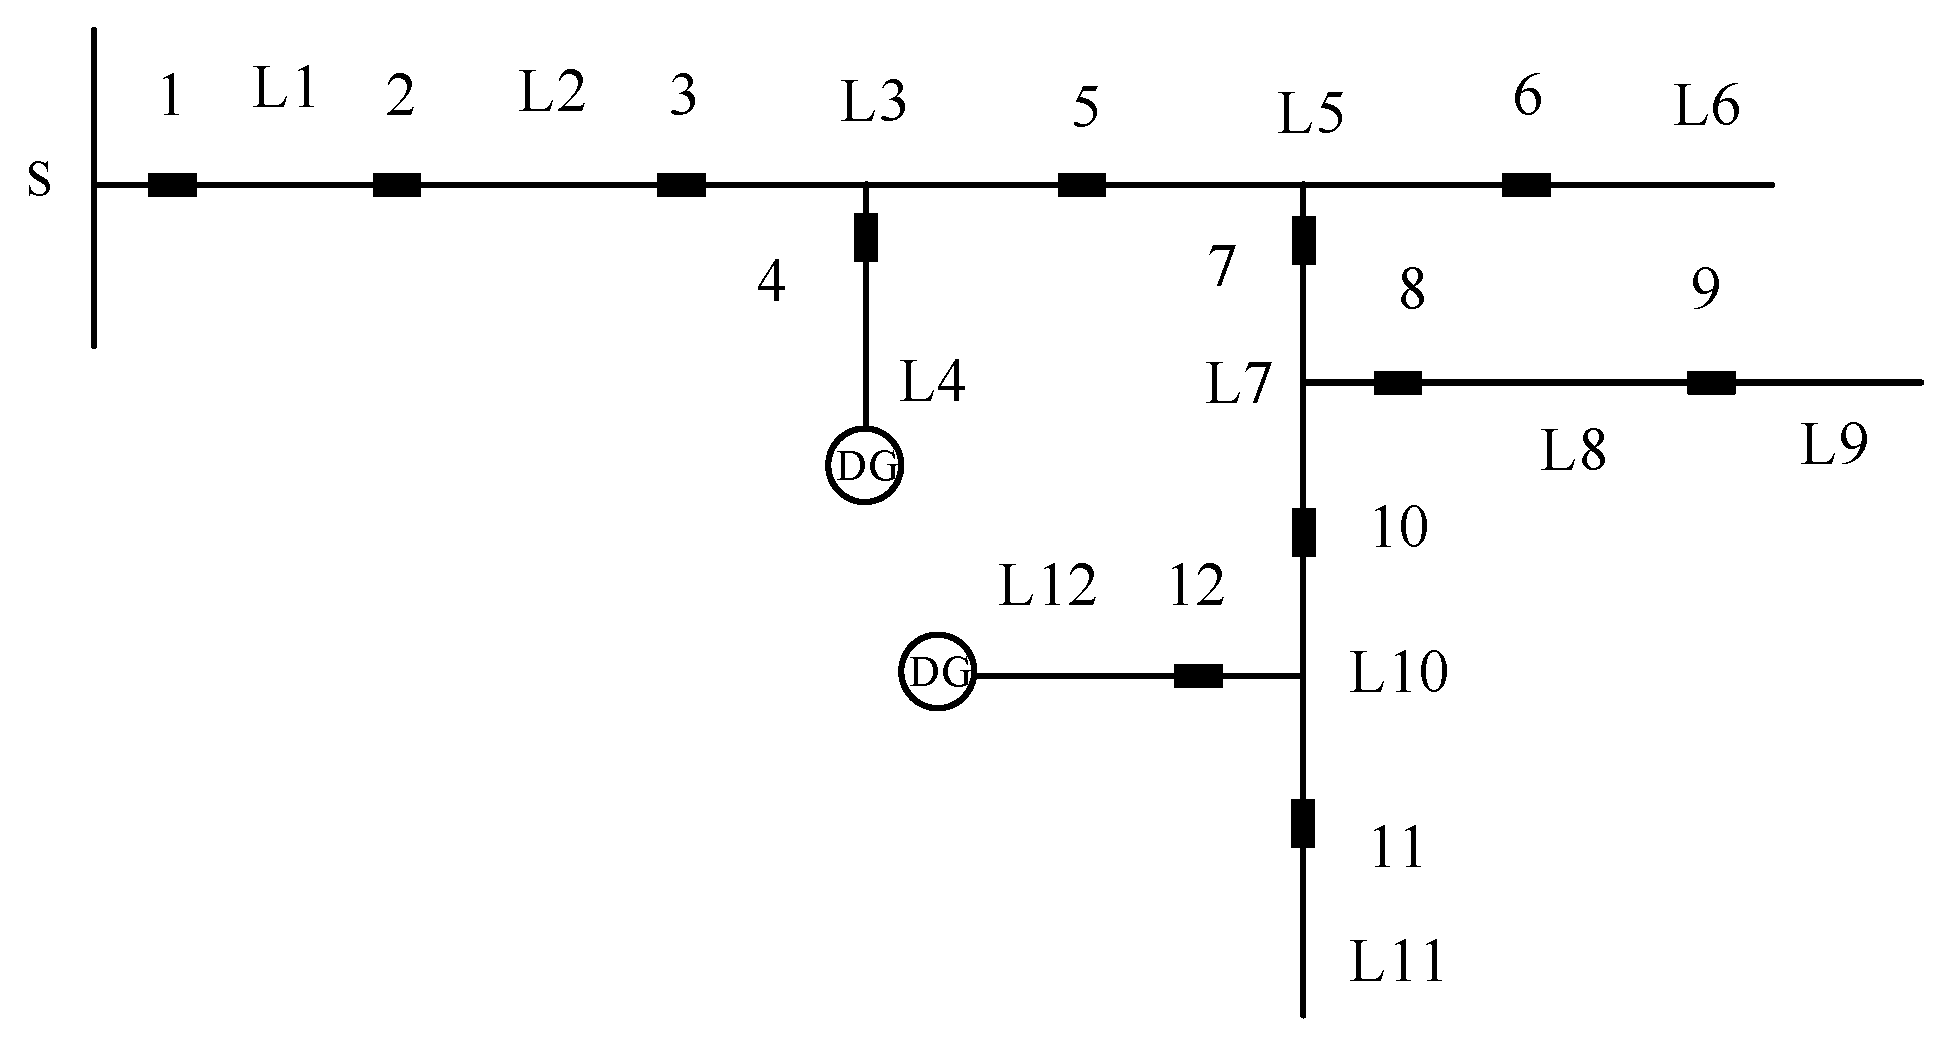
The structure of a simple radial ADN is shown in Figure 1. In the figure, nodes 1–11 represent the positions where PSIISs can be installed. An area enclosed by two PSIIS configuration positions or a terminal single-end PSIIS configuration position is considered a potential fault area. The line segments L 1 L 12 represent the potential fault areas. The number of nodes where PSIISs can be installed in the ADN is denoted as N Z , and the number of potential fault areas is denoted as N L .

2.1. Fault Type Observability (FTO)

PSIISs can collect three-phase voltage and current, as well as zero-sequence voltage and current. Based on these electrical quantities, the fault type can be determined. For example, if all surrounding nodes in the fault area are equipped with PSIISs, all types of faults occurring in the fault area can be effectively identified. Let μ t be the fault type determination effectiveness factor. μ t . i represents the fault type determination effectiveness factor when a fault occurs in the area L i . When a fault occurs in the area L i , if the fault type can be effectively detected by the intelligent switch at a certain node position, μ t . i is 1; otherwise, μ t . i is 0.
Let η t be FTOI. If PSIISs can effectively determine the fault type when a fault occurs in any area, η t is 1. Therefore, η t is defined as shown in Equation (1):
η t = i = 1 N L μ t . i N L

2.2. Fault Location Observability (FLO)

PSIISs can locate a fault section using a pre-set fault diagnosis method. For example, if all surrounding nodes in the fault area are equipped with PSIISs, the fault area can be effectively identified. As shown in Figure 1, when a fault occurs in the area L 3 and nodes 3, 4, and 5 are all equipped with PSIISs, the fault can be effectively determined to be in the area L 3 .
However, if the surrounding nodes in the fault area are not all equipped with PSIISs, the determined fault area will expand. For instance, in Figure 1, if a fault occurs in the area and only nodes 2 and 5 are equipped with PSIISs, the fault area will be determined as L 2 , L 3 , and L 4 . The fault area determined by the fault diagnosis method is defined as the fault diagnosis area.
Let μ f be the fault location determination effectiveness factor, defined as the ratio of the length of the actual fault occurrence area to the length of the fault diagnosis area, as shown in Equation (2).
μ f . i = l L i l Ω L i
where Ω L i represents the collection of the fault diagnosis area when a fault occurs in the area L i , l L i represents the total length of the line segments in the actual fault area L i , l Ω L i represents the length of the line segments in the fault diagnosis area Ω L i , and μ f . i represents the fault location determination effectiveness factor of the area L i .
Let η f be FLOI. If, when a fault occurs in any area L i , it can effectively determine that the fault diagnosis area is the area L i , η f is 1. The definition of η f is as shown in Equation (3):
η f = i = 1 N L μ f . i N L

2.3. Fault Current Distribution Characteristics Observability (FCDCO)

The fault current distribution characteristics of a node are defined as the magnitude and phase of the fault current passing through that node. Let μ I be the fault current observability factor. When a PSIIS is installed at a node, μ I of the node is 1. This node is defined as a directly observable node for fault current distribution characteristics, hereinafter referred to as a directly observable node.
Consider that some nodes can obtain the fault current distribution characteristics through calculation. These nodes are defined as indirectly observable nodes for fault current distribution characteristics, and μ I of these nodes is 1. For example, if a node is connected to a directly observable node, there are no other unknown branch lines within the connected area, and the line impedance is known, the magnitude and phase of the fault current can be calculated. Hence, this node is an indirectly observable node for fault current distribution characteristics, and μ I of this node is 1.
Let η I be FCDCO. If, when a fault occurs in any area, the magnitude and phase of the fault current can be obtained for all nodes, then η I is 1. The definition of η I is as shown in Equation (4).
η I = i = 1 N Z μ I . i N Z
where μ I . i represents the fault current observability factor of the node i .

2.4. Transition Resistance Observability (TRO)

The size of the transition resistance can affect the measurement and response of protective devices, having a significant impact on the reliability of distance protection and single-phase grounding protection. It is an important factor in fault tracing and inversion. Let μ r be the transition resistance judgment effectiveness factor. When a fault occurs in a certain area, if the PSIIS at a certain node can effectively detect the transition resistance, then μ r is 1; otherwise, μ r is 0.
Let η r be TROI. If, when a fault occurs in any area, there is an intelligent switch that can effectively determine the transition resistance, then η r is 1. The definition of η r is as shown in Equation (5).
η r = i = 1 N L μ r . i N L
where μ r . i represents the transition resistance judgment effectiveness factor when a fault occurs in the area L i .

2.5. Weak Infrastructure Area Observability (WIAO)

The operating environment of ADN is complex and variable, with different operating conditions of devices in different areas. The nature of the electricity usage and demand also vary, and some original areas face issues such as poor communication conditions, low automation rates, and incomplete electrical information. Under limited resource allocation, it is necessary to focus on areas with a weak infrastructure in the ADN. Based on the infrastructure configuration information and historical fault conditions of each line section, potential fault areas are classified, and weights are assigned to the nodes at both ends of different types of areas. Considering the importance of loads and the requirements of various loads for power supply reliability, the connected nodes are classified and then weighted accordingly.
Let p i be the weight of the node i , with an initial weight of 0 for all nodes. Based on the infrastructure configuration and historical fault frequency, potential fault areas are classified into three categories: areas with no faults, areas with past faults, and areas prone to faults. If a node is connected to an area with no faults, its weight remains unchanged. If a node is connected to an area with past faults, its weight increases by 1. If a node is connected to an area prone to faults, its weight increases by 2.
Regarding connected load nodes, loads are categorized from high to low based on their importance and requirements for power supply reliability into first-class loads, second-class loads, and third-class loads. If a node is connected to a first-class load, its weight increases by 3; if connected to a second-class load, its weight increases by 2; and if connected to a third-class load, its weight increases by 1.
Let η p be WIAOI in ADN, defined as shown in Equation (6).
η p = i = 1 N Z p i μ i i = 1 N Z p i
where μ i represents whether the node i is equipped with a PSIIS in the configuration scheme. If the node i is equipped with a PSIIS in the configuration scheme, μ i is 1; otherwise, μ i is 0.

3. Optimal Configuration Method of PSIISs Considering CFO

3.1. Optimal Configuration Model Considering CFO

(1) Objective function
Using the linear weighting method, five FORIs are transformed into the CFOI. Additionally, the CFOI is set to η , which is defined as shown in Equation (7).
η = k t η t + k f η f + k I η I + k r η r + k p η p k t + k f + k I + k r + k p = 1
where, k t , k f , k I , k r , and k p are the weights of FTOI η t , FLOI η f , FCDCOI η I , TROI η r , and WIAOI η p , respectively. These weights are set by relevant personnel based on their importance.
The objective function takes the maximum CFOI, as shown in Equation (8):
max η = k t η t + k f η f + k I η I + k r η r + k p η p
(2) Constraints
Constraint conditions consider economy. Due to the constraints of economic conditions, the number of PSIISs that can be installed is limited. In the specific optimization scheme configuration process, this number can be set according to the specific situation. The economic constraints are shown in Equation (9).
w Z i = 1 N Z μ i W
where w Z represents the cost of a single PSIIS, W represents the available economic cost, and i = 1 N Z μ i represents the number of PSIISs installed in the configuration scheme.
In summary, the optimal configuration mathematical model of PSIISs in the ADN considering CFO can be expressed as shown in Equation (10):
max η = k t η t + k f η f + k I η I + k r η r + k p η p s . t . w Z i = 1 N Z μ i W

3.2. Model-Solving Method of PSIISs Based on AGA

The optimal configuration mathematical model of PSIISs belongs to the realm of nonlinear integer programming problems. Due to the similarity between the switch sequence in the optimization configuration and the gene sequence of chromosomes, this paper selects the AGA to solve the optimization model.
The AGA is an improved genetic algorithm. It improves the global search ability and convergence speed of the algorithm by adaptively adjusting the genetic parameters of crossover probability and mutation probability [18].
(1) Population initialization
First, it is necessary to establish an initial population, where each configuration scheme is an individual, and each configuration scheme individual in the population is encoded with a string of binary numbers. Let Μ i represent a configuration scheme individual, and μ i indicate whether the node i is equipped with an intelligent switch. N Z represents the number of nodes. If a node is equipped with a PSIIS, μ i is 1; otherwise, μ i is 0. Thus, Μ i is as shown in Equation (11):
Μ i = μ 1 μ 2 μ 3 μ N Z
(2) Fitness function
The fitness function represents the performance quality required by each configuration scheme individual. The greater the fitness, the stronger the individual’s ability to survive in the process of natural selection. Based on the model optimization objective function, a fitness calculation function can be established. The comprehensive fault observability η of the ADN is the fitness of an individual, with a value range of [ 0 , 1 ] . The fitness function is shown in Equation (12):
η = k t η t + k f η f + k I η I + k r η r + k p η p
(3) Selection and replication
The selection and replication are to select high-fitness configuration scheme individuals from the population with a certain probability to form a new population, and to eliminate low-fitness configuration scheme individuals from the population. High-quality installation node positions can be directly retained for the next iteration, or new configuration scheme individuals generated by crossover can be retained for the next iteration.
Let η ( Μ i ) represent the fitness function value of a configuration scheme individual Μ i in the population, and η ( Μ i ) represent the sum of the fitness function values of all configuration scheme individuals in the population. The survival probability of each individual is η ( Μ i ) / η ( Μ i ) , and roulette selection is performed based on this.
(4) Crossover
Crossover refers to exchanging genes at one or more positions between two paired configuration scheme individuals based on the crossover probability to form two new configuration schemes.
This scheme adopts single-point crossover, where a point is randomly selected in the matrix of configuration scheme individuals Μ i , and the configuration scheme individuals are partially exchanged before or after this point to generate new configuration scheme individuals. The crossover probability is dynamically set to adaptively adjust with the fitness of individuals and the number of iterations, enhancing the global search capability of the AGA and avoiding local optima. The calculation formula is as shown in Equation (13).
P C = P C . max d D ( P C . max P C . min ) , max η ( Μ i ) > η avg P C . max , max η ( Μ i ) η avg
where P C represents the crossover probability, P C . max represents the maximum pre-set crossover probability, P C . min represents the minimum pre-set crossover probability, max η ( Μ i ) represents the larger value of the fitness of the two configuration scheme individuals involved in the crossover, η avg represents the average fitness of the configuration scheme individuals in the current population, D represents the maximum number of iterations, and d represents the current iteration number.
(5) Mutation
Mutation simulates gene mutation caused by some accidental factors in the natural genetic environment. Based on the mutation probability, the value of a gene in the encoding string of a configuration scheme individual is randomly inverted to form a new individual.
The mutation probability is dynamically set to vary with the fitness of individuals and the number of iterations. The calculation formula is as shown in Equation (14).
P M = P M . max d D ( P M . max P M . m i n ) , η ( Μ i ) > η avg P M . max , η ( Μ i ) η avg
where P M represents the mutation probability, P M . max represents the maximum pre-set mutation probability, and P M . min represents the minimum pre-set mutation probability.
(6) Termination conditions
When the fitness of the optimal configuration scheme individual and the total fitness of the population no longer increases, the iteration stops, and the optimal configuration scheme and its related fitness are output. Otherwise, when the number of iterations exceeds the pre-set maximum number of iterations, the algorithm terminates, and the current optimal configuration scheme and its related fitness are output. The termination condition criterion is as shown in Equation (15).
η ( Μ i ) d η ( Μ i ) d 1 + max η ( Μ i ) d max η ( Μ i ) d 1 ε o r   d D
where max η ( Μ i ) d represents the fitness of the optimal configuration scheme individual in the population at the d -th iteration, η ( Μ i ) d represents the total fitness of the population at the d -th iteration, and ε is a minimal value.
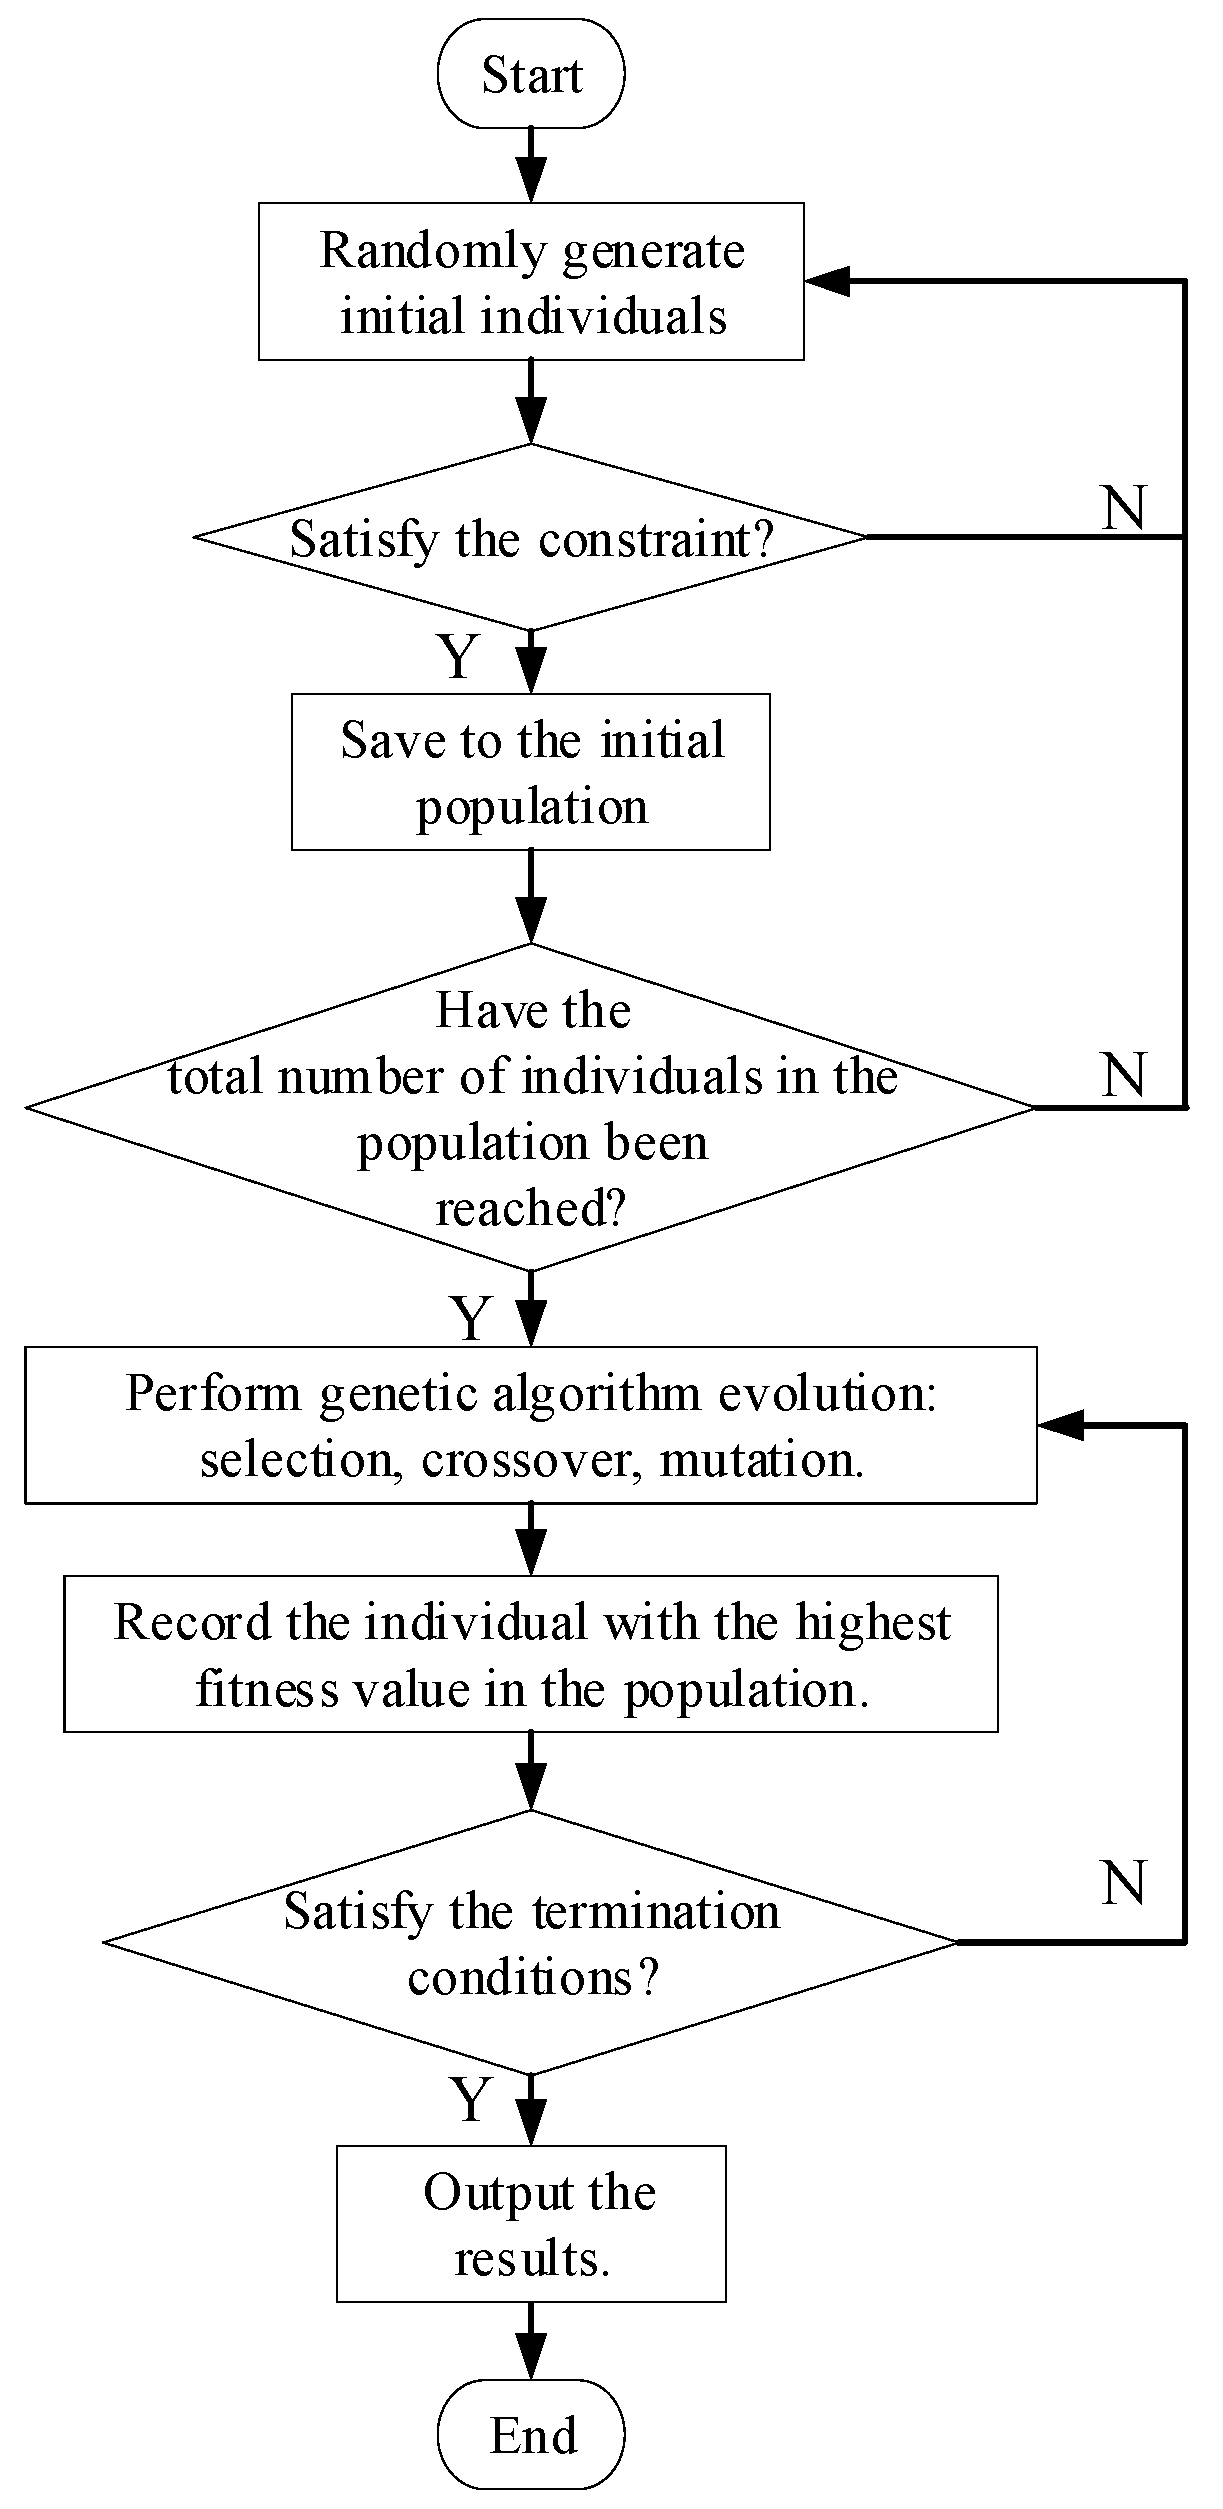
In summary, the flowchart for the optimization configuration of PSIISs is shown in Figure 2.

4. Example Analysis

4.1. Method Verification of Typical Scenario

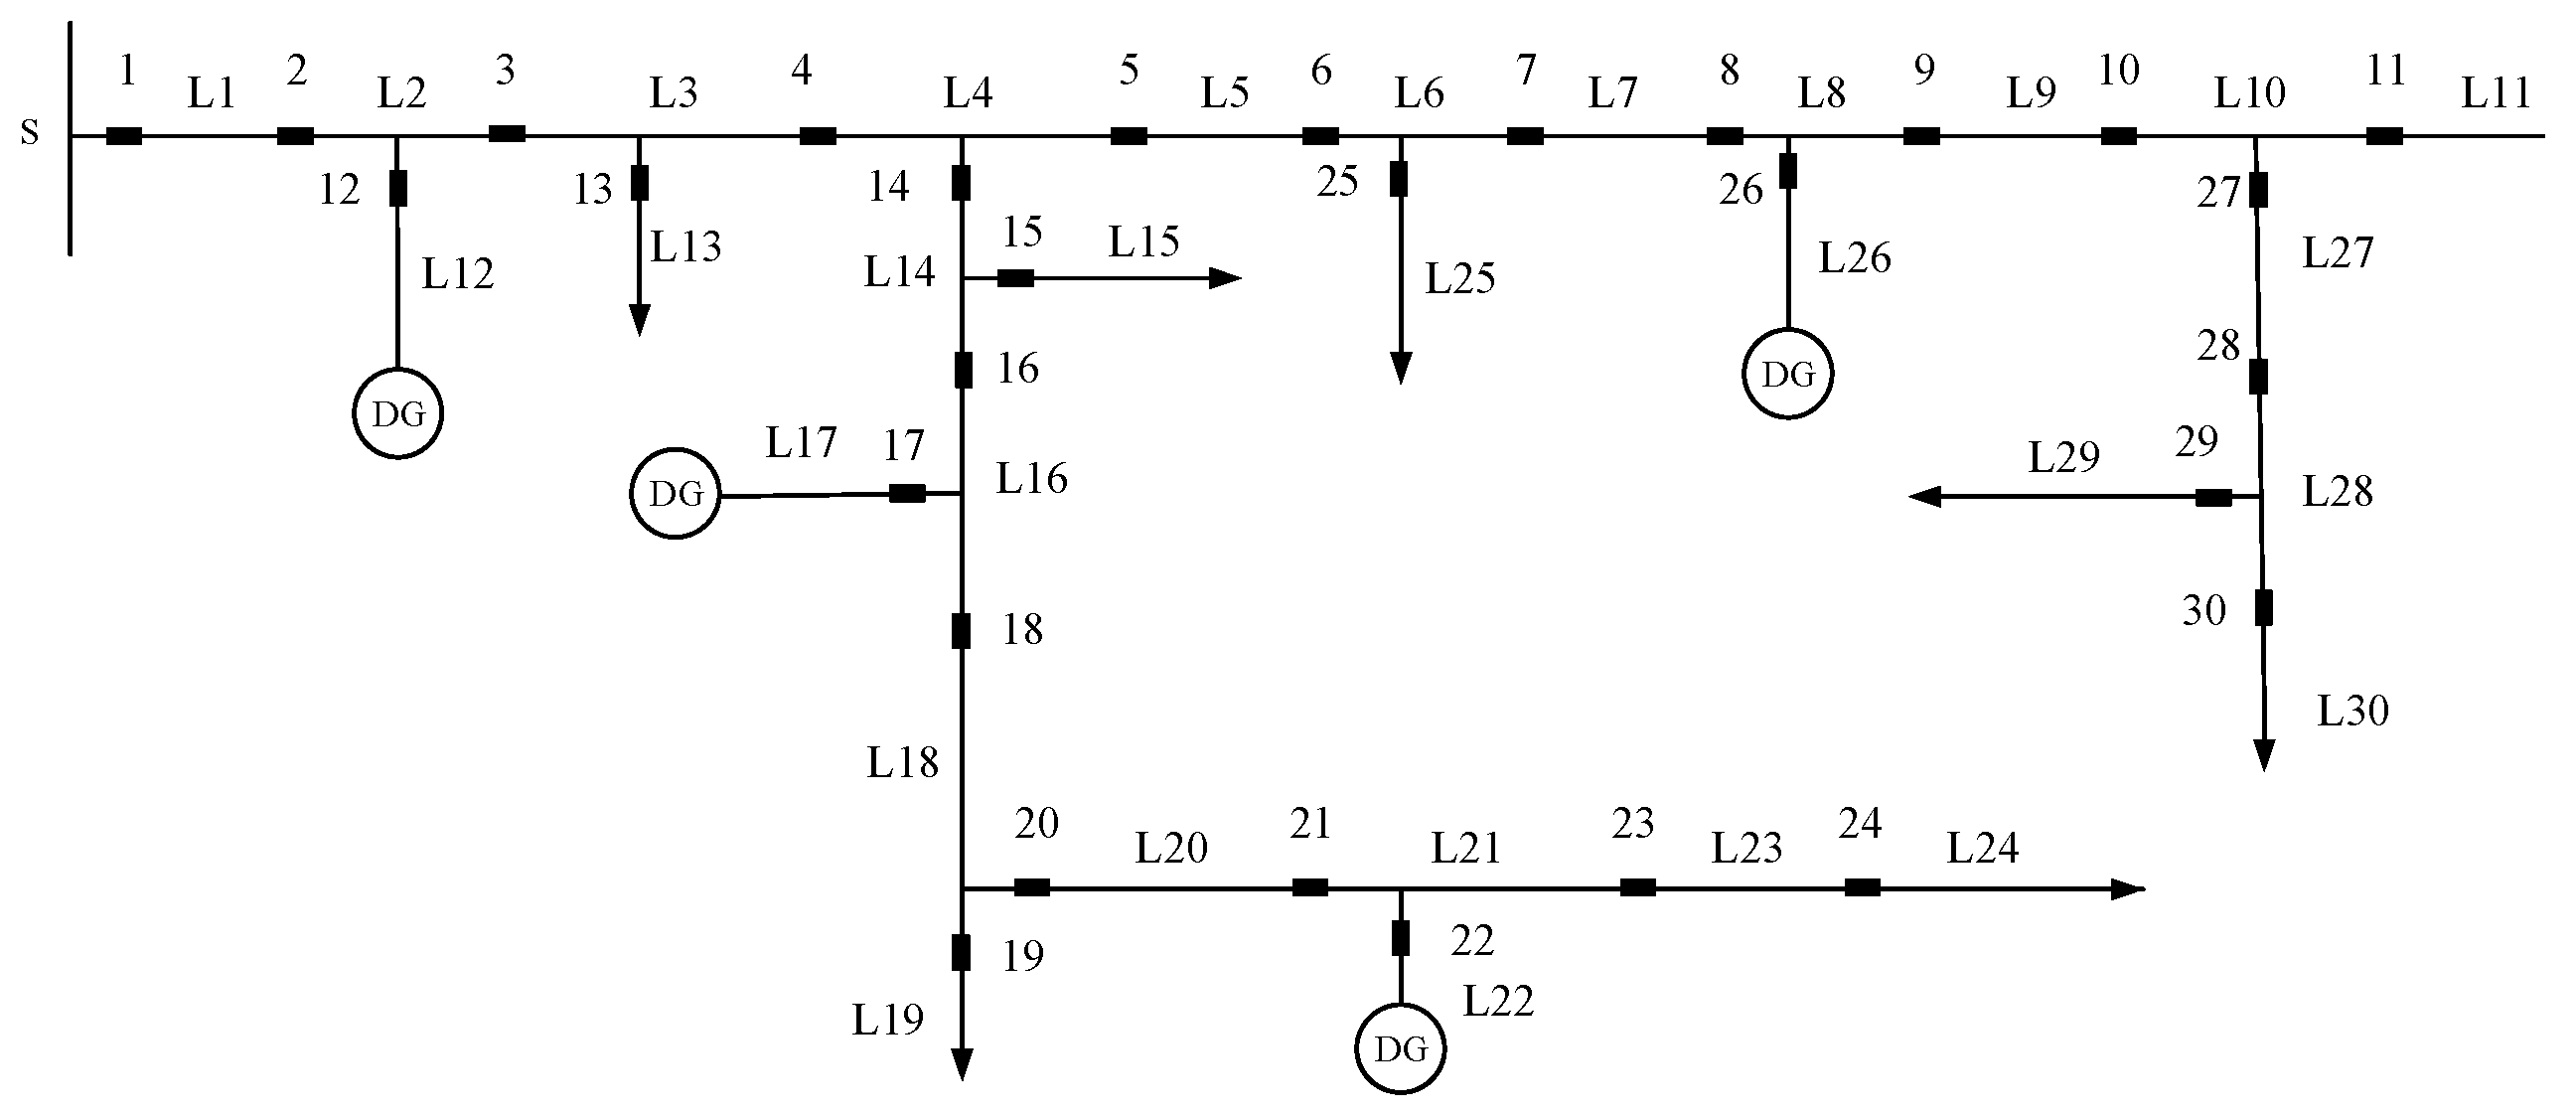
Figure 3 shows a schematic diagram of a 30-node radial ADN structure. Nodes 1–30 represent positions where PSIISs can be installed. Line segments L 1 L 30 represent potential fault areas. The number of nodes where PSIISs can be installed, N Z , is 30, and the number of potential fault areas, N L , is 30. The following assumptions are made regarding the fault diagnosis method of PSIISs and the setting of various observability indices:
For FTO and TRO, if PSIISs are installed at both ends of the area when a fault occurs in a certain area, the fault type and transition resistance can be effectively identified. Therefore, the criteria for μ t and μ r are as shown in Equation (16):
μ t = 1 , Nodes   surrounding   the   fault   occurrence   area   are   equipped   with   PSIISes . 0 , e l s e μ r = 1 , Nodes   surrounding   the   fault   occurrence   area   are   equipped   with   PSIISes . 0 , e l s e
For FLO, let the unit distance be 1. The line lengths for each area l L i are shown in Table 1.
For FCDCO, assume that the line impedance between all nodes is known. Therefore, if there are no other unknown branch lines within the area connected by two nodes, as long as the fault current of one node is directly observable, the fault current of the other node is indirectly observable.
For WIAO, the areas where no faults have occurred are L 1 , L 2 , L 3 , L 9 , L 10 , L 11 , L 12 , L 13 , L 28 , and L 30 . The areas where faults have occurred are L 4 , L 5 , L 7 , L 8 , L 15 , L 17 , L 18 , L 20 , L 21 , L 22 , L 23 , L 24 , L 25 , L 26 , and L 27 . The areas prone to faults are L 6 , L 14 , L 16 , L 19 , and L 29 . Nodes 13, 15, 19, 24, 25, 29, and 30 are connected to loads. Among them, nodes 25 and 19 are connected to first-class loads, nodes 24 and 30 to second-class loads, and nodes 15, 29, and 13 to third-class loads. Therefore, the weights of each node are as shown in Table 2.
Regarding the relevant data for the AGA, the initial population size is set to 100, the maximum number of iterations is set to 1,000,000, and ε in the termination condition is set to 0.001.
Assuming that the relevant personnel thinks that FLO is the most important, FCDCO is the second most important, and FTO, TRO, and WIAO are the lower and the same, then the fitness function can be set as Equation (17):
η = 0.1 η t + 0.5 η f + 0.2 η I + 0.1 η r + 0.1 η p
The constraint conditions consider economic factors. Due to economic constraints, the plan is to install 10 PSIISs. Thus, the economic constraint condition is shown in Equation (18):
i = 1 N Z μ i = 10
The maximum crossover probability is set to 0.8, and the minimum is 0.6. The crossover probability calculation formula is shown in Equation (19):
P C = P C . max d D ( P C . max P C . min ) , max η ( Μ i ) > η avg P C . max , max η ( Μ i ) η avg = 0.8 0.2 d D , max η ( Μ i ) > η avg 0.8 , max η ( Μ i ) η avg
The maximum mutation probability is set to 0.05, and the minimum is 0.01. The mutation probability calculation formula is shown in Equation (20):
P M = P M . max d D ( P M . max P M . m i n ) , η ( Μ i ) > η avg P M . max , η ( Μ i ) η avg = 0.05 0.04 d D , η ( Μ i ) > η avg 0.05 , η ( Μ i ) η avg
According to the above data, the model is solved in MATLAB R2022a. The computer system version used is Windows 11, the operating system is 64-bit, random access memory is 32 GB, and the processor is AMD Ryzen 7 7840 HS w/Radeon 780 M Graphics.
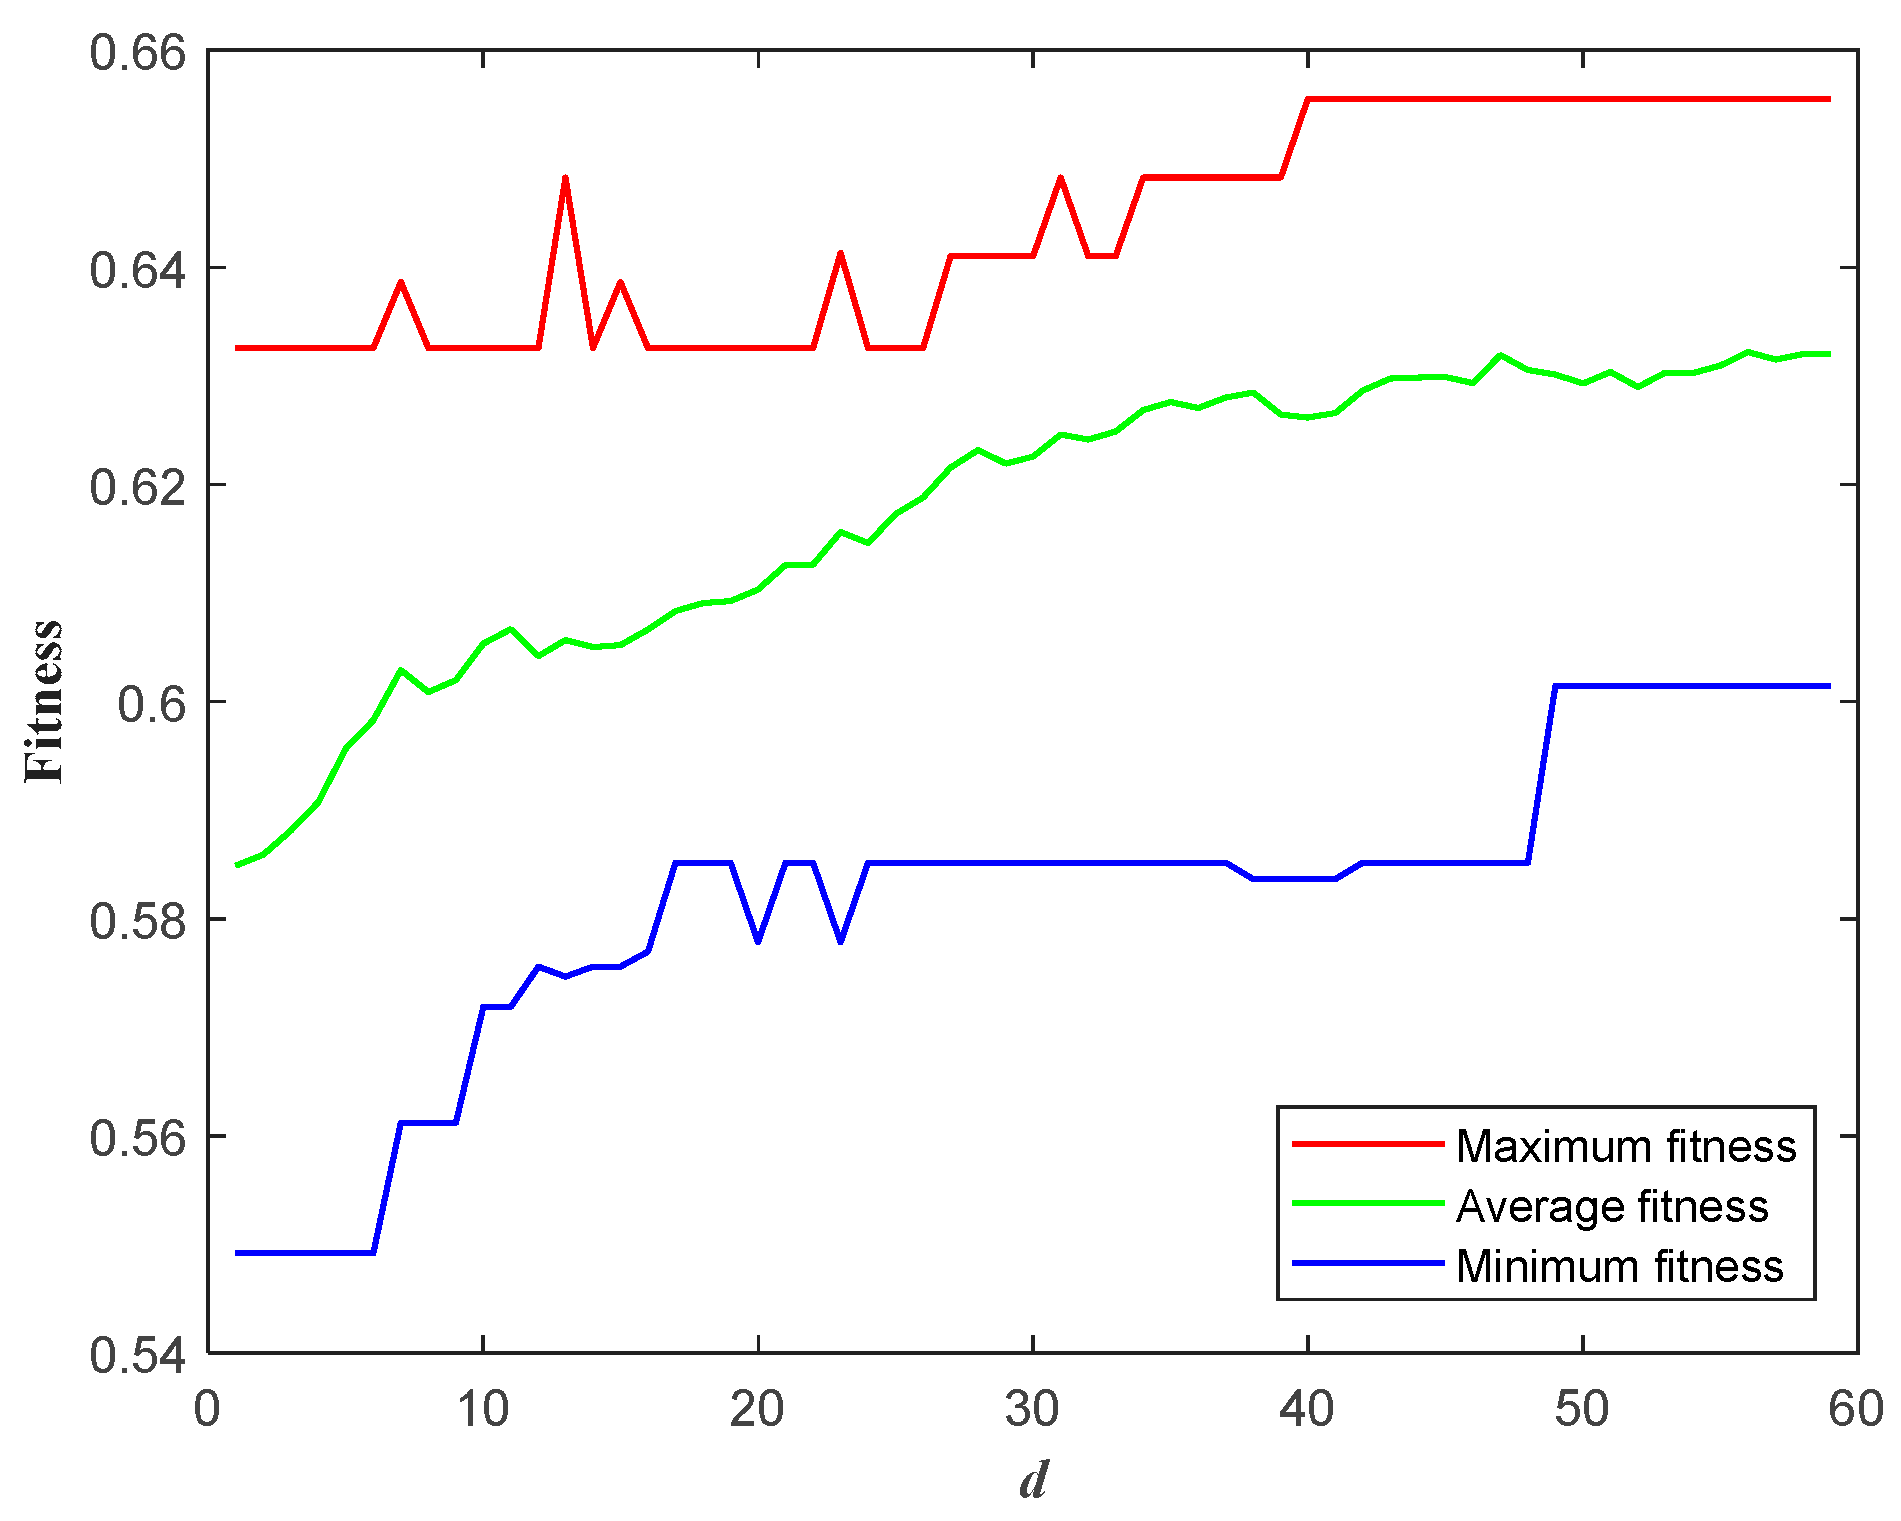
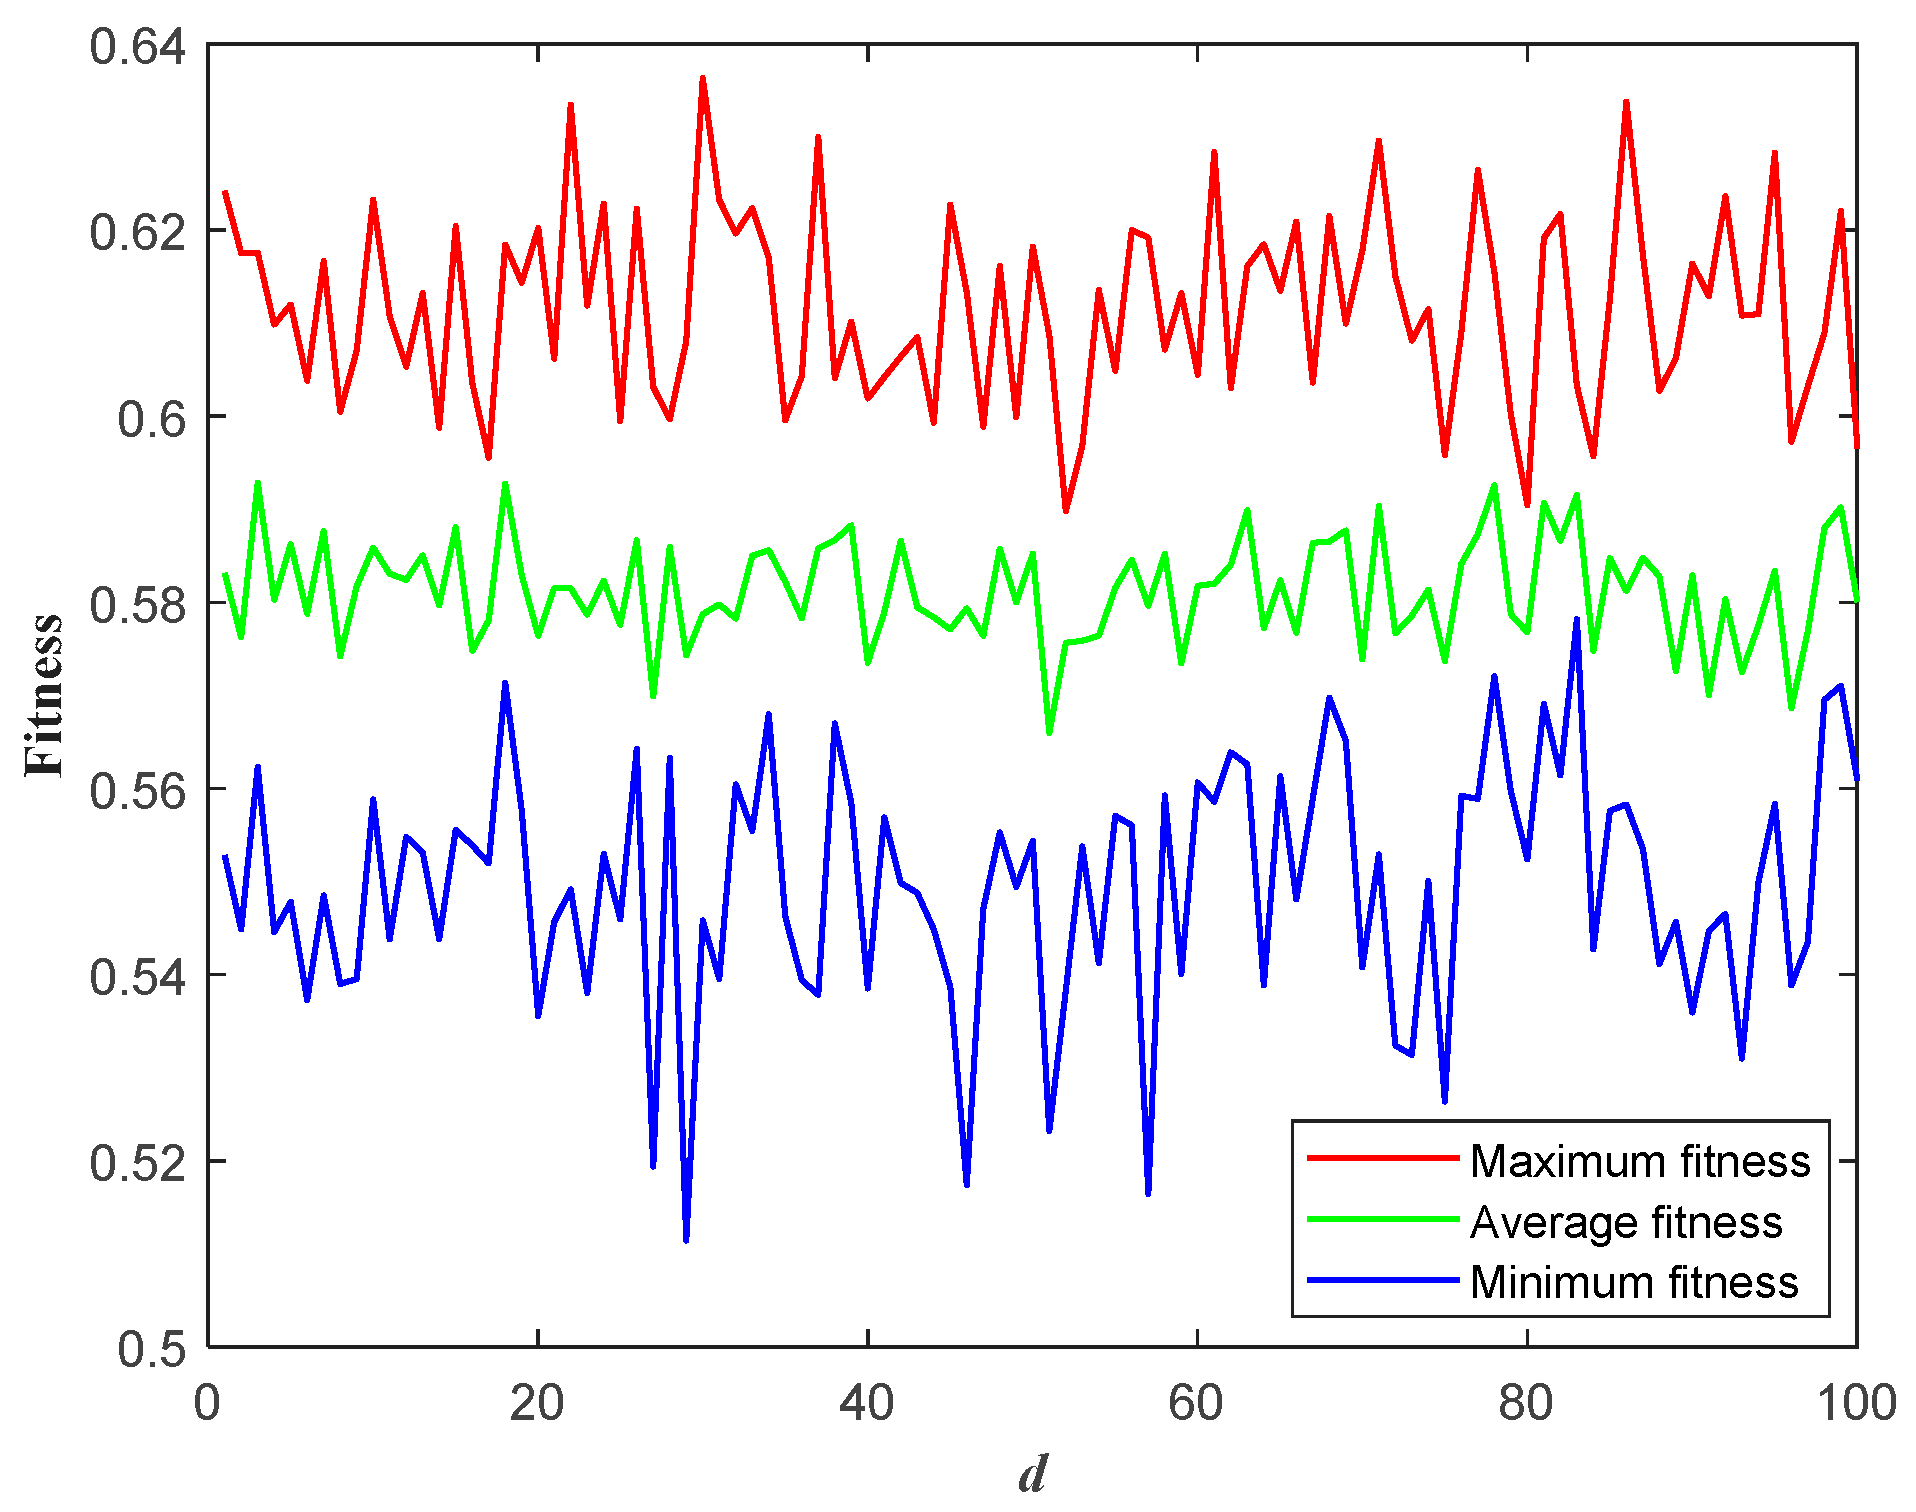
The optimal fitness value of the population during the iteration process is shown in Figure 4. In Figure 4, the horizontal axis represents the iteration number of AGA, and the vertical axis represents the fitness function value calculated by each iteration. The red line represents the maximum value of the fitness function value of all configuration schemes in each iteration calculation, that is, the fitness function value representing the optimal configuration scheme. The green line represents the average value of the fitness function value of all configuration schemes in each iteration calculation, and the blue line represents the minimum value of the fitness function value of all configuration schemes in each iteration calculation. It can be seen that the fitness function value of the optimal configuration scheme converges from the 40th iteration and stabilizes at 0.6555. The termination condition was reached at the 59th time. The FORIs of the optimal configuration scheme are shown in Table 3. The optimal configuration scheme is obtained as shown in Equation (21):
M = [ 0   0   0   0   1   1   1   0   0   1   0   0   0   1   1   1   0   0   0   1   1   0   0   0   1   0   0   0   0   0 ]
If the relevant personnel think that WIAO and FCDCO are the most important and the same, FLO is the second most important, and FTO, TRO, and WIAO are the least important and the same, the weights for the FORIs of the CFOI can be adjusted, and the fitness function can be set as shown in Equation (22):
η = 0.1 η t + 0.2 η f + 0.3 η I + 0.1 η r + 0.3 η p
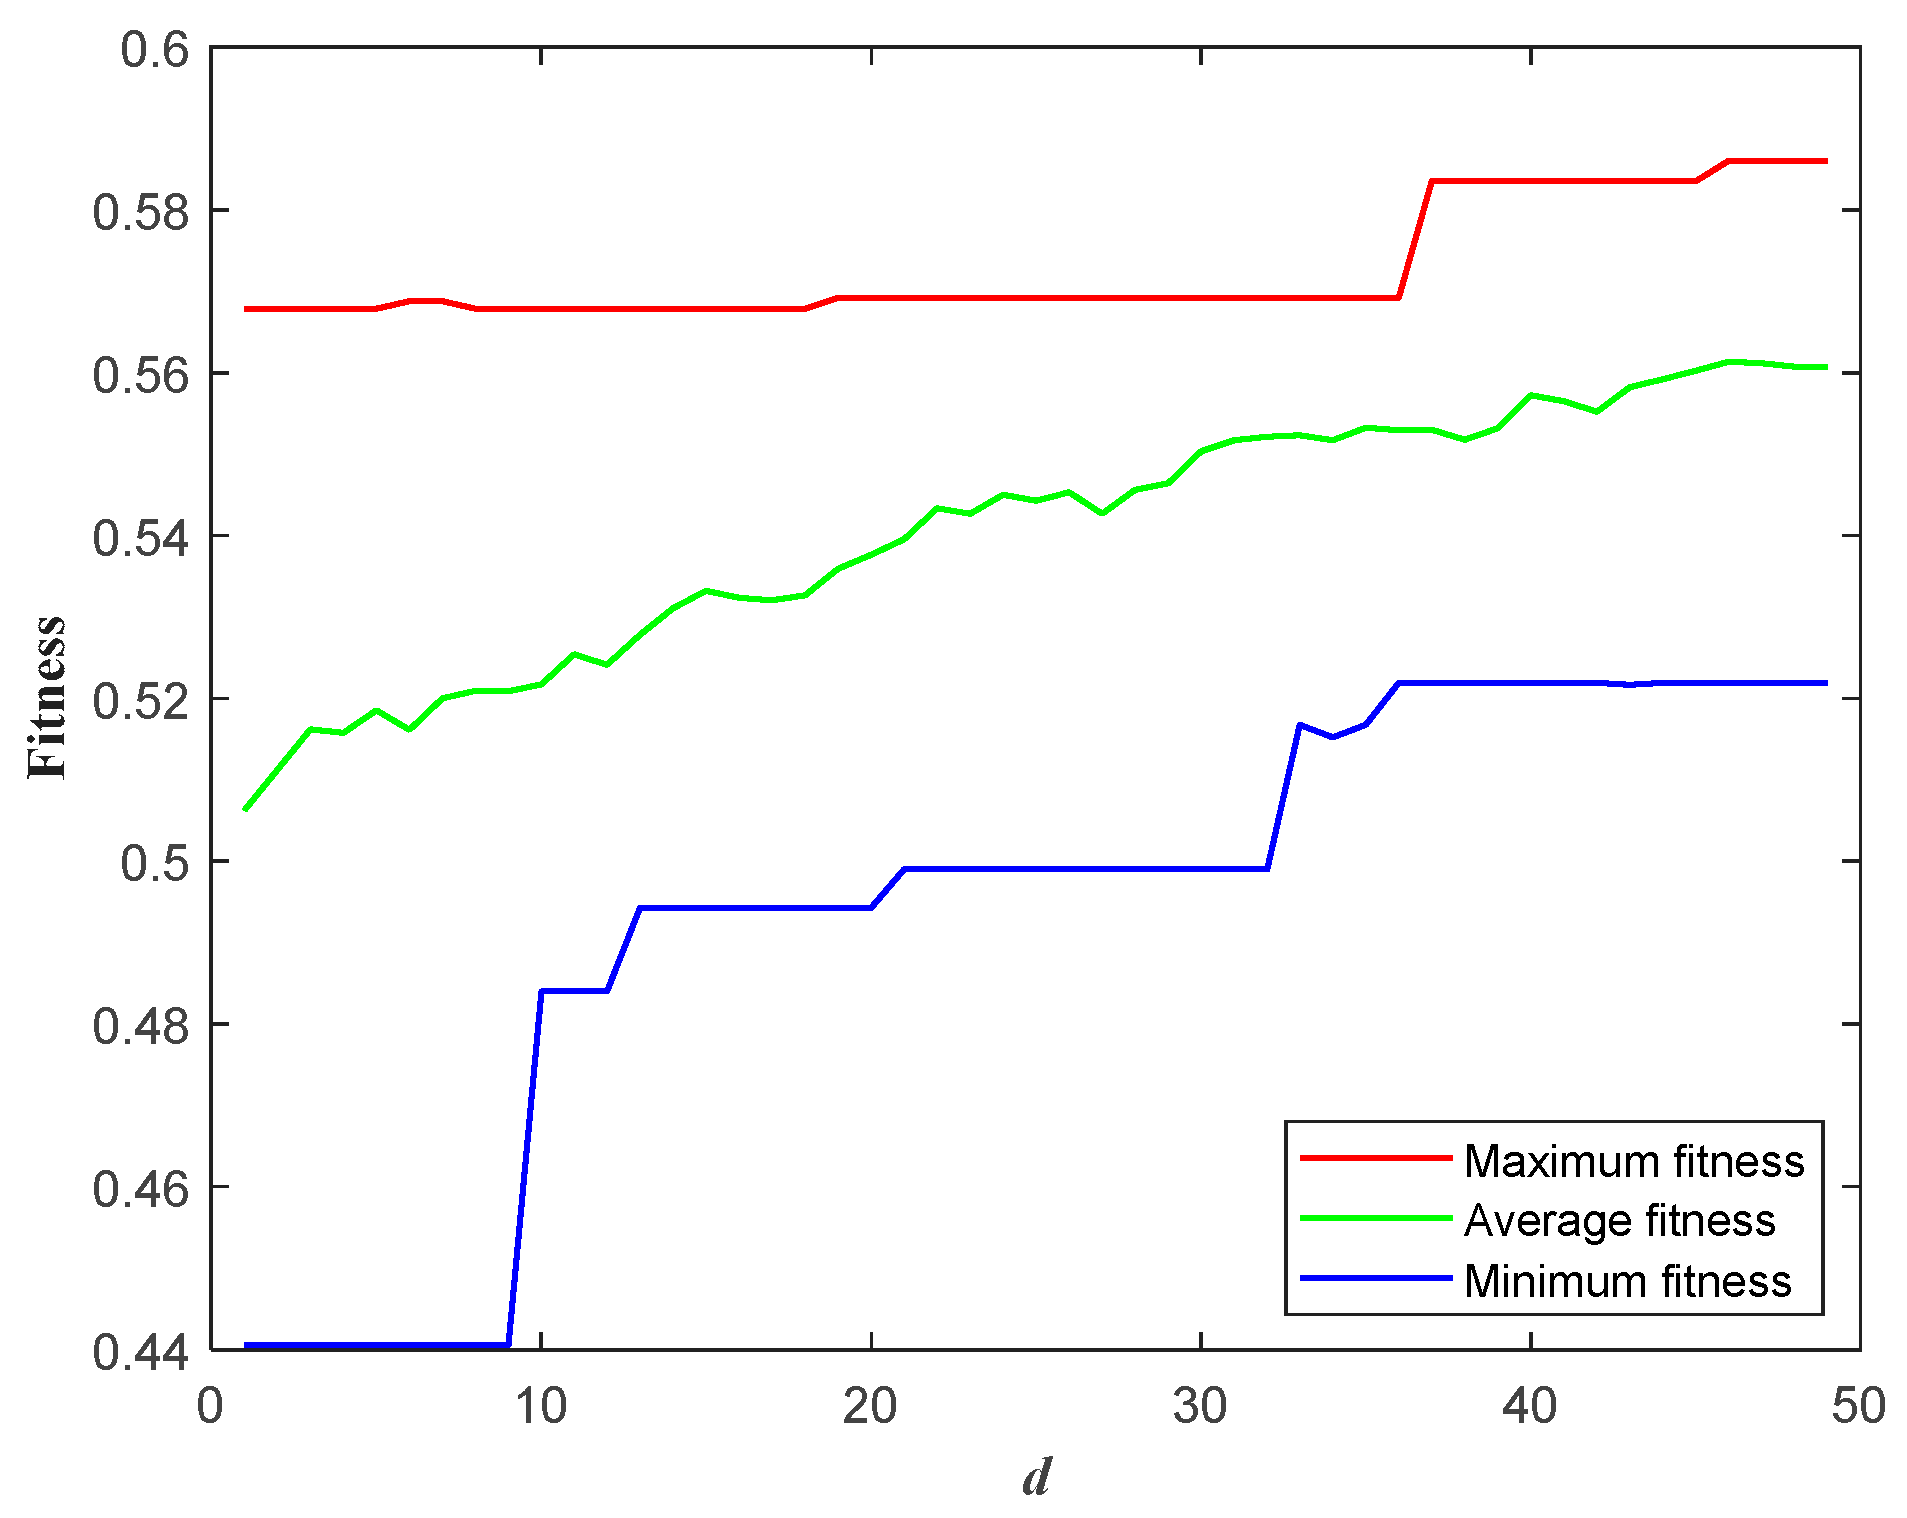
According to the fitness function shown in Equation (22), the model is solved in Matlab. The fitness value of the population during the iteration process is shown in Figure 5. It can be seen that the fitness function value of the optimal configuration scheme converges from the 46th iteration and stabilizes at 0.5860. The termination condition was reached at the 49th time. The FORIs of the optimal configuration scheme are shown in Table 4. The optimal configuration scheme is obtained as shown in Equation (23):
M = [ 0   0   0   1   1   1   1   0   0   0   0   0   0   0   1   1   0   0   1   1   0   0   1   0   1   0   0   0   0   0 ]
Compared with Equation (17), Equation (22) increases the weights of FCDCO and WIAO, and it reduces the weight of FLO. After solving, it can be seen from Table 4 that the corresponding η I and η p increase, and η f decreases. It can be seen that by adjusting the weights of the FORIs in the CFOI, the proportion of FORIs of the optimal configuration scheme can be effectively controlled to meet the configuration requirements of PSIISs. The proposed optimization configuration method can effectively optimize the configuration through FORIs, and the optimal configuration scheme can be effectively solved using the AGA.

4.2. Comparison with the Existing Optimal Configuration Method

The proposed optimal configuration model is compared with the optimal configuration model proposed in Reference [14]. The optimization goal proposed in [14] is to maximize the fault observability of the DN, and the objective function is shown in Equation (24).
max   η = max i = 1 N x i α i + 1 j = 1 n ( α j + 1 )
where α i represents the number of switches downstream of the node i , N represents the total number of switches, x i indicates whether the node i configures the switch, x i is 0 on behalf of the node i does not configure the switch, and x i is 1 on behalf of the node i configures the switch.
The constraint conditions are all solved by Equation (18), and the other data settings are the same as those in Section 4.1.
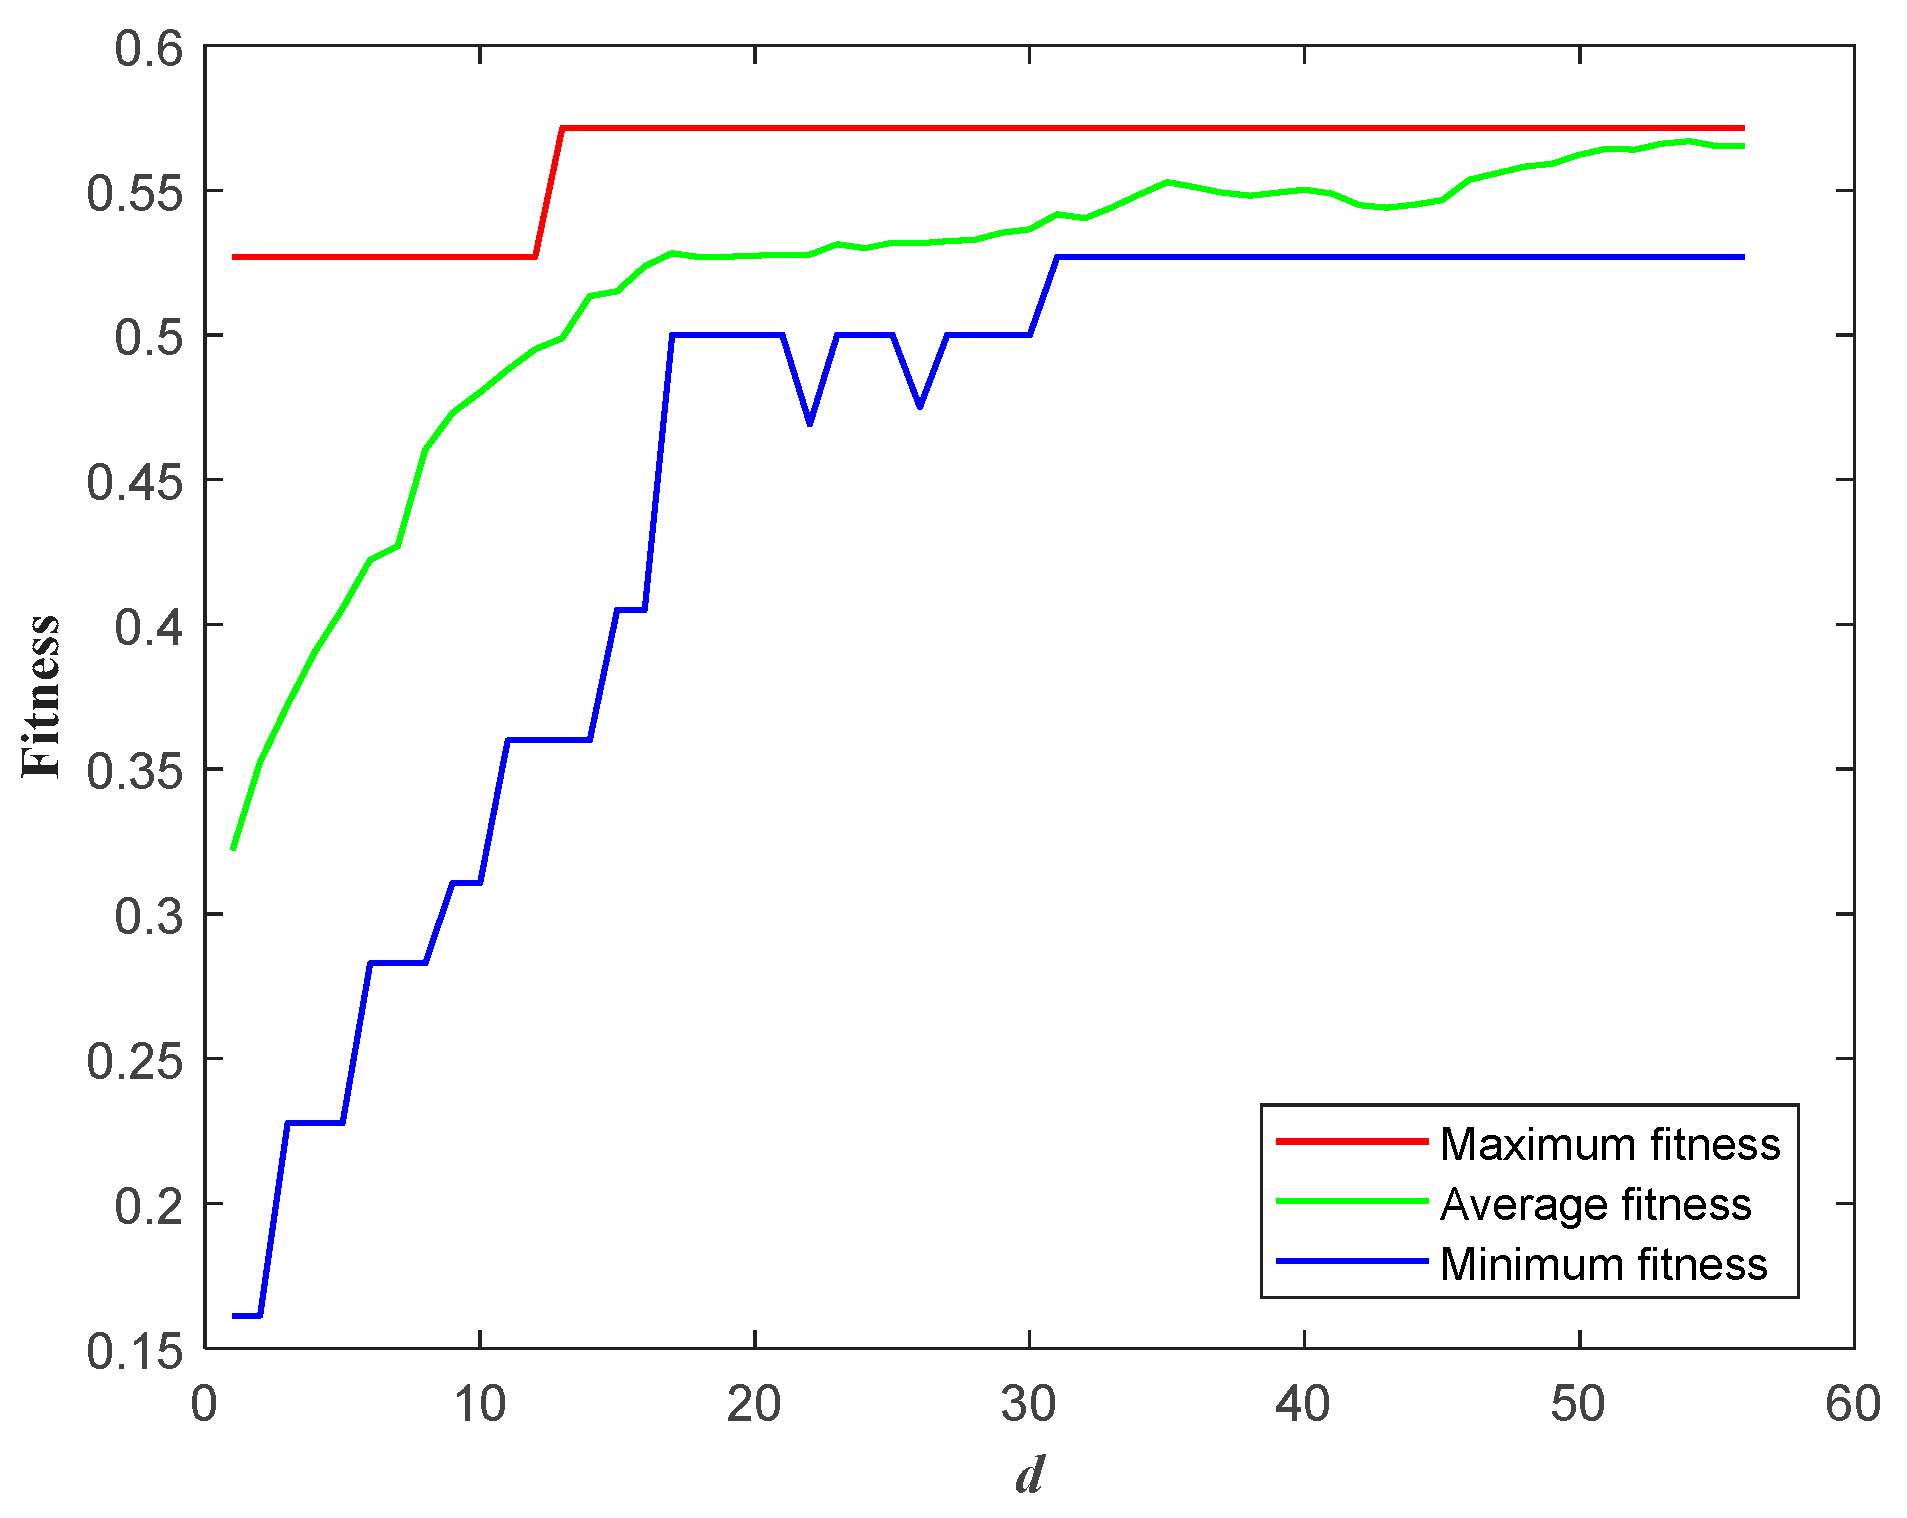
The AGA is used to solve the model in Matlab. The fitness value in the iteration process is shown in Figure 6. It can be seen that the fitness function value of the optimal configuration scheme converges from the 13th iteration and stabilizes at 0.5714. The termination condition was reached at the 56th time. The optimal configuration scheme is obtained as shown in Equation (25):
M = [ 1   1   0   1   1   1   0   0   0   0   1   0   1   0   1   0   0   0   1   0   1   0   0   0   0   0   0   0   0   0 ]
The FORIs of the configuration scheme shown in Equation (23) are calculated, and the CFOI is calculated according to Equation (17). The results are shown in Table 5. Compared with the data in Table 3, the η in Table 5 is smaller. η t and η r are larger, η I is the same, and η f and η p are smaller. It can be seen that the CFO of the optimal configuration scheme obtained by the optimal configuration model proposed in Reference [14] is low, and the model lacks consideration of various types of fault information. Moreover, the optimization objective model proposed in Reference [14] is only for the switch position, without consideration of the distance between different switch positions and the weak foundation of different sections. Therefore, the optimal configuration model proposed in this paper is more suitable for the PSIIS configuration of the ADN, which can effectively strengthen the construction of weak infrastructure areas.

4.3. Comparison with the Existing Model-Solving Method

The AGA and the commonly used binary particle swarm optimization algorithm (BPSO) are used to analyze and compare the solution effect of the optimal configuration model considering CFO. The BPSO is a variant of the particle swarm optimization algorithm for dealing with discrete optimization problems. The BPSO searches for the region of the optimal individual in the space by accumulating the experience of individual particles and learning the experience of group excellent particles [19,20]. In BPSO, the position of particles is limited to 0 or 1.
The BPSO is used to solve the optimal configuration model of PSIISs. The fitness function is shown in Equation (17), and the BPSO is iterated for 100 times. Other data settings are the same as in Section 4.1.
The fitness value in the iteration process is shown in Figure 7. The fitness function value of the optimal configuration scheme reaches the maximum fitness at the 30th iteration, which is 0.6363. The FORIs of the optimal configuration scheme are shown in Table 6. The optimal configuration scheme is obtained as shown in Equation (26):
M = [ 0   0   0   1   1   1   0   1   1   0   0   0   1   1   0   0   0   0   0   1   0   0   0   1   0   0   0   0   1   0 ]
It can be seen that the BPSO has a greater degree of dispersion of the fitness function value in the iterative process, but it is not easy to converge, and the fitness of the most configured scheme obtained by the solution is smaller than the fitness obtained by the AGA. Therefore, the optimal configuration model proposed in this paper is more suitable for using the AGA as the model-solving method.

5. Conclusions

Based on the functional characteristics of PSIISs, the paper proposes an optimal configuration method of PSIISs in the ADN considering CFO. The innovations and contributions are as follows:
(1) Based on the functional characteristics of PSIISs, five FORIs are proposed considering the fault information requirements of the ADN. These indexes include the FTOI, FLOI, FCDCOI, TROI, and WIAOI. Based on the linear weighting method, five FORIs are transformed into the CFOI.
(2) Taking the maximum CCFOI as the objective function and the economic condition cost constraint as the constraint condition, the optimal configuration model of PSIISs considering CFO is constructed. The AGA is selected as the model-solving method, and an optimal configuration method of PSIISs in the ADN considering CFO is proposed.
(3) This optimal configuration method can be applied to PSIISs using any fault diagnosis method, providing an optimal configuration scheme for a limited number of PSIISs, enhancing the fault tracing and inversion capabilities of the ADN, and strengthening infrastructure development in weak infrastructure areas.
Further research will focus on considering the interrelationships among the various fault observability indicators and improving the CFO model of the ADN.
Author Contributions

Conceptualization, project administration, and supervision, Y.L. and S.S.; methodology, validation, and supervision, F.H. and X.H.; formal analysis and investigation, Y.L. and F.H.; resources, data curation, and funding acquisition, S.S., X.H. and B.L.; writing—original draft preparation, writing—review and editing, and visualization, B.L., F.C. and J.Z. All authors have read and agreed to the published version of the manuscript.

Funding

This research was funded by Yunnan Fundamental Research Projects (No.202401CF070077).

Data Availability Statement

The data that support the findings of this study are available on request from the corresponding author. The data are not publicly available due to privacy or ethical restrictions.

Acknowledgments

This research is supported by Yunnan Fundamental Research Projects (No.202401CF070077). Thank the editors and the anonymous reviewers for the useful comments on improving the format and content of the paper.

Conflicts of Interest

Authors Y.L., S.S., F.H. and X.H were employed by the Yunnan Electric Power Grid Co., Ltd. The remaining authors declare no conflicts of interest.

References

  1. Zhang, Y.; Cai, Y.; Hui, Q.; Cao, S.; Xu, J. Research and Analysis on the Application of Intelligent Integrated Switches of Primary and Secondary Fusion. J. Electr. Eng. 2022, 17, 199–205. [Google Scholar]
  2. Ji, Z.; Liu, X.; Tang, D. Game-Theoretic Applications for Decision-Making Behavior on the Energy Demand Side: A Systematic Review. Prot. Control Mod. Power Syst. 2024, 9, 1–20. [Google Scholar] [CrossRef]
  3. Tan, W.; Zhang, T.; Ma, Y.; Liu, S.; Yang, L.; Lin, Z. Curvature Quantified Douglas-Peucker-Based Phasor Measurement Unit Data Compression Method for Power System Situational Awareness. Prot. Control Mod. Power Syst. 2024, 9, 128–137. [Google Scholar] [CrossRef]
  4. Piesciorovsky, E.C.; Warmack, R.J.B.; Polsky, Y. Medium-Voltage Testbed for Comparing Advanced Power Line Sensors vs. Measurement Transformers with Electrical Grid Events. Energies 2023, 16, 4944. [Google Scholar] [CrossRef]
  5. Jiang, H.; Xu, Y.; He, Z.; Tao, S.; Chang, X.; Wang, J. Optimal Placement Method for Harmonic Resonance Monitoring Points Considering Uncertainties of System Parameters. Autom. Electr. Power Syst. 2021, 45, 141–151. [Google Scholar]
  6. Liang, Z.; Wang, J.; Wang, X.; Zhang, Y. Research on μPMU Configuration Optimization Considering Multiple Operation Modes of Distribution Network. Front. Energy Res. 2022, 10, 932072. [Google Scholar] [CrossRef]
  7. Wang, L.; Zhu, Y.; Du, W.; Lv, H. Method for Voltage Sag State Estimation and Monitoring Device Configuration Considering DG Access. Guangdong Electr. Power 2024, 37, 60–67. [Google Scholar]
  8. Li, Z.; Zhang, Y.; Xia, Y.; Feng, Y.; Wang, Y.; Ge, J. An Optimal Allocation Technique for Power Distribution Network Fault Localization Devices Based on the Dynamic Virtual Travelling Wave Based Fault Localization Principle. Proc. Chin. Soc. Univ. Electr. Power Syst. Autom. 2024, 1–10. [Google Scholar] [CrossRef]
  9. Wang, Y.; Yang, Z.; Yu, J.; Liu, J. A Unified Optimal Placement Method for Multiple Types of Devices in Distribution Networks Considering Reliability Demand. Trans. China Electrotech. Soc. 2023, 38, 6727–6743. [Google Scholar]
  10. Yao, Q.; Xue, Y.; Kang, Z.; Su, C.; Jiang, W. Optimal Configuration Model of Distribution Network Segmentation Switch and Automation Terminal Considering Branch Line. Distrib. Util. 2021, 38, 61–67. [Google Scholar]
  11. Zhao, X.; Zhang, Z.; Yao, Q.; Ni, K.; Ma, W. Optimal Configuration Model of Switch for Distribution Network Based on Resilience Improvement. J. Electr. Eng. 2020, 15, 128–134. [Google Scholar]
  12. Yuan, Y.; Wang, S.; Jiang, L.; Zhou, J.; Sun, R. Switch Configuration Optimization Based on Self-healing Requirement of Distribution Network. Electr. Power 2016, 49, 76–82. [Google Scholar]
  13. Davarinejad, E.; Ameli, A.; El-Saadany, E. Fault-Observability Enhancement in Distribution Networks Using Power Quality Monitors. In Proceedings of the 2018 IEEE Electrical Power and Energy Conference (EPEC), Toronto, ON, Canada, 10–11 October 2018. [Google Scholar]
  14. Tang, L.; Han, Y.; Zalhaf, A.S.; Zhou, S.; Yang, P.; Wang, C.; Huang, T. Resilience enhancement of active distribution networks under extreme disaster scenarios: A comprehensive overview of fault location strategies. Renew. Sustain. Energy Rev. 2024, 189, 113898. [Google Scholar] [CrossRef]
  15. Chen, D.; Shen, J.; Zhang, R.; Gao, S. Realization of Fault Observability of Distribution System and Corresponding Optimal Configuration Method of Feeder Terminal Units. Power Syst. Technol. 2011, 35, 94–99. [Google Scholar]
  16. Zhou, M.; Mo, J.; Yao, Y.; Chen, Y.; Wang, X.; Zhao, X. Research on FTU optimal configuration model of distribution network based on fault observability index. Power Syst. Prot. Control 2019, 47, 117–124. [Google Scholar]
  17. Jiang, S.; Deng, F.; Zu, Y.; Li, X. Optimal configuration method of traveling wave fault location equipment in a distribution network based on fault observability of the whole network. Power Syst. Prot. Control 2023, 51, 25–35. [Google Scholar]
  18. Zhao, Z.; Mutale, J. Optimal Conductor Size Selection in Distribution Networks with High Penetration of Distributed Generation Using Adaptive Genetic Algorithm. Energies 2019, 12, 2065. [Google Scholar] [CrossRef]
  19. Omakor, J.; Alzayed, M.; Chaoui, H. Particle Swarm-Optimized Fuzzy Logic Energy Management of Hybrid Energy Storage in Electric Vehicles. Energies 2024, 17, 2163. [Google Scholar] [CrossRef]
  20. Charles Raja, S.; Vishnu Dharssini, A.C.; Jeslin Drusila Nesmalar, J.; Karthick, T. Deployment of IoT-Based Smart Demand-Side Management System with an Enhanced Degree of User Comfort at an Educational Institution. Energies 2023, 16, 1403. [Google Scholar] [CrossRef]
Figure 1. Schematic diagram of a simple radial ADN structure.
Energies 17 03945 g001
Figure 2. Flowchart for optimization configuration of PSIISs.
Energies 17 03945 g002
Figure 3. Schematic diagram of a 30-node radial ADN structure.
Energies 17 03945 g003
Figure 4. Fitness values during the iteration process of Equation (17).
Energies 17 03945 g004
Figure 5. Fitness values during the iteration process of Equation (22).
Energies 17 03945 g005
Figure 6. Fitness values during the iteration process of Equation (24).
Energies 17 03945 g006
Figure 7. Fitness values during the iteration process of BPSO.
Energies 17 03945 g007
Table 1. Line length data for potential fault areas.
L i l L i L i l L i L i l L i
L 1 5 L 11 7 L 21 4
L 2 6 L 12 5 L 22 5
L 3 4 L 13 5 L 23 6
L 4 3 L 14 6 L 24 7
L 5 5 L 15 7 L 25 5
L 6 7 L 16 6 L 26 5
L 7 5 L 17 4 L 27 6
L 8 5 L 18 7 L 28 7
L 9 6 L 19 3 L 29 3
L 10 7 L 20 5 L 30 5
Table 2. Node weight data.
i p i i p i i p i
10110212
20120222
30131232
42143244
52154254
63164262
73173271
82183281
91196293
100202302
Table 3. FORIs and CFOI of the optimal configuration scheme of Equation (17).
η t η f η I η r η p η
0.73330.73060.50000.73330.43540.6555
Table 4. FORIs and CFOI of the optimal configuration scheme of Equation (22).
η t η f η I η r η p η
0.63330.67260.56660.63330.51610.5860
Table 5. FORIs and CFOI of the optimal configuration scheme of Equation (24).
η t η f η I η r η p η
0.76670.65400.50000.76670.29030.6094
Table 6. FORIs and CFOI of the optimal configuration scheme of BPSO.
η t η f η I η r η p η
0.66660.71840.53330.66660.37090.6363
Disclaimer/Publisher’s Note: The statements, opinions and data contained in all publications are solely those of the individual author(s) and contributor(s) and not of MDPI and/or the editor(s). MDPI and/or the editor(s) disclaim responsibility for any injury to people or property resulting from any ideas, methods, instructions or products referred to in the content.