Article

On-Site Electrochemical Detection of Corrosion in Substation Grounding System

1
State Grid Tianjin Electric Power Research Institute, Tianjin 300000, China
2
Department of Environmental Science and Engineering, North China Electric Power University, Baoding 071000, China
*
Author to whom correspondence should be addressed.
Energies 2024, 17(16), 3906; https://doi.org/10.3390/en17163906
Submission received: 11 May 2024 / Revised: 21 July 2024 / Accepted: 2 August 2024 / Published: 7 August 2024
(This article belongs to the Section F: Electrical Engineering)

Abstract

:
The reliability and efficiency of the grounding system in substations is of utmost importance for the safety of the electrical grid. In China, the grounding grids of substations are primarily composed of galvanized steel, carbon steel, and copper, all of which are susceptible to corrosion from soil during operation. This study thoroughly examines the effects of typical Cl ions and soil water content on the corrosion behavior of a Q235 steel in situ. The data suggest that there is a negative correlation between soil moisture and grounding grid corrosion, whereas dissolved salts, particularly Cl ions in soil, correlate positively.

1. Introduction

The corrosion of metals has the potential to cause significant deterioration in industrial environments and substantial economic losses. As indicated by the World Corrosion Organization, the annual financial impact of corrosion is estimated to be as high as USD 2.4 trillion, representing approximately 3.4% of the global gross domestic product (GDP) [1]. In the power industry, the majority of transmission and transformation equipment comprises metal structures, which renders the safety and economic hazards caused by metal corrosion particularly significant [2,3,4].
A substation is defined as a power facility that performs a number of functions, including the transformation of voltage, the reception and distribution of electrical energy, the control of power flow, and the adjustment of voltage within a power system [5,6,7]. The normal operation of the substation grounding network system is of great importance in ensuring the safe operation of power equipment and the safety of personnel, as well as maintaining the reliable operation of the power system. Typically constructed from steel or copper, the grounding network represents a crucial safety component, serving to protect against lightning and grounding risks throughout the entire power production, transformation, and transmission system lifecycle [8,9,10]. However, ground network devices are used below ground, especially in soil containing a large amount of Cl, hydrogen ions, or dissolved oxygen, and the grounding metal will be subjected to serious chemical and electrochemical corrosion, which will lead to a decline in the effect of grounding protection, and then cause power grid security accidents [2,11,12,13]. According to statistics, the annual power system failure caused by the deterioration of the ground network performance accounts for about one-third of the entire power system failures in China. For example, in 2005, a substation in Yulin, Guangxi Province, was disconnected due to a ground cable, which resulted in the line burning and the entire station losing power. Therefore, the safe operation of the power grid needs to predict and maintain the fault point of the grounding network in time. Strengthening the detection means, accurately measuring the influencing factors of soil corrosion, and evaluating the soil corrosion state near the grounding network can reduce the difficulty of detection and improve the work efficiency. At present, the diagnosis and detection methods of grounding network corrosion are mainly divided into electrical network analysis, electromagnetic field detection, and electrochemical methods. Among them, the electrical network analysis method needs to understand the topology of the grounding network and detect the resistance of multiple terminals. At present, there is no practical method and test software for this. In the electromagnetic field detection method, a plethora of interference factors are present in the grounding network site, including the influence of natural grounding bodies such as underground metal frames. Even in the absence of corrosion in the grounding network, the surface magnetic field may deviate significantly from the simulated results, thereby rendering the method uncertain. The electrochemical method is a more appropriate means of studying the corrosion mechanism of a grounding network than power grid analysis and electromagnetic field analysis, which represents the most effective approach to detecting the corrosion state of a grounding network. The electrochemical method enables the calculation of the corrosion rate and corrosion depth, along with other parameters, of the grounding grid. This is achieved by applying the electrochemical corrosion mechanism of the grounding grid material in the soil and the obtained electrochemical data.
The substation grounding network is an important part of the North China Power grid. After investigation, there are some equipment problems such as a large arc, breakdown fuse damage, capacitor voltage transformer discharge, and a fuse switch trip of 220 kV equipment in the power plant in this area. To ensure the safety and normal operation of the power grid, this paper studies the soil properties of the grid buried underground and the corrosion of the ground grid. The research results show that the substation grounding network is seriously corroded, posing a major threat to the safe operation of the power system [14,15]. The ground mesh is buried underground, and many micro-anodes and micro-cathodes are generated in the soil to form micro-batteries. The micro-non-uniformity of the metal surface will cause corrosion [16]. By evaluating important chemical or electrochemical indicators of soil corrosion, including soil acidity, total soluble salt, chloride ions, sulfate ions, and resistivity, the influence of soil physical factors on grounding grid corrosion was determined [17,18]. This work can provide an effective data reference basis for material selection, site selection, and construction of the grounding network of the substation, as well as corrosion protection and corrosion management of related equipment, and has great significance for the stable operation of the substation.

2. Experimental

The full experiment method is shown in Figure 1.

2.1. Excavation and Sampling Methods

2.1.1. Excavation Method for the Grounding Grid

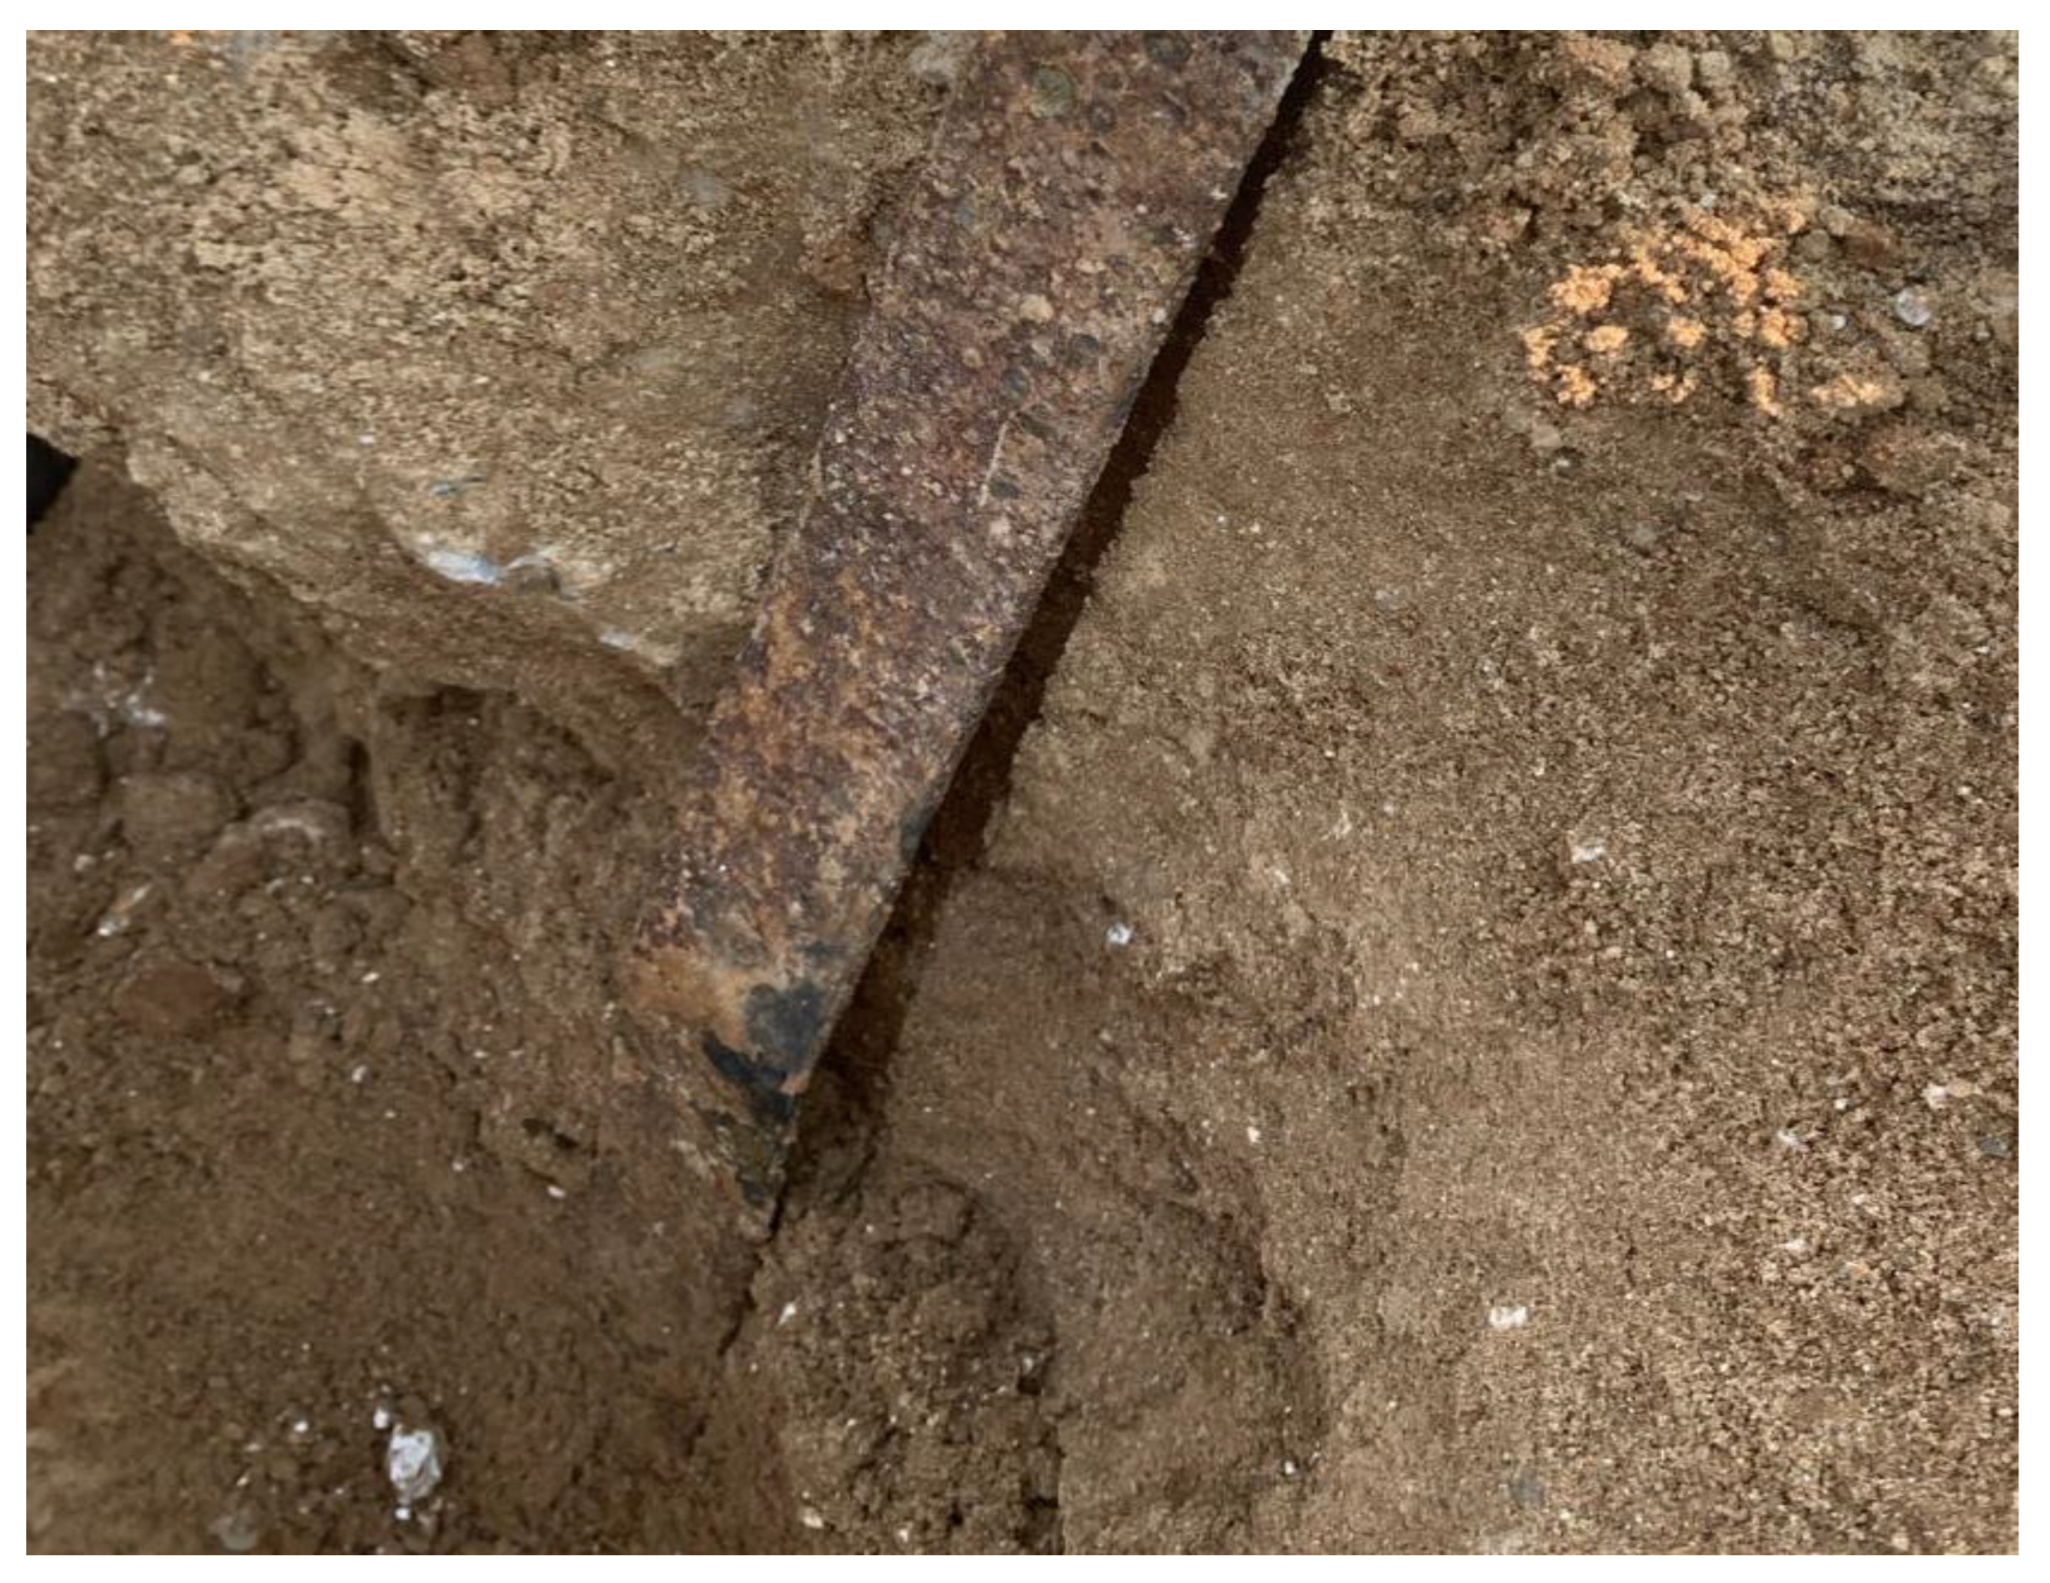
We excavated the ground wire of the equipment until it was connected to the horizontal grounding network, observed the deterioration of the wire, and collected pictures, notes, and samples. The grounding down conductors in this study were all made of Q235 steel with the following compositions (in weight percentages): C, 0.15; Mn, 1.2; Si, 0.20; S, 0.03; P, 0.03, and balanced Fe.

2.1.2. Sampling Method for Soil Samples

The corrosive medium selected in the experiment was the soil around the site of the metal corrosion test in the grounding network system. Soil samples must be collected, treated, and stored in accordance with the guidelines specified in NYT 1121.1-2006, Soil Testing Part 1: Collection, Handling, and Storage of Soil Samples. The “multi-point mixing” method was adopted for sampling, and the soil samples taken from each point in a sampling unit were evenly mixed to form a mixed sample to improve the representativeness of the sample. A mixed sample consists of 15 to 20 sample points, and “S”-shaped distribution points are generally used for sampling [19]. Each dig site produced 1 kg of soil. It is crucial to remove metal rust from the sample before placing it in the bag. Samples should be identified, labeled, and recorded before further processing.

2.2. Measurement of Electrochemical Polarization Plot

This experiment adopts the polarization curve measurement method, which is the most classical means to investigate the functional relationship between the electrode potential and the impressed current density of metal in corrosive media under the action of impressed current. The characteristics and control steps of electrode reaction can be evaluated according to the polarization curve. The potential for reaction and the maximum possible speed of the system can be determined by analyzing the polarization curve. Concurrently, the kinetic parameters of the electrode reaction can be determined. At the same time, the electrochemical testing of the corroded material on site can be effectively associated with the physical and chemical properties of the soil compared with the testing of the corroded material in the laboratory.
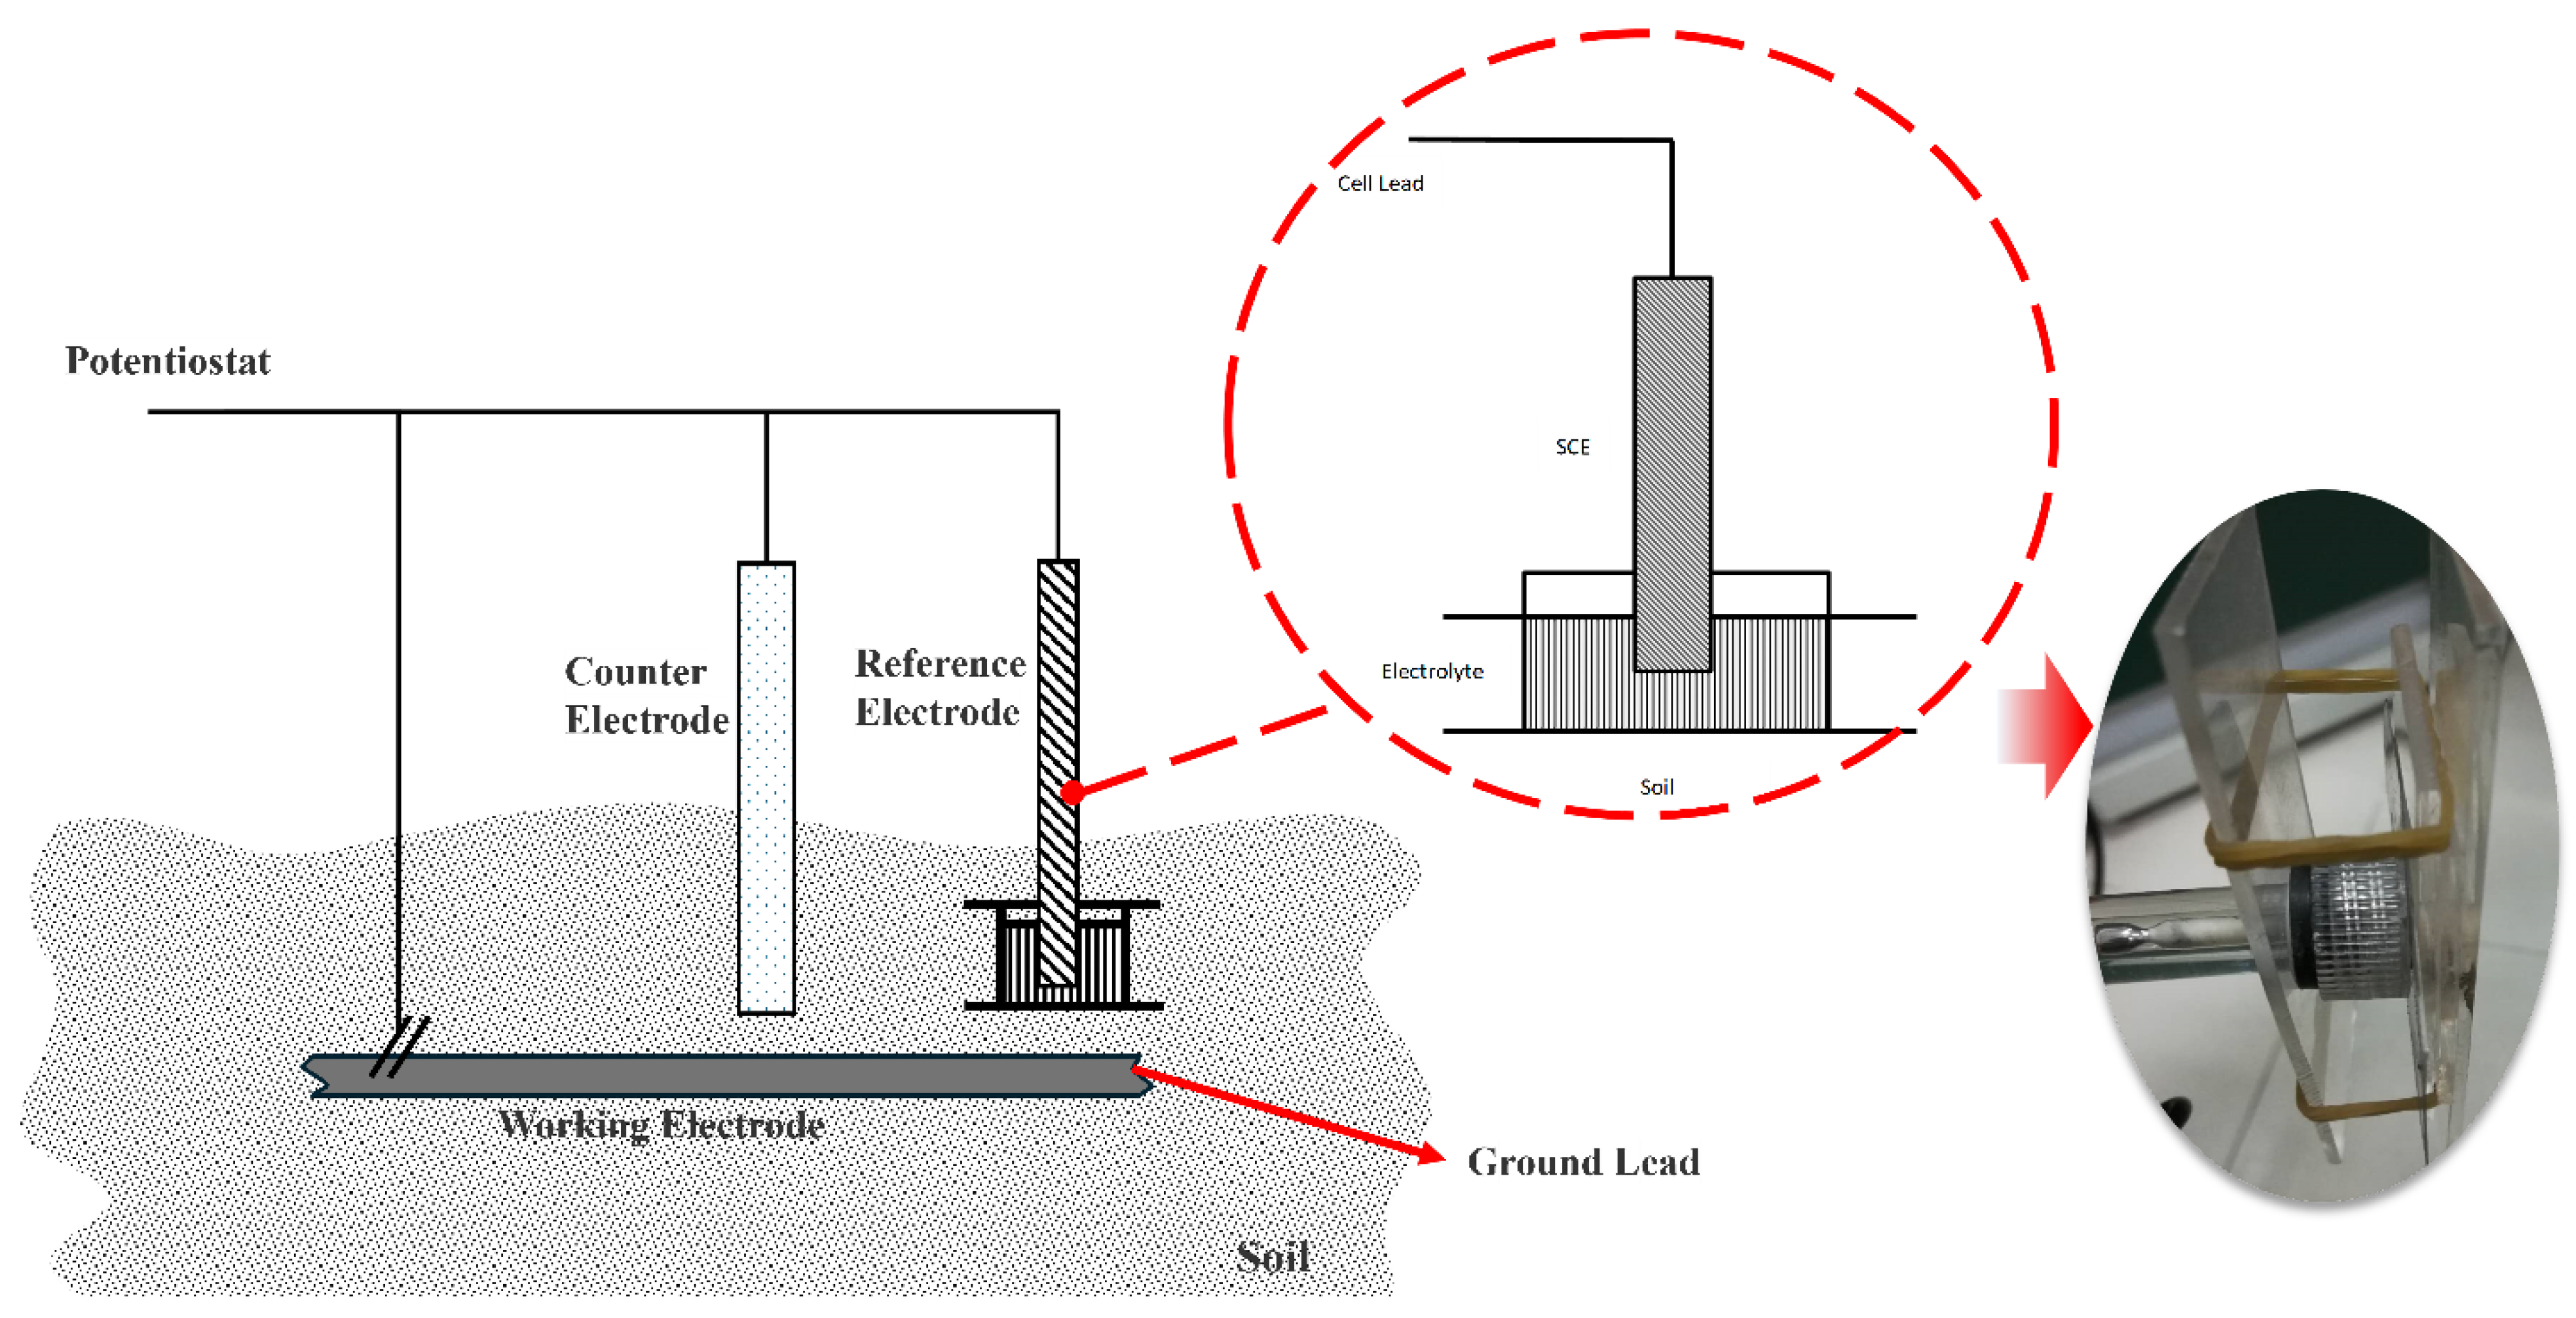
The corrosion potential and rate of buried metal were measured in situ at the excavation site using an electrochemical testing instrument and the dynamic potential scanning technique. The measurement system comprised a potentiostat (Shanghai Chenhua 600E) and a three-electrode system. The electrochemical probe is buried on the surface of the grounding network. Figure 2 shows the working electrode specially designed for this experiment. The scanning rate is 1 mV/s with the platinum electrode as a counter electrode and the saturated calomel electrode as a reference electrode. The polarization resistance is calculated by the linear change in the polarization current and polarization overpotential, and the corrosion rate and corrosion depth are calculated.
The association between overpotential and current density is expressed below based on Tafel’s finding of overpotential (i):
η = a + b·log|i|
where η = overpotential, a = Tafel constant, b = Tafel slope, and i = current density
In accordance with the operating conditions of the electrode, the relationship between current density and overpotential is presented in semi-logarithmic form. In order to estimate the corrosion current density (Icorr) and corrosion potential (Ecorr), a Tafel plot is generated by plotting the logarithm of the current density and overpotential. In accordance with the Tafel relationship extrapolation method, when the polarization potential deviates significantly from the corrosion potential, a linear relationship is observed between the electrode potential and the polarization current density (1). A straight line is obtained in terms of the Tafel constant, which is the amount by which the electrode potential needs to change to achieve a given current. It is possible to infer the Tafel relationship from an observed cathode or anode polarization curve. The corrosion rate can be calculated using Equations (2) and (3):
v = 3.73 × 10 4 × A / n i c o r r         g / m 2 · h
v t = 3.27 × 10 3 × A / n ρ i c o r r            mm / a
The corrosion rate, denoted by the corrosion depth, is given by vt. In this equation, A represents the atomic weight of the metal, n represents the number of electron transfers, and v represents the corrosion rate stated in terms of corrosion quality.

2.3. Soil Physical and Chemical Properties

2.3.1. pH Measurement

To determine soil pH according to the national standard NYT 1121.2-2006, a water-to-soil ratio of 2.5:1 is recommended. A total of 10.0 g of soil sample was weighed and placed in a 50 mL beaker. Then, 25 mL of deionized water was added, the container was sealed with a sealing film, and the mixture was stirred rapidly for 2 min using a magnetic stirrer. The mixture was left to stand for 30 min before the pH of the supernatant was measured using a pH meter (Thunder magnetic PHS-3C) within 1 h.

2.3.2. Measurement of Total Water-Soluble Salts

To determine the total water-soluble salts in soil, the federal standard NYT 1121.1-2006 was followed. A total of 50 g of an air-dried soil sample was weighed, passed through a 2 mm sieve, and placed in a 500 mL plastic bottle with a wide mouth. Then, 250 mL of distilled water that was free of carbon dioxide was added and the bottle was shaken for 3 min on an oscillator. The mixture was filtered without air and the 10 mL filtrate was discarded to produce a clean filtrate for later use. To test the magnetic evaporator, 20 mL of a clear solution was added. The evaporator was placed in water and allowed to dry through evaporation. In situations where a yellowish-brown substance was observed, a hydrogen peroxide solution was applied to oxidize it to a white solution. After oven-drying for 4 h, the sample was cooled and weighed using an analytical balance. Next, the sample was oven-dried for an additional 2 h until it reached a constant weight, known as the drying residue. This was achieved when the difference in secondary weight was less than 0.0003 g. The result can be calculated using the following equation:
Total   water - soluble   salts :   g kg = m a m b ×   D   × 1000 m
where
  • ma = drying quality of evaporation dish + salt (g);
  • mb = drying quality of evaporating dish (g);
  • D = partition multiple, 250/20~50;
  • m = weight of the air-dried sample (g).

2.3.3. Determination of Chloride Ions

To determine the chloride ion content of the soil, the national standard NYT 1121.2-2006 was followed. A total of 50 g of air-dried soil sample was weighed, passed through a 2 mm sieve, and placed in a 500 mL plastic bottle with a wide mouth. Then, 250 mL of carbon dioxide-free distilled water was added and the bottle was shaken for 3 min on an oscillator. The air was removed promptly and the mix was filtered. The 10 mL filtrate was discarded to produce a clean filtrate for later use. The chloride ion concentration of the backup filtrate was measured using a chloride ion-sensitive electrode (CL43-A0001) [20,21].

2.3.4. Determination of Moisture Content

Soil water content can be confidently determined in accordance with the national standard GB 7172-1987. The procedure involves selecting representative air-dried soil samples, crushing it, passing it through a 1 mm screen, mixing them equally, and storing them for later use. The soil sample was mixed and evenly placed in an aluminum box. The box was then closed and weighed to the nearest 0.001 g. After baking in a preheated oven at 105 °C for 6 h, the box was immediately weighed and covered before being placed in a dryer to cool to room temperature for approximately 20 min [22,23]. To determine the moisture content of the air-dried soil sample, take two parallel measurements and use the following equation:
Moisture   ( dry   basis ) :   % = m 1 m 2 m 1 m 0 × 100
where
  • m0 = mass of dry empty aluminum box (g);
  • m1 = mass of the aluminum box and soil sample before drying (g);
  • m2 = mass of the aluminum box and soil sample after drying (g).

3. Results and Discussion

Through the field observation of the grounding network material (Figure 3), it can be seen that serious corrosion occurs on the surface of Q235 steel. This phenomenon can be attributed, on the one hand, to the exposure of metal materials to wet and electrolyte-containing soil environments. Additionally, the metal surface exhibits microscopic inhomogeneity. The microscopic inhomogeneity will result in the formation of numerous micro-anode and micro-cathode regions, which will facilitate the electron transfer between the electrolyte and the metal surface, thereby initiating electrochemical corrosion. Taking zinc–copper primary cells as an example, the anode and cathode reactions are as follows:
Fe → Fe2+ + 2e
2H+ +2e → H2
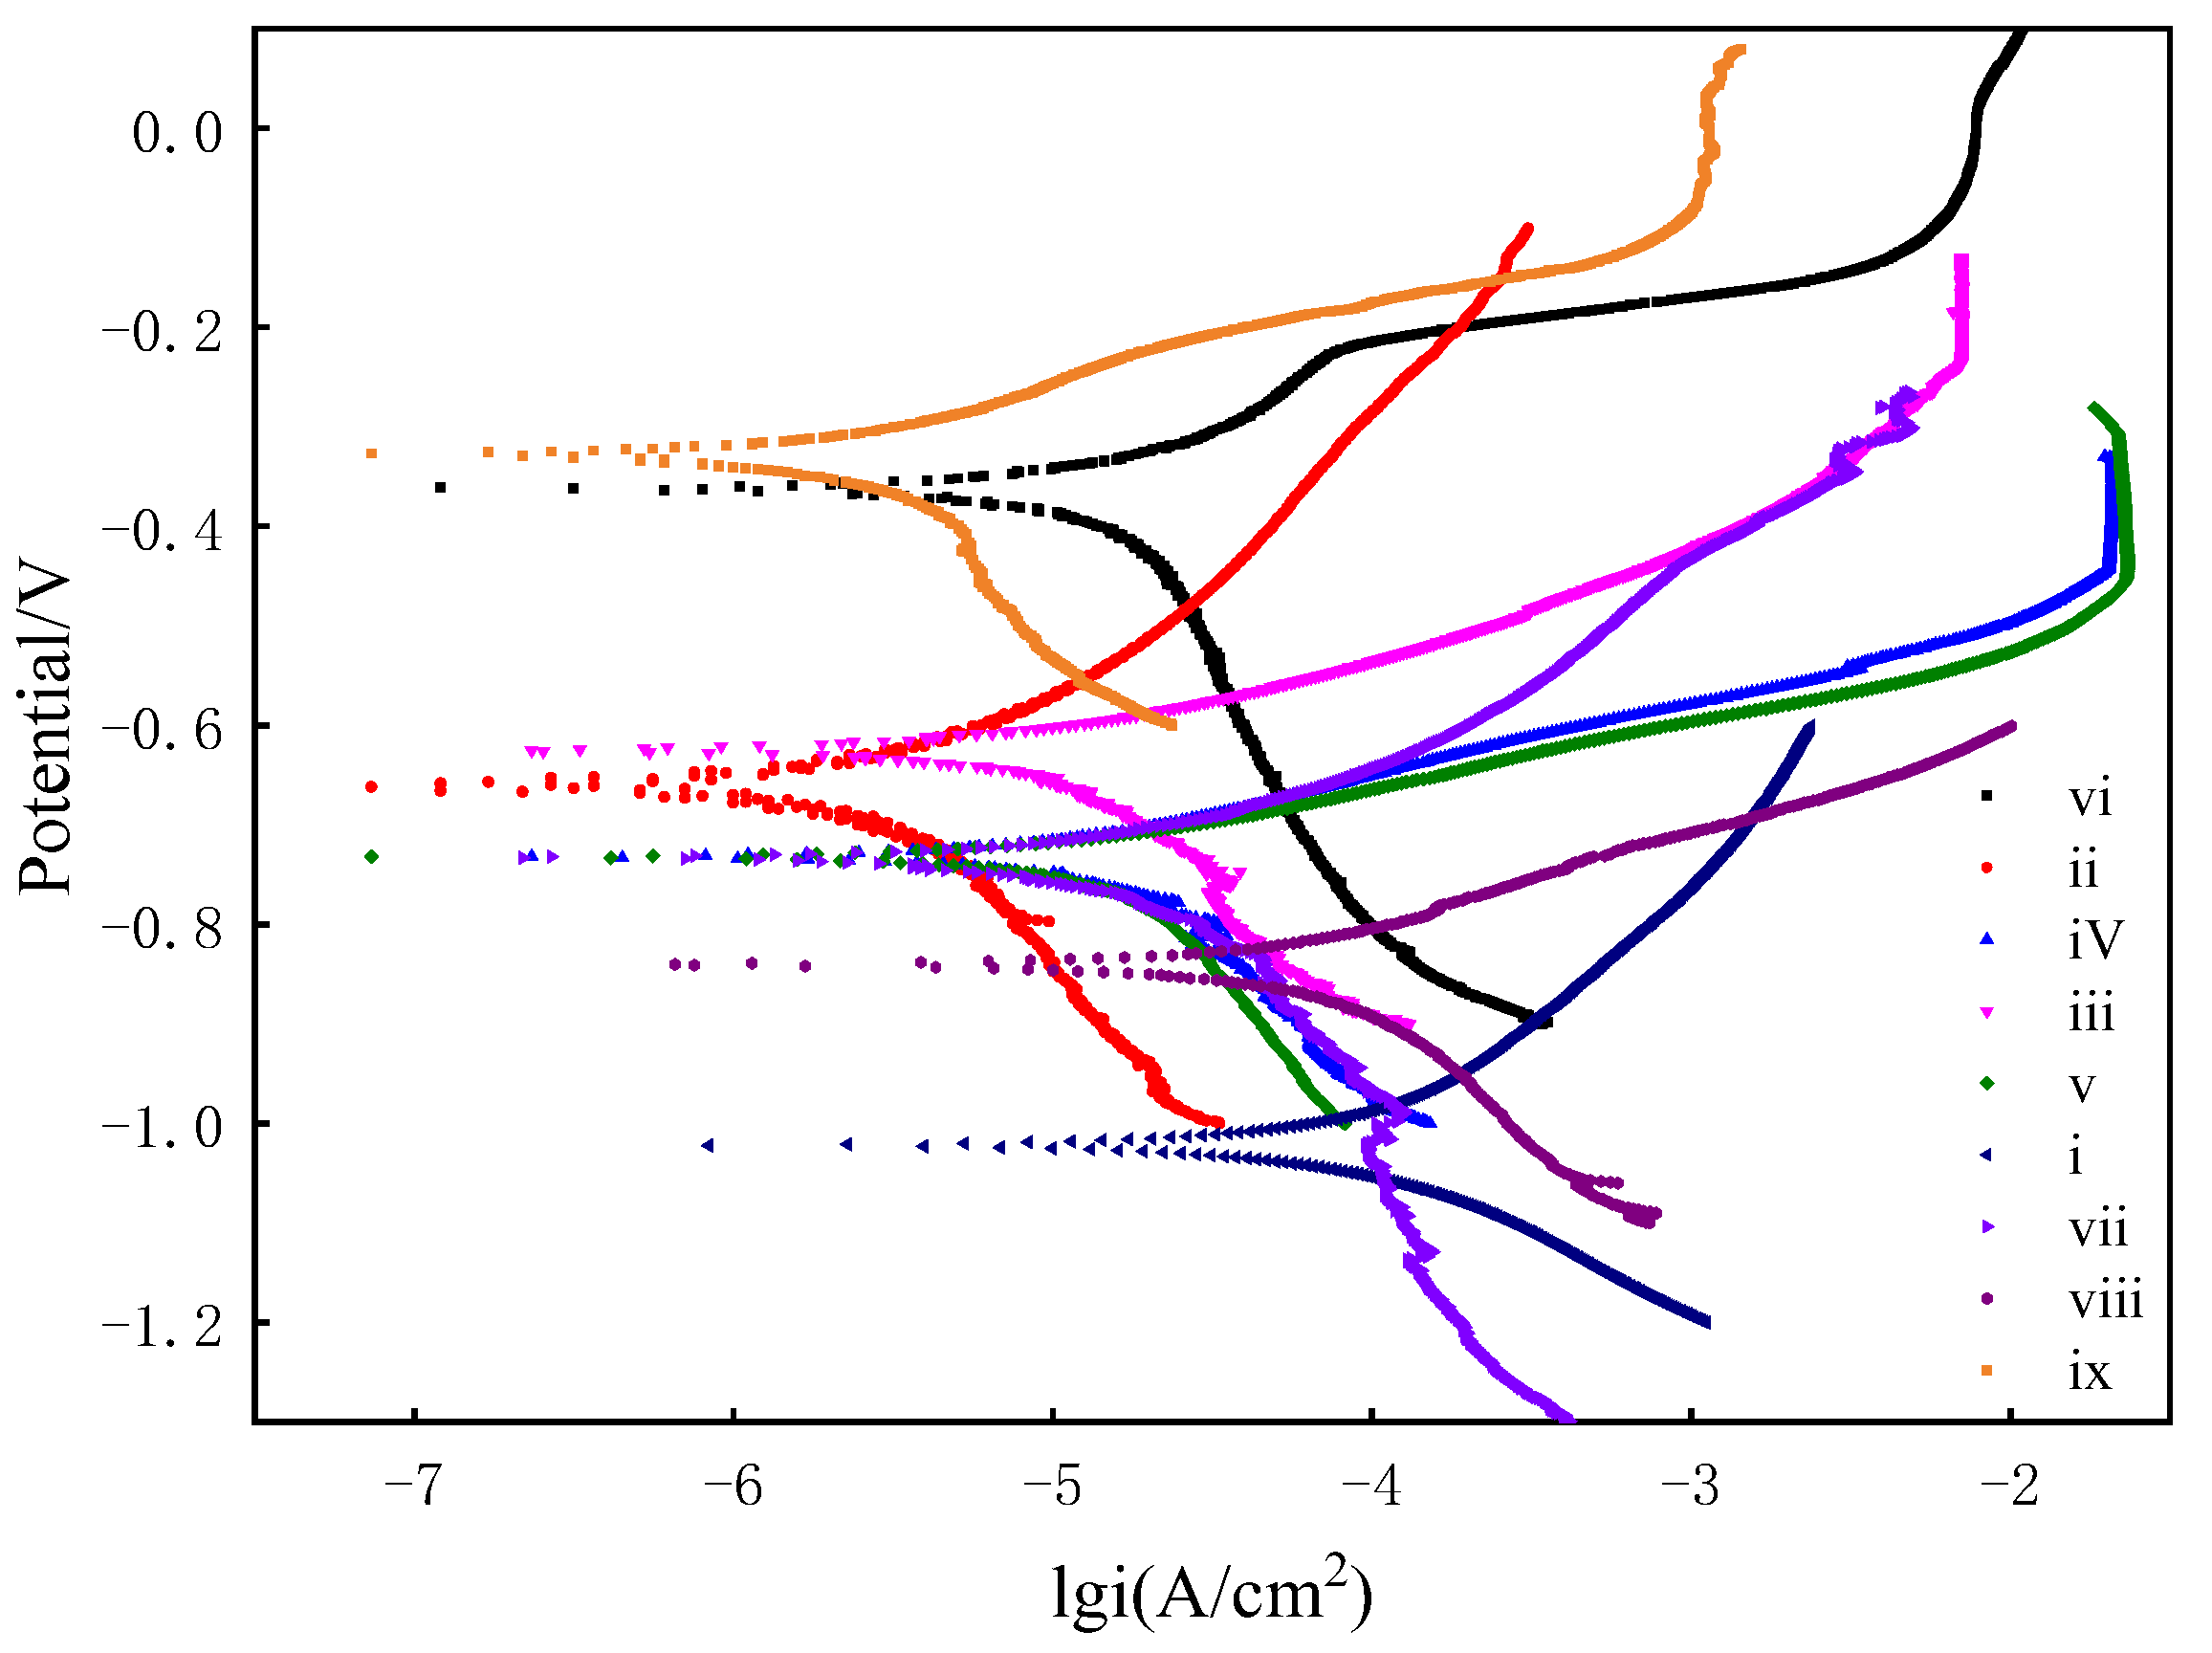
The metal electrochemical Tafel curves of the underground down conductors across eight substations are presented in Figure 4, where ix is the galvanized steel table curve data of a substation earthing network. It is worth noting that the corrosion potential of grounding grid metals is significantly influenced by different soil types, with a range of −0.23 to −0.75 V. Additionally, the Tafel plots of the same material in soil exhibit different characteristics. Most curves do not possess passivation properties, although some, such as the anodic polarization curve of vi, do. Additionally, the cathodic polarization curves of vi and viii exhibit stronger polarizability than the anodic part, possibly due to the higher Cl concentrations. Similarly, most curves do not have this characteristic.
Table 1 shows the corrosion current density, corrosion potential, and corrosion rate of Q235 steel and galvanized steel in the ground wires of the eight substations. The results showed that there were significant differences in soil environment at eight monitoring sites, which led to different corrosion rates of carbon steel and galvanized steel at the eight monitoring sites. The results of the comparison demonstrate that the galvanized layer is an effective means of slowing down the corrosion of the basis material in a soil environment. Galvanized steel exhibits excellent corrosion resistance when used in the application of ground grid drawing down lines. Nevertheless, the corrosion of carbon steel represents a significant challenge, which has become the primary focus of this experiment.
The corrosion rate obtained from online electrochemical testing is relatively higher than that obtained from traditional hanging plate corrosion experiments. This difference is likely due to the limited mass transfer of materials in the latter, which affects the corrosion rate, or to the generally short hanging time and incomplete formation of the protective film on the surface. In summary, this study proposes an online electrochemical on-site testing method that derives the corrosion rate from the Tafel plots in the activation zone. The obtained data can provide significant guidance, despite the possibility of resistance polarization in actual hanging pieces. Moreover, the time required for on-site electrochemical testing is relatively short.
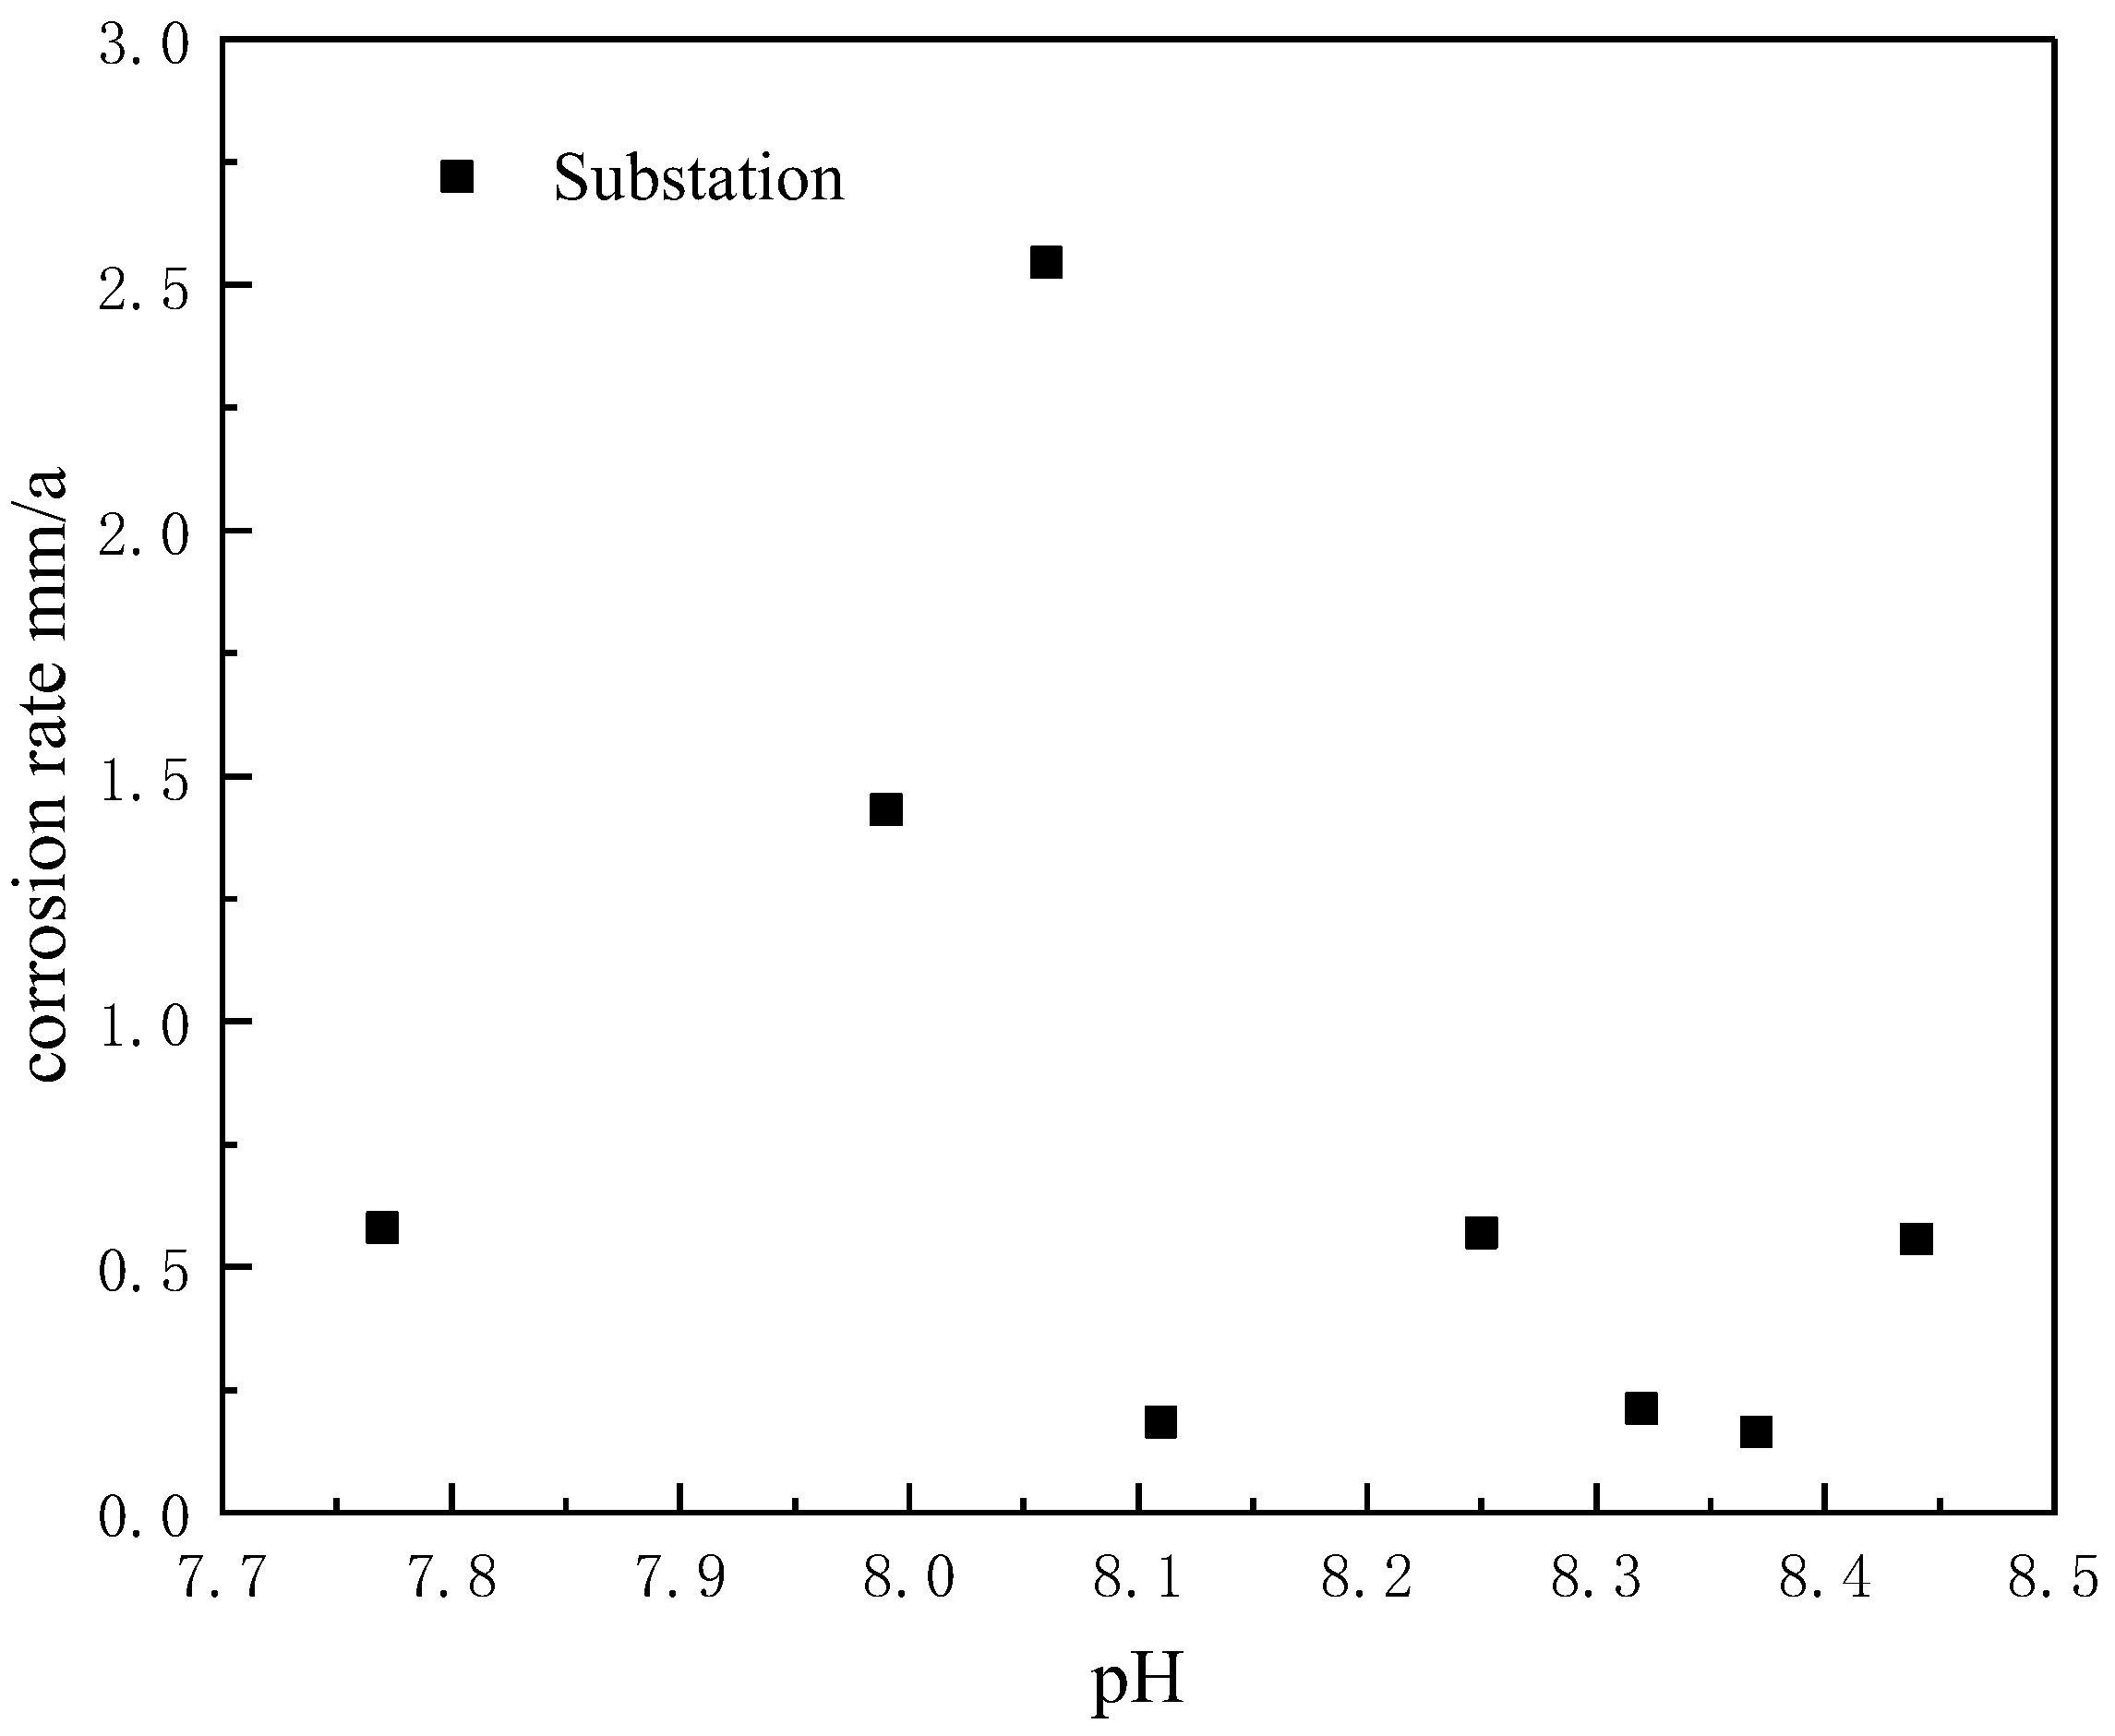
Figure 5 demonstrates that there is no significant correlation between the rate of corrosion of the down lead and the minimal range of pH value change, despite the mildly alkaline pH between 7.5 and 8.5 in the soil of each substation.
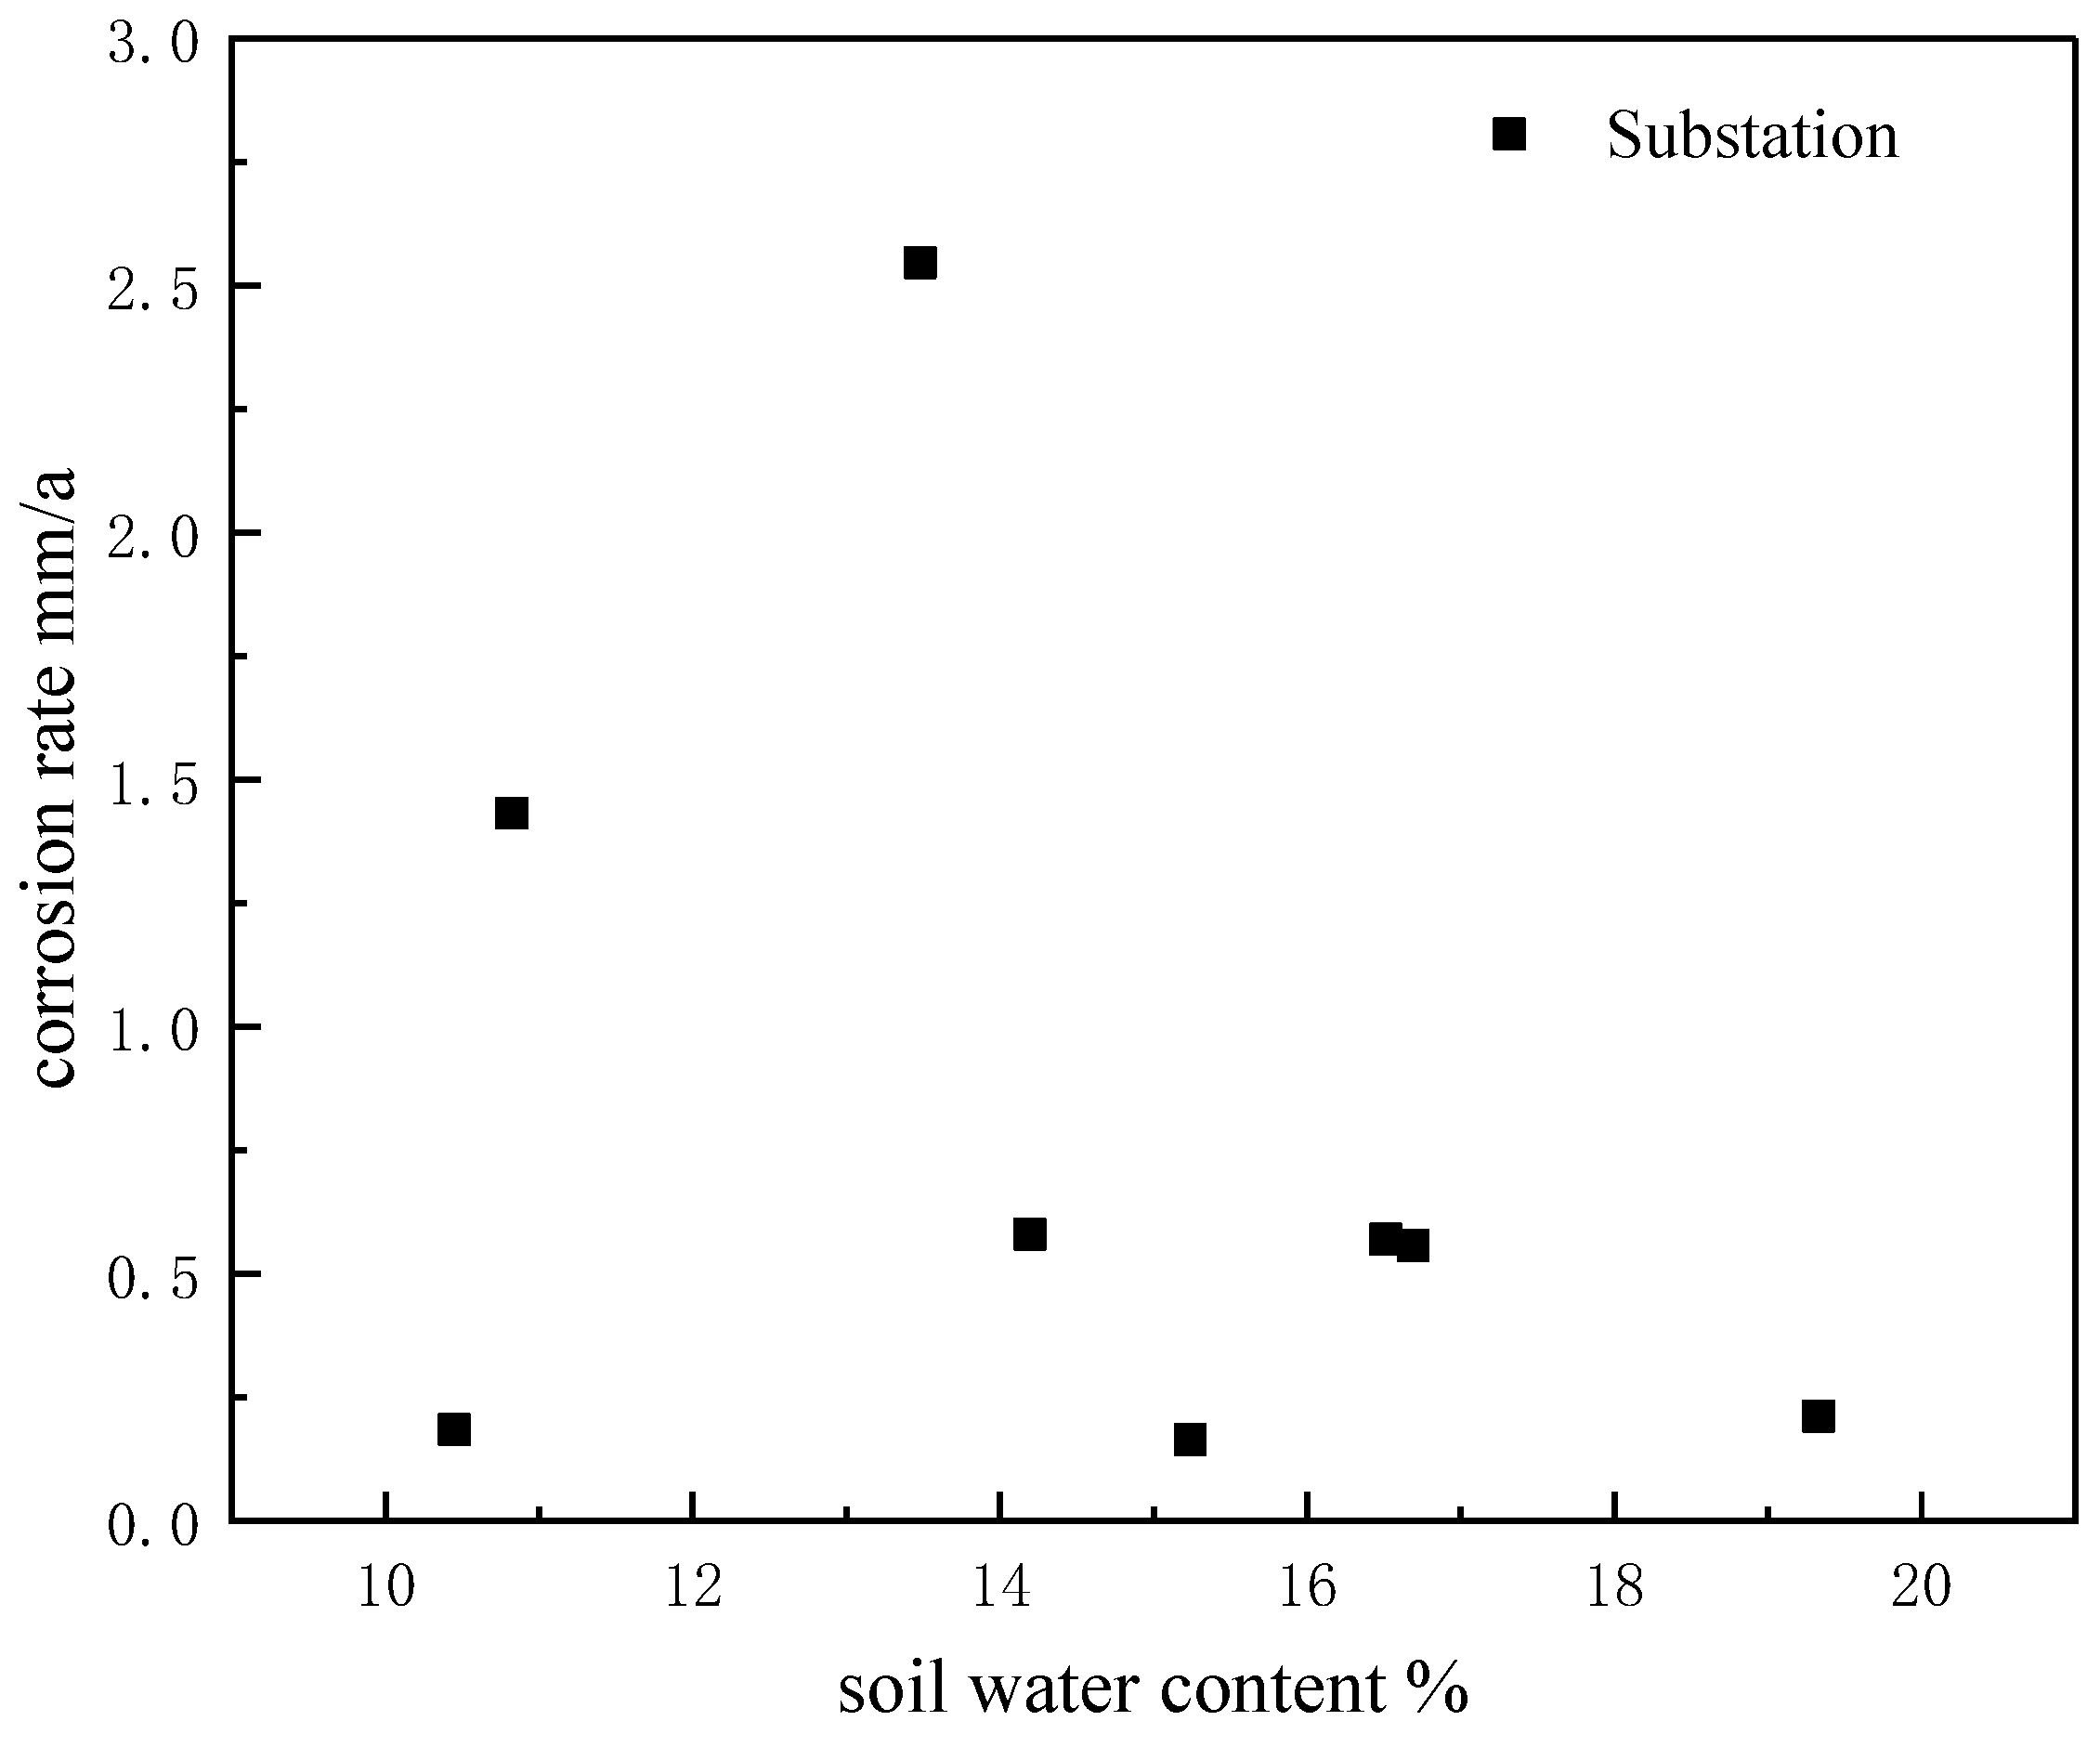
Figure 6 demonstrates the correlation between the corrosion rate and soil water content in each substation. As previous studies have shown, the corrosion rate of carbon steel in simulated soils follows a trend of initially increasing and then decreasing with increasing water content. It is noteworthy that the corrosion rate reaches its maximum when the moisture concentration is from 20% to 45%. The experiment demonstrated that a decrease in soil moisture content led to an increase in the polarization corrosion rate. This correlation can be attributed to the significant influence of Cl and total salt content on the soil’s corrosion properties at a certain water content, as observed in the range of 10% to 20% soil moisture content.
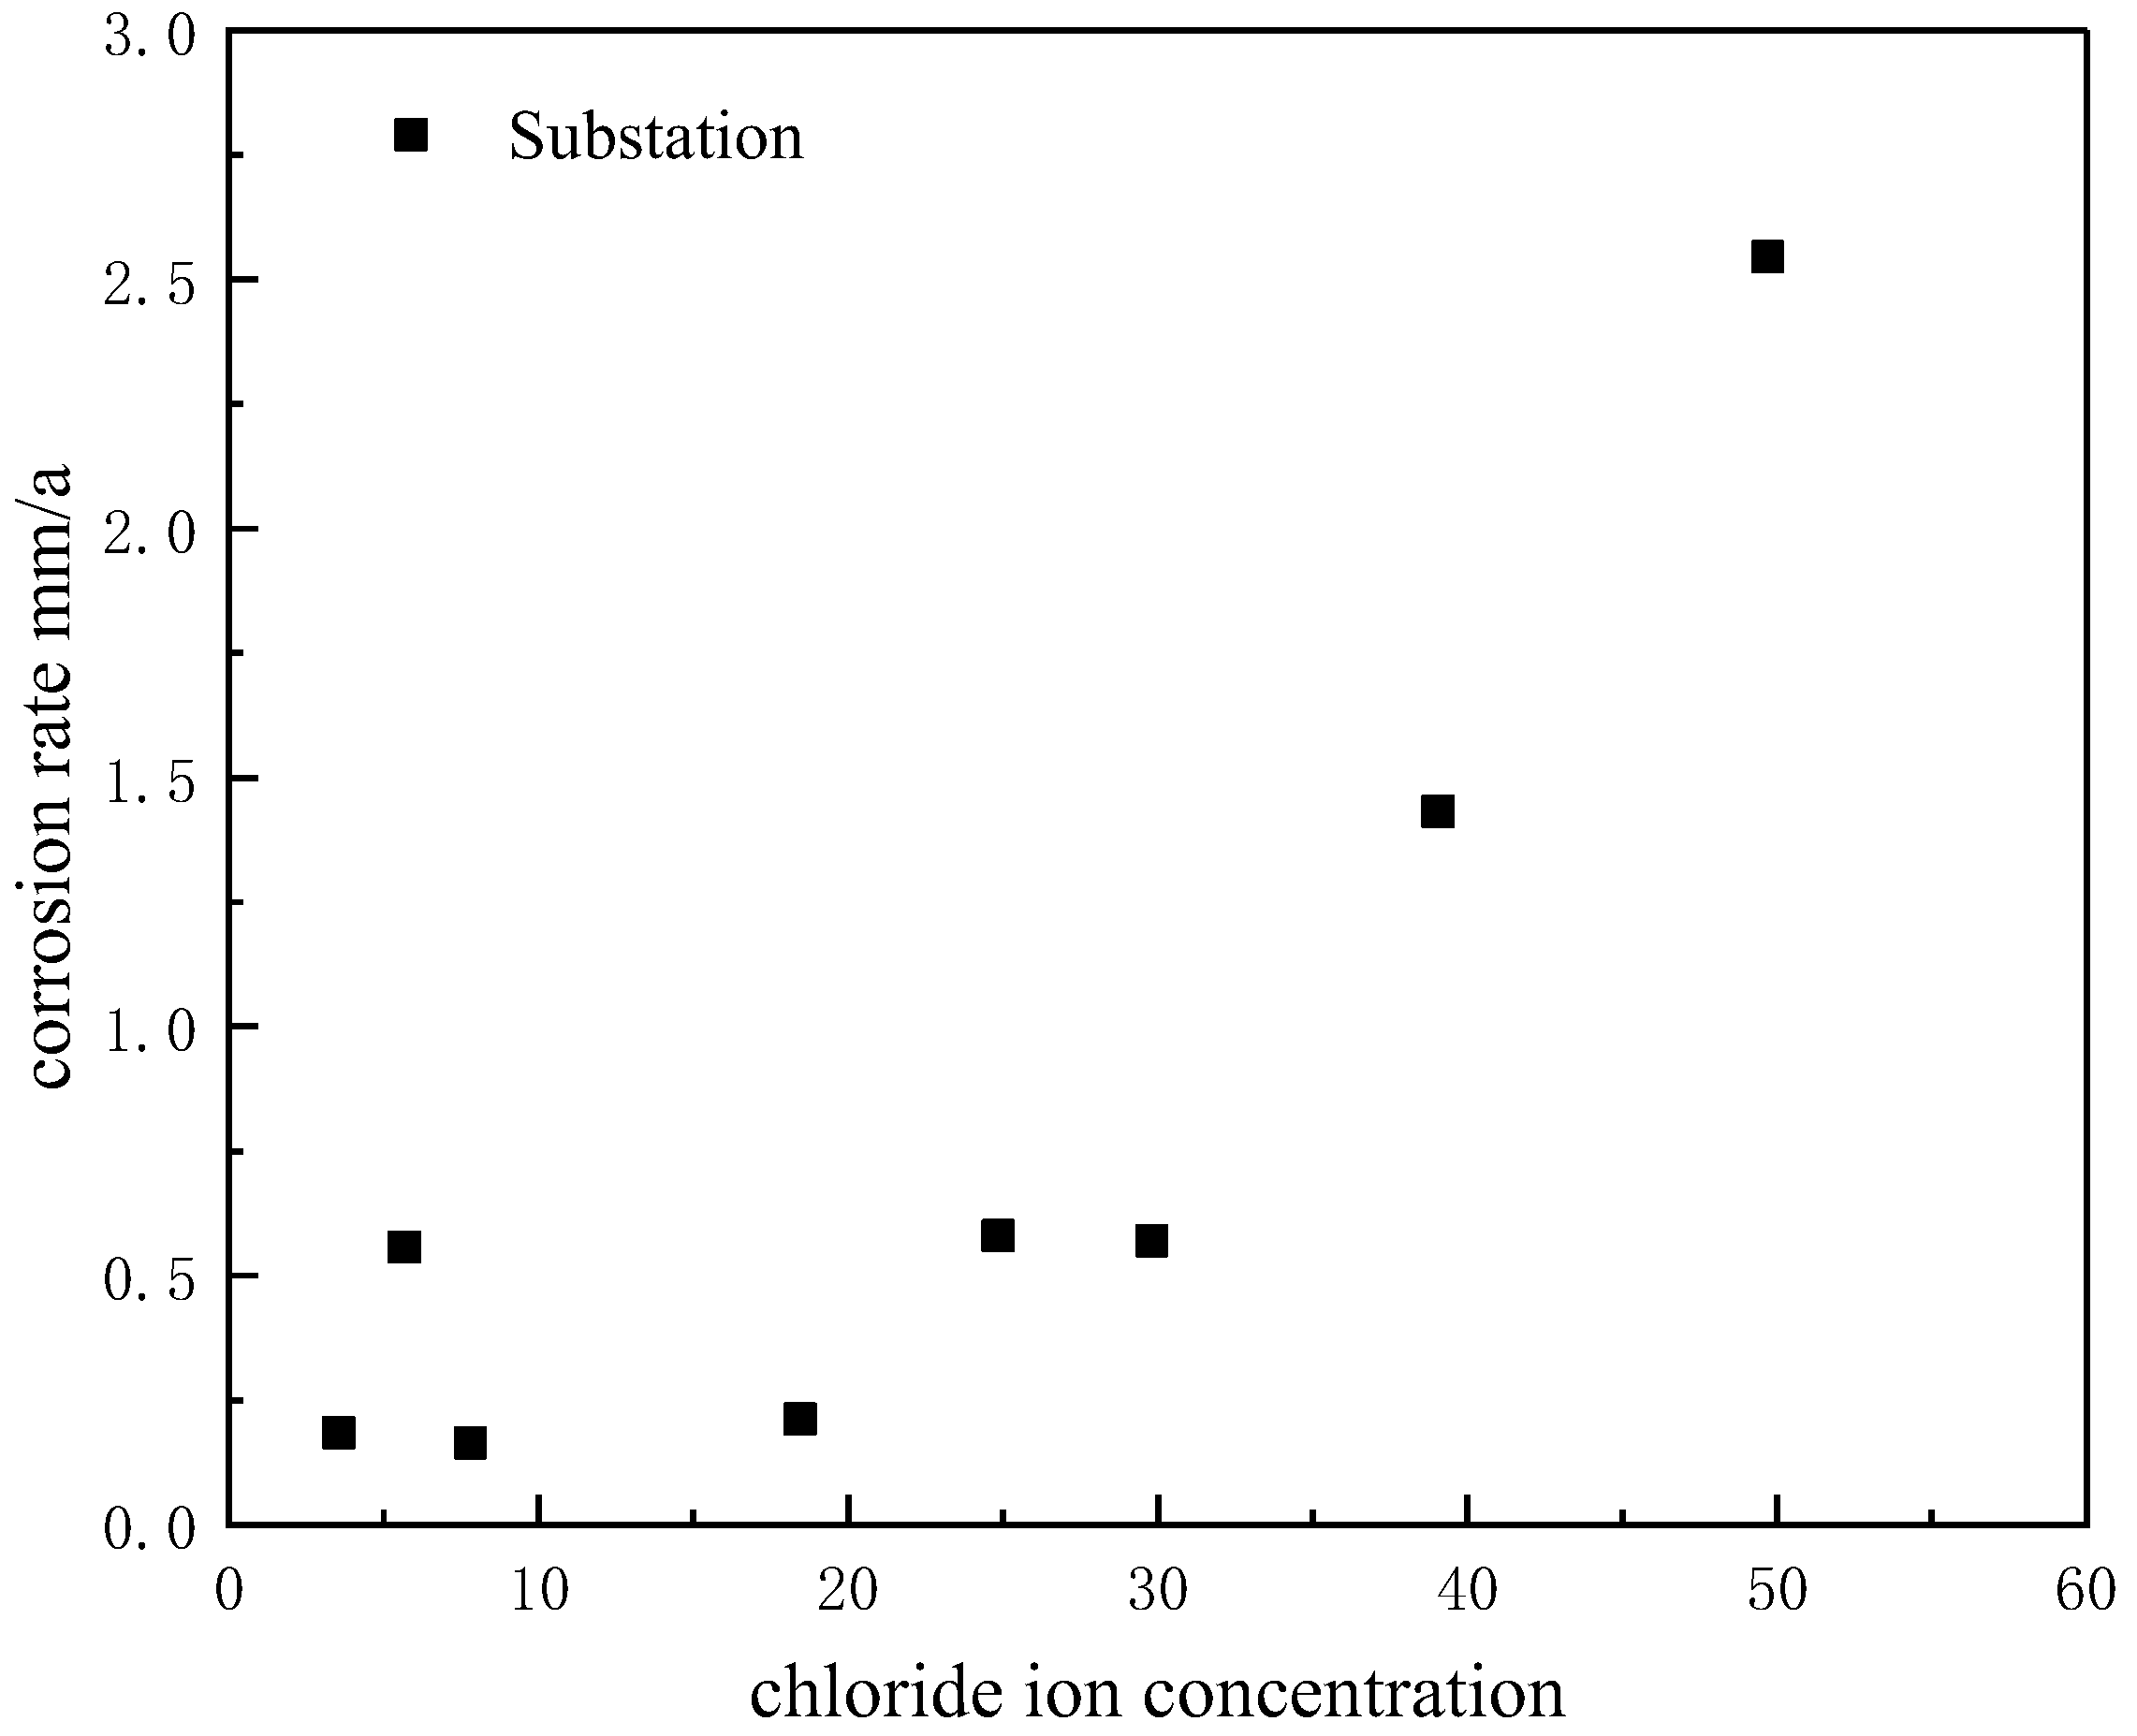
Figure 7 demonstrates the strong positive correlation between soil Cl ions and the polarization corrosion rate. The data show a significant increase in Cl concentration from a few mg/kg to over 50 mg/kg, which has a notable impact on the corrosion of grounding wires. These results are in line with previous studies [24,25].
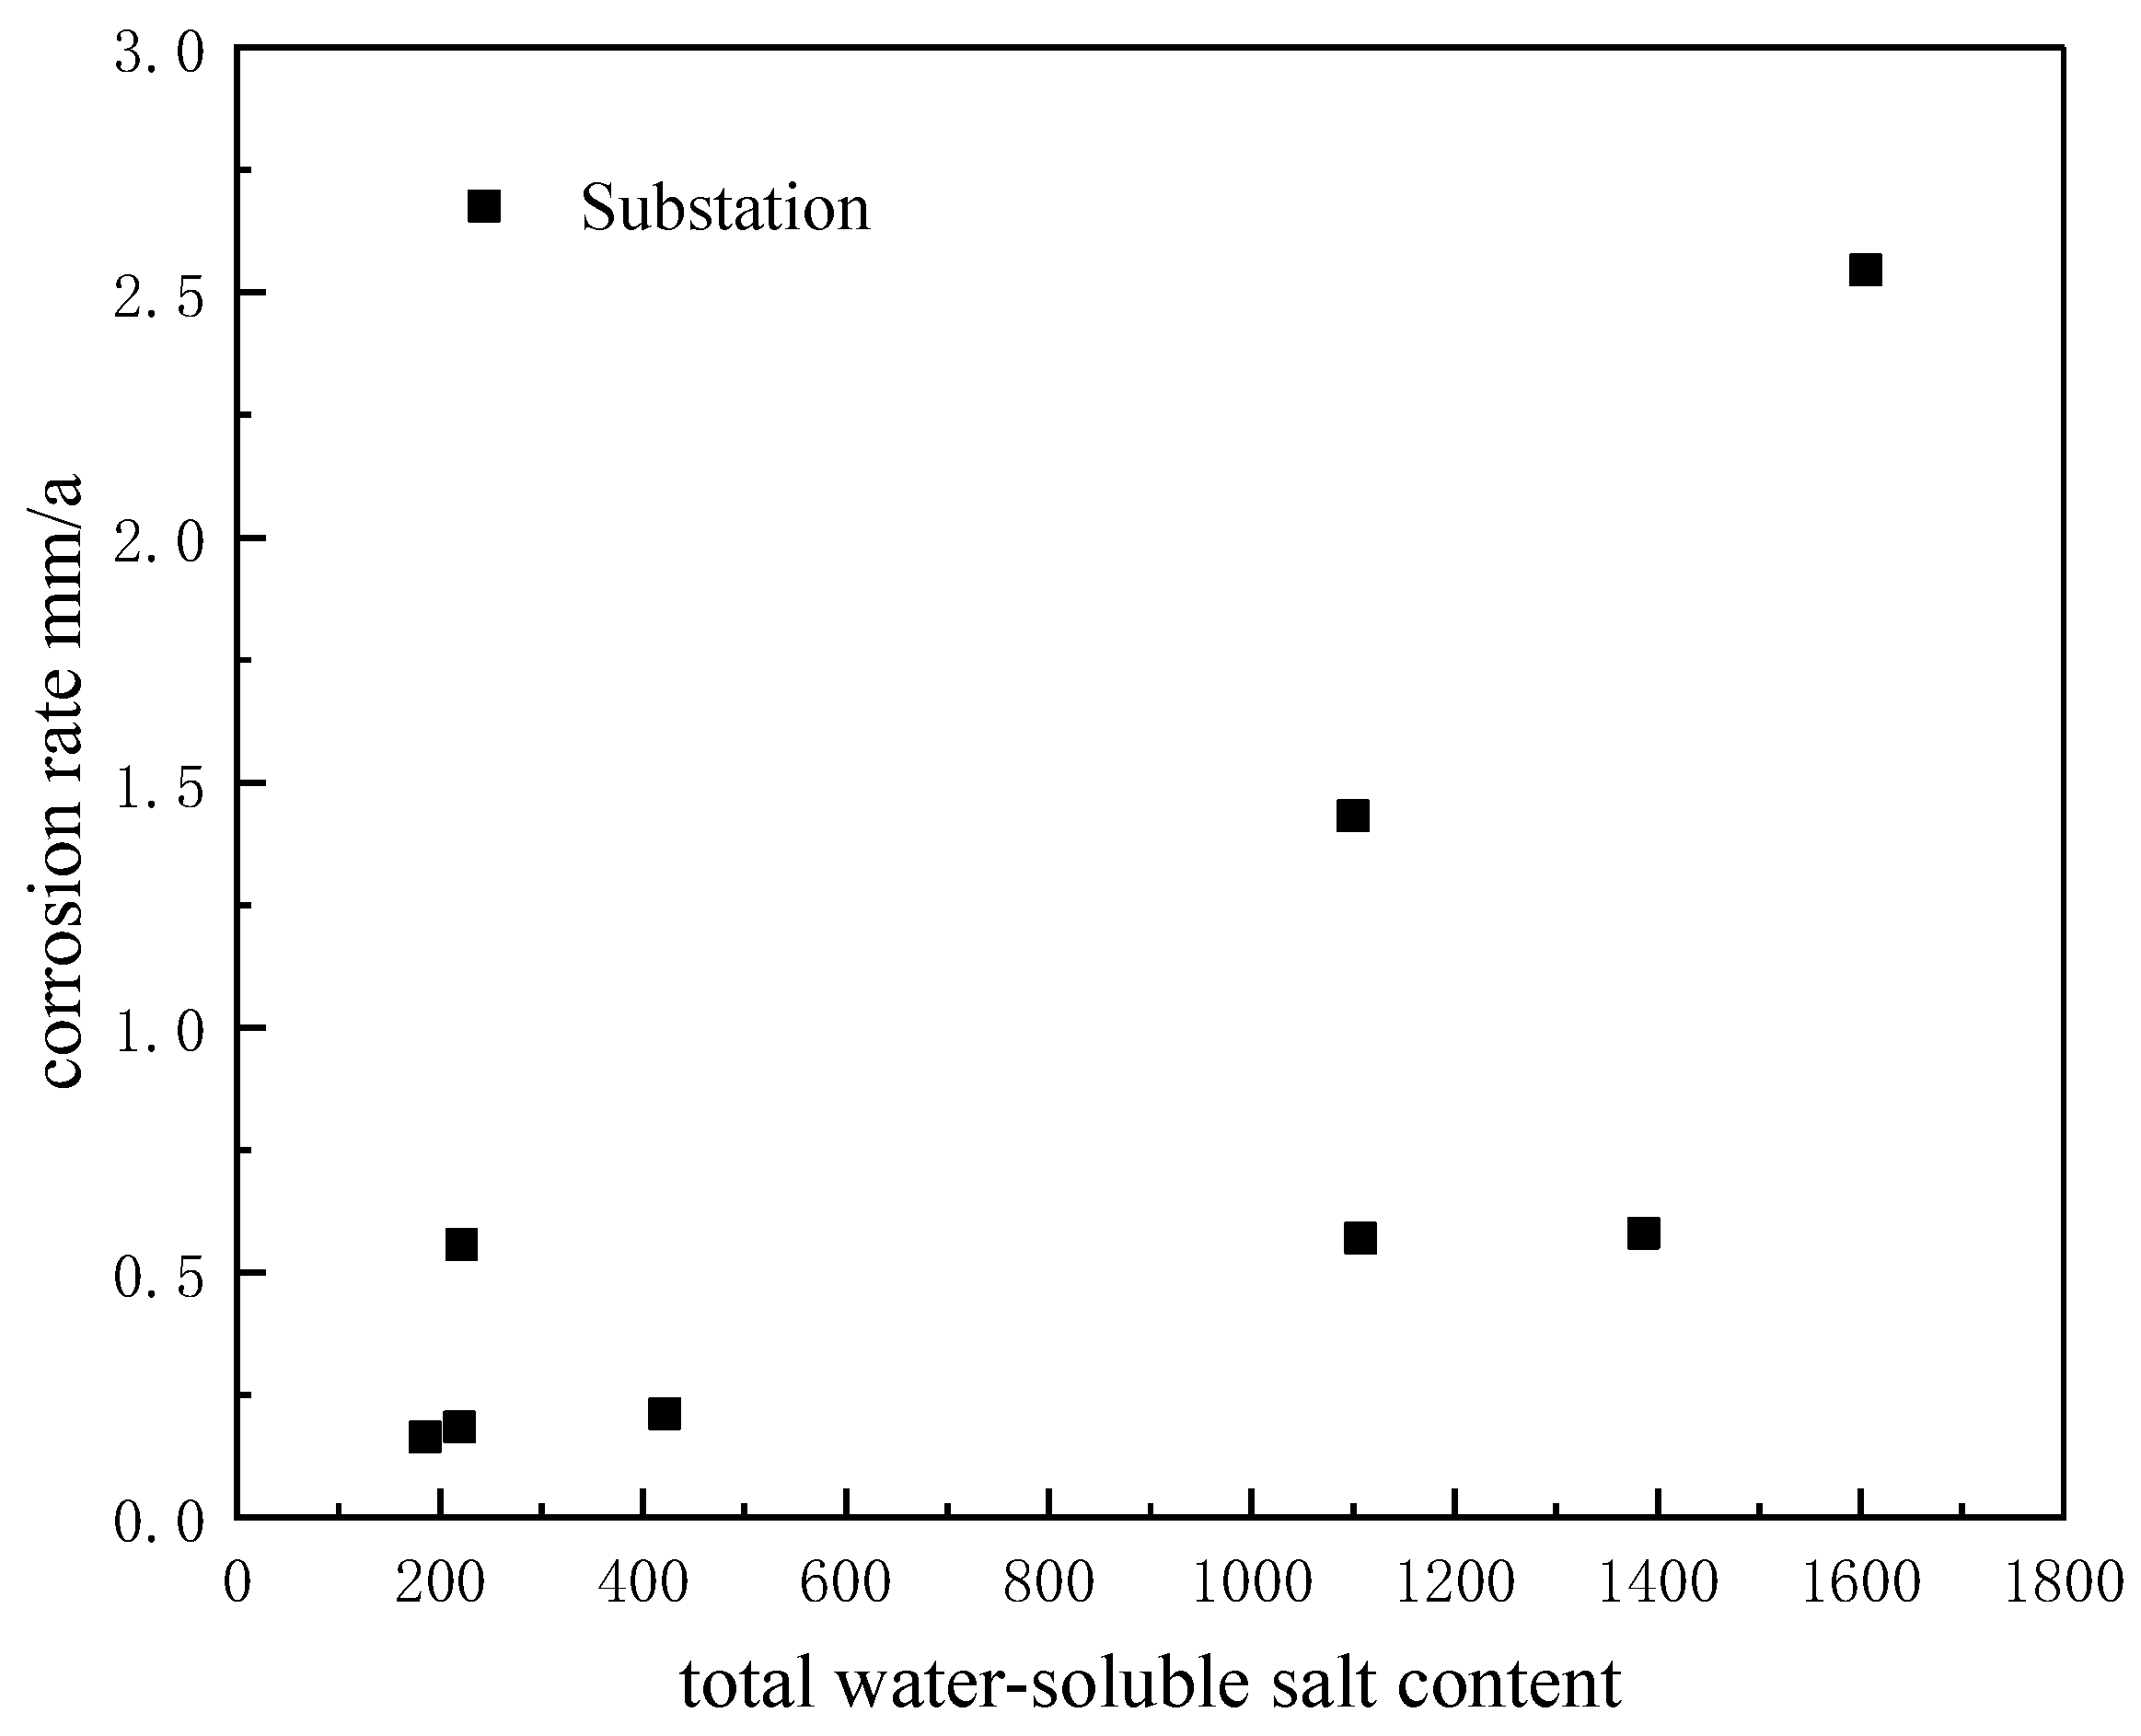
Figure 8 demonstrates a clear correlation between the total amount of water-soluble salts and the polarization corrosion rate in the substation soil. The soil’s water-soluble salt content ranges from 20 to over 1500 mg/kg, with a corresponding increase in the polarization corrosion rate as the overall amount of water-soluble salt content increases. The figure demonstrates a positive correlation between water-soluble total salts and corrosiveness. However, the correlation is not as significant as that of chloride ions, which is consistent with the findings of a previous study [26,27]. Carbon steel corrosion is likely caused by other water-soluble salts, particularly anions, in the soil.

4. Multiple Linear Regression Analysis

The third section of the paper considers the impact of soil factors on the corrosion of Q235 steel. In order to further determine the correlation between the physical and chemical properties of soil and the average corrosion rate, it is necessary to consider the interaction between the physical and chemical properties of soil and the average corrosion rate. The comprehensive influence of the main factors on the average corrosion rate of Q235 steel is revealed. The relevant data in Table 1 and Table 2 [28] were processed using the multiple linear regression method.
From the values of R² (the proportion of the variance of the dependent variable that is collectively explained by the independent variables) and adjusted R², the model has a high degree of fit (R2 = 1, adjusted R2 = 0.999), indicating that the selected independent variable has a good ability to explain the corrosion rate of the dependent variable. The results of the F-test (significance of the entire fitted equation, F = 5561.255, p = 0.010 **) further verified the overall significance of the model. The probability p = 0.010 < 0.05 corresponding to F shows significance at the level. The corrosion rate is expressed as follows:
rcorr (mm/a) = −24.952 − 0.194 × Soil resistivity (Ω·m) + 0.01 × Chloride ion concentration (mg/kg) + 3.869 × pH + 0.001 × Total water-soluble salts (mg/kg) − 0.417 × Moisture content (%) + 0.005 × Sulfate concentration (mg/kg).
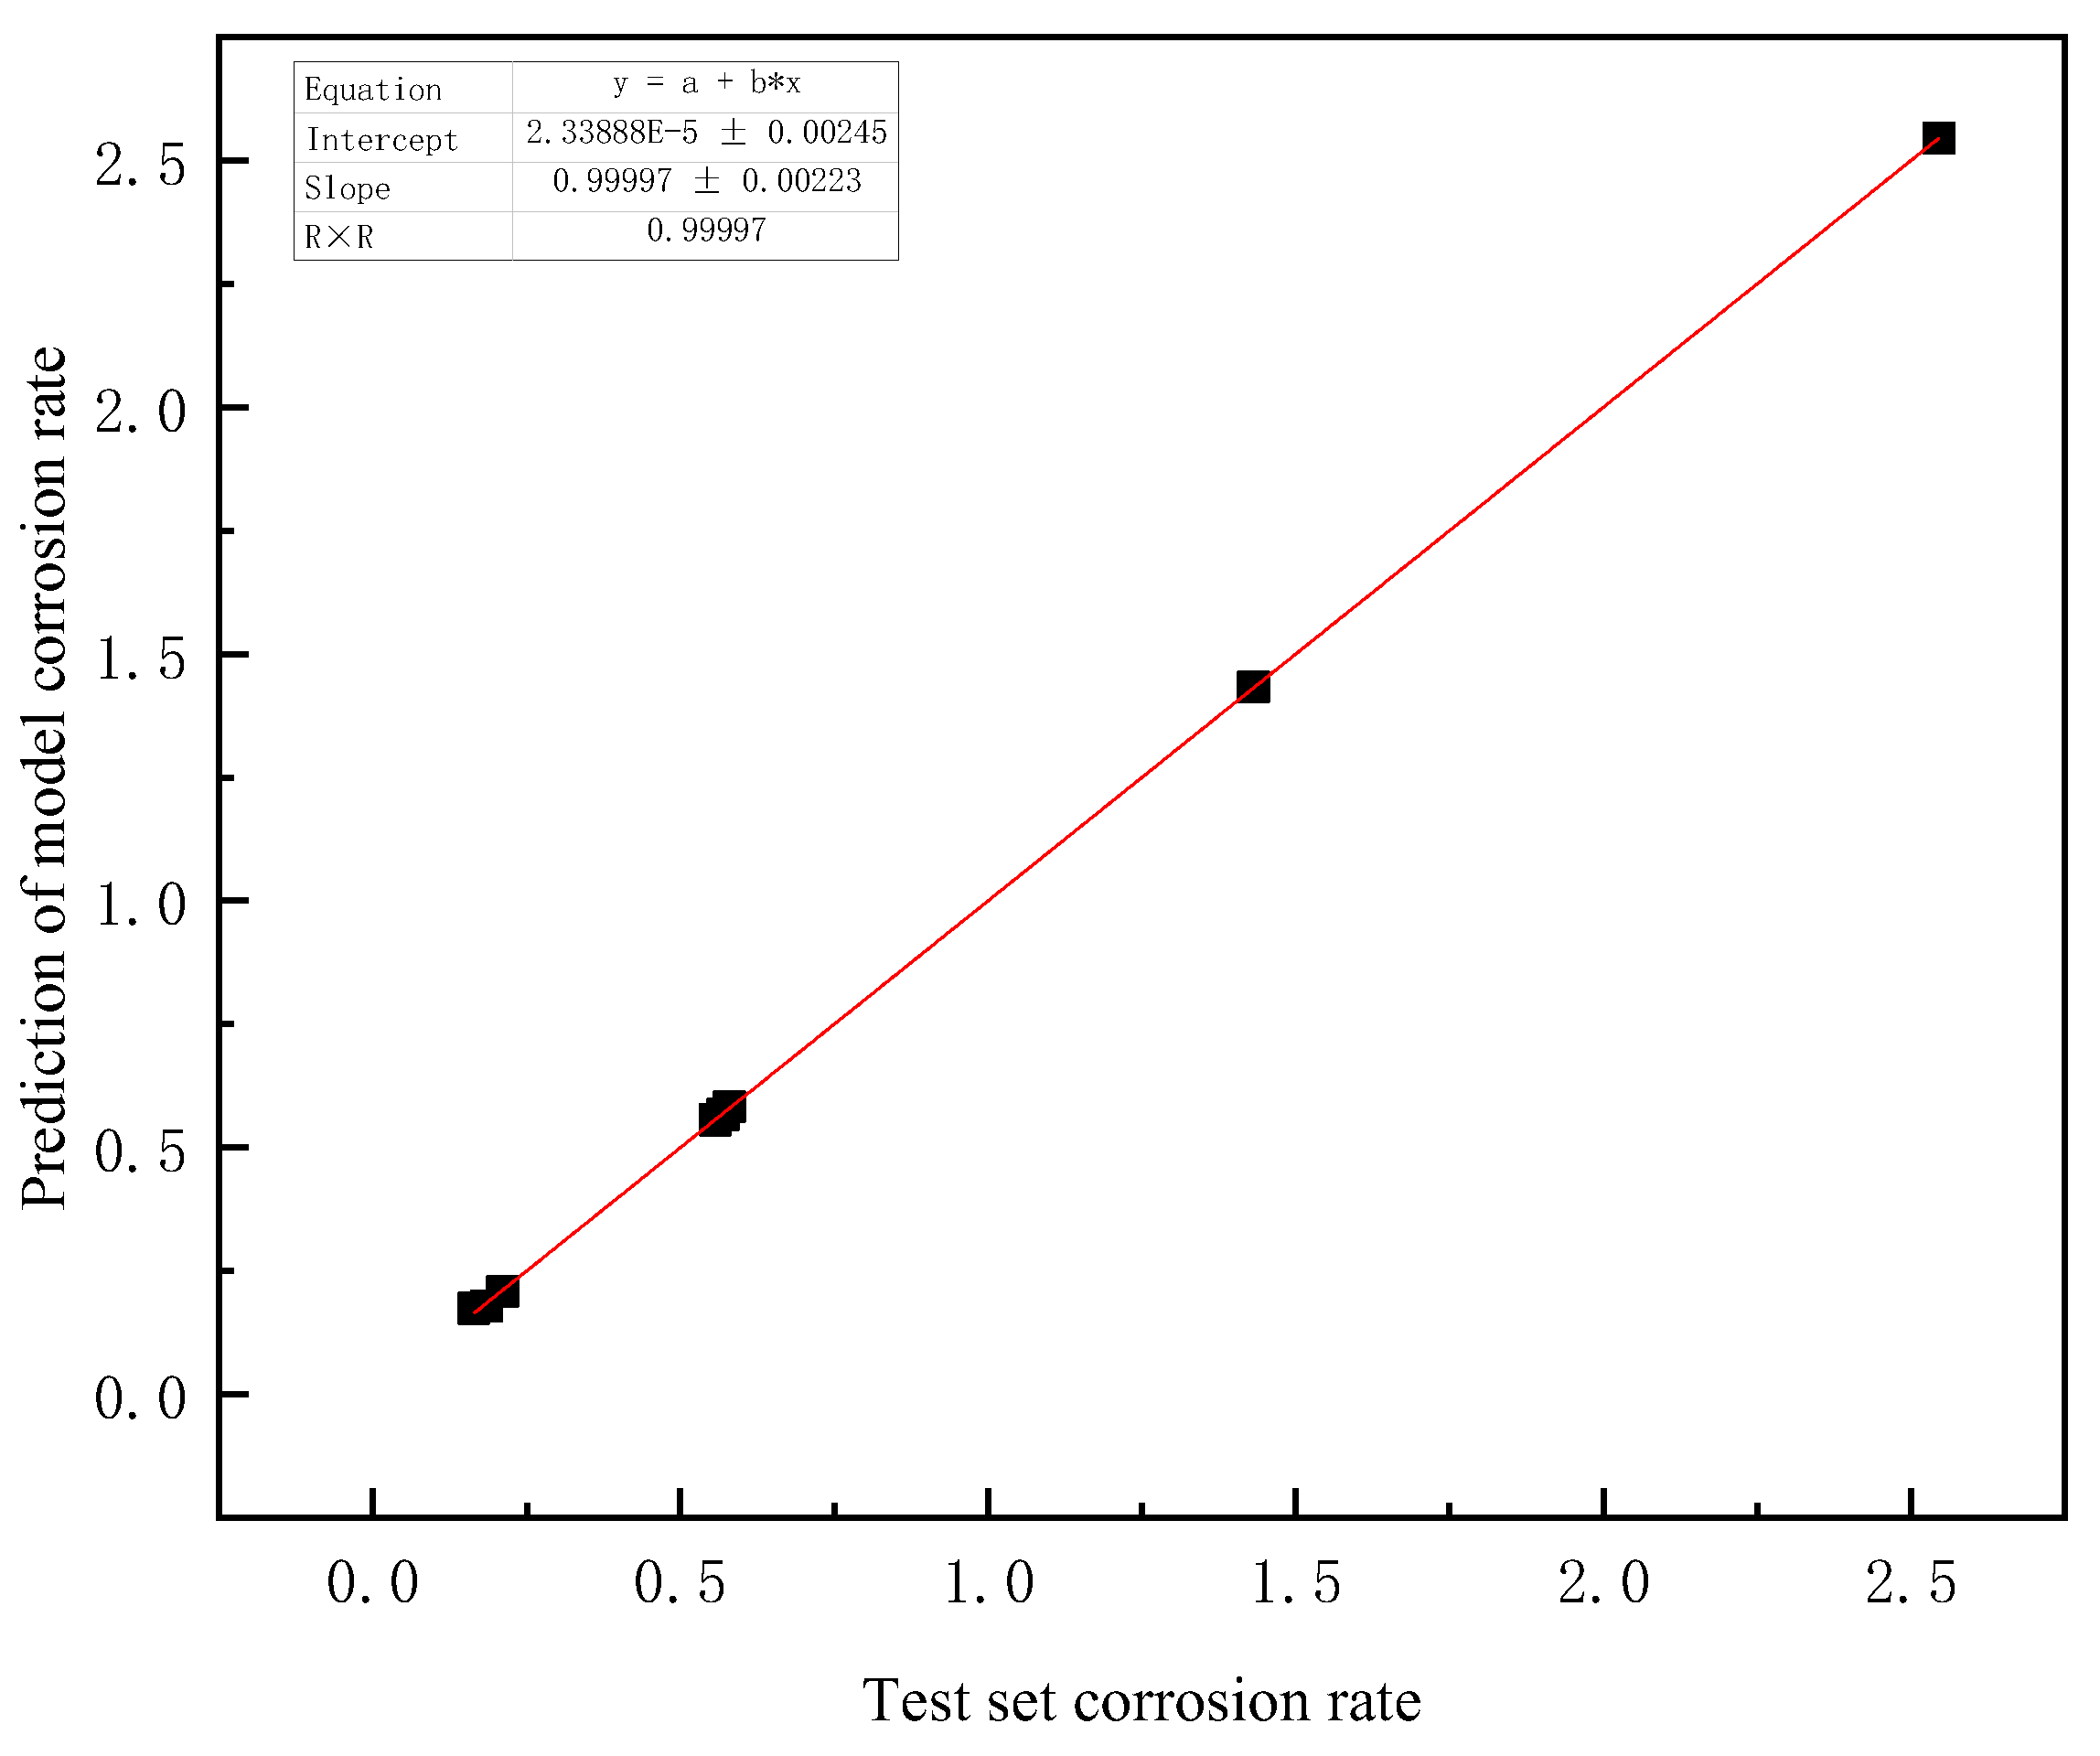
The corrosion factor data from the site where the test set is located are brought into the corrosion prediction model formed by regression. The obtained corrosion data are taken as the Y axis, and the corrosion data obtained by soil corrosion in the test set are taken as the X axis to draw the scatter plot. A trendline is drawn and goodness of fit is obtained (goodness of fit represents how close the corrosion prediction data of the test set obtained by the prediction model are to the actual value). As shown in Figure 9, the goodness of fit of the model reached 0.999.

5. Conclusions

This study confidently examines the corrosion status of grounding grids in eight coastal provinces in North China through on-site excavation and electrochemical investigation. The correlation between the corrosion status of Q235 carbon steel, determined via electrochemical investigation, and the pH value, water content, Cl ion concentration, and soluble total salts of the soil is assertively discussed. The results showed that the pH had a negligible influence on the corrosion rate, despite ranging from 7.77 to 8.44, indicating a slightly alkaline property. Overall, the study provides clear evidence of the relationship between soil properties and corrosion rate. The study investigated the influence of soil properties, such as pH, moisture content, and chlorine content, on corrosion rate. However, the moisture content had a significant impact on the corrosion rate, with soils containing lower moisture content exhibiting a higher corrosion rate. The chlorine content also had a notable effect on the corrosion rate, ranging from 3.55 to 49.7 mg/kg. The corrosion rate was positively correlated with the chloride ion content, and the concentration of chloride ions had a significant effect on the corrosion rate. Additionally, the total salt content ranged from 185.5 to 1650 mg/kg, and the corrosion rate increased proportionally with the increase in water-soluble salt content. This correlation is strong and reliable. The online data indicate that six out of the eight substations (I, II, III, IV, V, and VI) exhibit moderate corrosion (0.100 < R < 1.000). In contrast, the remaining two substations (VII and VIII) display strong corrosion (R ≥ 1.000). These results strongly suggest that high salt concentration remains a significant factor in carbon steel corrosion. The study results strongly establish a scientific basis for the State Grid Corporation of China’s anti-corrosion design, construction, and post-maintenance work in new and renovated substations.

Author Contributions

Methodology, B.Y.; Data curation, P.Z.; Investigation; Y.C.; Validation, W.Y.; Supervision, J.Y.; Funding acquisition, J.Y.; Writing—original draft, Y.T. All authors have read and agreed to the published version of the manuscript.

Funding

This study was supported by the Science and Technology Project of State Grid Tianjin Electric Power Company (Study on Evaluation Method of Atmospheric Corrosivity in Regional Micro-environment) (KJ 22-1-33).

Data Availability Statement

Data is contained within the article.

Conflicts of Interest

The submission of this work does not include any conflicts of interest, and all authors have given their consent for it to be published. On behalf of my co-authors, I would like to certify that the work was original research, not previously published, and not being considered for publication in whole or in part elsewhere. The manuscript that is enclosed has received the approval of all indicated authors.

References

  1. Lavanya, M.; Machado, A.A. Surfactants as biodegradable sustainable inhibitors for corrosion control in diverse media and conditions: A comprehensive review. Sci. Total Environ. 2024, 908, 168407. [Google Scholar] [CrossRef] [PubMed]
  2. Nakhaie, D.; Kosari, A.; Mol, J.M.C.; Asselin, E. Corrosion resistance of hot-dip galvanized steel in simulated soil solution: A factorial design and pit chemistry study. Corros. Sci. 2020, 164, 108310. [Google Scholar] [CrossRef]
  3. Contreras, A.; Quej, L.M.; Sosa, E.; Liu, H.B.; Alamilla, J.L. Corrosion rate of low carbon steels in function of physicochemical properties of soils. MRS Adv. 2021, 6, 825–829. [Google Scholar] [CrossRef]
  4. Zhang, Z.; Zhang, F.; Du, G.; Li, G.; Fan, W.; Wang, Y.; Jia, Z.; Wang, X. Effect of intermittent and continuous direct current electric fields on the initial corrosion of steel in simulated marine environment. Mater. Today Commun. 2023, 35, 105629. [Google Scholar] [CrossRef]
  5. Shin, H.; Song, Y.; Kong, P.-Y. Robust online overhead transmission line monitoring with cost efficiency in smart power grid. IEEE Access 2021, 9, 86449–86459. [Google Scholar] [CrossRef]
  6. Yang, C.; Wu, J.; Zhao, J.; Zhang, X.; Li, L.; Mu, J. Research on the architecture of integrated platform of intelligent substation auxiliary monitoring system. Proc. J. Phys. Conf. Ser. 2021, 2095, 012010. [Google Scholar] [CrossRef]
  7. Zheng, R.; Niu, B.; She, C.; Gao, D. Research on improvement of substation monitoring capability based on AI algorithm. Proc. J. Phys. Conf. Ser. 2022, 2290, 012016. [Google Scholar] [CrossRef]
  8. Qian, L.I.; Bo, Z. Multi-aspect Assessment and Parameter Calculation Method of Large Grounding Grid. Proc. CSEE 2018, 38, 129–136. [Google Scholar] [CrossRef]
  9. Jia, X. Optimized Design and Safety Assessment of Substation Grounding Network; North China Electric Power University: Beijing, China, 2016. [Google Scholar]
  10. Wu, J. Research on Grounding Scheme of 220 kV Substation Considering Ground Potential Rise and Grid Optimization; North China Electric Power University: Beijing, China, 2019. [Google Scholar]
  11. Li, G.X.; Wang, Y.; Guan, Y.L.; Li, L.; Jiang, Z.Q. Research on evaluation method of soil corrosive property to grounding grid in transformer substation. Proc. IOP Conf. Ser. Mater. Sci. Eng. 2019, 479, 012017. [Google Scholar] [CrossRef]
  12. Wu, Y.H.; Liu, T.M.; Luo, S.X.; Sun, C. Corrosion characteristics of Q235 steel in simulated Yingtan soil solutions. Mater. Werkst. 2010, 41, 142–146. [Google Scholar] [CrossRef]
  13. Kostić, V.I.; Raičević, N.B. A study on high-voltage substation ground grid integrity measurement. Electr. Power Syst. Res. 2016, 131, 31–40. [Google Scholar] [CrossRef]
  14. Zhou, M.; Wang, J.; Liu, Y.; Xiang, N.; Sun, Z.; Chen, J.; Fang, C. Causes, Forms and Remedies of Substation Grounding Grid Corrosion. In Proceedings of the 2008 International Conference on High Voltage Engineering and Application, Chongqing, China, 9–12 November 2008; pp. 186–189. [Google Scholar] [CrossRef]
  15. Lv, K. Comparative Study on the Corrosion Behaviours of High-Silicon Chromium Iron and Q235 Steel in a Soil Solution. Int. J. Electrochem. Sci. 2020, 15, 5193–5207. [Google Scholar] [CrossRef]
  16. Wang, T.; Yuan, H.; Zheng, X.; Song, M.; Ma, C. Coupling Analysis and Protection Design of Substation Grounding Grid and Surrounding Metal Pipe Grid. Procedia Comput. Sci. 2003, 228, 1262–1269. [Google Scholar] [CrossRef]
  17. Sun, L.; Ma, D.; Liu, Y.; Wang, J.; Ma, H.; Jin, P.; Peng, Y. Insight of the role of cooling method and soil environment on the corrosion behavior of Mg–2Nd alloys. J. Mater. Res. Technol. 2023, 25, 6782–6791. [Google Scholar] [CrossRef]
  18. Gupta, S.K.; Gupta, B.K. The critical soil moisture content in the underground corrosion of mild steel. Corros. Sci. 1979, 19, 171–178. [Google Scholar] [CrossRef]
  19. Zhou, M.; Wang, J. Substation grounding network corrosion analysis and anti-corrosion measures. In 2008 National Doctoral Academic Forum—Electrical Engineering; 2008. [Google Scholar]
  20. Zhang, C.; Liao, Y.; Gao, X.; Zhao, J.; Yuan, Y.; Liao, R. Research Advances of Soil Corrosion of Grounding Grids. Micromachines 2021, 12, 513. [Google Scholar] [CrossRef]
  21. Du, Y.; Qin, H.; Liu, J.; Tang, D. Research on corrosion rate assessment of buried pipelines under dynamic metro stray current. Mater. Corros. 2021, 72, 1038–1050. [Google Scholar] [CrossRef]
  22. Liu, Y.; Wen, J. Influence of Grounding Conductor in Cable Duct on the Corrosion Diagnosis in the Substation. High Volt. Technol. 2014, 40, 505–512. [Google Scholar] [CrossRef]
  23. Fang, Y.; Lu, J. Analysis on the Influence of HVDC Grounding Electrode’s Ground Current on the Corrosion of Buried Metal Pipelines. South. Power Grid Technol. 2013, 7, 71–75. [Google Scholar] [CrossRef]
  24. Zhu, Z.; Shi, C.; Zhang, Y.; Liu, Z. The effects of Cl and direct stray current on soil corrosion of three grounding grid materials. Anti Corros. Methods Mater. 2020, 67, 73–82. [Google Scholar] [CrossRef]
  25. Kleiner, Y.; Rajani, B. Forecasting Variations and Trends in Water-Main Breaks. J. Infrastruct. Syst. 2002, 8, 122–131. [Google Scholar] [CrossRef]
  26. Shao, Y.; Yan, A.; Li, B.; Liao, Q. Corrosion Behavior of Q235 Carbon Steel for Grounding Grids in Soil at Shanghai District. Corros. Sci. Prot. Technol. 2015, 27, 333–338. [Google Scholar] [CrossRef]
  27. Li, J.; Men, C.; Qi, J.; Yang, B.; Liu, R. Impact factor analysis, prediction, and mapping of soil corrosion of carbon steel across China based on MIV-BP artificial neural network and GIS. J. Soils Sediments 2020, 20, 3204–3216. [Google Scholar] [CrossRef]
  28. Draper, N.R.; Smith, H. Applied Regression Analysis; John Wiley & Sons: Hoboken, NJ, USA, 1998. [Google Scholar]
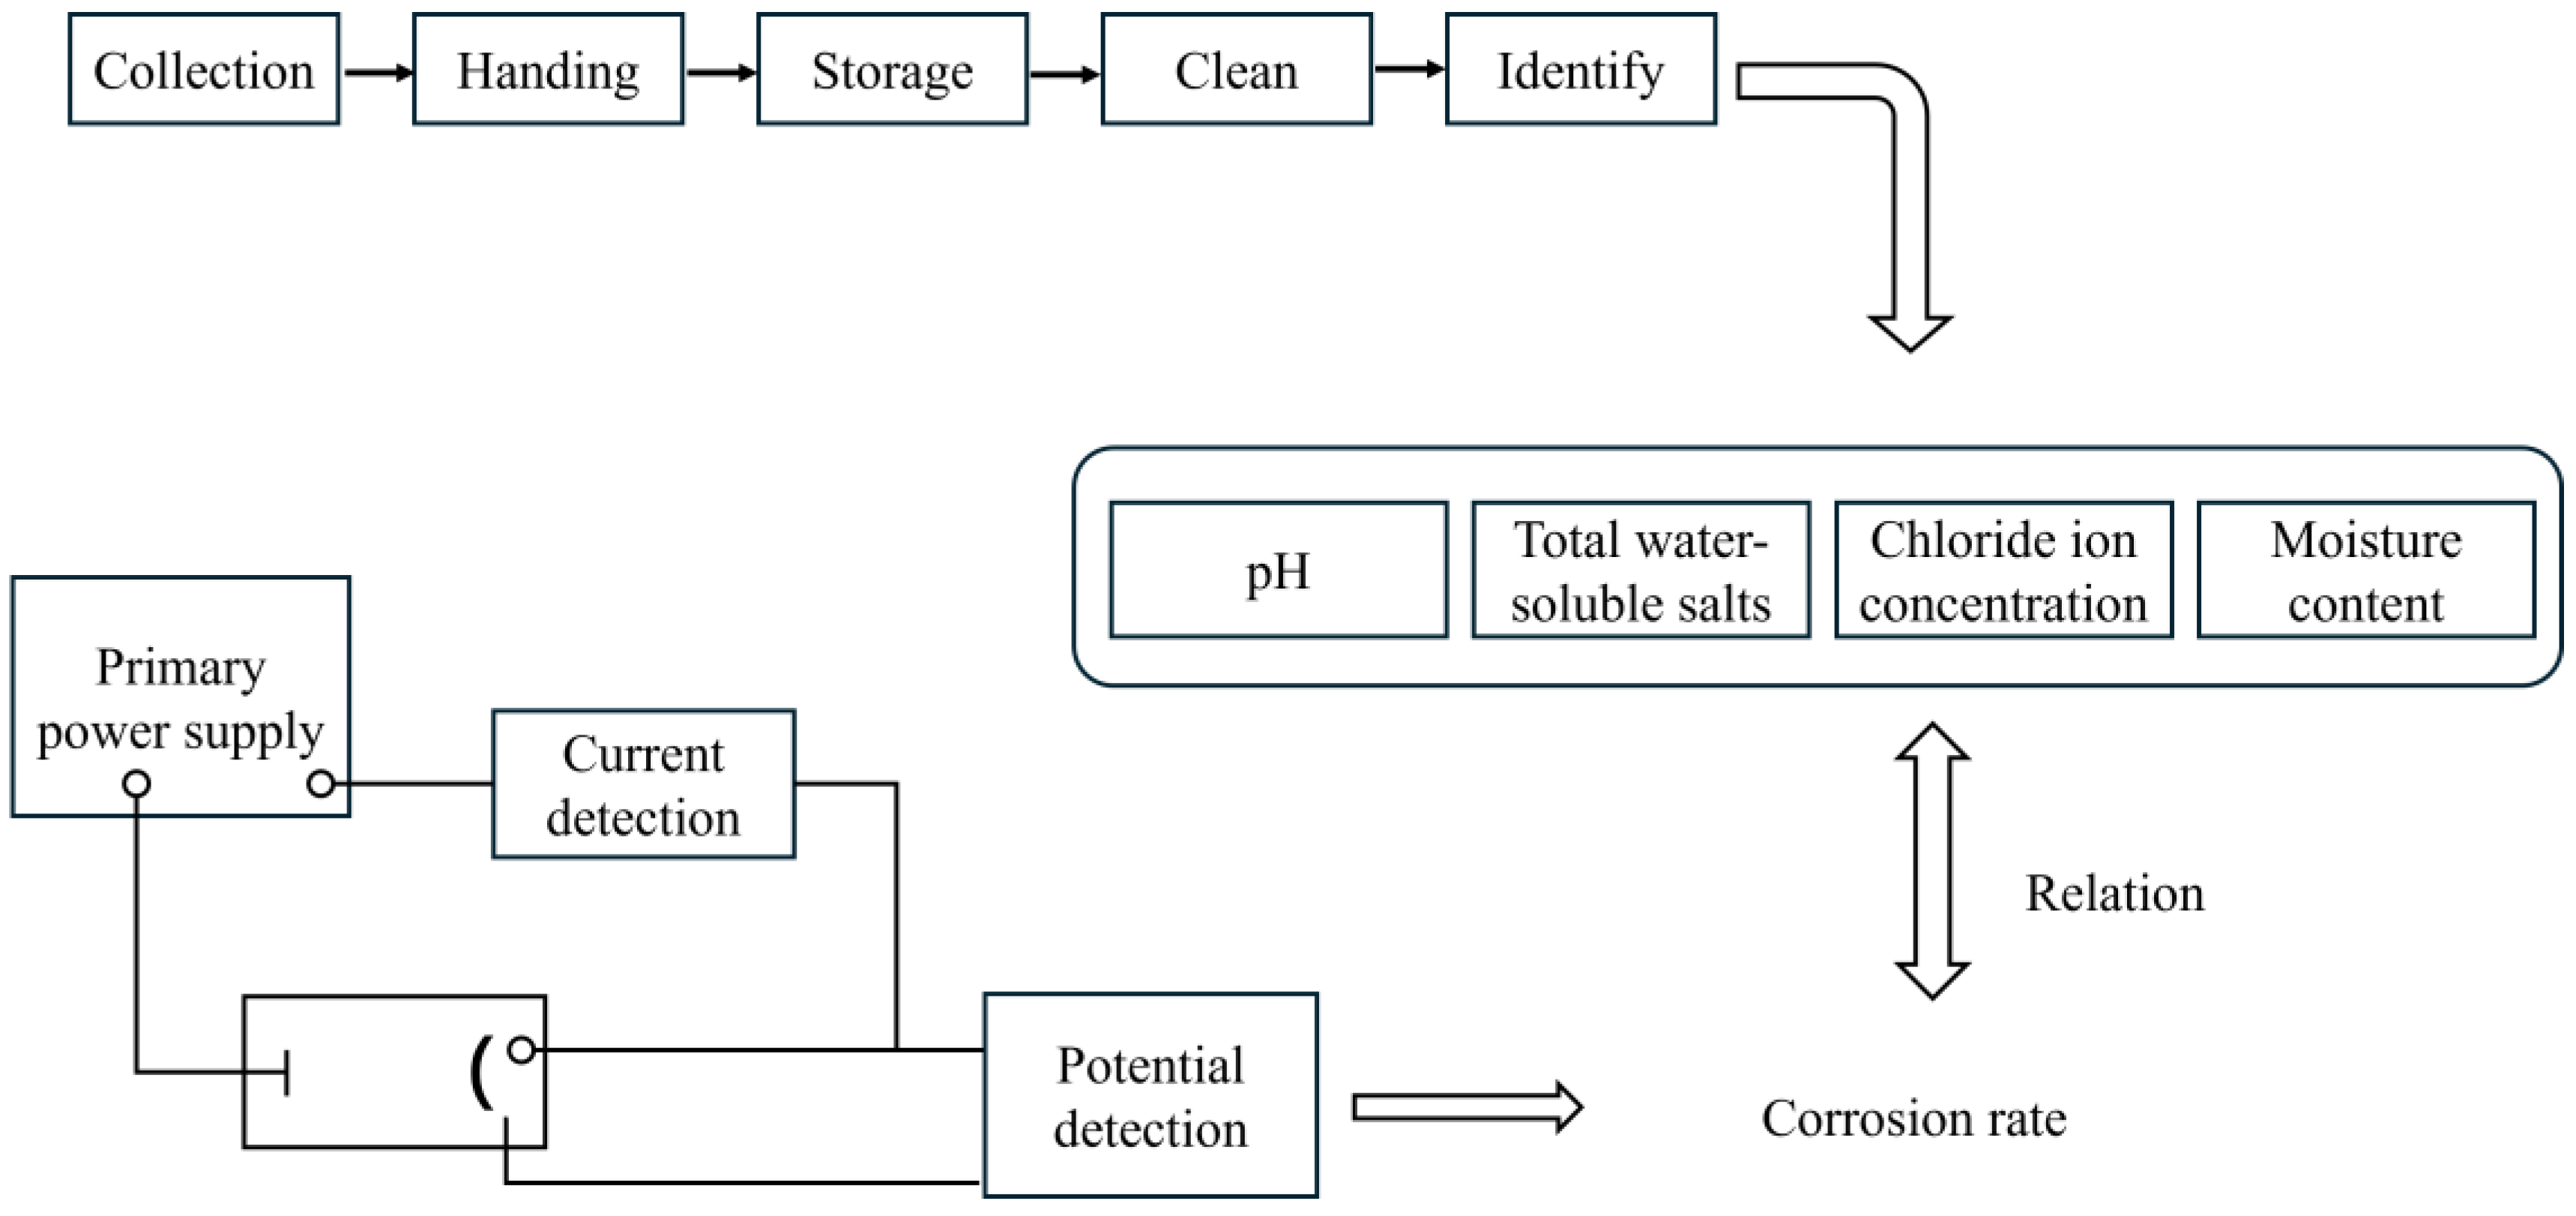
Figure 1. Test process diagram.
Energies 17 03906 g001
Figure 2. Three-electrode test system.
Energies 17 03906 g002
Figure 3. Field grounding network corrosion diagram.
Energies 17 03906 g003
Figure 4. Tafel plots of various substations.
Energies 17 03906 g004
Figure 5. Relationship between corrosion rate and soil pH value.
Energies 17 03906 g005
Figure 6. Relationship between soil water content and corrosion rate.
Energies 17 03906 g006
Figure 7. Relationship between corrosion rate and soil Cl concentration.
Energies 17 03906 g007
Figure 8. Relationship between the total content of water-soluble salts and the rate of corrosion in the soil of the transformer substation.
Energies 17 03906 g008
Figure 9. Test set goodness-of-fit curve.
Energies 17 03906 g009
Table 1. Kinetic parameters of the Tafel plots of various grounding down leads.
SubstationCorrosion Rate (mm/a)Corrosion Current (mAcm−2)Corrosion Potential (V)
i0.16431.4125 × 10−5−0.642
ii0.18441.5849 × 10−5−0.562
iii0.21171.8197 × 10−5−0.231
iv0.55684.7863 × 10−5−0.632
v0.56984.8978 × 10−5−0.632
vi0.58005.0119 × 10−5−0.261
vii1.43131.23027 × 10−4−0.633
viii2.54532.8776 × 10−4−0.741
iv1.773 × 10−43.7025 × 10⁻⁶−0.233
Table 2. Soil properties after analysis.
SubstationSoil Resistivity (Ω·m)Soil QualityChloride Ion Concentration (mg/kg)pHMoisture Content (%)Total Water-Soluble Salts (mg/kg)Sulfate Concentration (mg/kg)
i8.48Sand7.818.3715.24185.5092.64
ii13.19Clay loam soil3.558.1110.45219.4080
iii5.08Clay18.468.3219.33421.50275.28
iv6.22Sand5.688.4416.69221.50144.00
v10.17Silty soil29.828.2516.511107.5208
vi4.52Silty soil24.857.7714.1951386128
vii21.67Sand39.057.9910.8251100528
viii2.82Silty soil49.78.0613.48160580
Disclaimer/Publisher’s Note: The statements, opinions and data contained in all publications are solely those of the individual author(s) and contributor(s) and not of MDPI and/or the editor(s). MDPI and/or the editor(s) disclaim responsibility for any injury to people or property resulting from any ideas, methods, instructions or products referred to in the content.