Article

A Quantitative Evaluation Method Based on Single-Ended Information Protection Adaptability Considering Distributed Generator Access

1
Electric Power Research Institute of State Grid Jibei Electric Power Co., Ltd., Beijing 100045, China
2
School of Electrical Engineering, Beijing Jiaotong University, Beijing 100044, China
3
State Grid Jibei Electric Power Co., Ltd., Beijing 100054, China
*
Author to whom correspondence should be addressed.
Energies 2024, 17(16), 3907; https://doi.org/10.3390/en17163907
Submission received: 7 May 2024 / Revised: 13 June 2024 / Accepted: 21 June 2024 / Published: 8 August 2024
(This article belongs to the Section F2: Distributed Energy System)

Abstract

:
A high proportion of distributed generators (DGs) connected to the distribution network causes a significant change in the normal and fault currents of the system as well as in the linearization of the characteristics. It is difficult to adapt to conventional protection. This paper theoretically analyzes the possible impact of fault current characteristics on traditional protection based on single-ended informativeness after connecting to DGs. From the perspective of protection action, the evaluation index system of DG protection is established by considering the maximum short-circuit current output from DG. Combined with the relay protection requirements, the calculation method of evaluation indexes is given concerning the protection characteristics and expert experience. An analytic hierarchy process (AHP) and a CRITIC combination assignment method based on the principle of minimum information identification are proposed. The scores of different types of protection before and after DG access are calculated using the proposed methodology employing a typical distribution network example. The proposed method can quantitatively obtain the distribution network protection adaptability boundary. In the actual calculation example selected in this paper, a DG can reasonably improve the adaptability of the three-stage current protection when it increases the current amplitude at a penetration rate of 50%; the DG needs to adjust the three-stage current protection rectification value when it decreases the current amplitude at a penetration rate of 20%; and adaptive overcurrent protection and inverse time limit current protection need to be adjusted when the penetration rate of DG is 50%. Compared with the traditional protection evaluation method, the method adopted in this paper can intuitively derive the weak link between protection handling faults after DG access as well as the appropriate capacity of DG to improve protection performance. It can provide a powerful reference for the optimization of protection schemes after the high percentage of DG access.

1. Introduction

Under the dual challenges of surging energy demand and environmental concerns, nations globally are placing significant emphasis on advancing distributed generation energy supply technologies. In recent years, distributed generators (DGs), mainly based on photovoltaic power generation and wind power generation, have been developed rapidly [1]. The new distribution network after connecting to a DG becomes a multi-terminal power supply form, resulting in a change in the size and direction of the short-circuit current. As a result, fault-handling schemes designed for the original conventional network cannot match well with it, thus disrupting the coordinated operation between protection devices. Multi-DG grid connection brings potential challenges while relieving the pressure on resources and the environment, especially in the field of relay protection [2,3,4]. With the increasing capacity of DGs in the grid, the impact of the extra current generated on relay protection cannot be ignored.
Stage current flow protection, adaptive overcurrent protection, and inverse time overcurrent protection are some of the current protections that use post-fault single-ended current information content. Many scholars have conducted relevant research aimed at the impact of distributed power access on the above three types of protection. We summarize the improvements to stage-type current protection as follows: recalculate the fixed value of each protection based on the operating state during the fault period after DG access in terms of amplitude [5]; adaptively adjust the fixed value of the protection by considering the factors affecting the short-circuit current during the fault period and changing it on-line [6,7,8]; or add directional elements based on the original ones to prevent the protection from malfunctioning due to the reversed current. Once the DG gains access to the distribution network, it influences the inverse time current protection. The connection of the DG to the distribution network influences both the inverse time current protection’s action time and the cooperative relationship among the protections. Improvement schemes include the introduction of acceleration factors, such as low-voltage and low-impedance acceleration factors, to ensure the rapidity of protection and cooperation between the upper and lower levels of protection [9,10]. Alternatively, communication can be used to obtain the operating state of the DG and adjust the action time curve [11], thereby enhancing the performance of the protection action.
All of the above studies are qualitative analyses and improvements after DG access has adversely affected protection, and the impact on protection performance has not been quantitatively investigated. In qualitative analyses, it is often difficult to comprehensively consider all possible factors and variables while lacking quantitative data support. Quantitative analysis approaches utilize quantitative data and mathematical modeling to provide precise and unbiased conclusions. Furthermore, these approaches take into account all aspects of monitoring protection performance more completely. Quantitative analysis is capable of providing measurable indicators and findings that are more beneficial to decision-makers in comprehending the nature and impact of the problem. By employing quantitative analytic techniques, we may enhance the precision of evaluating the effectiveness of protection measures, promptly identify potential issues, and implement appropriate actions to enhance the dependability and security of the system. Therefore, it is necessary to quantitatively study the adaptability of protection after DG access.
Most of the current evaluation studies in relay protection are based on the operation of protection combined with equipment, devices, and other factors [12,13,14], There is a lack of quantitative evaluation of the protection principle after considering access to distributed power sources. Zhang et al. [15] evaluate the reliability of the distribution network after the access of distributed power sources. Other studies [16,17,18,19] evaluate relay protection by considering the level of equipment, operational status, maintainability, safeguards, and professional management standardization. Data-driven techniques do not rely on the experience of experts and at the same time do not require an accurate model. In reference [20], a curved Manhattan distance and voltage difference analysis technique is proposed, which has the advantages of low computational cost and high accuracy, while [21] proposed an improved wavelet transform method with an optimal wavelet basis function selection strategy. The optimal wavelet basis function is selected by calculating the distance score and average score of its features. The multiple kernel extreme learning machine (MKELM) based model is initialized using training data. Experiments verified the effectiveness of the strategy. A new method was proposed in [22] based on kernel entropy component analysis (KECA) and one-against-one (OAO) least squares support vector machine (LSSVM). KECA is used to reduce the dimensionality of the energy features and OAO LSSVM classifies the different initial fault classes. However, some data-driven techniques have inherent limitations, such as the need for large amounts of historical data, as well as high computational costs and training complexity. In terms of evaluation, from the point of view of the assignment methods, reference [23] used the Delphi method to calculate the weights of the main evaluation internal factors; reference [24] used the interval hierarchical analysis method to assign the values; and reference [25] improved the analytic hierarchy process (AHP) method by constructing different judgment matrices to simplify the arithmetic. The above methods are more subjective. Reference [26] used the CRITIC method to find objective weights, and reference [27] calculated weights and completed distribution network assessment by the entropy weight method. The subjective or objective weighting method alone is not able to take into account the advantages of both and ensure the scientific nature of the weights, so this paper is based on the principle of minimum information identification, combined with the AHP and CRITIC methods of comprehensive weighting, to complete the evaluation of relay protection performance.
At present, the majority of evaluation studies on relay protection are based on the protection’s operation, combined with equipment, devices, and other factors. For the evaluation of distributed generator access, the impact of distributed power supply access on the distribution network is considered in terms of reliability, security, economy, and other aspects. There is a lack of research addressing the impact of distributed power access on protection. As a result, the objective of this paper is to evaluate the adaptability of distribution network protection to DG access. This paper looks at the features of distributed power supply and how it affects distribution networks. It then sets up an evaluation system based on the protection principle, looking at what should be done for protection after a distributed power supply is accessed. We quantify the degree of influence that the distributed power source’s additional current has on protection. The core contributions of this article are as follows:
(1)
A calculation model of the indicators after DG access is proposed, taking into consideration the role of DG. The computational model is used to quantify its impact on the performance of the protection scheme based on the single-ended information principle.
(2)
An evaluation index system is constructed by combining the selectivity, quickness, sensitivity, and reliability indexes for the first time. The combination weights of the evaluation model in this research are determined by applying the CRITIC approach and the hierarchical analysis method.
(3)
An analysis of the role of DG is executed, and example analysis and comparison with traditional protection evaluation are presented to demonstrate the superiority of the proposed method in assessing the adaptability of distribution network protection. It provides a guiding basis for the optimization of protection schemes after a high proportion of new energy is connected to the distribution network.
This article is organized as follows: Section 2 describes the influence of DG access on the measured currents at different protections under symmetrical and asymmetrical faults, laying the foundation for the proposal of the indicator model. Section 3 proposes the formula for calculating the indicators under the consideration of the influence of DG based on the traditional indicator model, constructs the evaluation indicator system for assessing the principle of protection, and proposes the AHP–CRITIC comprehensive assignment method based on the principle of minimum information identification by combining the experience of the experts while taking into account the objectivity of the data itself. Section 4 tests the method proposed in this paper to quantify the adaptability of protection under a typical distribution network topology. Section 5 analyzes the test results, and Section 6 summarizes the research results of this paper, combines the research results of existing protection, and makes recommendations for the next step of research considering the volatility of distributed power output.

2. Impact of DG Access on Distribution Network Relay Protection

Relay protection is an important measure to guarantee the safety of power equipment and protect the stable operation of power systems. For protection at different locations, the fault currents affected by the DG access are mainly summarized as current amplitude boosting and drawdown. In these two cases, we analyzed the impact of the short-circuit current characteristics following DG access on the aforementioned protection scheme, which relies on single-ended current information.

2.1. Three-Phase Short-Circuit Fault Conditions

2.1.1. Effect of Increased Fault Current Amplitude on Protection

As shown in Figure 1, when a three-phase short-circuit fault occurs at f and there is no DG connected to the system, the fault current flowing through the protections R1, R2, and R3 is the fault current supplied by the grid as shown in Equation (1):
I R 1 = I R 2 = I R 3 = I S = E Z S   + Z 1 + Z 21 + Z 22 + Z 3  
IR1, IR2, IR3 represent the fault current flowing through the protections R1, R2, R3. IS is the fault current supplied by the grid. E is the grid potential. Z1, Z21, Z22, and Z3 are the line impedance. ZS is the equivalent impedance of the network upstream of the substation.
When DG is connected to the distribution network, it affects the fault current flowing through the protection. A portion of the total fault current IDG supplied by DG flows downstream of the point of common coupling:
Δ I DG 1 = I DG Z S   + Z 1 + Z 21 Z S   + Z 1 + Z 21 + Z 22 + Z 3   = I DG Z eq  
Z eq   = Z S   + Z 1 + Z 21 Z S   + Z 1 + Z 21 + Z 22 + Z 3  
The current flowing through protection R3 is:
I R 3 = I S + Δ I DG 1 = E Z S   + Z 1 + Z 21 + Z 22 + Z 3   + I DG Z eq  
where I DG is the current value of the DG output and Δ I DG 1 is the current value of the DG output acting at protection 3 after impedance shunt. Z S   is the system impedance, Z 1 , Z 3 is the line impedance between bus MN and bus PQ, Z 21 is the line impedance between bus N and the DG access point, and Z 22 is the line impedance between the DG access point and bus P, respectively.
From the above equation, it can be seen that DG access will increase the short-circuit current flowing through the protection and expand its original protection scope. In the existing three-segment current protection, segments II and III complete the coordination through delay, so the protection range expansion will not have an impact on the selectivity of the protection in segments II and III. The existing adaptive current protection adaptively adjusts the line protection setting value according to the system operation mode and short circuit type [27]. Compared with the three-stage current protection, it has advantages in the system operation mode and short-circuit type change. The action equation of the existing inverse time protection is a fitting curve of action time and fault current characteristics, and the DG access increases the current flowing through the protection. It will reduce the action time of the inverse time protection and shift the action characteristic curve down.

2.1.2. Effect of Decreased Fault Current Amplitude on Protection

When a three-phase short-circuit fault occurs at f and there is a DG connected to the system, a portion of the total fault current IDG supplied by DG flows upstream of the point of common coupling:
Δ I DG 2 = I DG Z 22 + Z 3   Z S   + Z 1 + Z 21 + Z 22 + Z 3   = I DG 1 Z eq  
where Δ I DG 2 is the current value of the DG output acting at protection 2 after impedance shunt.
The current flowing through protection R2 is:
I R 2 = I S Δ I DG 2 = E Z S   + Z 1 + Z 21 + Z 22 + Z 3   I DG 1 Z eq  
As shown in Figure 2, when there is a DG between the protection and the point of fault, the current due to the DG results in a reduction of the fault current measured at the protection. A three-section current protection shortens the protection range of Section I. If a fault arises within the original section-I protection range, then section II can isolate it without a time limit, but it now requires a delay to remove it [27]. For sections II and III of all protection levels, a reduction in fault current can decrease the sensitivity of the protection and potentially result in protection refusal. The protection’s extended action time of segment III limits its impact, provided the photovoltaic (PV) does not operate with faults for an extended duration [28]. For inverse time current protection, a decrease in fault current will increase the action time of the protection. An upward shift in the inverse time protection action characteristic curve affects the relationship between the upper and lower levels of protection, thereby reducing the protection’s performance.

2.2. Two-Phase Short-Circuit Fault Conditions

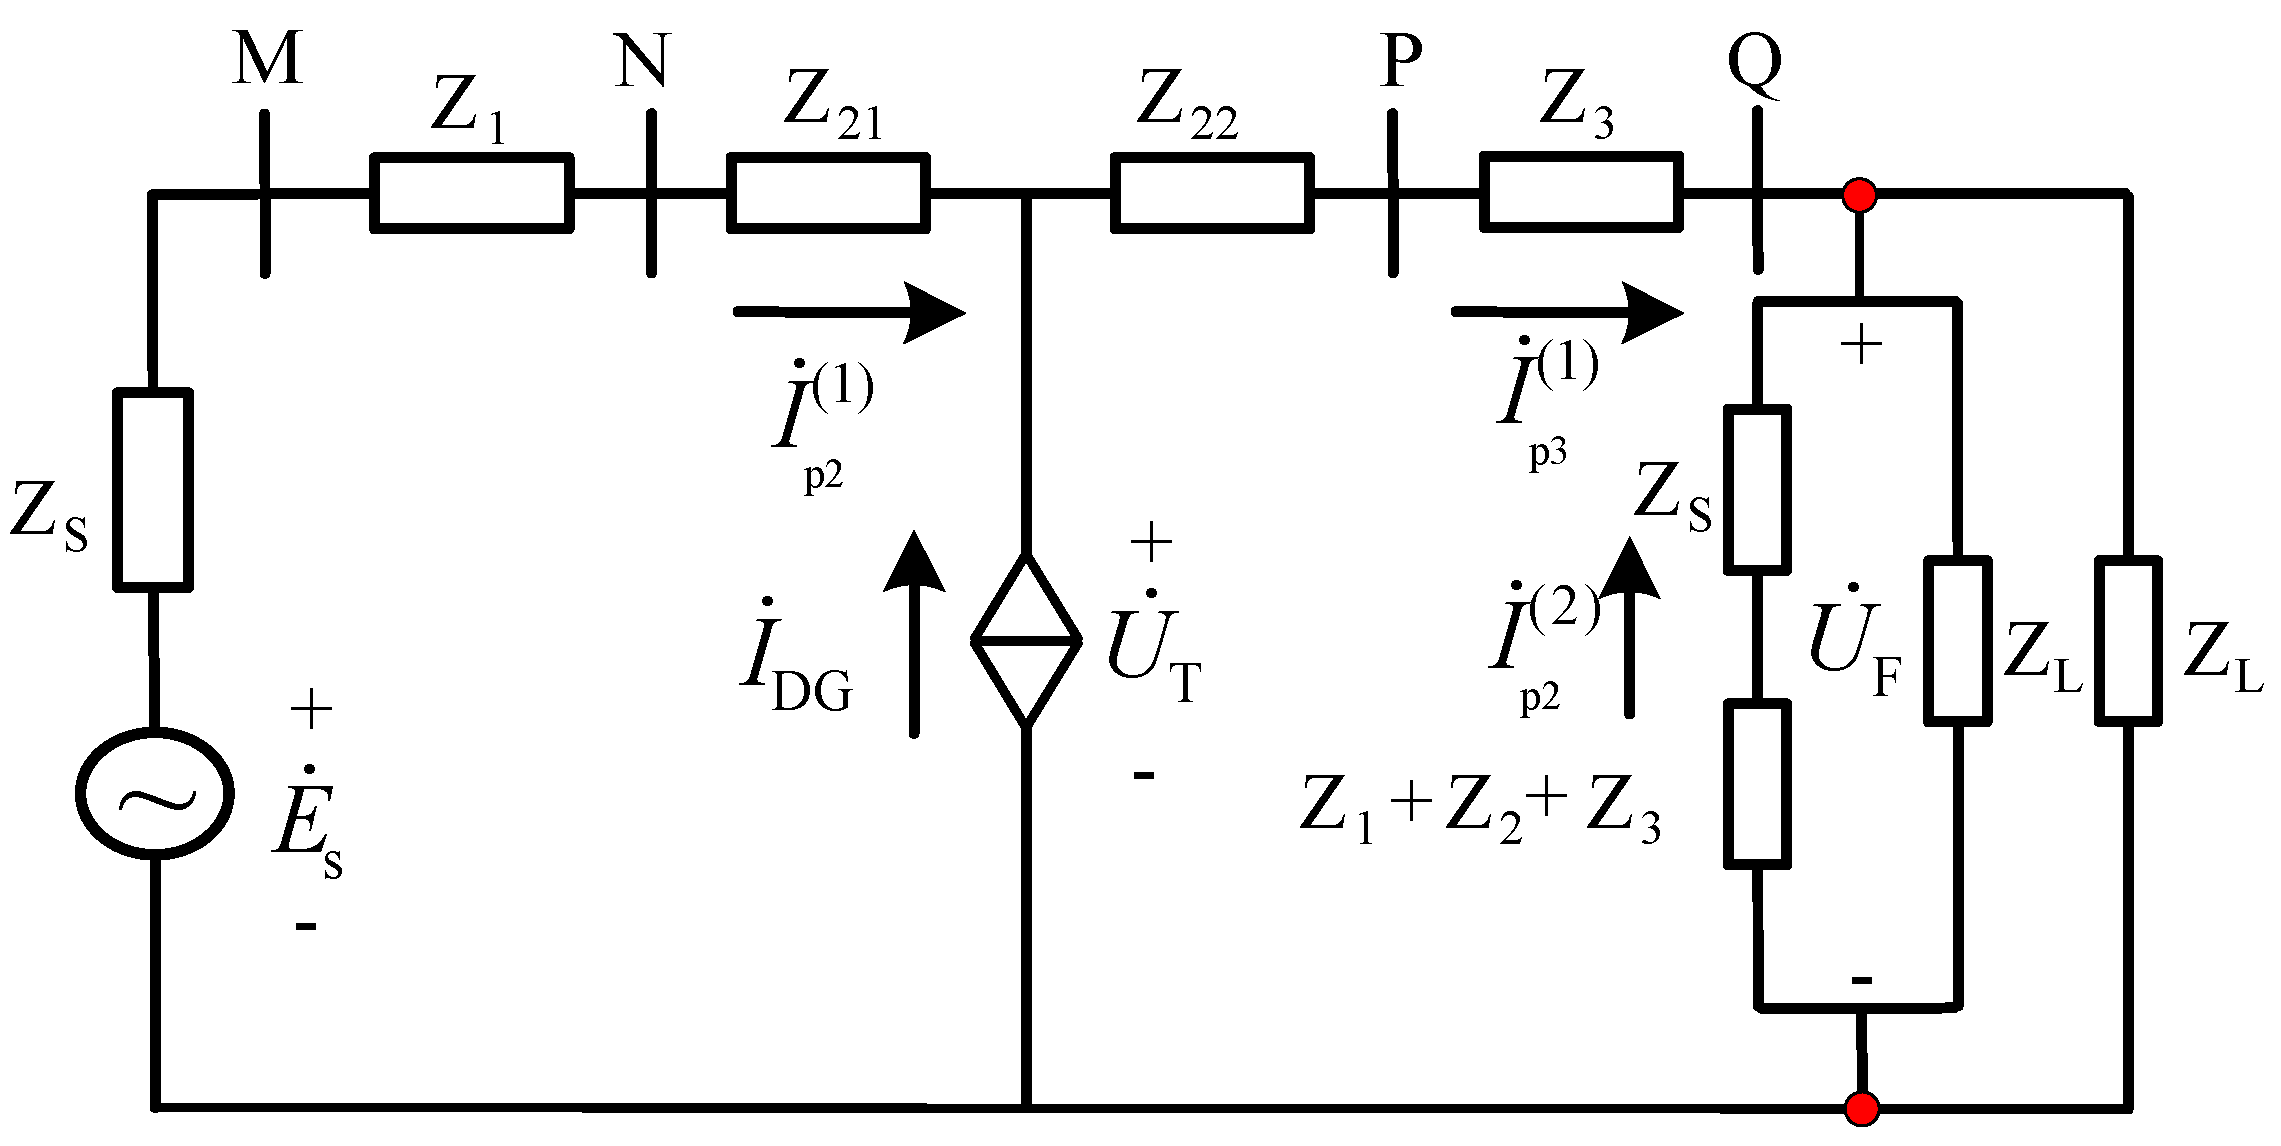
Current protection is usually calibrated for sensitivity using two-phase short-circuit currents in the system’s minimum mode of operation. The DG exists only in the positive-sequence network and outputs only the positive-sequence component. The symmetrical component method is used for superposition processing. The composite sequence network diagram of the distribution network is shown in Figure 3. In a three-phase circuit, a fault occurs at f between phases B and C (BC).
The positive sequence current I ˙   p 2 ( 1 ) flowing through protection R2 is:
I ˙   p 2 ( 1 ) = E Z S   + Z MQ + Z I DG Z 22 + Z 3   + Z Z S   + Z MQ + Z
Δ Z f is the additional impedance of a two-phase short-circuit, which is expressed as: Δ Z f = ( Z 1 + Z 2 + Z 3 ) / / Z L ; Z MQ = Z 1 + Z 2 + Z 3   ; Z 2 = Z 21 + Z 22 .
Z = Δ Z f Z L Δ Z f + Z L
The positive sequence current I ˙   p 3 ( 1 ) flowing through protection R3 is:
I ˙   p 3 ( 1 ) = E Z S   + Z MQ + Z + I DG Z S   + Z 1 + Z 21 Z S   + Z MQ + Z
The voltage U ˙ F at the point of failure is:
U ˙ F = I ˙   p 3 ( 1 ) Z = E Z Z S   + Z MQ + Z + I DG ( Z S   + Z 1 + Z 21 ) Z Z S   + Z MQ     + Z
The negative sequence currents I ˙   p 2 ( 2 ) , I ˙   p 3 ( 2 ) flowing through protection R2 and protection R3 are:
I ˙   p 2 ( 2 ) = I ˙   p 3 ( 2 ) = U ˙ F Z S   + Z
The two-phase short-circuit currents I ˙ R 2 , I ˙ R 3 measured at protection R2 and protection R3 are respectively:
I ˙ R 2 = I ˙   p 2 ( 1 ) e j 240 + I ˙   p 2 ( 2 ) e j 120
I ˙ R 3 = I ˙   p 3 ( 1 ) e j 240 + I ˙   p 3 ( 2 ) e j 120

2.3. Impact of DG on Different Types of Protection

Using the topology shown in Figure 1 as an example, protection 1 is installed in the MN section of the bus, and protection 2 is installed in the NP section of the bus, both of which are located upstream of DG. Protection 3 is installed on the PQ line, located downstream of DG. We analyzed the effect on protection in both cases of increase and decrease in current amplitude due to DG access when protection 1, protection 2, and protection 3 are stage current protection, adaptive current protection, and inverse time current protection, respectively, at the same time.
Under the booster effect, both stage current protection and adaptive current protection expand their original protection range and sensitivity. An appropriate DG capacity can enhance the protection performance, but an excessive DG capacity can cause the protection to lose selectivity and generate false actions. As depicted in Figure 4, the inverse time current protection minimizes the action time of protection 3, thereby benefiting it. However, at this point, the time gap with protection 2 widens, thereby impacting the performance of protection 2 as a backup protection.
Reducing the current amplitude shortens the protection range for both stage current protection and adaptive current protection, necessitating a delayed cut-off in the event of a fault within the original protection range. Simultaneously, the fault current reduction will reduce the sensitivity of the protection and may even lead to protection refusal. For inverse time current protection, reducing the fault current will result in an increase in the protection’s action time. This is illustrated in Figure 4, where the inverse time protection operation characteristic curve shifts upward, thereby increasing the protection’s action time and negatively impacting its cooperation with protection 2. This, in turn, leads to a significant mismatch in protection and a reduction in the protection’s performance.
The access capacity of DG can cause coordination and cooperation problems in relay protection. By quantitatively assessing the impact of DG access on protection, the adaptability level of different types of protection can be visualized, which lays the foundation for the subsequent adjustment of the fault disposal strategy.

3. Construction of Protection Assessment System after DG Access to Distribution Network

3.1. Evaluation Indicators and Calculation Models

In order to make the indicators objective, fair, and universal, the basic requirements of distribution network relay protection were analyzed and the definition of indicators was completed. Speed, sensitivity, selectivity, and reliability were selected as evaluation indicators [29]. Combined with the traditional indicator definitions, the definition and calculation model of each indicator after DG access are as follows [30,31].
(1)
Quickness index
Quickness refers to the fact that when a fault occurs, the protective device is designed to act quickly to remove the fault. The operating time limits of the three-stage overcurrent protection and the adaptive overcurrent protection are set according to a stepped type. The protection action time comprises both the intrinsic action time of the device (tmin) and the disparity between the action times of adjacent protections ( Δ t ). The ratio of the protection action time after the distributed power supply is connected to the previous one is used to measure the rapidity index:
t s 1 = α t min + ( 1 α ) Δ t α t min + ( 1 α ) Δ t
where α is the protection range of segment I without DG access and α is the protection range of segment I after DG access.
After the DG is connected, the equation of action for inverse time current protection, according to IEEE standard or the IEC 60255 [32] equation, is shown in Equation (15):
t = a T DS I f / I op   b 1
The ratio of the protection action time after DG access to the previous one is:
t s 2 = I f / I op   b 1 I f / I op   b 1
where TDS is the time coefficient, I op   is the start-up current of the protection, and I f and I f are the short-circuit currents flowing through the protection at the fault before and after the DG access, respectively. The values of characteristic parameters a and b are 0.14 and 0.02, respectively. The calculation method is described in Section 2.1 and Section 2.2.
(2)
Sensitivity index
Sensitivity refers to the ability of a protection to react to the occurrence of faults or abnormal operating conditions within its protection area. The sensitivity coefficient K sen is used to measure the sensitivity index. In order to reliably protect the entire length of the line, the sensitivity value should be greater than 1.3. The calculation is usually measured by the ratio of the fault current I   k . L . min   to the setting value I set   in the case of a two-phase short-circuit at the end of the protection range when the system is in the minimum mode of operation. After the DG is connected, the formula for calculating the sensitivity is as follows:
K sen = I   k . L . min I set  
where I   k . L . min is the fault current value after DG access, which is calculated as shown in Section 2.2.
(3)
Selectivity index
Selectivity means that in the event of a fault, the faulty element should be removed from the power system by the action of the protective device nearest to the point of fault, so that the outage is minimized. The selectivity index is measured by the protection range α . The setting value I set - A of the traditional stage current quick-break protection is:
I set - A = K rel   E s Z s min + Z L 1
where K rel   is the reliability coefficient, generally 1.2~1.3, E s is the equivalent phase potential of the system power supply, Z s min is the minimum impedance from the equivalent power supply of the system to the protection installation under the maximum mode of operation, and Z L 1 is the line impedance of the protection line.
When a fault occurs at α of the line, the fault current flowing through the protection device is:
I f = K k   E s Z s + α Z L 1
where K k   is the fault type coefficient, and Z s is the impedance from the equivalent power source of the system to the installation of the protection in any mode of operation. The value of Z s will be taken between Z s min and Z s max . According to Equations (18) and (19), the protection range of conventional current-failure protection can be obtained as:
α A = K k ( Z s min + Z L 1 ) K rel Z s K rel Z L 1
After the DG is connected, the protection range of traditional current quick-break protection is shown in Equations (21) and (22):
α A   1 = K k E S ( Z s min + Z L 1 ) + ( Z s min + Z L 1 ) β I ˙ DG Z L 1 K rel E S Z s K rel Z L 1 E S + Z s min I ˙ DG + Z L 1 I ˙ DG
α A   2 = ( K k E S + β I ˙ DG Z L 1 ) ( Z s min + Z L 1 + Z L 2 ) K rel E S ( Z s + Z L 1 ) K rel Z L 2 E S
In Equations (21) and (22), β is the proportional coefficient of the DG access position to the total impedance of the line at this level. Z L 1 is the total impedance of the DG access line, and Z L 2 is the total impedance of the lower protection line of the DG access line. α A 1 is the protection range for the case where DG access decreases the fault current magnitude, and α A 2 is the protection range for the case where DG access increases the fault current magnitude.
The setting value of adaptive current quick-break protection is:
I set - B = K k   K rel   E s Z s + Z L 1
From Equations (18) and (23), the protection range of adaptive current flow disconnection protection is shown in Equation (24):
α B = Z L 1 ( K rel 1 ) Z S K rel Z L 1
After the DG is connected, the protection range of the adaptive current flow interruption protection is shown in Equations (25) and (26):
α B 1 = K k E S ( Z s + Z L 1 ) + ( Z s + Z L 1 ) β I ˙ DG Z L 1 K k   K rel E S Z s K k   K rel Z L 1 E S + Z s I ˙ DG + Z L 1 I ˙ DG
α B 2 = ( K k E S + β I ˙ DG Z L 1 ) ( Z s + Z L 1 + Z L 2 ) K k   K rel E S ( Z s + Z L 1 ) K k   K rel Z L 2 E S
In Equations (25) and (26), α B 1 is the protection range for the case where DG access decreases the fault current magnitude, and α B 2 is the protection range for the case where DG access increases the fault current magnitude.
(4)
Reliability index
Reliability refers to the ability of the protection to operate reliably in the event of a fault within the scope of protection. The reliability of a protection system can be divided into the reliability of the equipment and the reliability of the protection function [33]. DG access to the distribution network leads to the protection of the original fixed value under the refusal to act or false action, and the principle failure of relay protection is the main factor considered in this paper. The failure caused by the principle failure is closely related to the protection setting value and the system operation configuration program.
For three-stage overcurrent protection and adaptive overcurrent protection, a uniform distribution is used for simulation. Assuming that the length of the line is L, the length range of the risk of relay protection refusal is L0, and the length range of the risk of relay protection malfunction is L1. The probability of the protection refusal/malfunction area of the line as a percentage of the total line can be expressed by Equation (27):
P ( n ) = P j ( n ) = L 0 L P w ( n ) = L 1 L
The reliability is defined as Equation (28):
P r 1 ( n ) = 1 P j ( n ) P w ( n )
where P j ( n ) is the conditional probability of protection rejection in the event of a short circuit on the protected line, and P w ( n ) is the probability of protection mis-operation in the event of a short circuit event on the adjacent next higher-level line.
For inverse time current protection, reliability is measured by the ratio of the difference in the action time of neighboring protections before and after DG access. The value of reliability is calculated by using the time difference when the end of the neighboring protection line fails.
P r 2 ( n ) = I f / I op   b 1 I f / I op   b 1

3.2. Methodology for Calculating Indicator Weights

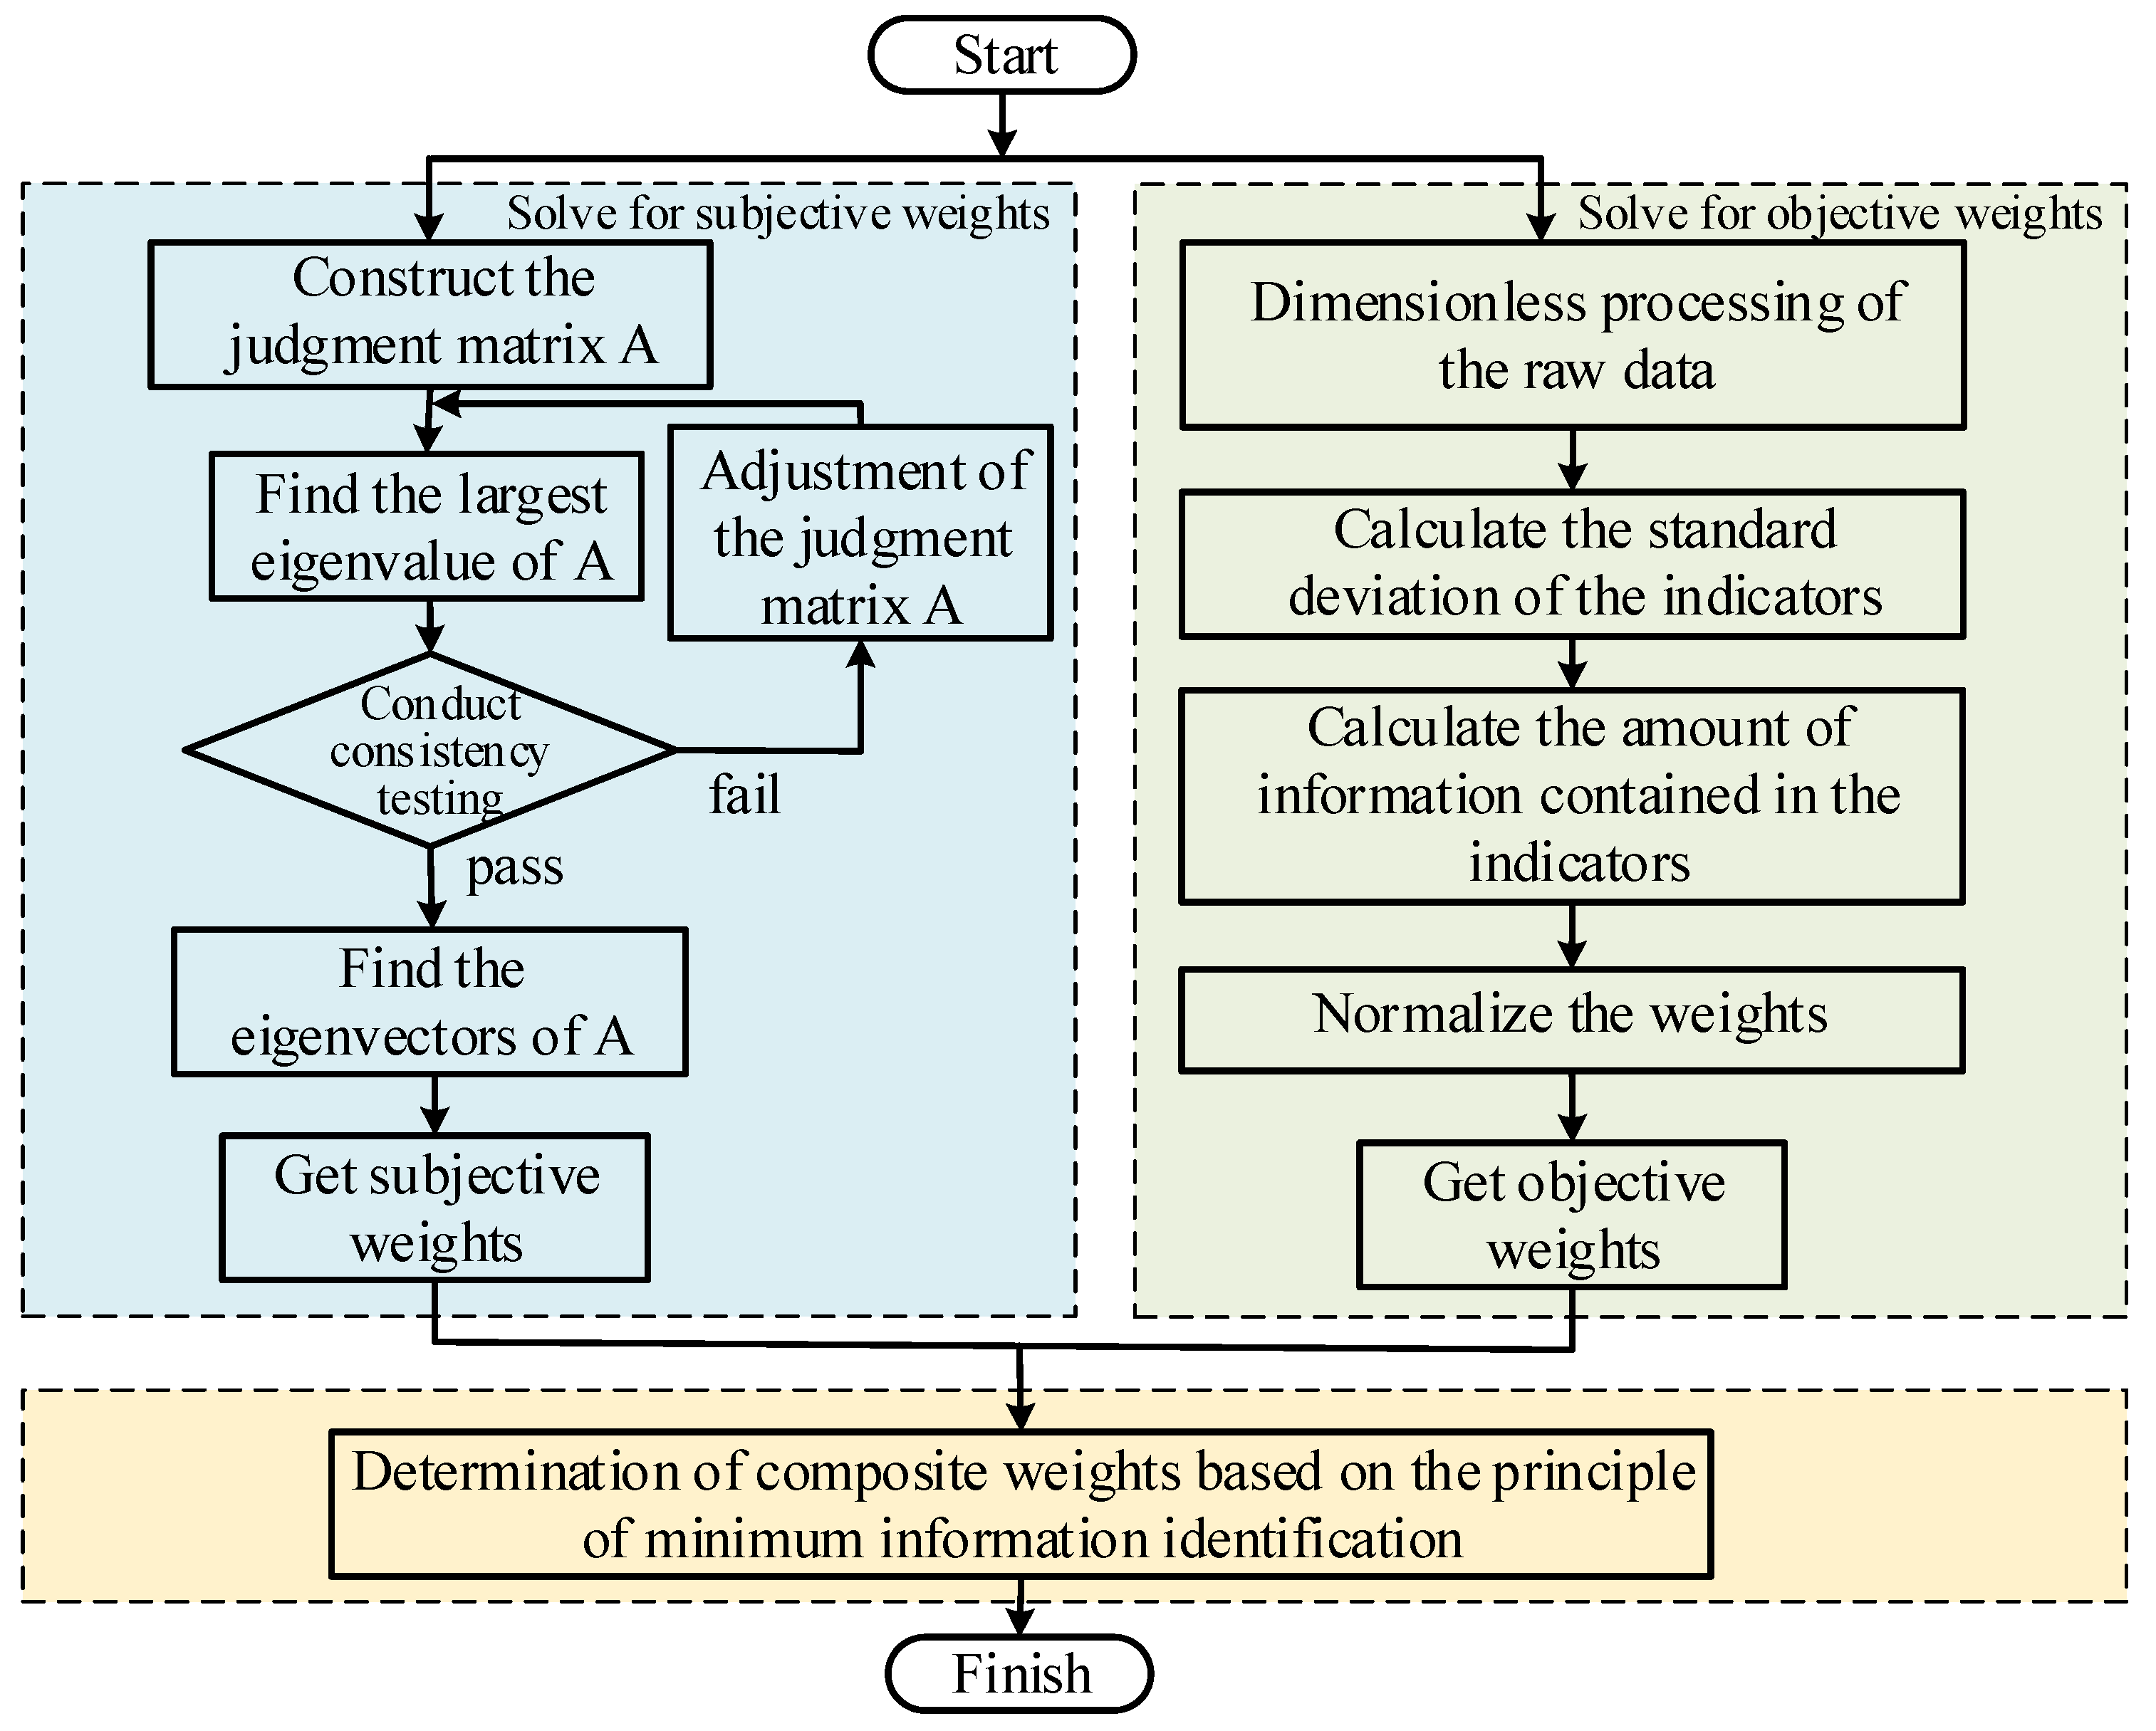
The AHP method incorporates expert experience when performing weight assignments but has some subjective limitations. The CRITIC method relies on raw data and has objective limitations. Based on the limitations of the single assignment method described in the Introduction, in order to guarantee the scientificity of the weights, this paper proposes an improved assignment method. The AHP method is used to subjectively assign weights to the indicators, while the CRITIC method is used to objectively assign weights to the indicators. The combination of subjective and objective methods is based on the principle of minimum information identification to combine the indicators to get the final weights. The calculation process is shown in Figure 5.

3.2.1. Subjective Weighting Calculation—AHP Method

AHP is a systematic and hierarchical multi-objective decision analysis method. Based on the experience judgment of experts, it changes the judgment from directly facing multiple factors at the same time to judging only two factors. The complex problem to be solved is introduced into quantitative analysis, and mathematical methods are used to quantify the results of each expert’s empirical judgment.
The subjective weights were determined using the AHP method through the following steps:
(1)
Hierarchical modeling
The model usually includes the goal, criterion, and scheme layer to clarify the goal of the decision problem.
(2)
Construct the judgment matrix
The judgment matrix indicates the relative importance of the indicators in the layer relative to the indicators in the previous layer. The values are generally given according to a nine-level scale.
(3)
Criteria layer weight coefficients and their consistency test
The judgment matrix A is:
A = a   k j n n = a   11 a   12 a   1 n a   21 a   22 a   2 n a   k j a   n 1 a   n n
where akj is the comparison result of the kth factor relative to the jth factor in the judgment matrix. The largest eigenvector of the judgment matrix A is taken for normalization, and a consistency test is performed:
C R = λ max n n 1 R I
where CR is the consistency ratio of the judgment matrix, A is the largest characteristic root of the judgment matrix, and RI is the random consistency index. When CR < 0.1, the judgment matrix passes the consistency check, and the obtained vector is the weight vector of the importance of the lower-level indicators relative to the upper-level indicators, that is, the weight vector of the hierarchical judgment matrix. Otherwise, it is not feasible and needs to be adjusted to construct a reasonable judgment matrix until it passes the consistency test.

3.2.2. Objective Weighting Calculation—CRITIC Method

The CRITIC method is a method capable of determining the objective weights of indicators, which combines the magnitude of variation within indicators and the conflict between indicators to determine the weights. By combining these two aspects, the CRITIC method can effectively determine the objective weights of indicators, thereby improving the accuracy of decision-making results. The calculation procedure is as follows:
(1)
Dimensionless processing of the raw data. The raw data are processed according to Equations (32) and (33):
Positive indicators:
x i j = x i j min x j / max x j min x j
Negative indicators:
x i j = max x j x i j / max x j min x j
In Equations (32) and (33), xij is the standardized value; x′ij is the initial value of variable j; max (xj) is the maximum value of the indicator j; and min(xj) is the minimum value of the indicator j.
(2)
Considering the vector generated by each indicator individually, the standard deviation vector σj is obtained:
σ j = i = 1 m x i j x j ¯ 2 m , j = 1 , 2 , , n
(3)
The linear correlation coefficient Rij between the two indicators is calculated as:
R i j = cov ( x i , x j ) / ( σ i , σ j ) , i , j = 1 , 2 , , n
In Equation (35), Rij is the correlation coefficient between indicator i and indicator j; σi is the standard deviation of indicator i; σj is the standard deviation of indicator j; and n is the number of indicators.
(4)
The amount of information is calculated, where Ci represents the amount of information contained in indicator i.
C i = σ i j = 1 n 1 R i j
(5)
The weights are normalized according to Equation (37):
ω i = C i j = 1 n C j

3.2.3. Calculating the Combined Weight

Based on the principle of minimum information recognition, the subjective and objective weights obtained from the AHP and CRITIC methods are combined to minimize the distribution distance of the two weights, which is calculated as:
w j = w 1 j × w 2 j j = 1 n w 1 j × w 2 j
where wj is the combination weight, w1j is the subjective weight of AHP of jth indicator, w2j is the objective weight of the CRITIC of jth indicator, and j = 1, 2, … n.

3.3. Methodology for Protection Evaluation

3.3.1. Indicator Scoring Curves

The calculated values of the evaluation indicators presented in Section 3.1 have different scales and cannot be directly weighted. With reference to the characteristics of each type of protection in relay protection and the basic requirements for the “four characteristics” of protection [29,34], and combined with the experience of experts, the intervals are divided into zones based on meeting the basic requirements of the regulations, and combined with the traditional score system [35,36]. The range of each score was determined based on our quantification of the importance and evaluation criteria of each indicator. In evaluating each indicator, we considered the degree of influence of the indicator on protection performance and developed a reasonable range of scores based on specialized knowledge and experience from previous studies. The scoring curves developed for the distribution network protection evaluation metrics are shown in the table below.
In Table 1, A1 is the three-stage overcurrent protection, A2 is the adaptive overcurrent protection, A3 is the inverse time limit overcurrent protection, and 0, 60, 75, 90, 100 are the scores of the indicator at different calculated range values.

3.3.2. Protection Evaluation Process

The aforementioned analysis summarizes the protection evaluation process for DG access to the distribution network as follows:
(1)
Identify the distribution network protection area for evaluation.
(2)
Combine the parameters of the distribution network and calculate the values of each indicator before and after accessing the DG according to the indicator calculation model.
(3)
Use the CRITIC and AHP methods to determine the indicators’ comprehensive weights. Combine the scoring curve to determine each indicator’s score, and then combine the weights to determine the comprehensive score. Compare the score with the score of protection without DG access, which can show the influence of protection after DG access. After DG access, determine the fault disposition level of the existing protection scheme. Finally, use the derived score to determine if the protection system optimization is necessary.
Table 2 displays the division criteria for evaluating distribution network relay protection. When the comprehensive score is in a zone with almost no effect, which means that the extra current generated by DG has a limited effect, under the original protection rating, it can still reliably remove the fault without changing the configuration or fixing the existing protection. The protection coordination can still protect the entire length of the line when the comprehensive score falls in the section with some influence, but the original protection’s sensitivity does not meet requirement 1.3. Simultaneously, the protection falls within section I of the protection’s protection range, and the lower the score, the more likely it is that the protection will not function accurately. In the current situation, it is necessary to adjust the protection setting value. In principle, the current protection configuration fails when the composite score falls within the severely affected zone, necessitating a protection readjustment.

4. Results

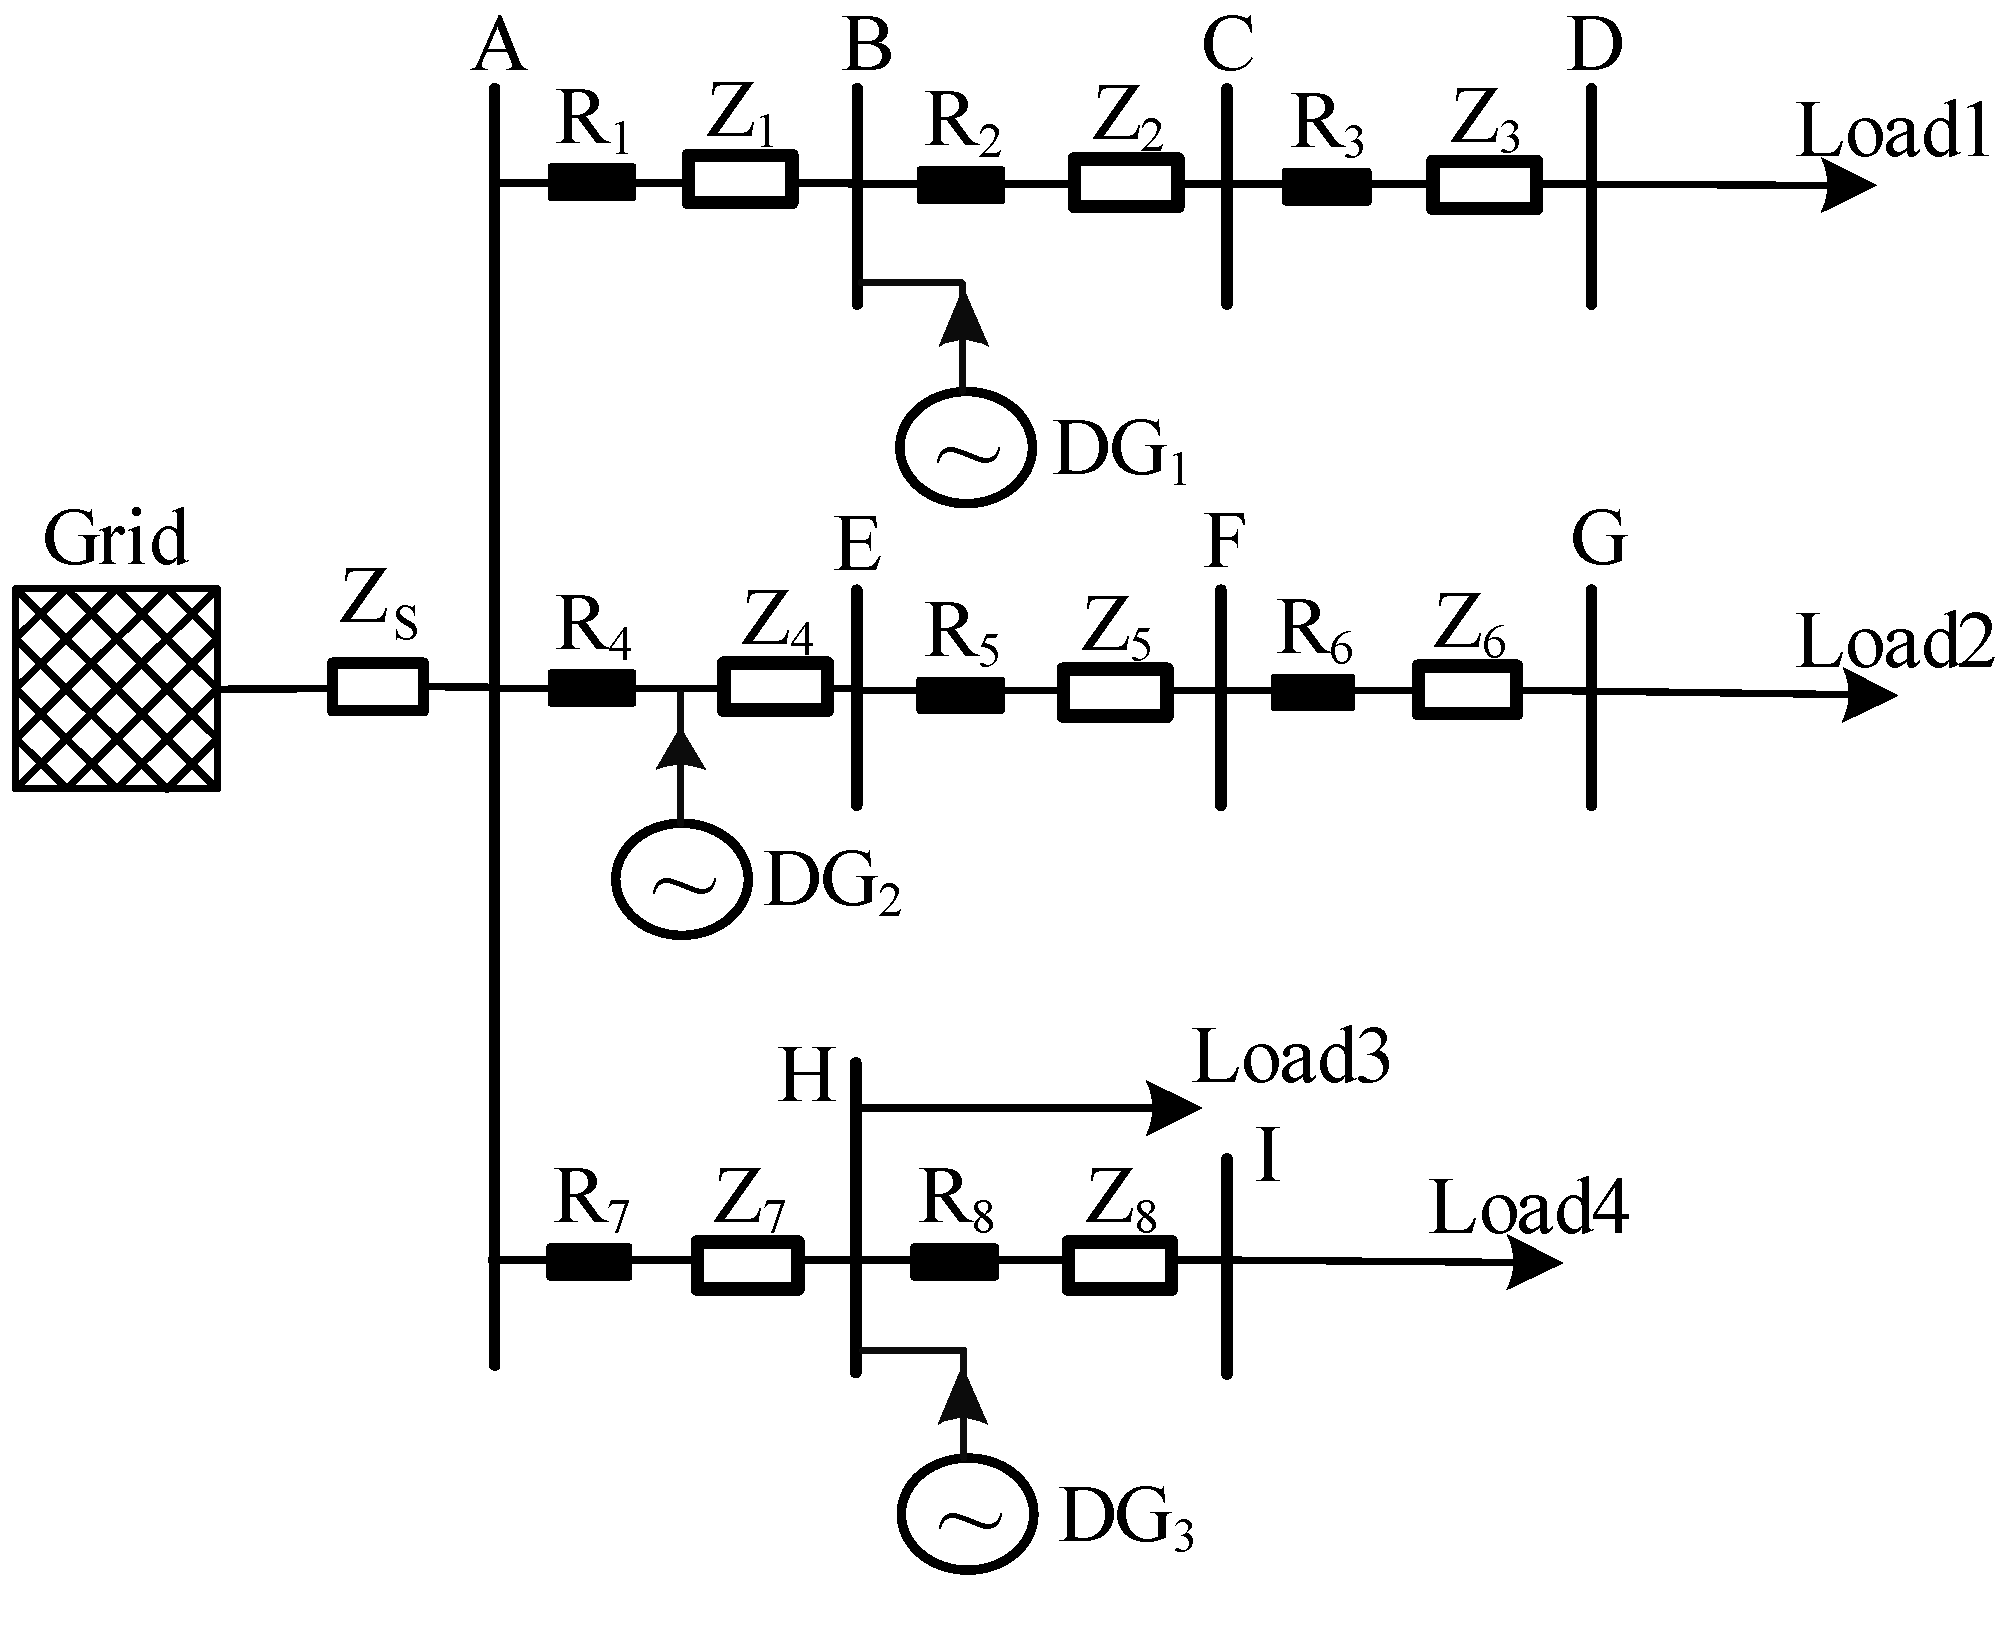
Based on the above analysis, the topology of the distribution network structure containing DG is constructed under the MATLAB(R2023b) environment as shown in Figure 6. The voltage level of the system is 10 kV, and the DG is an inverter-type power supply. The intrinsic action time of the protection device is tmin = 0.04 s, and the protection time step of the upper and lower line is Δ t = 0 . 3 . The equivalent impedance ZS of the distribution network under any system operation mode is j0.16 Ω. In the system maximum operation mode, ZSmin is j0.126 Ω, in the system minimum operation mode, ZSmax is j0.35 Ω, and the line impedance is z = 0.270 + j 0.347   Ω /km. The length of lines in the AB, AE, and AH segments is 3 km; the length of lines in the BC, EF, and HI segments is 4 km; and the length of lines in the CD and FG segments is 10 km. This topology serves as an illustrative example to assess the impact of DG access on protection.

4.1. Protection Evaluation Calculation Process

Taking the feeder AG as an example, the values of evaluation indexes before and after accessing DG in three cases of three-stage overcurrent protection, adaptive overcurrent protection, and inverse time overcurrent protection for the AG section line are calculated according to the distribution network parameters and operation data. The calculated values of each index are evaluated based on the scoring curves. Consider protection 4 as an example to illustrate the calculation process. The capacity of DG2 is 0.5 MW, and the calculation results and scoring are shown in Table 3 below.
Analyzing the results presented in Table 3 reveals that, in the scenario described above, the access of DG leads to a reduction in the protection range for current-fast breaking protection, an increase in protection action time, and a simultaneous decrease in the sensitivity of all three protection types. Although the current DG capacity maintains sensitivity within the specified requirements, an increase in DG capacity may result in the sensitivity of overcurrent protection falling below the prescribed threshold of 1.3.
The AHP method and CRITIC method are respectively used to determine the subjective weight and objective weight of each indicator, and the comprehensive weight of each indicator is determined by the combined weight formula. The comprehensive weights of each protection evaluation index of distribution network are obtained, as shown in Table 4 below.
Combining the AHP method and CRITIC method showed that the comprehensive weight can reduce the impact of the negative effect on the weight under the subjective factors, and improve the scientific nature of the assignment. The score is calculated by combining the scoring table and the comprehensive weights of each index to obtain the comprehensive score of distribution network adaptability under the two scenarios of distributed DG without access and with access; the results of the comprehensive evaluation index of distribution network protection are shown in Table 5.
From the results in Table 5, it can be seen that after DG access, the scores of all three protection principles are reduced on the original basis using the traditional protection scheme for fault determination and removal. In the case selected in this paper, the inverse time overcurrent protection has a higher score after DG access, and the traditional three-stage overcurrent protection has a lower score in comparison. However, the scores for all three types of protection meet the current DG capacity requirements. However, as DG penetration increases, the adaptability of the traditional protection principle will deteriorate.

4.2. Evaluation Results of Protection at Different Capacities of DG

In order to quantitatively obtain the adaptability of the conventional protection after DG access, the effect on the protection is considered for both cases of DG access increasing the fault current magnitude and decreasing the fault current magnitude. The penetration of the DG is varied and the scoring results are calculated for the above two cases.
Taking protection 4 as an example, we changed the DG capacity and recalculated the values of each evaluation index. Using the evaluation method proposed in this paper, the comprehensive score of protection 4 under different DG capacity is obtained as shown in Table 6.
From Table 6, it can be seen that the three-stage overcurrent protection score is below 90 when the DG penetration is 20%. The scores of adaptive current protection and inverse time current protection fall below 90 when the DG penetration is at 50%. With increasing penetration, the scores of the three protections gradually decrease. When the penetration rate reaches 90%, the score of three-stage overcurrent protection is 69.19. Adaptive protection has a slight advantage over overcurrent protection. The inverse time limit protection has a better adaptation to the current topology when the DG permeability changes. In order to ensure the accurate operation of the three types of protection, it is necessary to adjust the setting values at a specific DG penetration rate. Specifically, when the DG penetration rate is 20%, the phase current protection rectification values need to be fine-tuned. In addition, both the adaptive overcurrent protection and the inverse time current protection need to be adjusted at a DG penetration rate of 50%. Table 7 shows the results of the composite scores for Protection 5 as the DG permeability changes.
In Table 7, it is evident that both the scores for conventional overcurrent protection and adaptive overcurrent protection fall below 90 in the absence of a DG connection. With the increasing penetration of DG, there is a gradual improvement in the scores for both protection methods. Compared with no DG access, DG access increases the amplitude of the short circuit current measured in the protection downstream of DG. It proves advantageous in enhancing the adaptability of the protection system. Inverse time current protection exhibits higher sensitivity when compared to conventional overcurrent protection. The DG access increases the amplitude of the fault current and will reduce the action time of the protection. The performance of the protection is enhanced when the DG capacity is suitable. However, it is observed that the score of inverse time current protection diminishes with higher DG capacities. At a DG penetration of 90%, the score for inverse time current protection is recorded as 77.40. This is attributed to the positive impact of increased fault current on this level of protection, but it may affect the cooperation of adjacent protection. Consequently, adjustments are deemed necessary for inverse time current protection.

4.3. Evaluation Results and Comparative Analysis

Traditional methods do not have a systematic evaluation method when evaluating protection. When there is no DG access, traditional evaluation methods generally calibrate the sensitivity, and the main consideration is whether the sensitivity index is within the specified range. This is done when the sensitivity indicator value is calculated. The performance of the indicators of protection is not measured comprehensively, so it is not possible to compare the specific performance of protection guards under the same standard. Connecting the distributed power supply will affect the selectivity, quick-action, sensitivity, and reliability of the traditional protection principle. This paper proposes a method that quantifies the adaptability of the protection principle and obtains the relative scores of the protection indexes, thereby facilitating intuitive analysis and adjustment of the protection.
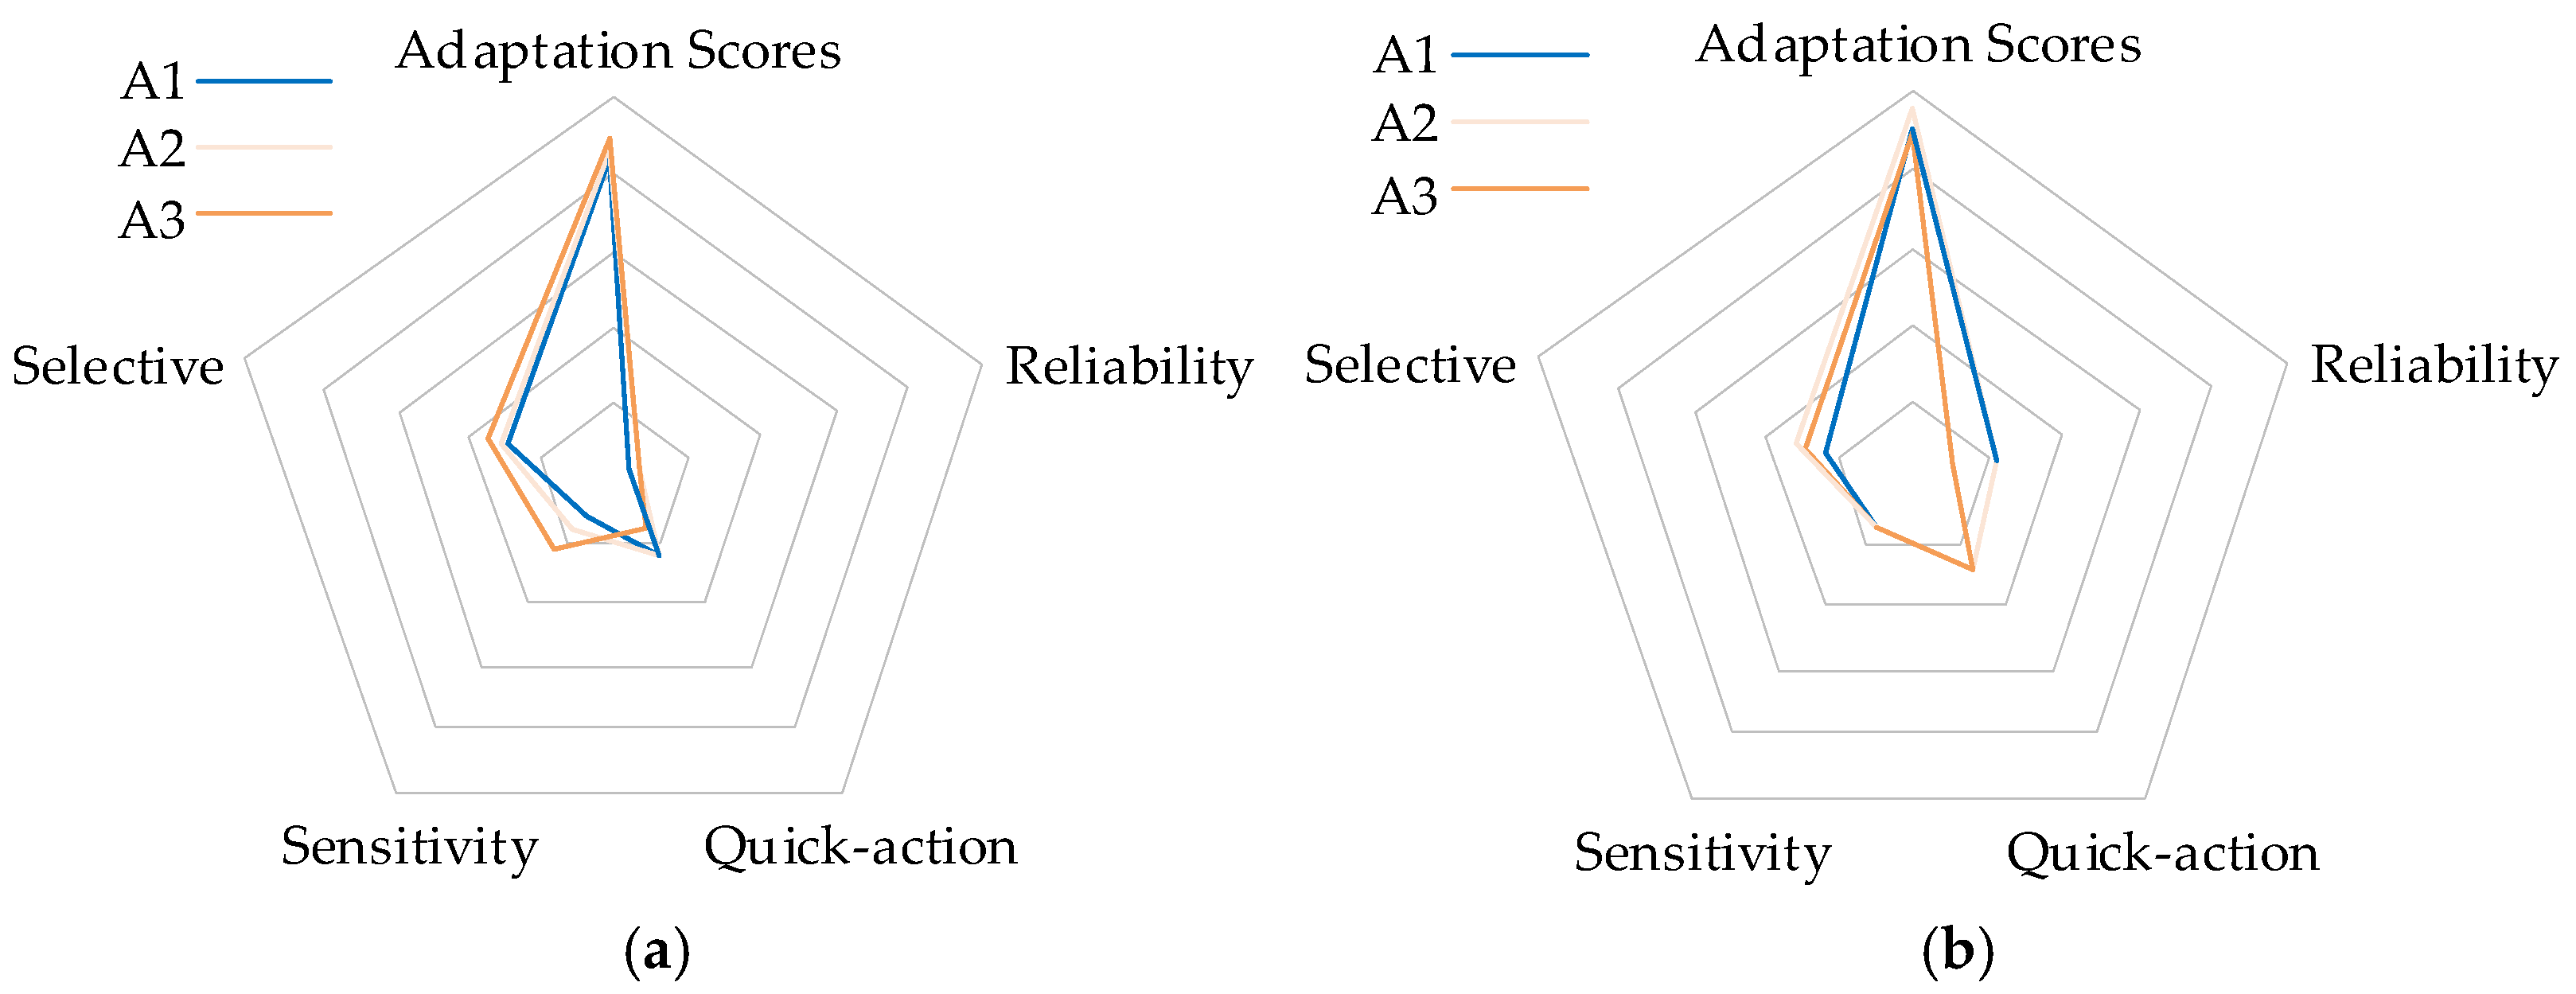
Figure 7 is a schematic diagram illustrating the comprehensive assessment of the adaptability level of the performance of three distinct types of protection. Figure 7a shows the graph of the adaptability level of the protection when the DG decreases the current magnitude, and Figure 7b shows the graph of the adaptability level of the protection when the DG increases the current magnitude. The innermost tier shown in the chart is 20 points, increasing from tier to tier, with the outermost tier being 100 points. The graphs show the combined scores of the different types of protection as well as the performance of the protection in the four dimensions. From the four dimensions combined, A3 has the highest overall score when protection 4 is installed with three different protections, respectively. Additionally, it outperforms the other two protections in all four dimensions. When protection 5 is installed with three different protections, respectively, the protection performance of A2 is more balanced in the four dimensions. At the same time, it has the highest comprehensive score. The selectivity of A1 is the worst, which can be targeted to optimize the protection according to the evaluation results. In conclusion, this paper suggests a complete way to measure the adaptability level of different types of protection. This method can not only give scores for the adaptability level of different types of protection, but it can also advise on how to improve protection based on the level of specific evaluation indicators. It serves as a reference for optimizing protection following a high percentage of DG access.

5. Discussion

Combining the above analysis, we conclude that a DG penetration of 50% under the current topology can reasonably improve the adaptation of protection 5 to three-stage current protection, with all three types of protection satisfying the scoring criteria. We can leverage the advantage of the DG-boosting effect to enhance protection performance. When the external drawdown effect lowers the protection performance for single-ended current protection, this paper’s method can quantitatively determine the DG penetration rate that requires optimization for protection.
This paper proposes an evaluation scheme specific to single-ended current protection. In fact, when considering the different performance of the protection as well as evaluating the protection in combination with other factors, different focuses can lead to different evaluation results. This paper proposes an evaluation scheme based on a protection action perspective. When implementing this scheme, it is imperative to consider the specific topology according to the current protection requirements, reasonably determine the judgment matrix, and objectively obtain the evaluation results of different protections.

6. Conclusions

In order to scientifically and rationally assess the disposition level of traditional protection schemes facing faults after DG access to the distribution network, this paper conducts a quantitative evaluation of the acceptance capability of existing distribution network protection schemes for DGs. The following conclusions can be obtained:
(1)
The results obtained by the improved AHP–CRITIC combined assignment method based on the principle of minimum information identification are more accurate and reasonable, and the limitations of the single-assignment method are solved in terms of weight assignment; the comprehensive scores of the protections under different DG penetration rates can be quantitatively obtained; and the adaptive boundaries of the existing commonly used protections of the distribution network are clarified.
(2)
The chosen evaluation indexes accurately represent the performance of the protection. The quantitative results can identify the weak links of distribution network protection to deal with faults after DG access and, at the same time, identify the suitable capacity of DG to improve the protection performance. The method proposed in this paper can make an accurate and realistic evaluation of distribution network protection, which can provide a reference and basis for the optimization of the protection scheme after the access of large-scale distributed power supplies.
During the actual operation of the distribution network, the output power of DG fluctuates with time, external environment, and other factors. With the development of distribution networks, intelligent monitoring and regulation systems are applied. The real-time monitoring of the status and power fluctuation of DGs through sensors enables the real-time output data of DGs to be obtained. The calculation results obtained by using the method described in this paper are shared between the protection devices through network communication, which can realize the rapid transfer of information between them. Using the method of this paper combined with the development and application of intelligent protection, the challenges brought by the intermittency and fluctuation in DG can be effectively dealt with. Based on the results obtained in this paper, timely adjustment of protection devices can be realized by this method. This maximizes the utilization of DG and reliably ensures the normal operation of the power system and the continuity of the power supply.

Author Contributions

Conceptualization, J.Z., W.L. and Y.Z.; writing—review & editing, X.L.; methodology, J.Z. and W.L.; validation, Y.Z. and B.L.; formal analysis, M.W. and G.L.; data curation, Y.Z.; writing—original draft preparation, Y.Z.; writing—review and editing, Y.Z., J.Z. and W.L.; supervision, G.L. and M.W. All authors have read and agreed to the published version of the manuscript.

Funding

This work was supported by North China Electric Power Research Institute Co., Ltd., under project 52018K230001.

Data Availability Statement

The data presented in this study are available on request from the corresponding author. The data are not publicly available due to privacy.

Conflicts of Interest

Authors Weichen Liang, Xuan Li and Bo Liu were employed by the company Electric Power Research Institute of State Grid Jibei Electric Power Co., Ltd. Author Jin Zong was employed by the company State Grid Jibei Electric Power Co., Ltd. The remaining authors declare that the research was conducted in the absence of any commercial or financial relationships that could be construed as a potential conflict of interest. The authors declare that this study received funding from North China Electric Power Research Institute Co., Ltd. The funder was not involved in the study design, collection, analysis, interpretation of data, the writing of this article or the decision to submit it for publication.

References

  1. Zhao, J.B.; Wang, L. Building a new power system with new energy as the main body in the 14th Five-Year Plan. China Energy 2021, 43, 5. [Google Scholar]
  2. Vovos, P.N.; Kiprakis, A.E.; Wallace, A.R.; Harrison, G.P. Centralized and Distributed Voltage Control: Impact on Distributed Generation Penetration. IEEE Trans. Power Syst. 2007, 22, 476–483. [Google Scholar] [CrossRef]
  3. Coster, E.J.; A Myrzik, J.M.; Kruimer, B.; Kling, W.L. Integration Issues of Distributed Generation in Distribution Grids. Proc. IEEE 2010, 99, 28–39. [Google Scholar] [CrossRef]
  4. Hussain, B.; Sharkh, S.M.; Abusara, M.A. Integration of distributed generation into the grid: Protection challenges and solutions. In Proceedings of the 10th IET International Conference on Developments in Power System Protection (DPSP 2010). Managing the Change, Manchester, UK, 29 March 2010–1 April 2010; pp. 1–5. [Google Scholar]
  5. Wang, S.X.; Song, L.K.; Shu, X. Adaptive overcurrent protection scheme for active distribution network with high penetration access of distributed generation and multiple loads. High Volt. Technol. 2019, 45, 1783–1794. [Google Scholar]
  6. Jedrzejczak, J.; Anders, G.J.; Fotuhi-Firuzabad, M.; Farzin, H.; Aminifar, F. Reliability assessment of protective relays in harmonic-polluted power systems. IEEE Trans. Power Deliv. 2016, 32, 556–564. [Google Scholar] [CrossRef]
  7. Gao, S.K.; Cao, W.; Zhang, X.H.; Zhao, H.C.; Wei, H.L. An improved distribution network adaptive overcurrent protection method. Power Syst. Prot. Control 2021, 49, 110–119. [Google Scholar]
  8. Li, Y.L.; Jin, Q.; Li, B.T.; Li, Z.Z. Application of low voltage accelerated inverse time overcurrent protection in microgrid. J. Tianjin Univ. 2011, 44, 955–960. [Google Scholar]
  9. Liu, Y.J.; Wei, Z.N.; Sun, Z.Q.; Zhang, W. Low impedance accelerated inverse time overcurrent protection. Power Grid Technol. 2019, 43, 3424–3431. [Google Scholar]
  10. Luo, D.; Xia, Y.; Zeng, Y.; Li, C.; Zhou, B.; Yu, H.; Wu, Q. Evaluation Method of Distribution Network Resilience Focusing on Critical Loads. IEEE Access 2018, 6, 61633–61639. [Google Scholar] [CrossRef]
  11. Ren, Z.; Li, H.; Li, W.; Zhao, X.; Sun, Y.; Li, T.; Jiang, F. Reliability Evaluation of Tidal Current Farm Integrated Generation Systems Considering Wake Effects. IEEE Access 2018, 6, 52616–52624. [Google Scholar] [CrossRef]
  12. Wang, H.B.; Xu, H.; Tong, X.Y.; Diao, X.H.; Guo, S.; Zheng, Y.K. Online assessment method of disturbance degree of intelligent substation protection system based on structural entropy weight method and fault tree. Grid Technol. 2019, 43, 1772–1787. [Google Scholar] [CrossRef]
  13. Gao, L.; Song, L.L.; Yang, Y.; Yuan, Y.B.; Cui, Y.; Wu, Y. Condition assessment method and application of intelligent substation secondary equipment based on multi-parameter modeling. Power Autom. Equip. 2018, 38, 210–215. [Google Scholar] [CrossRef]
  14. Liu, X.; Zhou, X.; Gu, J.; Chen, J.; Liu, B.; Chen, X. Reliability assessment of relay protection system considering different protection configuration schemes. In Proceedings of the 2017 2nd International Conference on Power and Renewable Energy (ICPRE), Chengdu, China, 20–23 September 2017; pp. 239–243. [Google Scholar]
  15. Zhang, S.; Liu, W.; Wan, H.; Bai, Y.; Yang, Y.; Ma, Y.; Lu, Y. Combing data-driven and model-driven methods for high proportion renewable energy distribution network reliability evaluation. Int. J. Electr. Power Energy Syst. 2023, 149, 108941. [Google Scholar] [CrossRef]
  16. Yuan, B.Y.; Hong, J.L.; Zhao, Y.Z. Research on real-time Evaluation of Relay Protection based on wide area information. Power Syst. Prot. Control 2021, 49, 150–157. [Google Scholar]
  17. Zhang, L.; Guo, P.; Li, Z.Q.; Zhang, H.F.; Yan, Z.T.; Kang, Y.Q. Comprehensive evaluation method of relay protection for a new power system. Power Grid Technol. 2024, 48, 1633–1645. [Google Scholar] [CrossRef]
  18. Xu, F.; Sheng, H.H.; Wu, J.Y.; Zheng, Y.; Wang, J.H.; Yin, H.; Yin, J.J. Research on condition evaluation of relay protection device based on grey correlation degree. Electr. Meas. Instrum 1–7. Available online: http://kns.cnki.net/kcms/detail/23.1202.TH.20240511.0905.004.html (accessed on 20 June 2024).
  19. Sun, H.; Zhang, G.Q.; Gao, B.; Wang, Y.; Li, Y.S.; Li, Y.Z. A fuzzy comprehensive evaluation of relay protection equipment status in smart substations using combined weighting method. Electr. Meas. Instrum. 2020, 57, 23–28+34. [Google Scholar] [CrossRef]
  20. Zhang, C.; Zhao, S.; Yang, Z.; He, Y. A multi-fault diagnosis method for lithium-ion battery pack using curvilinear Manhattan distance evaluation and voltage difference analysis. J. Energy Storage 2023, 67, 107575. [Google Scholar] [CrossRef]
  21. Zhang, C.; He, Y.; Yang, T.; Zhang, B.; Wu, J. An Analog Circuit Fault Diagnosis Approach Based on Improved Wavelet Transform and MKELM. Circuits Syst. Signal Process. 2022, 41, 1255–1286. [Google Scholar] [CrossRef]
  22. Zhang, C.; He, Y.; Zuo, L.; Wang, J.; He, W. A Novel Approach To Diagnosis Of Analog Circuit Incipient Faults Based On KECA And OAO LSSVM. Metrol. Meas. Syst. 2015, 22, 251–262. [Google Scholar] [CrossRef]
  23. Guo, H.Y.; Liu, J.S.; Cheng, H.Z.; Zhang, S.X.; Wang, L.H. Comprehensive assessment of distributed power grid-connectedness based on fuzzy mathematics and combinatorial assignment method. Mod. Power 2017, 34, 14–19. [Google Scholar] [CrossRef]
  24. Alatrash, H.; Mensah, A.; Mark, E.; Haddad, G.; Enslin, J. Generator Emulation Controls for Photovoltaic Inverters. IEEE Trans. Smart Grid 2012, 3, 996–1011. [Google Scholar] [CrossRef]
  25. Cao, Z.C. Research on the evaluation method of aerospace standardization division based on CRITIC and cloud model. Manned Spacefl. 2024, 30, 104–111. [Google Scholar]
  26. Nan, Y.; Song, R.Q.; Chen, P.; Hu, J.X.; Gao, T.L.; Han, W.H. Study on the factors influencing the reliability analysis in distribution network based on improved entropy weight gray correlation analysis algorithm. Power Syst. Prot. Control 2019, 47, 101–107. [Google Scholar]
  27. Wei, M.J.; Wang, C.B.; Yu, Y.; Liang, Y.; Wang, X.H. A multi-level protection optimization scheme for distribution networks with a high percentage of distributed photovoltaic access. Power Syst. Autom. 2023, 22, 55–65. [Google Scholar]
  28. Zeng, R.; Li, Y.; Xie, L.W.; Cao, Y.J.; Hu, S.J.; Hou, L.; Zhao, L. An adaptive full-line current protection method for urban distribution networks. Power Syst. Prot. Control 2023, 51, 154–163. [Google Scholar]
  29. He, J.L. Principles of Power System Relay Protection (Updated Edition); China Electric Power Press: Beijing, China, 2005; pp. 4–6. [Google Scholar]
  30. Yuan, W.; Qin, Q. Research on risk assessment strategy for setting the value of line protection devices. Electron. Devices 2020, 6, 1304–1308. [Google Scholar]
  31. Li, W.H.; Zhao, D.M.; Wang, X.; Yu, H. Adaptability evaluation method of distribution network considering distributed power grid connection. Grid Clean Energy 2017, 2, 117–123. [Google Scholar]
  32. IEEE Std C37.112-1996; IEEE Standard Inverse-Time Characteristic Equations for Overcurrent Relays. American Institute of Electrical and Electronics Engineers: Piscataway, NJ, USA, 1996.
  33. Yang, K.S.; Huang, S.F. Fundamentals of Microcomputer Relay Protection, 2nd ed.; China Electric Power Press: Beijing, China, 2005. [Google Scholar]
  34. Zhang, B.H.; Yin, X.G. Power System Relay Protection, 2nd ed.; China Electric Power Press: Beijing, China, 2010. [Google Scholar]
  35. Xu, B.Y.; Zhang, H.T.; Xian, R.C. The impact of distributed generation on relay protection of distribution network and its evaluation method. Electr. Power Constr. 2015, 1, 142–147. [Google Scholar]
  36. Zhang, L.M.; Tang, W.; Zhao, Y.J.; Wang, S.L. Comprehensive Assessment of the Impact of Distributed Generation on Distribution Network. Power Syst. Prot. Control 2010, 21, 132–135+140. [Google Scholar]
Figure 1. Schematic diagram of a distributed generator (DG) increasing fault current amplitude.
Energies 17 03907 g001
Figure 2. Schematic diagram of fault current amplitude reduction.
Energies 17 03907 g002
Figure 3. Composite sequential network diagram for two-phase short-circuit faults.
Energies 17 03907 g003
Figure 4. Inverse time overcurrent protection action time curve before and after DG connection.
Energies 17 03907 g004
Figure 5. Flowchart of weight calculation.
Energies 17 03907 g005
Figure 6. Diagram of a distribution system containing DGs.
Energies 17 03907 g006
Figure 7. Schematic diagrams of the comprehensive evaluation of the adaptability level of the three types of protection at a DG penetration rate of 50%. (a) Adaptation level for protection 4; (b) adaptation level for protection 5.
Energies 17 03907 g007
Table 1. Distribution network protection evaluation index scoring curve.
IndicatorProtection Type0607590100
SelectivityA1, A2, A3>1[0.5, 0.7)[0.7, 0.75)[0.75, 0.8)[0.8, 1)
SensitivityA1, A2, A3<1[1.1, 1.25)[1.25, 1.3)[1.3, 1.4)>1.4
QuicknessA1, A2/[1.28, 1.85)[1.14, 1.28)[1, 1.14)[1, 1.14)
A3/(1.02, 1.04](1.01, 1.02](1, 1.01][0.96, 1]
ReliabilityA1, A2, A3<0.9[0.90, 0.95)[0.95, 0.97)[0.97, 1)1
A3/[1.13, 1.17)[1.04, 1.13)[1, 1.04)1
Table 2. Distribution network relay protection evaluation division standard.
Evaluation score[90, 100)[60, 90)[0, 60)
Degree of impactVirtually no effectInfluence to a certain degreeSevere influence
Table 3. Calculated values and scores of distribution network protection evaluation indexes.
IndictorProtection TypeCalculated Value without Access to DGScoreCalculated Value of Access to DGScore
SelectiveA10.8001000.79790
A20.8171000.813100
A311001100
SensitivityA11.306901.30190
A21.369901.36490
A37.2191007.192100
Quick actionA111001.01090
A211001.01190
A311001.00190
ReliabilityA111000.99590
A211000.99590
A311001.00990
Table 4. Calculated values of weights of evaluation indicators for distribution network protection.
IndictorAHPCRITIC MethodCombined Weights
Selective0.41840.34330.4006
Sensitivity0.26960.13750.2035
Quick action0.12090.38900.2292
Reliability0.19110.13020.1667
Table 5. Distribution network protection composite score value.
Protection TypeScoring without Access to DGScoring of Access to DG
A197.9690.00
A297.9694.00
A310096.04
Table 6. Combined scoring results for protection 4 with different DG capacities.
DG PenetrationProtection TypeScoring of Access to DG
20%A186.92
A293.84
A395.89
50%A184.28
A287.45
A389.62
70%A178.55
A284.95
A383.47
90%A169.21
A277.93
A383.26
Table 7. Combined scoring results for protection 5 with different DG capacities.
DG PenetrationProtection TypeScoring of Access to DG
0A183.94
A288.32
A3100
20%A189.07
A291.74
A397.74
50%A191.75
A296.70
A390.96
70%A196.71
A296.71
A390.96
90%A196.71
A2100
A377.40
Disclaimer/Publisher’s Note: The statements, opinions and data contained in all publications are solely those of the individual author(s) and contributor(s) and not of MDPI and/or the editor(s). MDPI and/or the editor(s) disclaim responsibility for any injury to people or property resulting from any ideas, methods, instructions or products referred to in the content.