Article

Electricity Behavior Modeling and Anomaly Detection Services Based on a Deep Variational Autoencoder Network

by
Rongheng Lin
1,
Shuo Chen
1,*,
Zheyu He
1,
Budan Wu
1,
Hua Zou
1,
Xin Zhao
2 and
Qiushuang Li
2
1
State Key Laboratory of Networking and Switching Technology, School of Computer Science (National Pilot Software Engineering School), Beijing University of Posts and Telecommunications, Beijing 100876, China
2
Economic & Research Institute, State Grid Shandong Electric Power Company, Jinan 250021, China
*
Author to whom correspondence should be addressed.
Energies 2024, 17(16), 3904; https://doi.org/10.3390/en17163904
Submission received: 29 June 2024 / Revised: 27 July 2024 / Accepted: 5 August 2024 / Published: 7 August 2024
(This article belongs to the Section F: Electrical Engineering)

Abstract

:
Understanding electrical load profiles and detecting anomaly behaviors are important to the smart grid system. However, current load identification and anomaly analysis are based on static analysis, and less consideration is given to anomaly findings under load change conditions. This paper proposes a deep variational autoencoder network (DVAE) for load profiles, along with anomaly analysis services, and introduces auto-time series data updating strategies based on sliding window adjustment. DVAE can help reconstruct the load curve and measure the difference between the original and the newer curve, whose measurement indicators include reconstruction probability and Pearson similarity. Meanwhile, the design of the sliding window strategy updates the data and DVAE model in a time-series manner. Experiments were carried out based on datasets from the U.S. Department of Energy and from Southeast China. The results showed that the proposed services could result in a 5% improvement in the AUC value, which helps to identify the anomaly behavior.

1. Introduction

The daily load data reflects the changes in the daily electricity behavior. The electricity consumption behavior of industrial and commercial users is more regular than that of ordinary residential users, while the electricity consumption of residential users exhibits certain randomness. Therefore, in analyzing the load of industrial and commercial users, the load pattern obtained offers more research and reference significance.
Further, anomaly refers to data points which are significantly different from the remaining data. Anomaly detection is important because training models on a smart grid dataset with anomalous data can lead to bias or failure in parameter estimation and model building. In addition to data collection failures, anomalous data may lead to an inconsistent pattern due to unplanned events or power theft. Generally speaking, based on user load pattern mining, by calculating the pattern difference between user electricity consumption behavior and electricity consumption habit cycle, the abnormal probability of the load curve can be evaluated, and abnormal power consumption detection and analysis can be performed on this basis.
The scope of power data preprocessing includes industrial and commercial user information, general residential user information, and load data corresponding to each power station area. The platform can provide a research basis for accurately regulating electricity demand through typical load pattern exploration and anomalous electricity consumption behavior identification. With the development of the economy, the scope of small and medium-sized enterprises involved in general industrial and commercial electricity consumption has increased, accounting for an increasing proportion of the service revenue of power grid companies. Therefore, industrial and commercial electricity customers have put forward higher requirements for power supply services. However, the functional structure of traditional load pattern mining algorithms is single, which is not conducive to accurate insights into the needs, expectations, and preferences of industrial and commercial customers.
Therefore, a more stable load pattern mining algorithm is urgently needed to fully excavate the value of fine-grained load data in order to achieve the purpose of automation and intelligent electricity behavior analysis of industrial and commercial users and to actively guide industrial and commercial users to use electricity in an orderly manner.
The contributions of this paper are as follows:
  • A power consumption behavior modeling and analysis algorithm based on an improved DVAE is proposed, including typical load pattern generation and anomaly probability analysis.
  • The convolution layer is used to optimize the DVAE and reduce the parameter redundancy of the model so that the model can efficiently handle extensive load data.
  • The sliding window is used to adapt to the periodic change in the load so that the model can automatically change the strategy of anomaly identification according to different seasons and avoid the identification error caused by the periodic change in power consumption behavior.
  • Three anomaly identification criteria are proposed: reconstruction probability, Pearson similarity, and power consumption level. Experiments on public datasets in the United States and load data in Southeast China show that the proposed model can reconstruct the electricity consumption behavior well and accurately identify abnormal electricity consumption.

2. Related Work

This section will introduce several studies regarding the use of load data for anomaly detection. Sobhani et al. [1] considered the temperature in the electric load forecasting, using a global energy forecasting competition dataset. Sun et al. [2] proposed a data-driven anomaly detection method in the modern power system, which considers both the deterministic and probabilistic technique. Fahim et al. [3] and Nakayama et al. [4] introduced load data anomaly detection into smart grid and energy management systems.
Some researchers detected anomalies under data mining frameworks (like clustering). Capozzoli et al. [5] proposed an automated load pattern learning and anomaly detection approach for enhancing energy management in smart buildings using an improved symbolic aggregate approximation (SAX) method. A data mining-based framework for the identification of daily electricity usage patterns and anomaly detection in building electricity consumption data was proposed by Liu et al. [6], which used the k-means for load profiles and a classification and regression tree to discover insightful knowledge. Some researchers detected anomalies using regression methods. Hosseinzadehtaher et al. [7] proposes a model-based anomaly detection method that consists of two components, a dynamic regression model and an adaptive anomaly threshold, which helps to detect real-time anomalies in the short term. Shah et al. [8] proposed an anomaly detection method using multivariate linear regression, Gaussian mixture models, and time-series data analysis to detect outliers in the machine behavior. Yue et al. [9] proposed a descriptive analytics-based anomaly detection method for cybersecurity load forecasting, which uses an integrated solution (IS) and a hybrid implementation of IS (HIIS) to improve the positive and reduce the false rate. Saraswat et al. [10] proposed an SVM-based anomaly detection schema for smart grids.
Some researchers introduced prediction methods into anomaly detection. Lin et al. [11] proposed a novel predictive power demand analytics methodology (PPDAM), based on deep neural networks and symbolic aggregate approximation, to predict the pattern profile of power demand in a building, along with upcoming normal (motif) and anomalous (discord) behaviors. Fenza et al. [12] adopted a long short-term memory network (LSTM) to profile and forecast the customers’ behavior based on their recent past consumption. The continuous monitoring of the consumption prediction errors helped to distinguish between possible anomalies and changes (drifts) in normal behavior.
Autoencoder networks are also introduced for anomaly detection. Zheng et al. [13] took data corruption into consideration, using a denoising variational autoencoder for data correction. They proposed a combined robust forecasting model for load forecasting and anomaly detection. The results showed that the MAPE and RMSE could achieve better scores. Wang et al. [14] compared three different models for load-profiles-based anomaly detection and prediction, which included a deep neural network regression, an autoencoder with reconstruction, and the autoencoder as anomaly detection methods.
There are also studies which compare and improve different anomaly detection algorithms. Yue et al. [15] compared different load forecasting methods, including the data analytics-based method (DABM) and symbolic aggregation approximation (SAX). Krawiec et al. [16] provided a comparison and adaptation of two strategies for anomaly detection in load profiles based on machine learning and statistical methods, which compare the LSTM with the probabilistic exponential weighted moving average. Wang et al. [17] researched the electrical load real-time prediction method (RELAD), which combines the auto regressive integrated moving average (ARIMA) model and artificial neural networks (ANN) for prediction.
In addition to load anomaly detection, this section also focuses on research regarding load pattern analysis and load curve modeling. Rajabi et al. [18] studied multiple clustering techniques for load pattern segmentation, and different parameters of the methods that affect the clustering results were evaluated. Ryu et al. [19] proposed convolutional autoencoder-based feature extraction and clustering for customer load analysis and confirmed that year-round characteristics are well captured during the clustering process and clearly visualized with load images. Wang et al. [20] proposed a probabilistic load forecasting method for individual customers to handle the variability and uncertainty of future load profiles. Piscitelli et al. [21] proposed a non-intrusive customer classification process, which does not use in-field load monitoring data as predictive attributes for the classification of unknown customers, but rather employs monthly energy bills and additional information on customers’ habits collected using a phone survey. A stacked autoencoder (SAE)-based load data mining approach was proposed by Huang et al. [22] for load data compression and classification. Ullah et al. [23] proposed a clustering-based analysis of energy consumption to categorize the customers’ electricity usage into different levels.
To better estimate load profiles, many researchers introduce short-term prediction algorithms. Laib et al. [24] combined a long short-term memory (LSTM) network and a multi-layered perceptron (MLP) network for short-term load profile estimation. Wang et al. [25] proposed a temporal convolutional network (TCN) and a light gradient boosting machine (LightGBM) framework.

3. Proposed Method

Although there has been some research on customer electricity behavior analysis, most of these studies use some traditional data analysis methods and are not suitable for the processing of massive data. Furthermore, the functional structure of the conventional analysis algorithm is relatively single, resulting in certain limitations regarding the in-depth and comprehensive study of the electricity consumption behavior of industrial and commercial users. At present, the more common user electricity behavior analysis method is the use of clustering analysis techniques, which tend to solve low-dimensional unsupervised learning problems. For example, the clustering analysis methods commonly used in the industry are based on the k-means clustering algorithm. The k-means algorithm is relatively fast, simple, and exhibits a certain increased efficiency and scalability. But the obvious disadvantage of the k-means method is its high sensitivity to the initial value, namely the initial results are different and can only guarantee the local optimum. Therefore, this method is not applicable for use with high-dimensional massive load data.
Solving the incremental instability and limitations of traditional power consumption behavior analysis algorithms is the focus of this paper. This paper puts forward a more stable electricity behavior pattern mining algorithm, especially for the analysis of the electricity patterns of individual enterprise users, in order to realize fine-grained load pattern excavation and anomalous electricity behavior detection. Generally, similar load curves are clustered into a group through various general clustering methods, and the cluster center is used as the load pattern.
Figure 1 shows the power pattern discovery and anomaly detection using outlier points based on unsupervised learning. However, the clustering algorithm is inapplicable with high-dimensional data and is time sensitive, especially when the electricity pattern changes with the passage of time. The power habit cycle adaptability of the algorithm model is a big problem. The autoencoder is an algorithm for learning input information by discovering input variables. The autoencoder algorithm is widely used in the fields of high-dimensional feature extraction and imaging. Therefore, this paper selects a variational autoencoder, i.e., the robust neural network models used in unsupervised and semi-supervised learning, to analyze and model power behavior (load profile) through training and sample reconstruction.
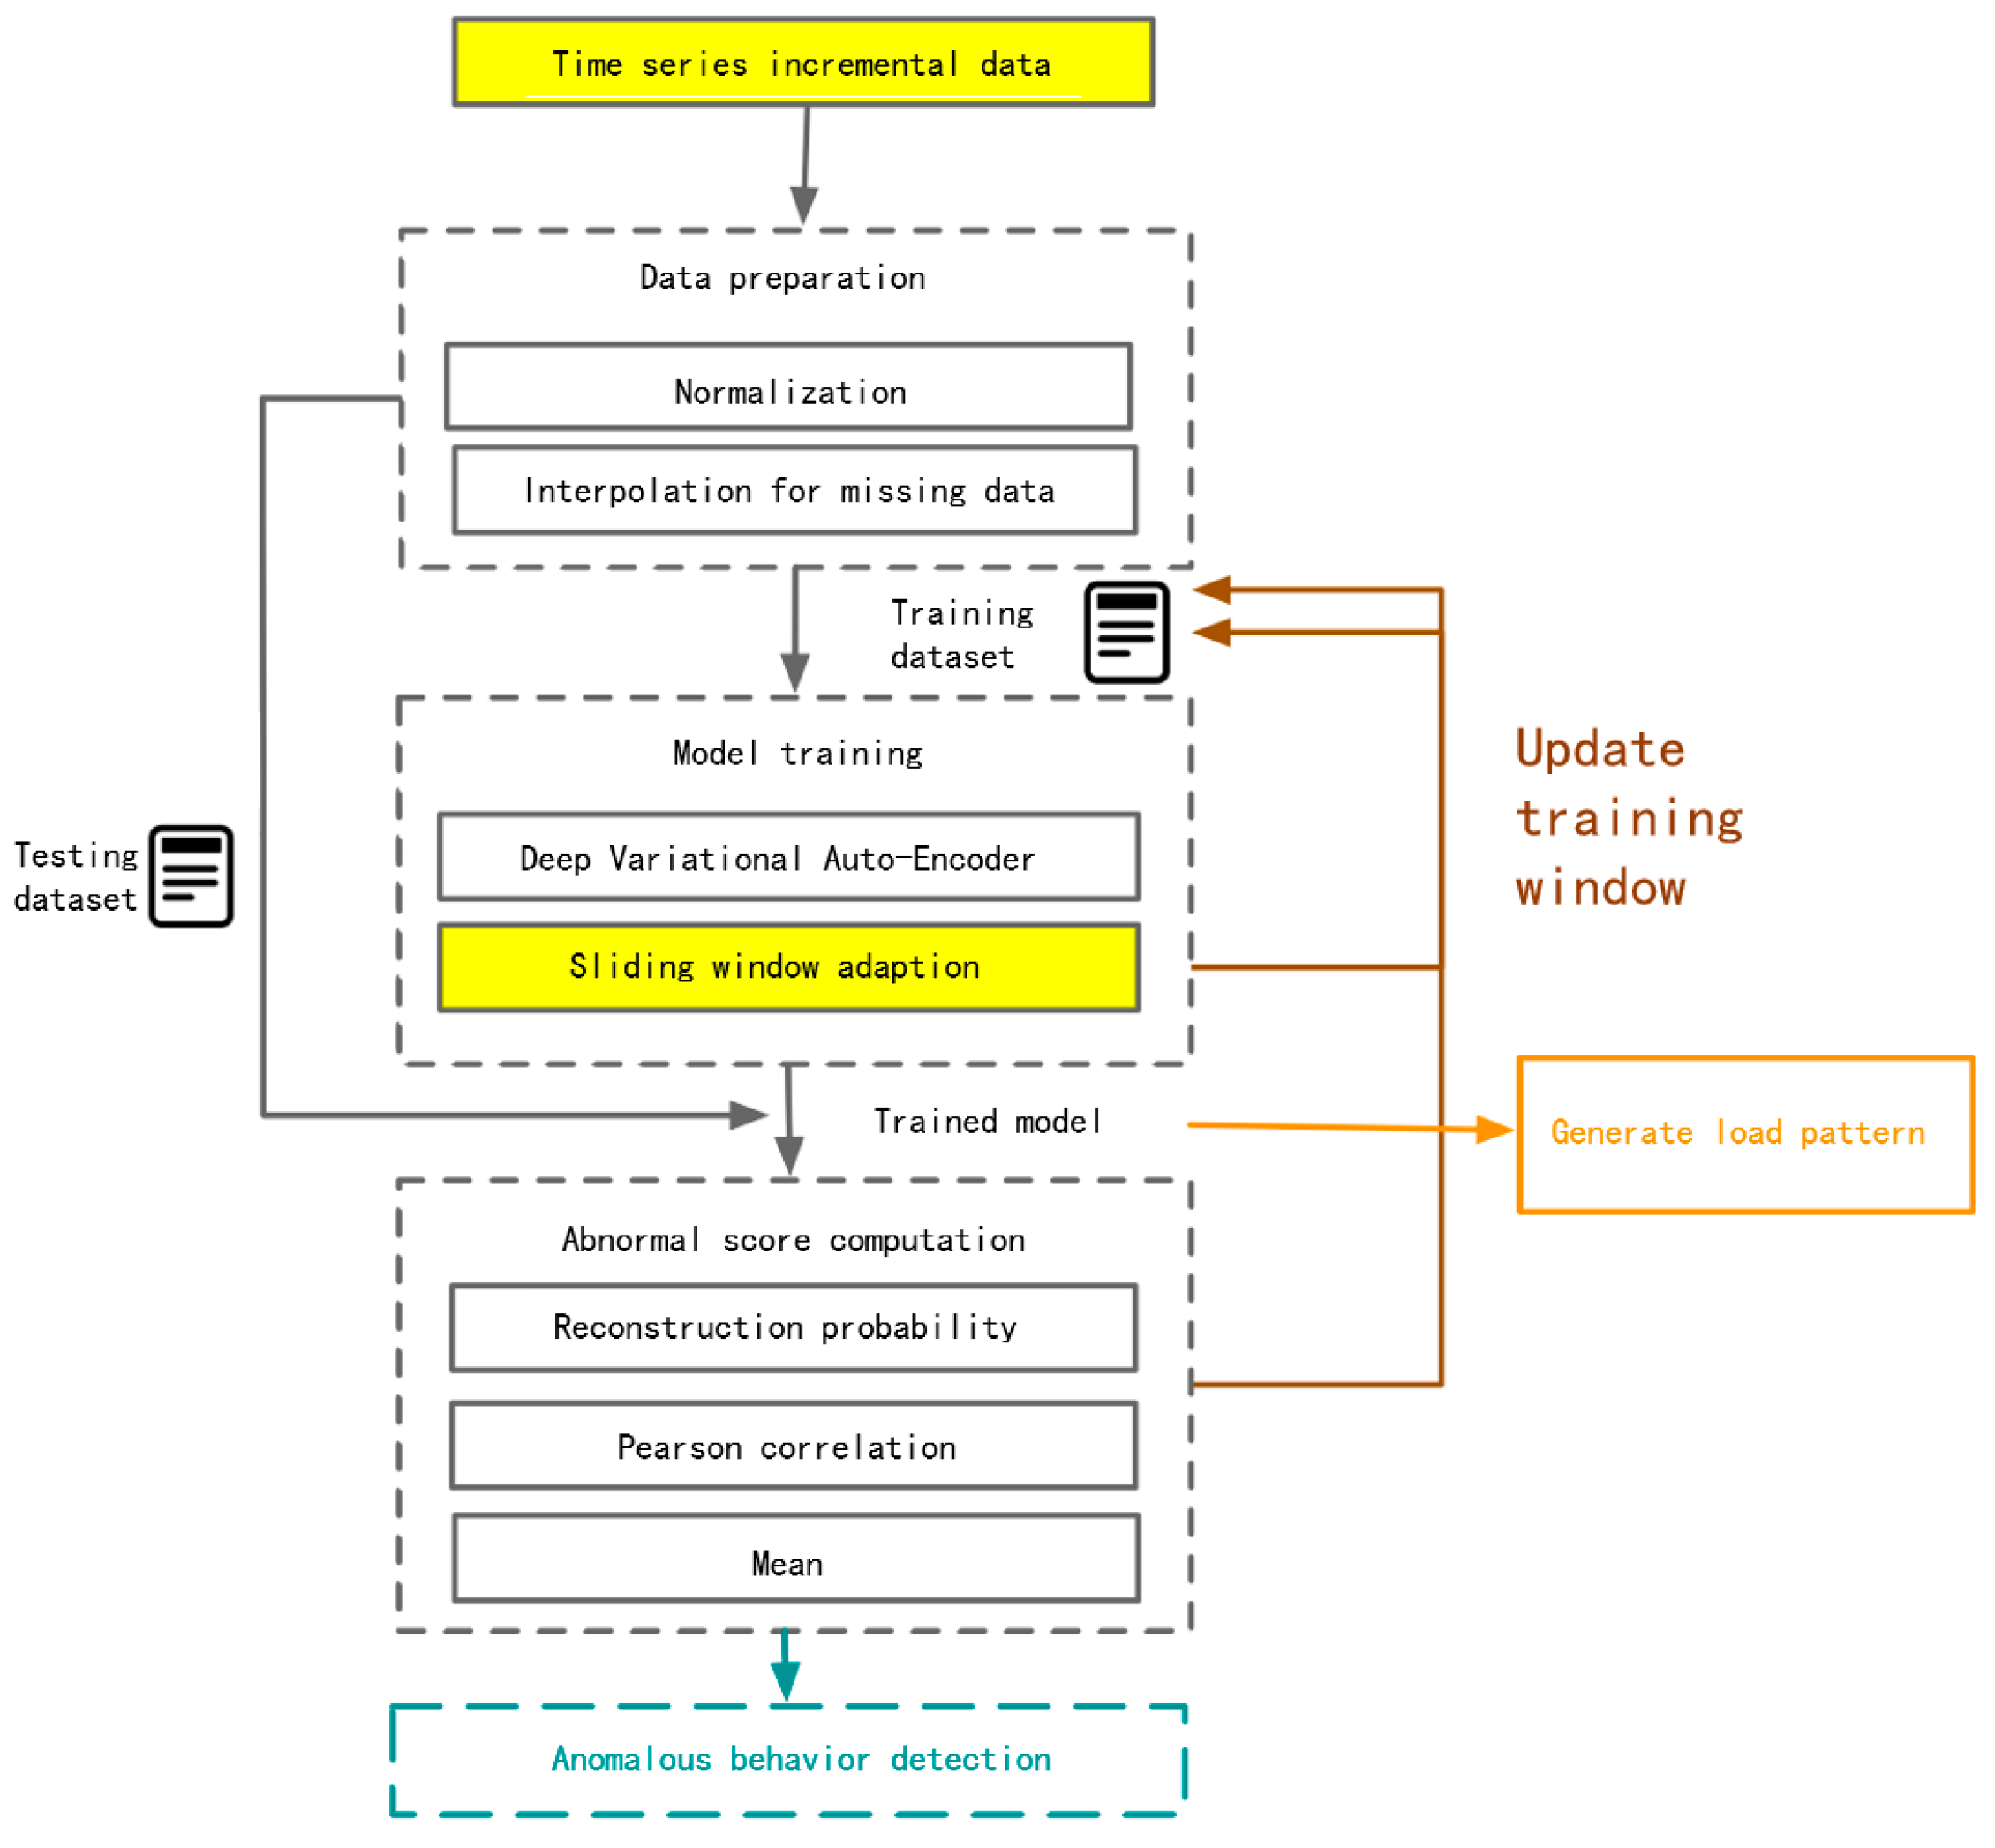
The model proposed in this paper is suitable for fine-grained electricity pattern discovery and incremental stable anomalous behavior detection. From the beginning, the premise is that the electricity patterns of industrial and commercial users are more durable, i.e., the evolution of electricity behavior over time is relatively stable and regular. The overall flow chart of the algorithm proposed in this paper is shown in Figure 2.
First, based on the dynamic evolution of fine granularity, the fine-grain data in this paper include single user load data and single industry load data, obtained through the depth provided by the variational autoencoder for load pattern generation and anomalous electricity behavior detection. To adapt to the dynamic evolution of the users’ electricity habit cycle, this paper also proposes an adaptive sliding window framework, which dynamically analyzes the industrial and commercial electricity consumption behavior through the sliding of the timing data window and the restarting of the model training to ensure the spatial and temporal stability of the algorithm.
Therefore, this paper details the two model frameworks in the algorithmic process, as follows:
(1)
The proposed method of modeling electricity behavior involves the use of a deep variational autoencoder. The anomalous electricity behavior is detected through the reconstruction probability and other indicators, and the variational autoencoder generation model explores the typical load patterns.
(2)
The conversion of the electricity pattern is determined through the anomaly detection of timing development, and the restarting of the DVAE judgment model is completed via a sliding window adaptation.

4. Mining and Anomaly Detection of the Load Pattern for Industrial and Commercial Users

4.1. Problem Description

According to the description of the overall process of electricity behavior modeling and the analysis of industrial and commercial users, this section mainly introduces the core algorithm of load pattern discovery and anomaly detection, namely the principle of using the deep variational autoencoder model. Firstly, the load pattern discovery and anomaly detection problems solved based on deep variational autoencoder are defined, and the input data format of the model is the N point load data: X = < x 1 ,   x 2 ,   , x N > . Fine-grained load data includes two categories: the first load dataset for a single user t, where d is the collective amount of data: S t = X 1 ,   X 2 ,   , X d ; and the second load dataset for a single industry p (including m users): T r a d e p = S 1 ,   S 2 ,   , S m . The research objective of this paper is to obtain the load pattern P a t t e r n = < l p 1 ,   l p 2 ,   , l p n > for the input data, where n is the number of different typical load modes. The l p i represents one of the load patterns curves. The second objective is to conduct anomaly detection for the following input load data, i.e., the input load data is labeled as a n o m a l o u s and n o r m a l , and the anomalous power consumption pattern is analyzed.
Therefore, according to the problem definition, this paper proposes the electricity behavior modeling analysis based on the use of the deep variational autoencoder (DVAE). The overall algorithm flow is shown in Figure 3. Based on the timing of incremental data acquisition, the first stage of the algorithm process is data preparation, which involves filling the input load data and the missing data value, along with z-score standardization, for a period:
x n e w = x μ δ
μ is the mean of the sample data, and δ is the standard deviation. The second stage performs model training of the DVAE to generate the trained model M o d e l D V A E = { M e n c o d e r , M d e c o d e r } , including the encoder M e n c o d e r and decoder M d e c o d e r . The variational autoencoder (VAE) can serve as the method of generating the model [26]; the distribution of hidden variables completed by training approximates the standard normal distribution so that the corresponding load pattern P a t t e r n can be generated through the trained decoder M d e c o d e r directly through the standard normal distribution. The load data of the subsequent time was used as the test dataset to calculate the anomalous score through the trained model M o d e l D V A E . There are three indicators: reconstruction probability, Pearson coefficient, and load mean. The comparison of the three indicators is used for the detection of anomalous power behavior.
In summary, the whole algorithm model can complete the power pattern generation of the input training load data and the anomalous power behavior detection of the test dataset to enable the power behavior modeling analysis of the input load data.

4.2. Improved Deep Variational Autoencoder (DVAE)

The training goal of an autoencoder (AE) is the near reconstruction of the original data, usually including an encoder (encoder) and a decoder (decoder), which can be understood as a two-step function:
Z = e n c o d e r X I
X O = d e c o d e r Z
X I represents the raw input data, Z is the compressed latent spatial representation, X O represents the reconstructed input from the latent spatial representation, and the reconstruction goal of the model is X I = X O . When AE is applied to outlier detection values, it is usually used as the error score for anomaly detection by calculating the reconstruction error of the sample, i.e., the original and reconstruction data.
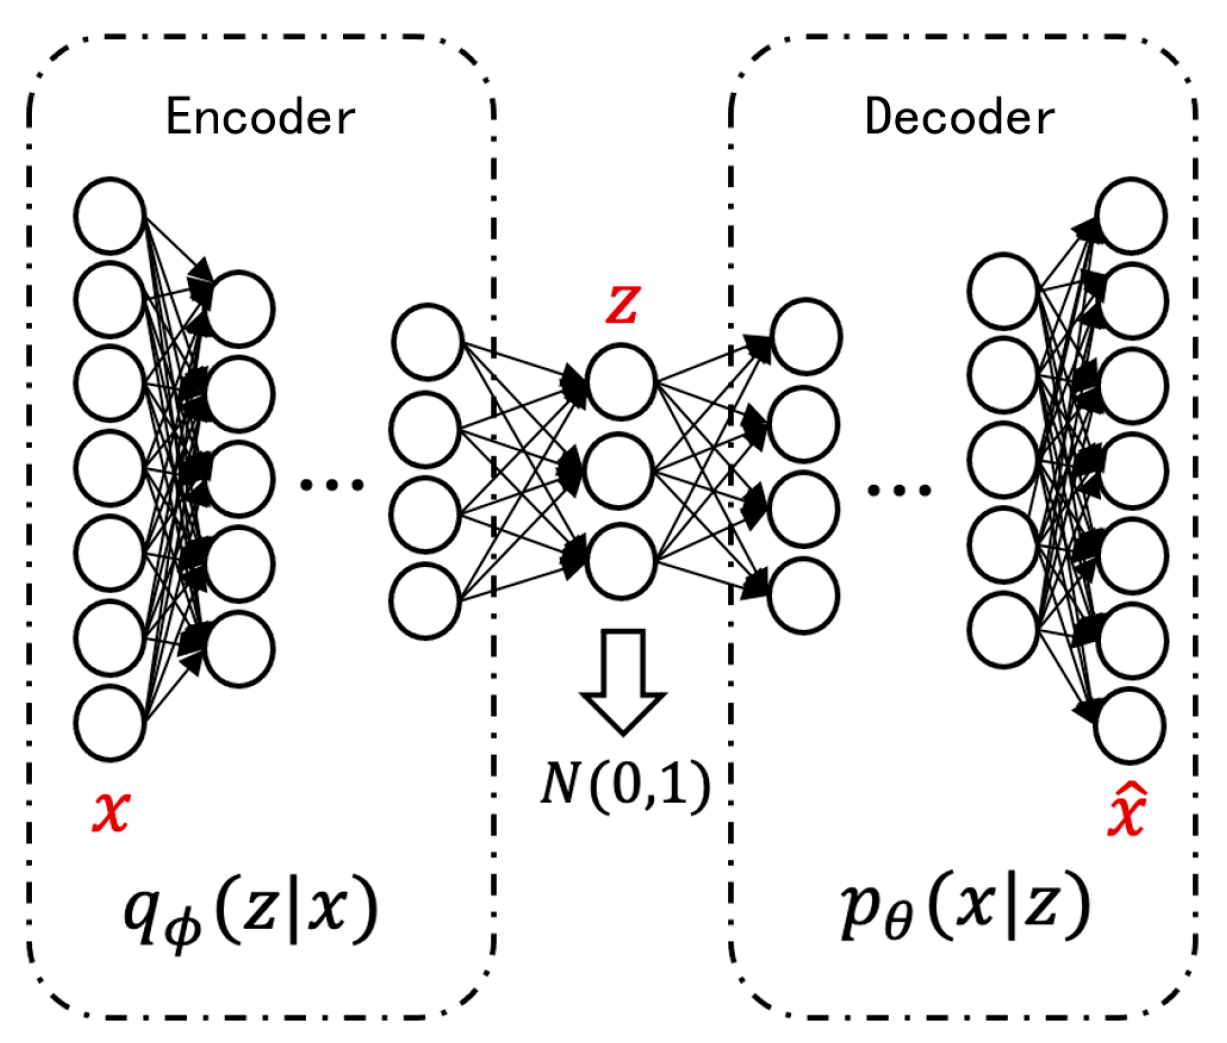
However, there is a defect in the ordinary deep autoencoder. The model can only learn the data of the input training, but it cannot be reconstructed for the data that is not learned. Hence, the learning ability of the model is very limited, and it cannot show the learned original data characteristics. In contrast, the variational autoencoder (VAE) can learn the distribution of raw data through the hidden layer, generating a model to transform between the data distributions. The schematic diagram of the variational autoencoder is shown in Figure 4. The original input data is x , and when added to the encoder, it is q ϕ z x , learning the mean and variance of the sample of the model. The model has a regular term, i.e., the hidden variable z is up to the standard normal distribution N ( 0,1 ) . And the reconstruction results x ^ generated by the decoding process p θ ( x | z ) can be robust to noise. Therefore, VAE can not only be used as a generating model for electricity pattern mining, but due to the robustness tolerance of a certain amount of anomalous training data, it can also be used for detecting anomalous patterns. And it is completely different from the deterministic discriminant model of AE.
After completing the theoretical basis selection of the VAE, to make the VAE applicable to the analysis scenario of the load data, this study improves the effect of the model by adding the convolutional layer. The convolutional layer [27] is mainly used in image processing to extract the features of the pictures based on maintaining the spatial relations between the pixels. Similarly, the task of VAE is to understand the trend of electricity consumption behavior and the main local profile characteristics. In order to avoid parameter redundancy caused by direct use of the fully connected layer, the convolution layer is applied to the encoder and decoder to process 96 datapoints generated every day or even 672 datapoints generated every week. The basic network is enhanced by the convolutional and centralized learning ability models.
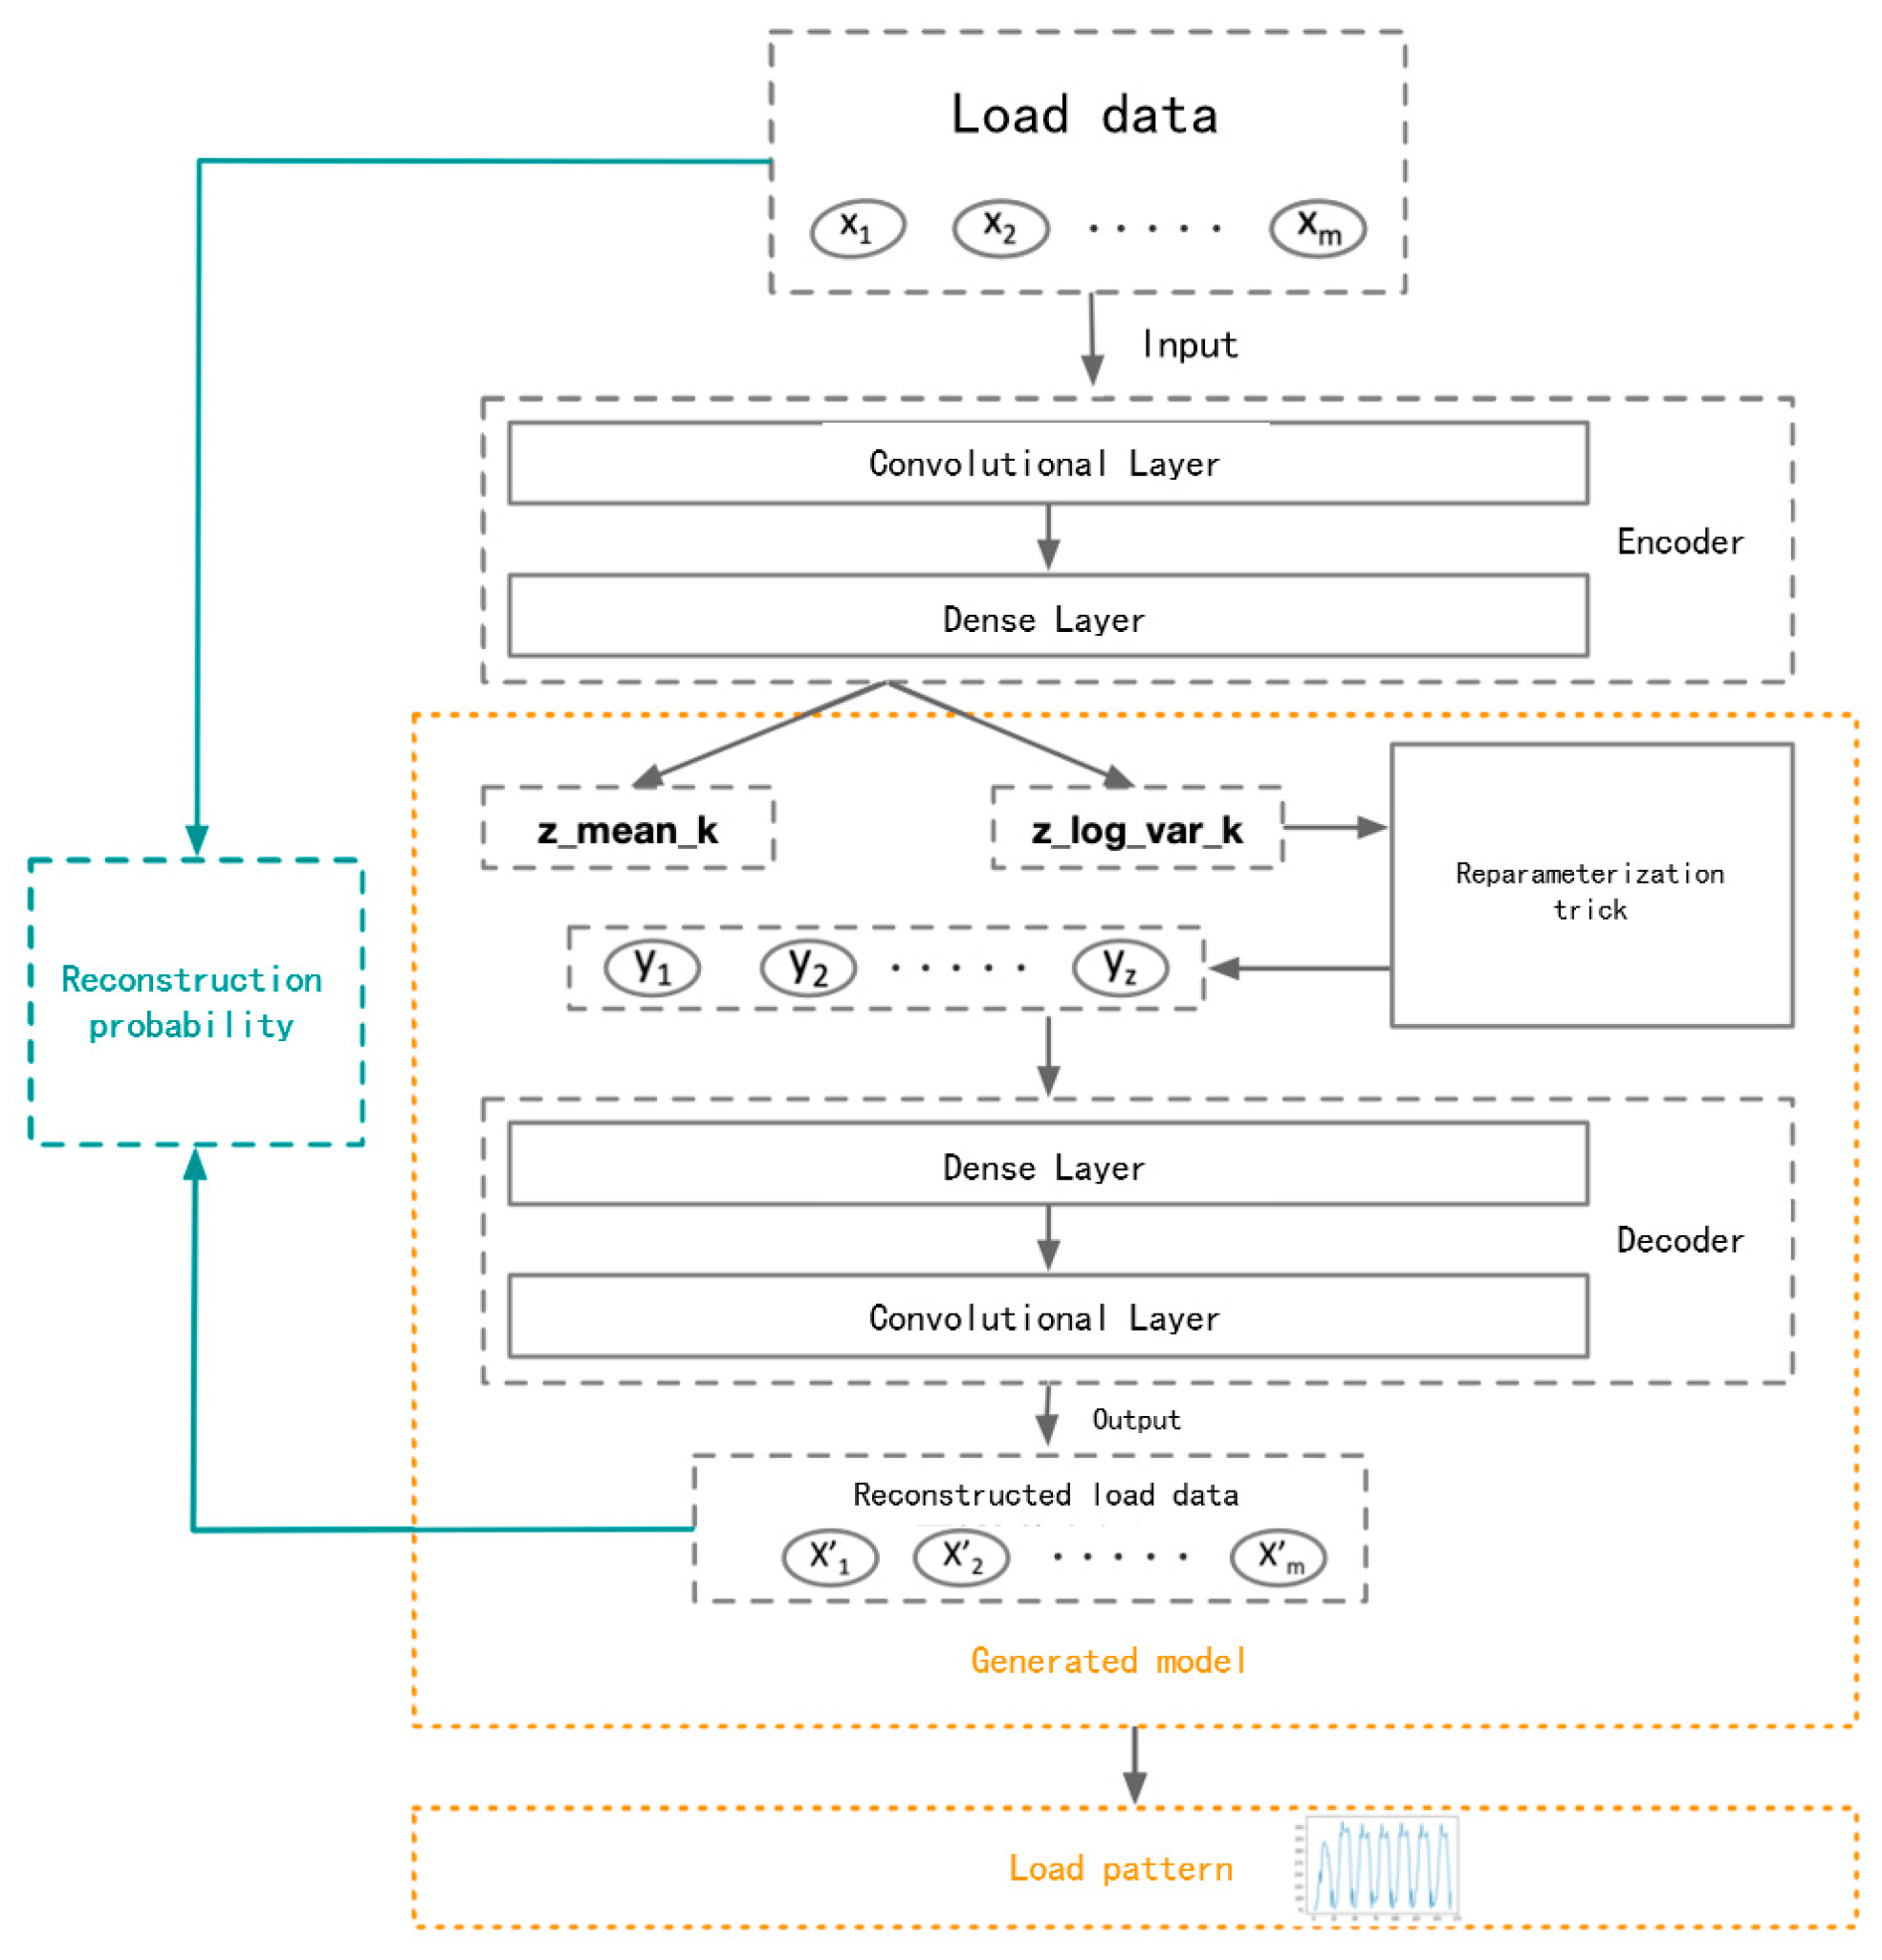
Thus, the overall network structure of the deep variational autoencoder (VAE) proposed in this paper is shown in Figure 4, and a convolutional layer is added to the encoder and decoder, respectively. The dense layer is set to two fully connected layers. The reparameterization trick [28] in the structure is a skill used to implement the model. Because the non-differentiability of the sampling operation will make the neural network parameters impossible to train, it is necessary to convert sampling Z from N ( μ , δ 2 ) to sampling ε from N ( 0 , 1 ) and to change the parameter by Z = μ + ε δ . This trick makes prevents the sampling operation from participating in the gradient descent, enabling the whole model to be trained.
Figure 5 clearly shows that the training objectives of the encoder are the mean and the variance, and the sampling of z and the decoder jointly form the generative model for the mining of the load pattern. Existing autoencoder-based anomaly detection is generally achieved via the semi-supervised learning method, namely directly using the reconstruction error as an anomaly score. Autoencoders can be trained using only normal data, and the model exhibits poor robustness. Therefore, the load analysis framework in this paper, based on DVAE, uses reconstruction probability (RP) for anomaly detection.
R P x i = 1 L l = 1 L p θ x i μ x ^ i , l , δ x ^ i , l
For the sample x i to be detected, the trained model will produce the mean μ z i and the variance δ z i by x i . Then get one sample under the distribution of the mean and the variance to reconstruct x ^ i , encode it into μ x ^ i , l ,   δ x ^ i , l , and use them to compute the reconstruction probability. The reconstruction probability is calculated using Formula (4). Therefore, datapoints with low reconstruction probability are more likely to become anomalies, which are more reasonable and probabilistically easier to understand for anomaly detection than the datapoints obtained using the numerical type threshold of the reconstruction error. In other words, a threshold α needs to be set, and reconstruction probabilities below the threshold will be preliminarily judged as anomalous electricity behavior.
In addition to the reconstruction probabilities, two extra anomaly parameters are proposed in this subsection. The reconstruction probabilities focus more on the shape and load trends of the load curve. One is the Pearson correlation coefficient of the input and the reconstructed output of the trained DVAE model used to measure the correlation of the input and output in the range of −1 and 1.
ρ X , Y = c o v X , Y σ X σ Y = E X μ X Y μ Y σ X σ Y
Another anomaly score is obtained using the size of the electric power, removing the magnitude effect, since the model initially standardized the load data. Therefore, in addition to focusing on the shape of the load data, attention should also be paid to the level of power consumption as an additional reference for the analysis.
X ¯ = 1 n i = 1 n x i = x 1 + x 2 + + x n n
The three indicators introduced above calculate anomaly scores in regards to the power consumption trend and the power consumption level, respectively. The anomaly detection is mainly based on the reconstruction probability and correlation coefficient, while the load average can be used as a reference for anomaly detection. In general, anomalous electricity behavior was detected by these three indicators. The specific process of the anomaly detection algorithm is shown in Algorithm 1.
Algorithm 1: The anomalous power consumption behavior detection algorithm based on DVAE
Input:
Trained model M o d e l D V A E = { M e n c o d e r ,   M d e c o d e r }
Dataset to be tested x i ,     i = 1 , , N
Threshold α
Output: The result of the anomalous power consumption behavior detection.
1:    for  i 1  to  N  do
2:         p = r e c o n s t r u c t i o n   p r o b a b i l i t y x i
3:        if  p < α  then
4:                 x i is identified as anomalous
5:        else
6:                Get the reconstruction result  x ^ i
7:                Calculate the correlation coefficient  ρ x i , x ^ i  and the mean load  x i ¯
8:                    if  ρ x i , x ^ i  is too low or  x i ¯  is anomalous then
9:                             x i  is identified as anomalous
10:                else
11:                         x i  is identified as normal
12:                end if
13:        end if
14:    end for
Returns: The result of the anomalous power consumption behavior detection.
When the training is complete, the sampling and decoder can generate the power pattern as the generative model, as shown in Figure 5. Since the training objectives of DVAE include maintaining the distribution of the hidden variable Z values up to N ( 0 , 1 ) , load pattern curves can be generated directly through the decoder, and multiple possible curves can be generated through quantitative random sampling.

4.3. Sliding Window Adaption

The deep variational autoencoder (DVAE) can explore the input load data for the electricity pattern, as well as for anomaly detection and analysis. However, in the fine-grained analysis scenario, the load data is growing with passing time. And the load patterns of industrial and commercial users may also change smoothly over time.
Therefore, to achieve complete unsupervised learning, when inputting the training data, the previous electricity data is input into the model, including its normal and anomalous patterns. When the positive and negative samples are unbalanced, the model can achieve good experimental results. Because electricity habits vary by season or due to various factors, the original model trained over time is no longer suitable for the subsequent changing electricity patterns (due to different pattern distributions, new data will continue to be identified as anomalies over a period of time), and the model needs to be updated according to the sliding window to modify the learning ability of the model and achieve adaptive adjustment.
The input data format is the m-point daily load data X = x 1 , x 2 , , x m , with the mining data collection S t = X 1 , X 2 , X d . The research goal of this paper is to complete the update of the judgment model and the typical power consumption curve when the power consumption pattern changes with time t, i.e., the framework enhances the dynamic adaptability of the model proposed in this paper.
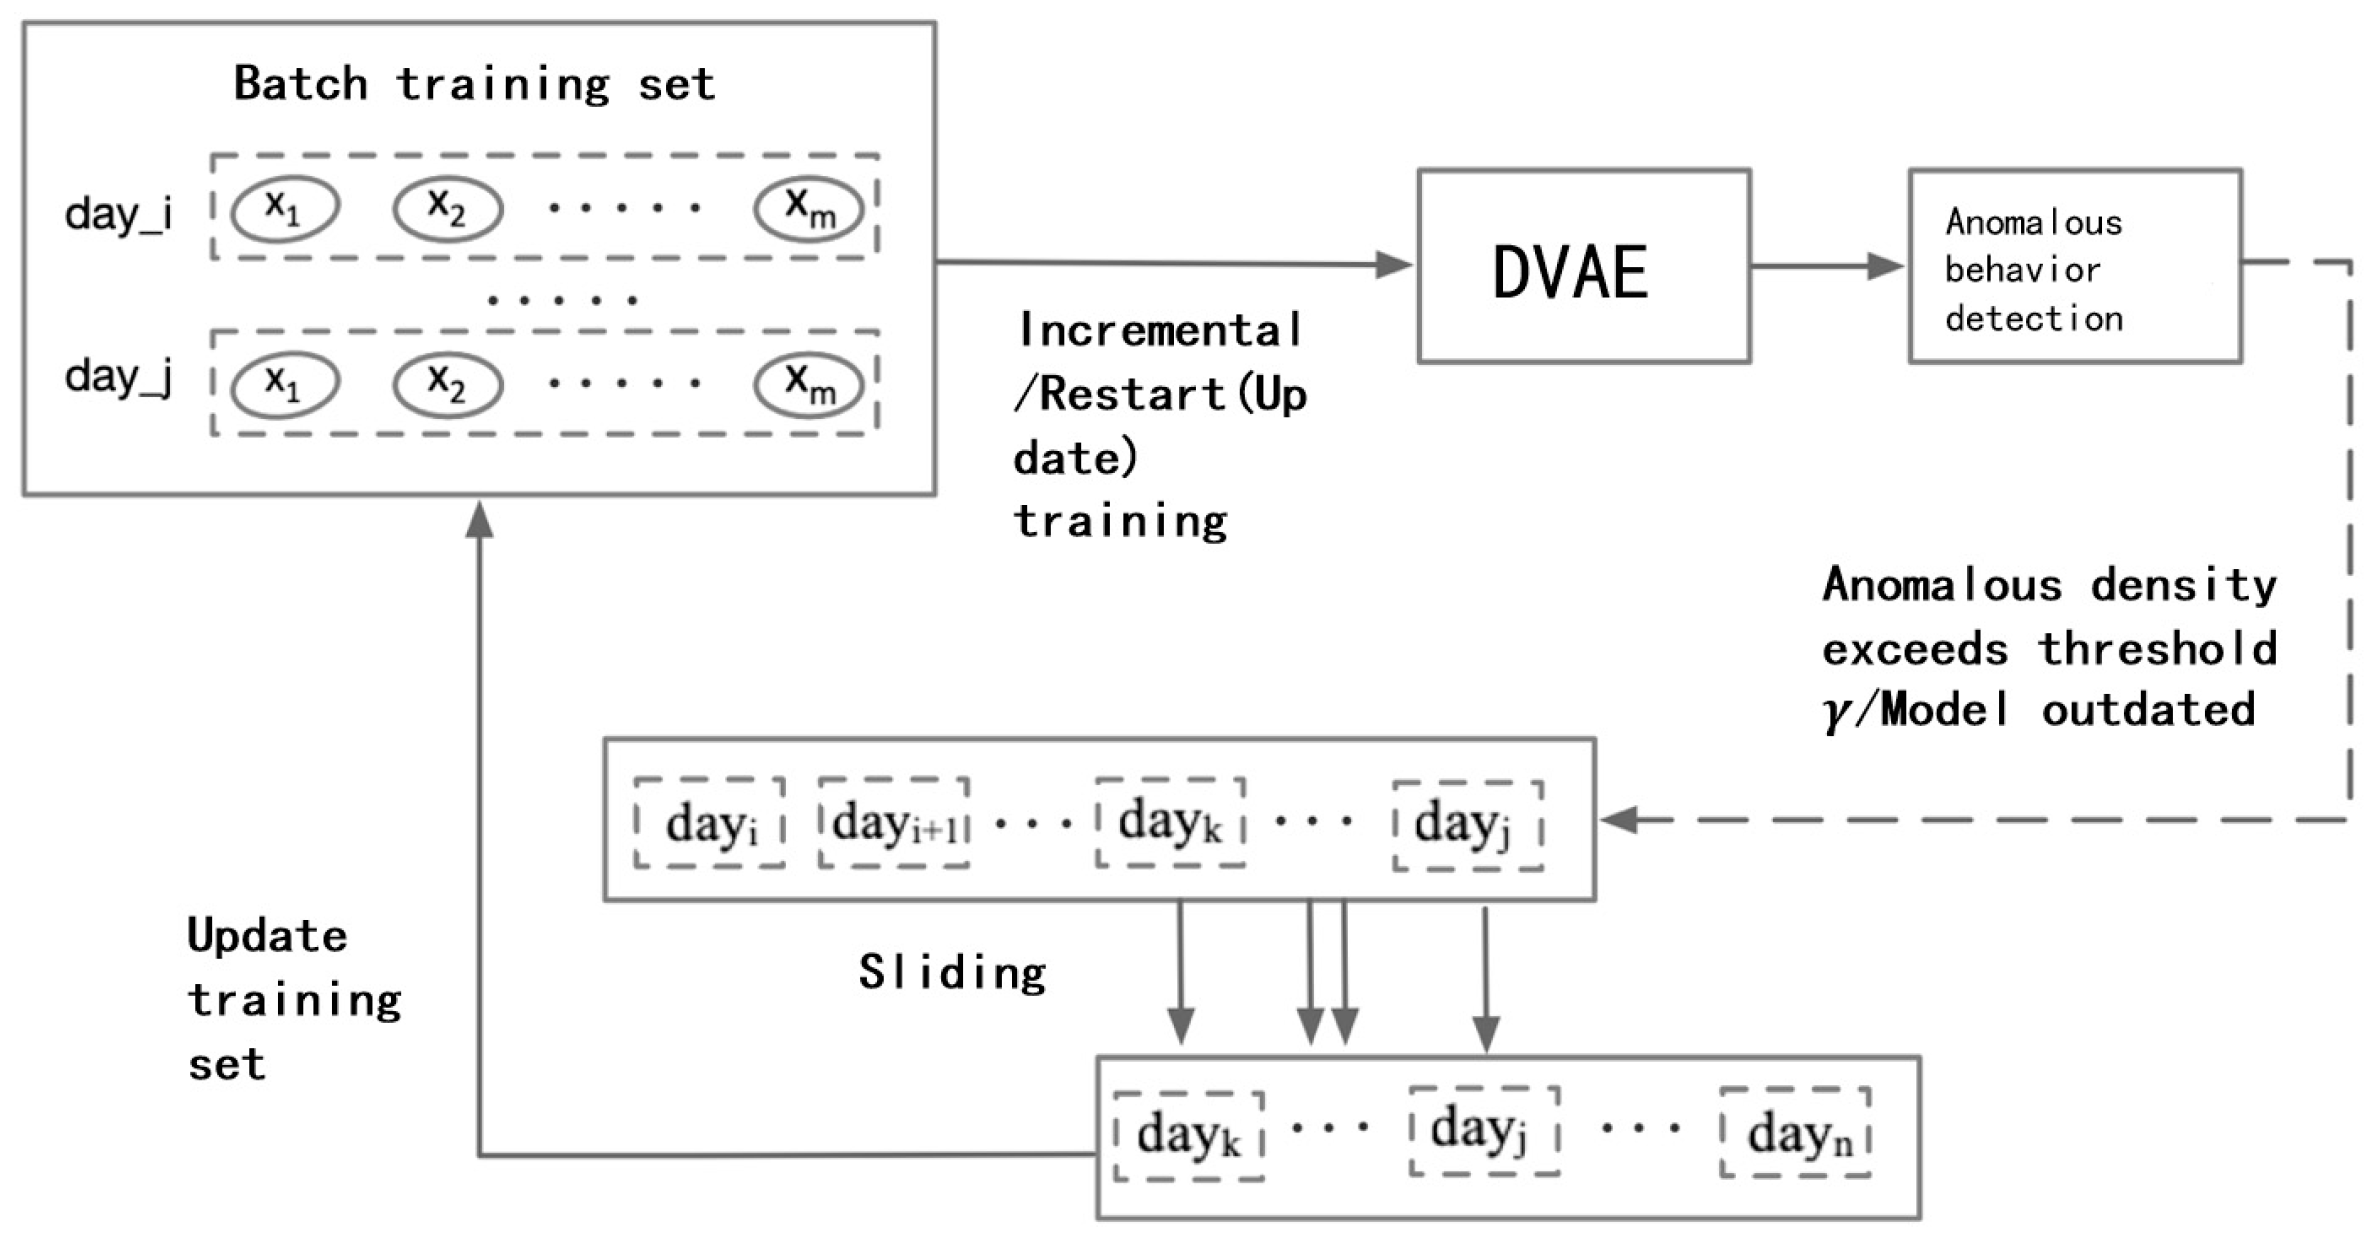
The whole sliding window adaptive process is shown in Figure 6 below. In the case of studying daily load data, the initial input to deep variational autoencoder is a batch of daily load data from d a y i to d a y j , generating the trained model D V A E i , j . When testing data for anomalous electricity behavior detection, the conditions for window sliding need to be considered from two aspects: anomalies accumulation and timeliness. The continuously trained model D V A E i , j will calculate and identify the anomalous score, but when the subsequent incremental test load data is constantly judged as anomalous, and the density exceeds γ , or the model is used for more than one month, the window will be slid.
When the frame collects the window sliding signal, the training set updates the depth of the autoencoder input data through k-value sliding. It resumes the training generation model D V A E k , n to form a closed loop for the dynamic update of the model to solve the problem of the dynamic change in the power pattern.

5. Experiment and Performance Evaluation

5.1. China Load Dataset Experiment

5.1.1. Dataset

This subsection is based on the industrial and commercial power load data from Southeast China, including the 96-point daily load dataset of three industries in 2014. The experimental dataset specificity is shown in Table 1, containing 96-point daily load data for 1379 users in one year, along with the relative number of known anomalous electricity behavior markers. In addition, this paper aims to conduct fine-grained electricity behavior analysis. Thus, the daily load data within a single industry is used for experimental analysis, including the generation of typical daily electricity behavior patterns in each industry and the detection of the behavior of anomalous electricity in each industry.

5.1.2. Experiment Results

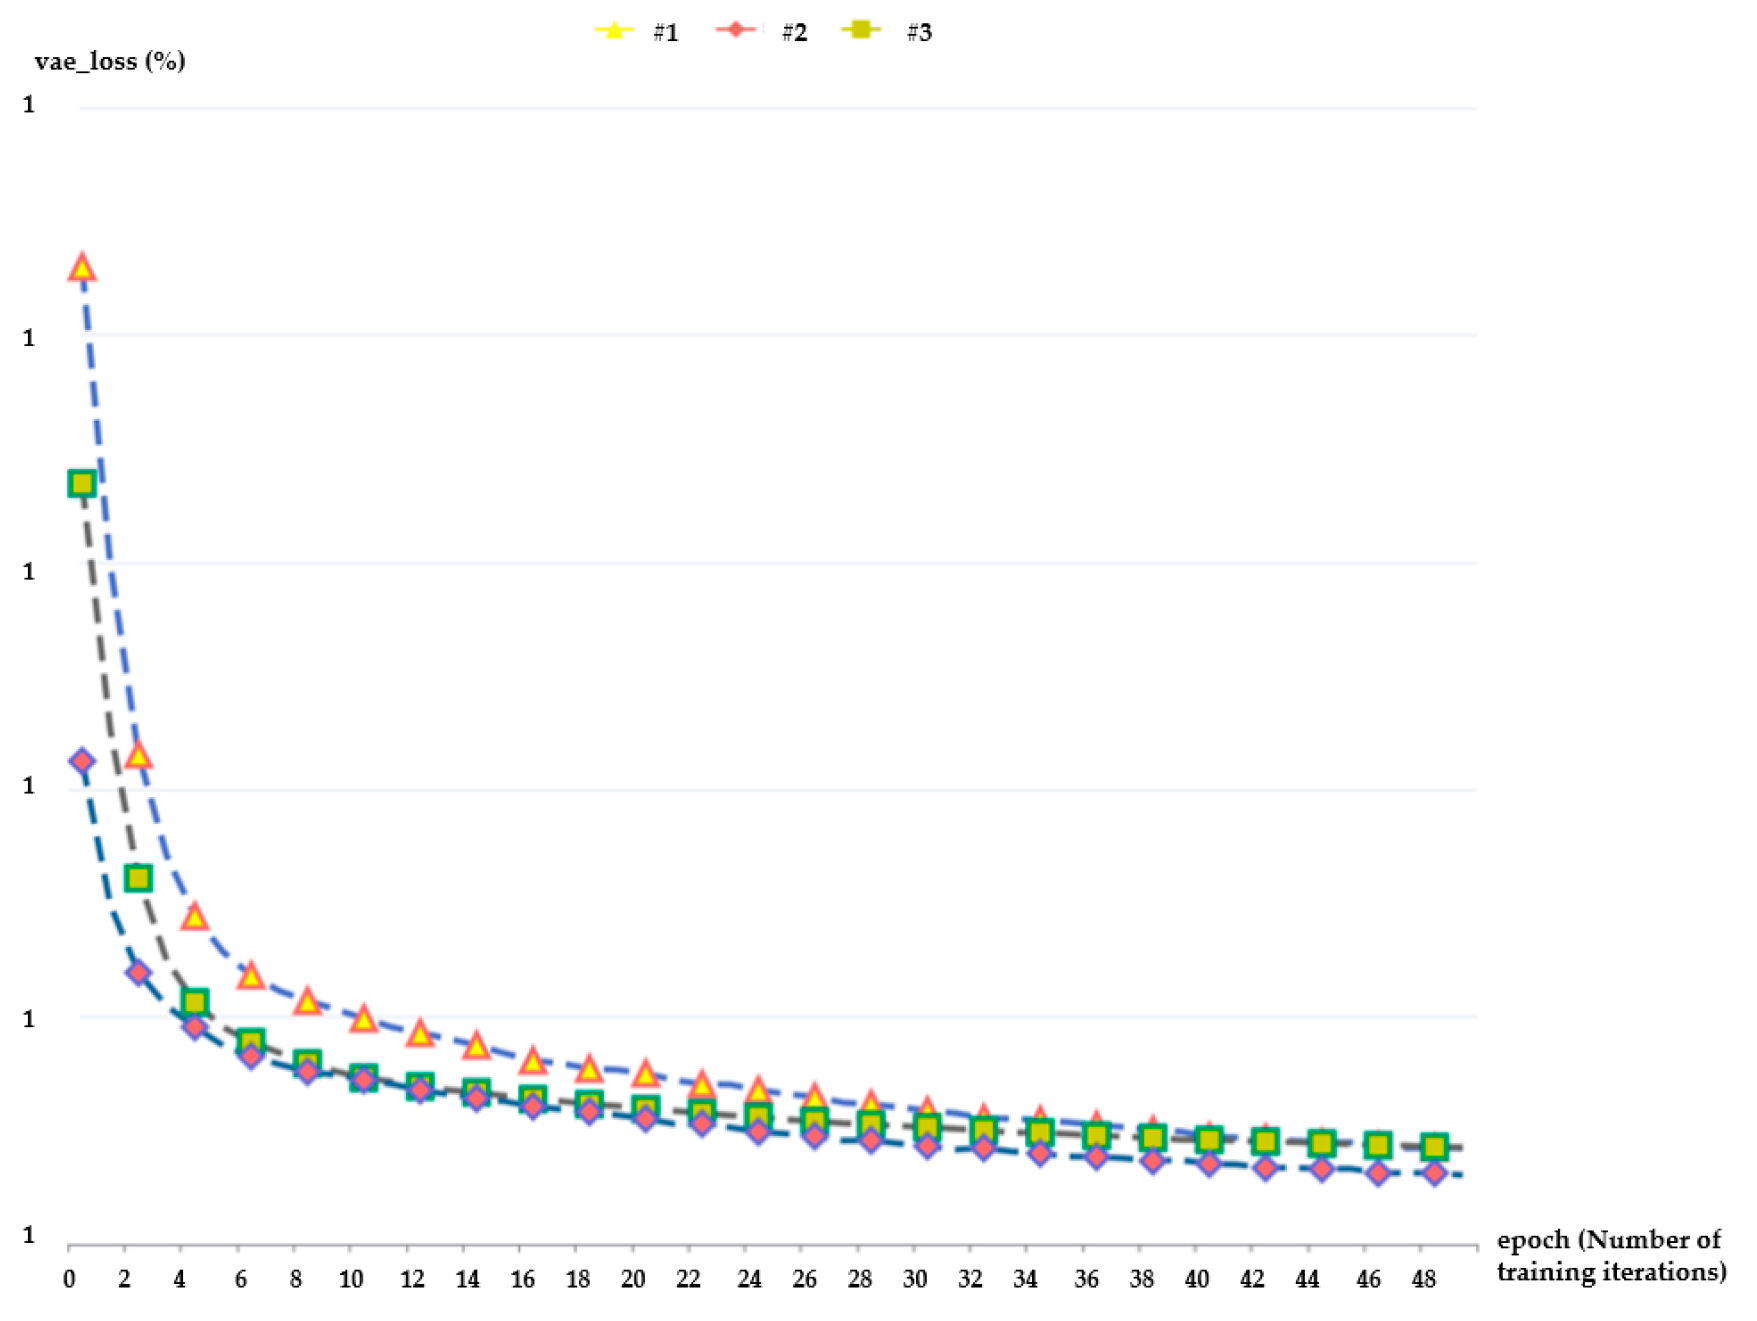
First, the DVAE model training was conducted within the dataset of each industry, starting with the normal daily load data of the first ten months for the initial DVAE model training and the daily load data of the last two months for the test set. Excluding technical acquisition errors (full zero and null errors), the training set includes 133,609 training samples for Industry #1, 106,571 for Industry #2, and 126,780 for Industry #3. The training parameters including bacth_size=10,000, epoch=50, and the vae_loss during the DVAE model training for Industry #1, Industry #2, and Industry #3 are shown in Figure 7 below.
Then, based on the assumption that DVAE works, the decoder module can map the points of the latent hidden space back to the original input, the encoder learns the mean and variance of the latent space, and the prior distribution of the latent space is Gaussian. Thus, the trained Industry# 1 decoder was first transformed and sampled with 20 points from linearly separated coordinates in the underlying normal distribution. The resulting generated samples obtained are shown in Figure 8. The grid of sampling results shows the complete continuous distribution pattern of different loads. When observed along the path of hidden vector distribution, it can be observed that it gradually changes from one load pattern to another. For example, the change in the power consumption pattern in the first row can be briefly described as the frequent power consumption interval changes from [7:30,21:00] to [7:00,12:00] ∪ [18:30,23:59].
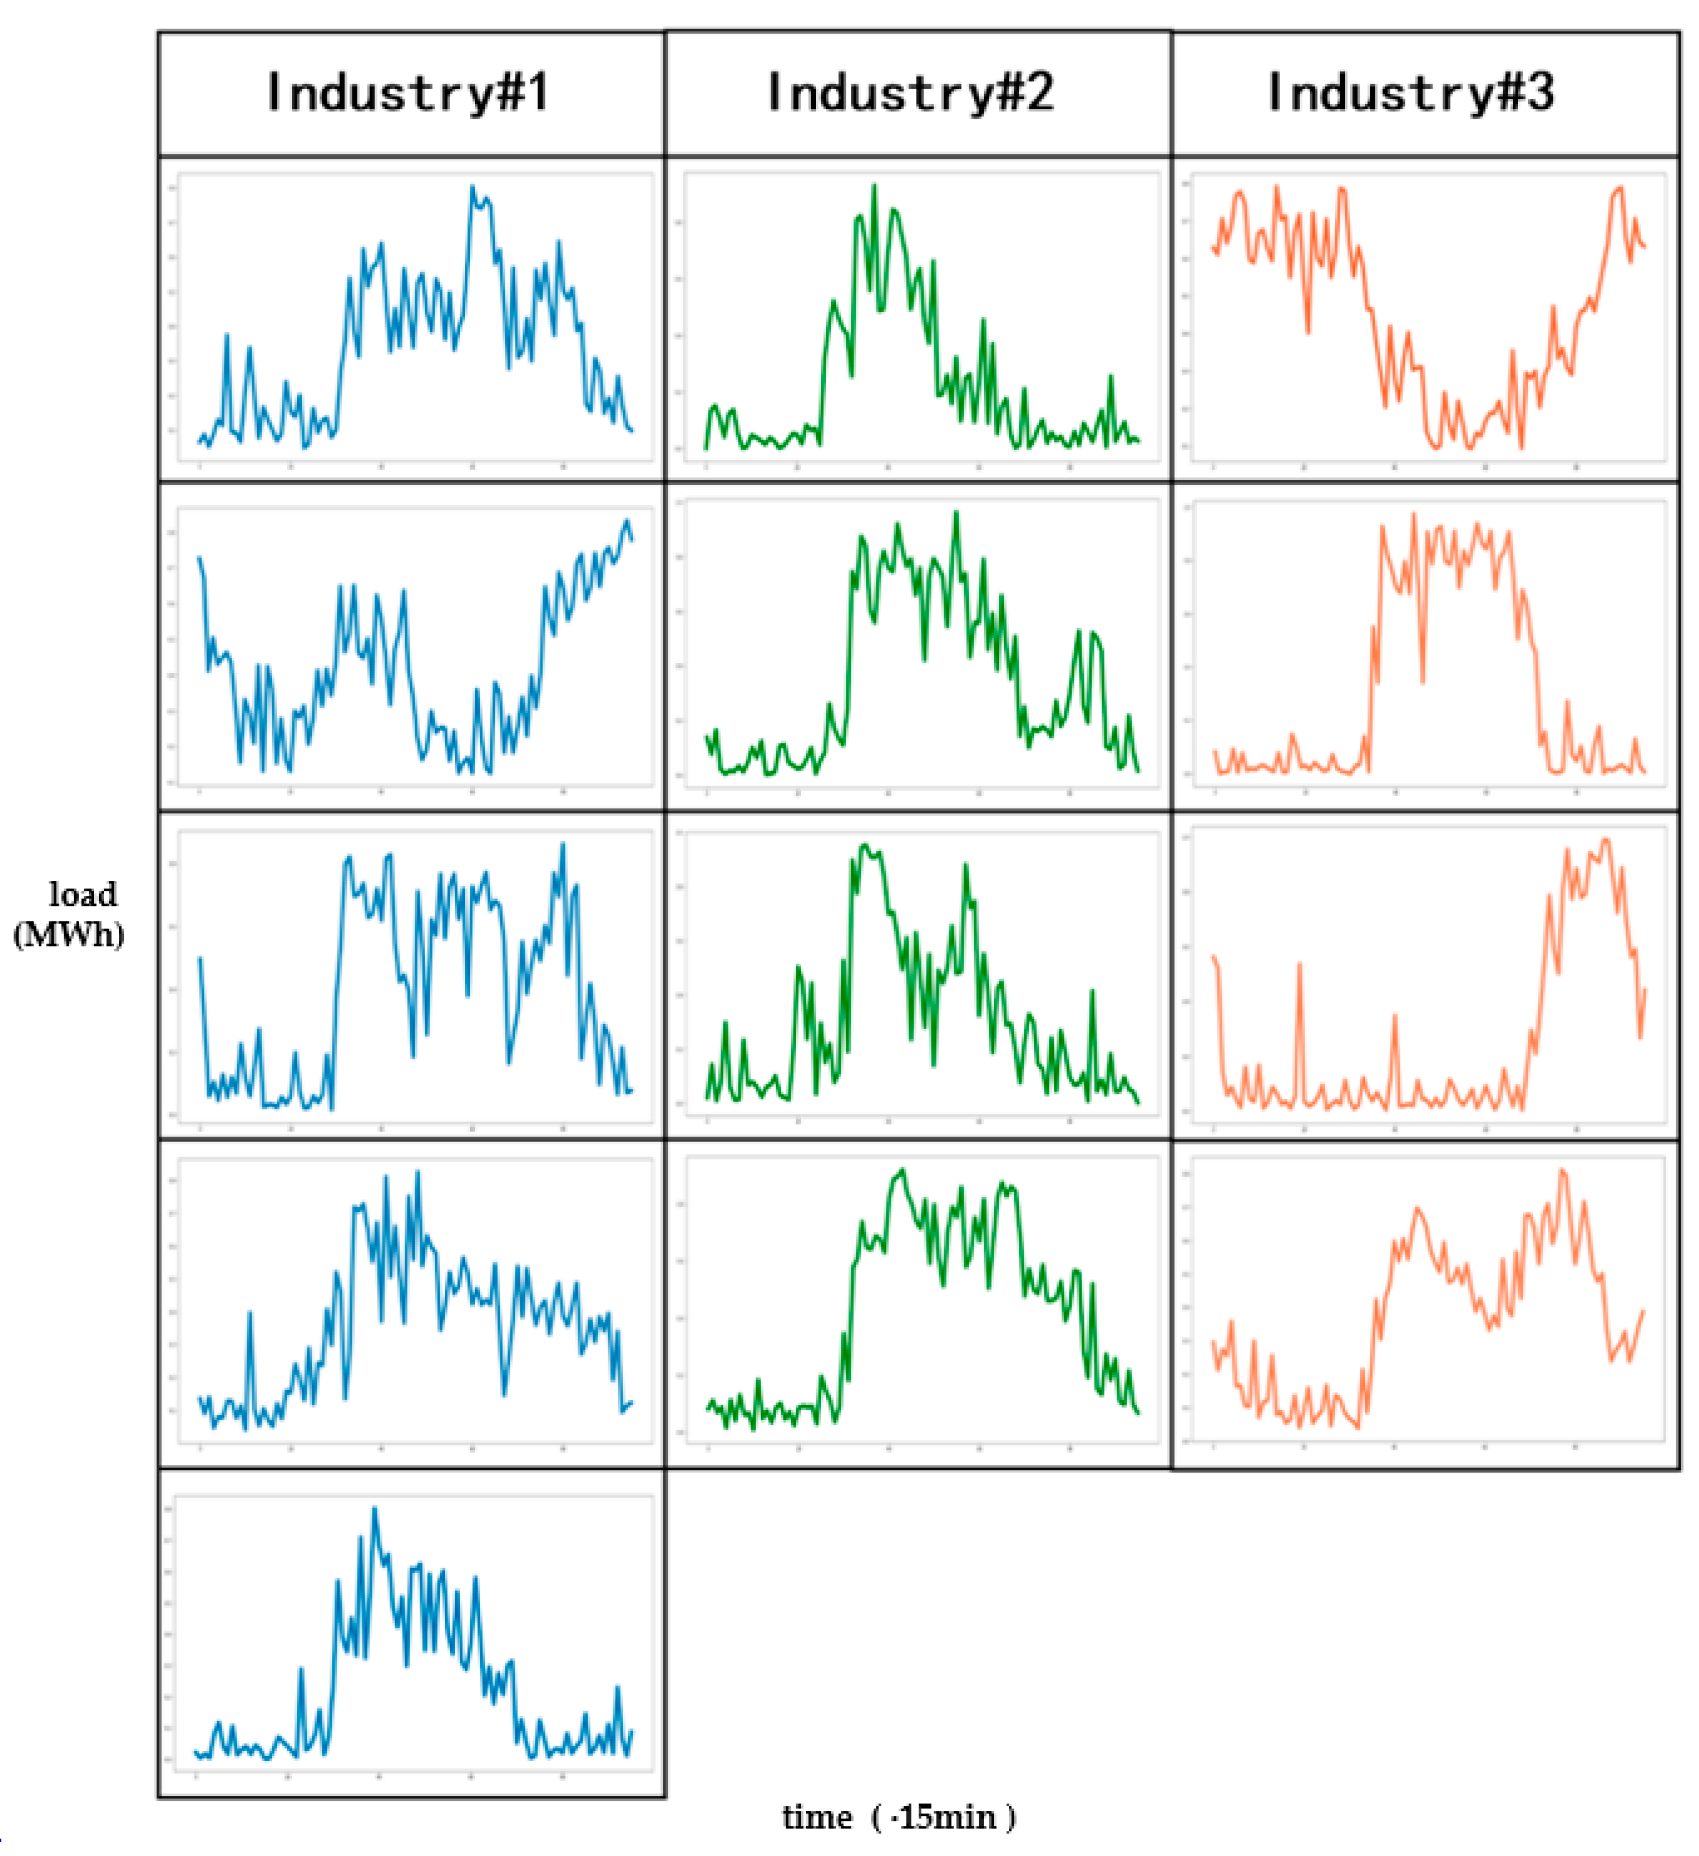
Therefore, typical load curves for Industry #1, #2, and #3, obtained based on the above training and linear interval sampling and similarity analysis, are shown in Figure 9.
The work and rest periods of Industry #1 enterprises mainly start production from 7:00–8:00. Employees leave work after 21:00 (there is also a distinct pattern after 18:00), including new shifts beginning at 12:00 and 18:00. Second, there is another production model for the early and night shifts, with peak consumption from 5:00 to 12:00 and 18:00 to 1:00 the next day. From the perspective of load pattern, the production task of the industry is heavy, generally requiring night shift production, the daily high load working time is long, and night shifts cannot be ruled due to holidays and other factors.
The behavior characteristics of Industry #2 include the occurrence of the peak power consumption stage mainly during the day. Generally, the low power consumption period caused by rest is present around 12:00, and the power consumption ends after 18:00. Moreover, there is also a pattern of maintaining small peaks of electricity at night, falling to a trough at around 22:00. The load pattern reflects the regular load use of the industry. The work and rest are in line with the general working hours, are in the high load pattern during the day, and with no electricity use or a small peak pattern at night, i.e., limited overtime work is not ruled out.
Most enterprises in Industry #3 use a large amount of electricity at night, including a double peak pattern at 00:00–12:00 and 18:00–23:59, a single night peak pattern from 18:00–23:59, and a slightly normal daytime high load pattern at 9:00–19:00, with significant rest gaps at 12:00 and 15:00, respectively. The overall load time of the industry is relatively backward, and the main active period of electricity consumption is at night.
Next, the load data from the test set are calculated to identify the anomalous power behavior. First, the test was conducted in the three industries of the experimental dataset. The goal of reconstruction probability in this experiment is to obtain the output mean and variance of multiple samples by sampling, subsequently taking the average probability of distribution using original data as the reconstruction probability, i.e., Monte Carlo estimation. However, for the convenience of display, one of the directly tested samples is selected to display the reconstructed load curve.
As shown in Figure 10, Figure 11 and Figure 12, the comparison of the sample reconstruction and original load curves of the experimental sample #A–#G, respectively, and the results of the three anomaly indicators calculated are shown in Table 2, including the reconstruction probability and Pearson correlation coefficients, as well as the load mean. From the index analysis, the reconstruction probability of the test samples #B, #E, and #G is much smaller than that of other samples, with both about 0.2 and 0.3, and the Pearson correlation coefficient index shows that the index of the three samples is also obviously low. Therefore, the test samples #B, #E, and #G can be identified as exhibiting anomalous power behavior according to the shape of the load pattern curve.
This result is also relatively obvious from the reconstruction curves, and the samples with anomalous electricity behavior cannot be well recovered. Further, from the auxiliary analysis of the load mean, the load mean of sample #A is much lower than the load pattern of the other samples in the same industry. Test sample #A can also be identified as exhibiting anomalous electricity behavior. Further detection of anomalous power behavior occurred in the whole test set, and the probability of normal sample reconstruction was around 0.65–0.75, so the anomaly identification threshold of reconstruction probability was set to 0.6, and results below 0.6 were initially identified as anomalous behavior. In cases with low reconstruction probability, a high Pearson correlation coefficient, or an anomalous load mean, further identification is needed. That is, the samples with a high Pearson correlation coefficient will reduce the anomaly identification threshold to 0.5, while the cases with an anomalous load mean can be directly identified as showing anomalous electricity behavior.
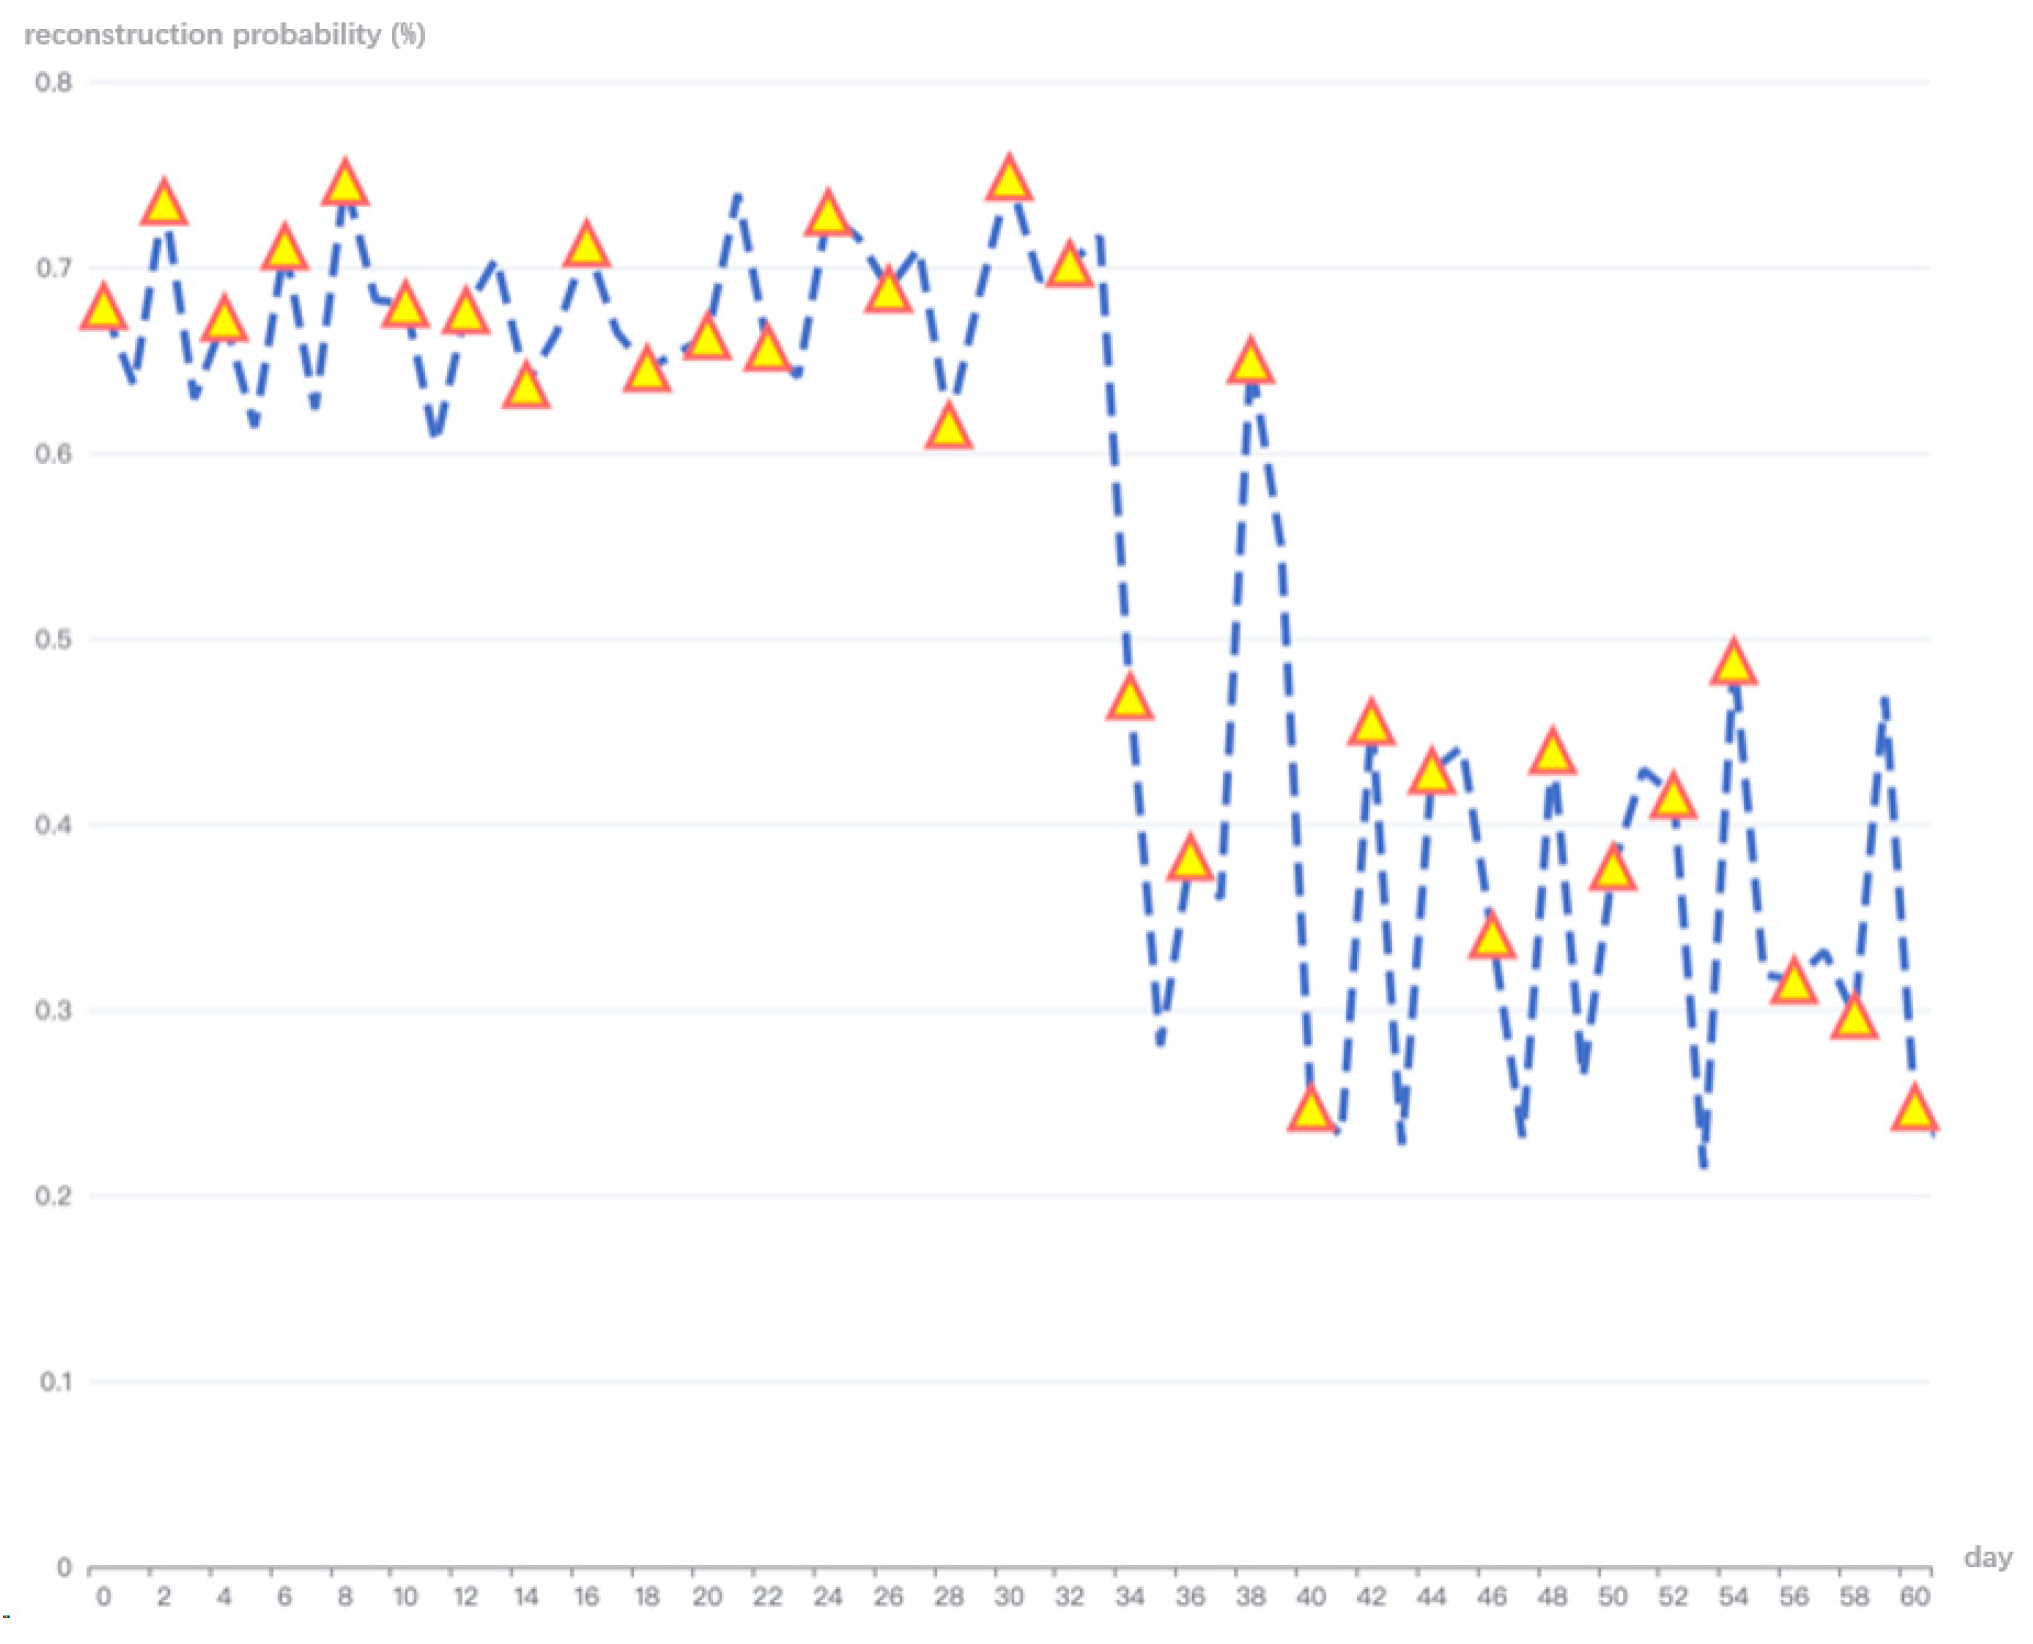
In the experiment, there are anomalous behavior detection results caused by electricity pattern conversion, according to the fine-grained analysis index analysis of industrial and commercial electricity users. The reconstruction probability index is shown in Figure 13 as follows, and the reconstruction probability of the last monthly load curve is below the anomaly threshold. Further, according to the load data of the pattern conversion, as shown in Figure 14, the production pattern of the industrial user has changed from the normal pattern of 7:00–18:00 working and rest at 12:00 to the working pattern of 15:00 to 5:00 the next day. To cope with heavy production tasks and to reduce costs, due to the fact that nighttime electricity prices are low, the factory will begin an afternoon production and night shift pattern, with the main production tasks arranged to occur at night. This anomaly recognition causes window sliding to accommodate the conversion of electricity patterns.

5.1.3. Comparison Experiment

Further, to demonstrate the effectiveness of the algorithm proposed in this paper, the deep variational autoencoder (DVAE) is compared with the anomaly detection results of the variational autoencoder (VAE) and the autoencoder (AE). First, the evaluation index of the anomaly identification results is introduced.
The AUC (area under the curve) is an evaluation standard for secondary classification models. Because its calculation method considers the classification effect of both positive and negative classes, it also has a more reasonable evaluation effect in the case of sample imbalance. In the binary classification, TP, FN, FP, and TN represent the number of samples correctly positive, correctly negative, falsely positive, and falsely negative in the test set, respectively. The AUC is usually calculated from the area of the area under the ROC (receiver operating characteristic) curve; the horizontal and vertical coordinates of the ROC curve are obtained using Equation (7) and Equation (8), respectively, and another evaluation index F 1 _ s c o r e is shown in Equation (9).
x : 1 S p e c i f i c i t y = F P F P + T N
y : S e n s i t i v e = T P T P + F N
  F 1 s c o r e = 2 p r e c i s i o n r e c a l l p r e c i s i o n + r e c a l l
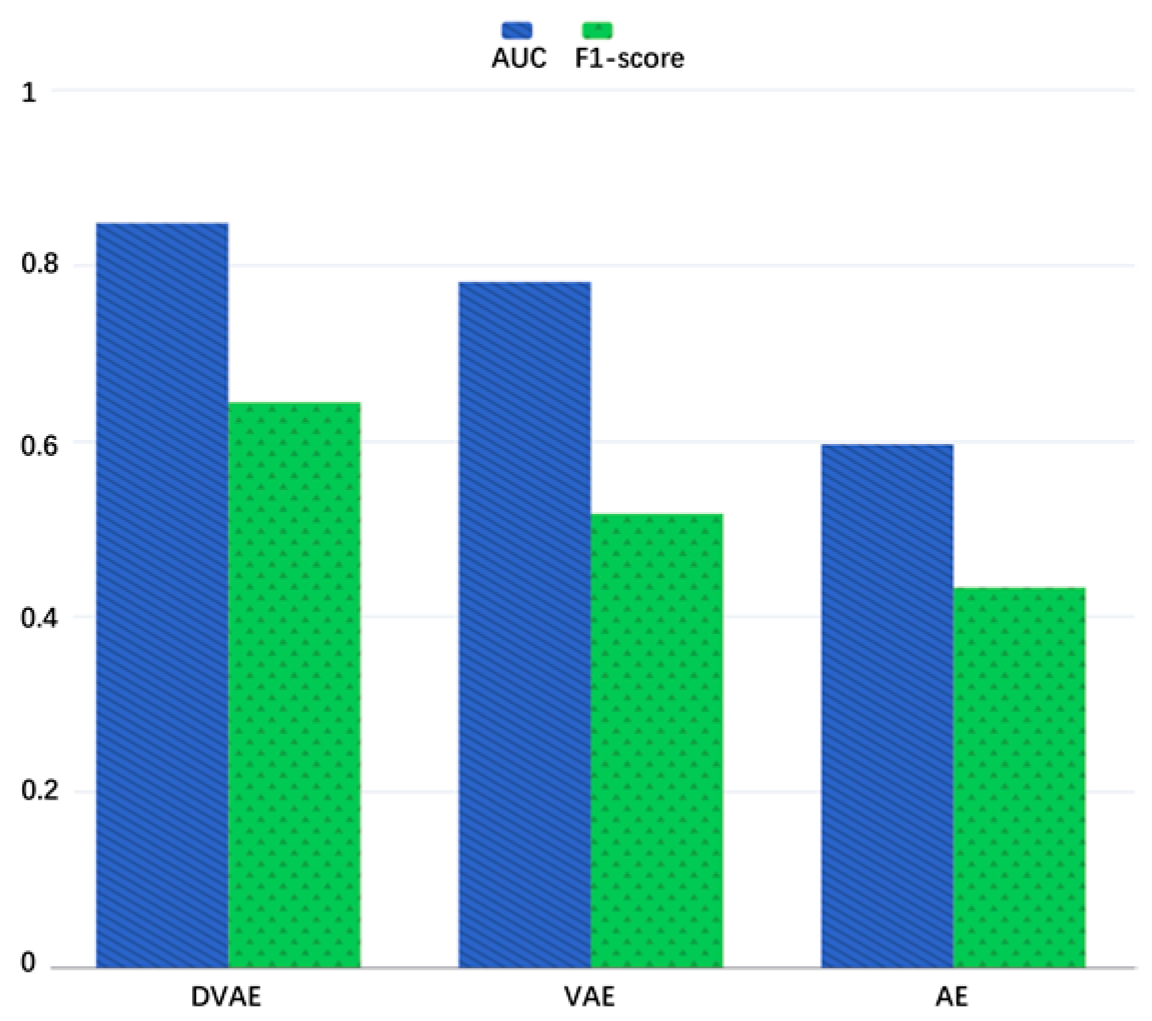
Therefore, the performance comparison index was selected from the binary classification AUC and F 1 _ s c o r e for comparison, and the experimental results are shown in Table 3 and Figure 15. As can be seen in the figure, the classification performance of the DVAE proposed in this paper is higher than that of the other two benchmark algorithms, which shows that the improved DVAE combines the principle of a convolutional layer and a variational autoencoder, and the method of identifying anomalous electricity behavior based on the reconstruction probability will effectively improve the detection effect of anomalous electricity behavior for industrial and commercial users.

5.2. US Load Dataset Experiment

5.2.1. Dataset

The U.S. Department of Energy (DOE) and three national laboratories have developed commercial reference buildings, previously known as the commercial building benchmark model. These 16 building types represent approximately 70% of commercial buildings in the United States. Across all climate zones in the United States, the 16 commercial building types include large offices, medium-sized offices, small offices, warehouses, independent retail, business districts, elementary schools, middle schools, supermarkets, fast service restaurants, full-service restaurants, hospitals, outpatient clinics, small hotels, large hotels, and mid-level apartments.
To verify the algorithm’s effectiveness based on deep variational autoencoder (DVAE) load pattern excavation and anomalous electricity behavior detection proposed in this paper, this study collects the 24-point daily load data for customers in 2004 for the experiments. Geographically, the dataset covers all states in the United States. The users were ultimately selected from the sampled data. The user data retains the original label, namely one of the level 16 commercial reference building classifications assigned by the U.S. Department of Energy according to its function and scale, as the industry label for industrial and commercial electricity for the fine-grained electricity behavior modeling analysis of industrial and commercial electricity.

5.2.2. Experiment Results

The experimental dataset in this section is based on the U.S. annual 24-point daily load data from 2004, with less relative dimension information, so this section aims to analyze the industrial and commercial user weekly load pattern (168 dimensions). The dataset contains 800 users, with 52 weeks of weekly load data for DVAE training experiments on the weekly load data of 16 class label users, with 60% used as a training set and 40% as a test set for anomaly detection.
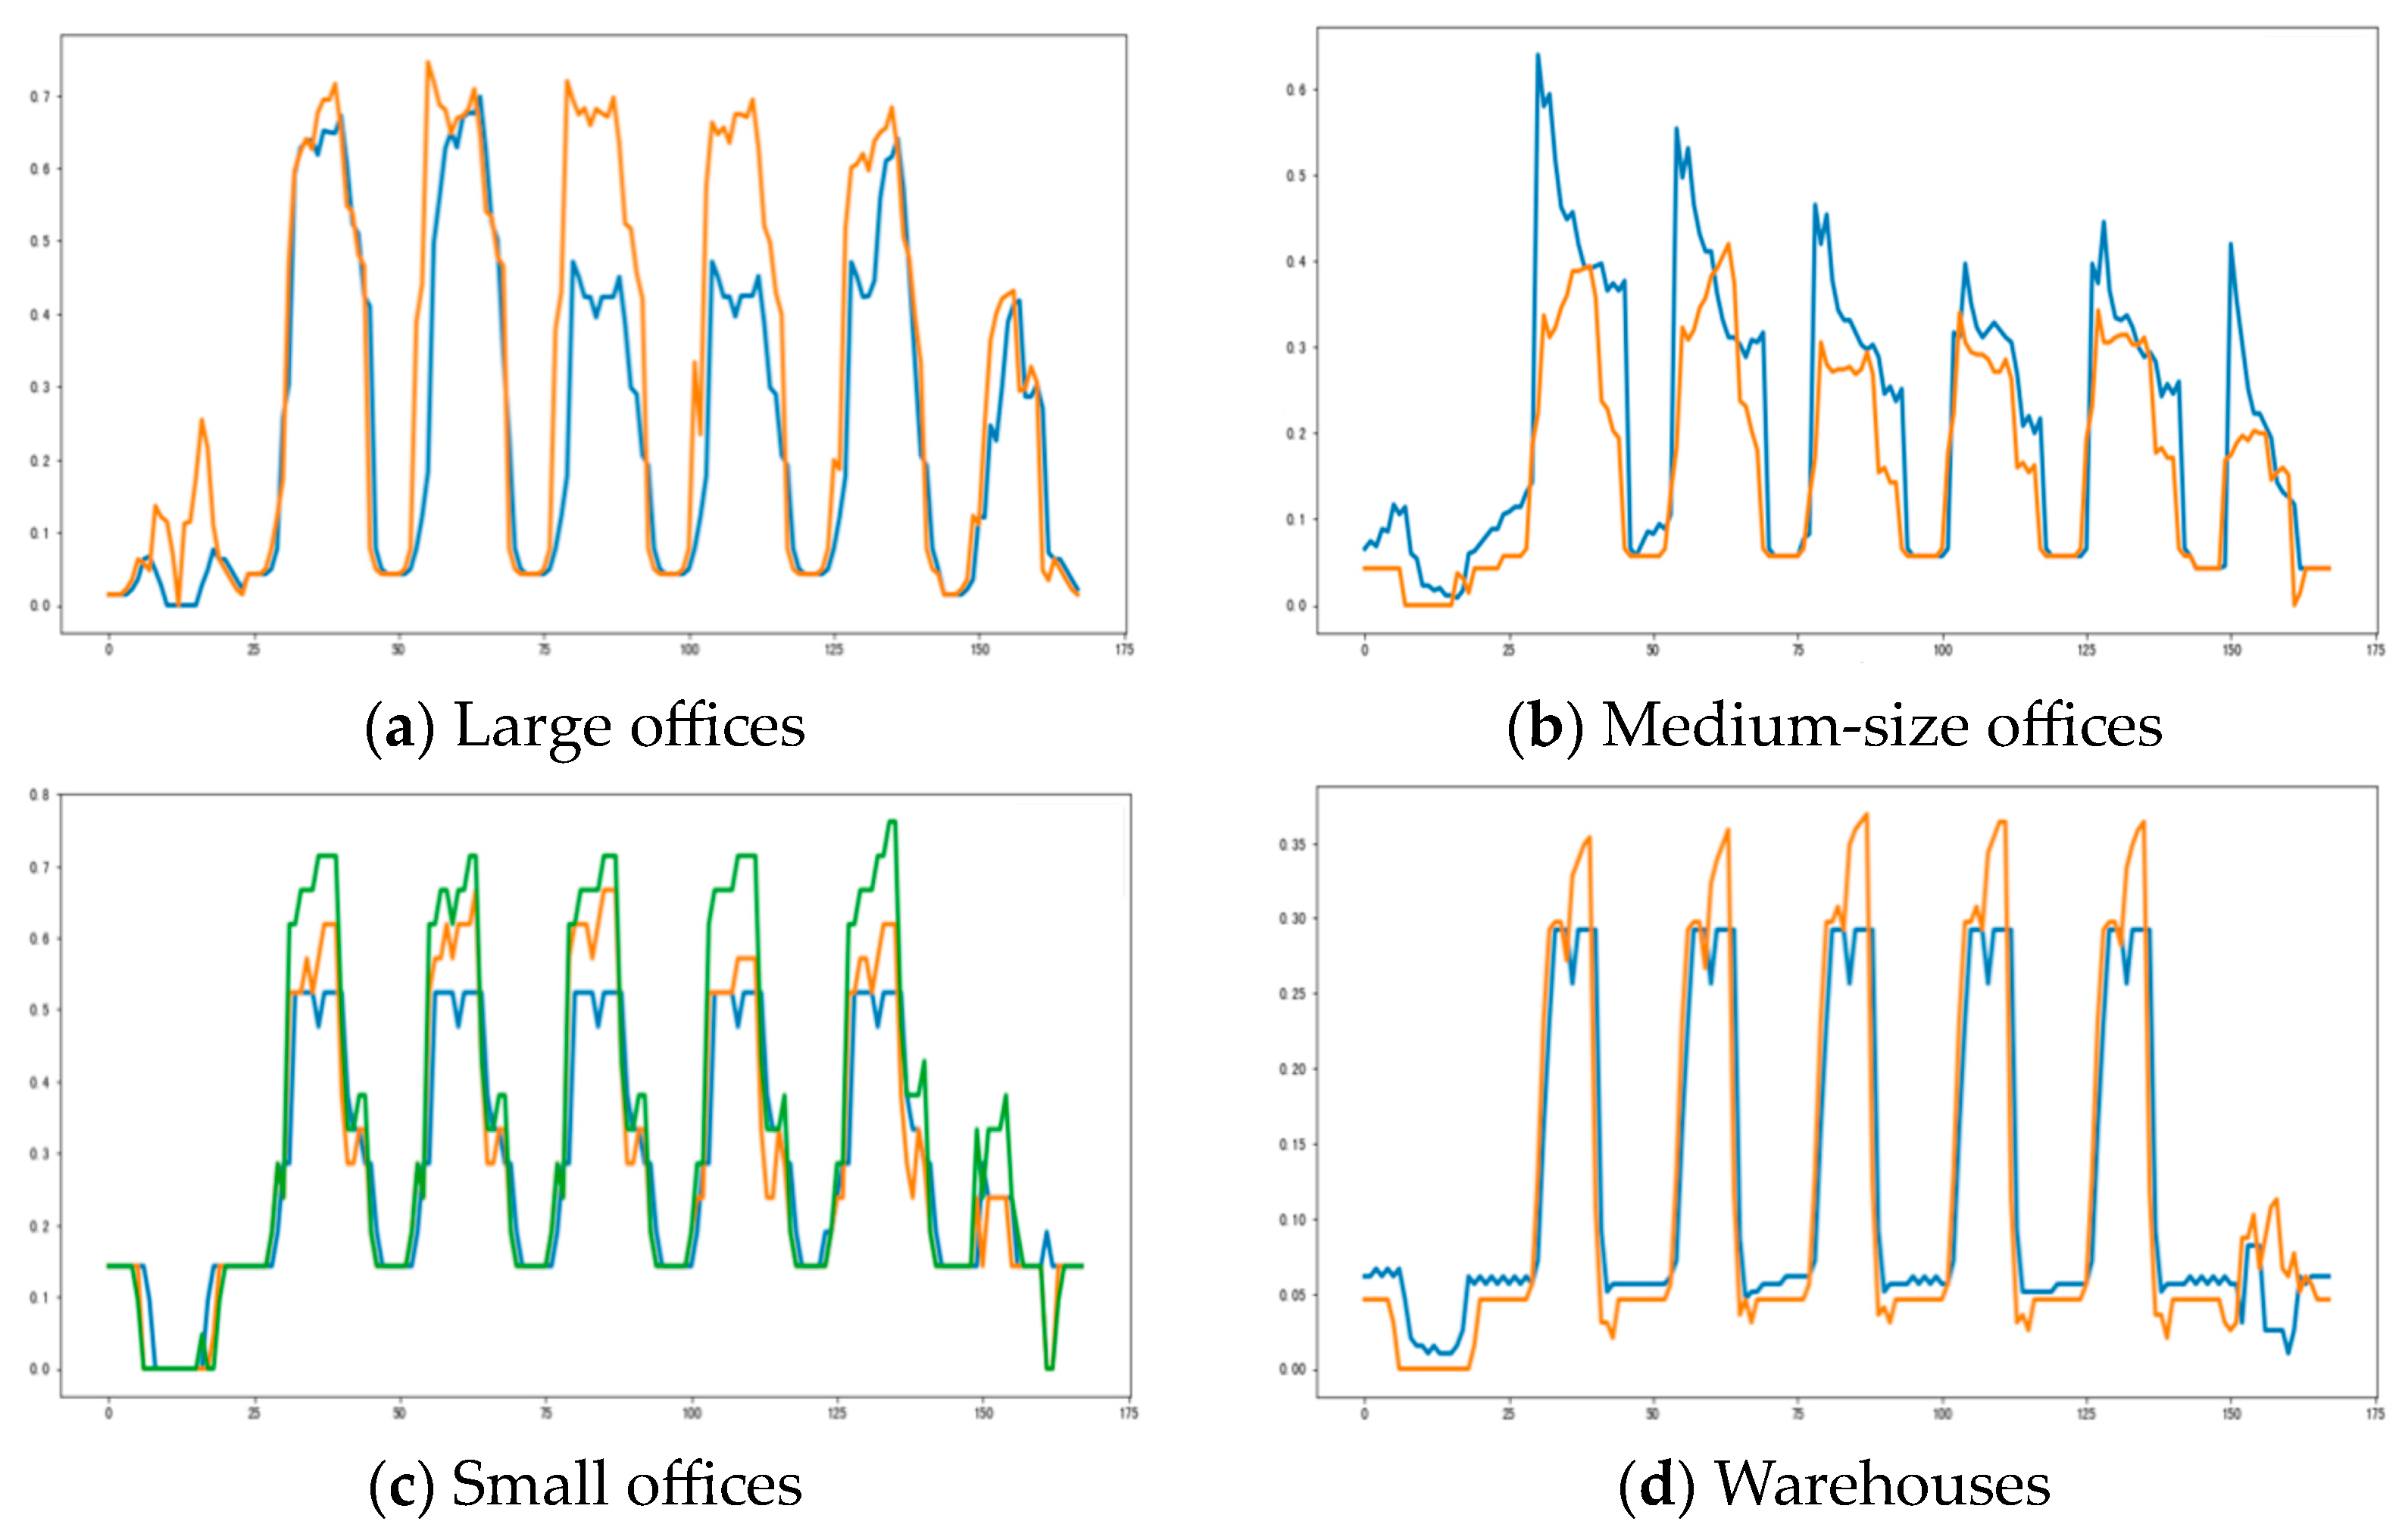
The typical weekly load modes of 16 power users were generated through the post-training model, as shown in Figure 16a–p below. First, the load pattern of large (a), medium (b), and small (c) offices all maintained the peak and low power consumption of 1 day. However, the basic shape of the pattern is similar, regardless of electricity consumption, but there is a weekly load pattern with a 12:00 daily preload significantly higher than that of the remaining time. The small office (c) weekly load pattern is more diverse, as is that for independent retail (e), the zone business district (f), and fast service restaurant (j), and the weekly load pattern is relatively fluid, likely due to the fact that these industry user types are small, with quick and convenient usage properties, while independent retail (e) and zone business districts (f) maintained more predictable patterns.
In addition, the primary schools (h), middle schools (i), and the warehouses (d) all have a high-power consumption on weekdays, among which the warehouses (d) have a fixed load pattern. The load pattern is more stable, and there is also a low energy consumption to ensure the basic warehouse operation on weekends. On the weekend, primary schools show no electricity consumption, and in middle schools, because of some practical activities and other reasons, there is a difference in electricity consumption on the weekends. Others, such as supermarkets (g), full-service restaurants (k), and mid-level apartments (p), basically show stable weekly load patterns. It can be found that both small hotels (n) and large hotels (o) had the same electricity behavior, which is consistent with customer rest and hotel occupancy behavior. The typical electricity consumption behavior of hospitals (l) and outpatient clinics (m) is the same.
Since there is no anomalous power behavior label in this dataset, the anomalous electricity behavior was detected directly according to the test set. Based on the experimental results, the overall reconstruction probability of the weekly load pattern was too high, so the reconstruction probability of 0.65 was used as the anomalous detection threshold. The overall anomaly detection results of the warehouses, business districts, and fast service restaurants are shown in Table 4. The anomalous proportion of the warehouse samples is the highest, while the anomalous ratio of fast service restaurants is the lowest.
Further, the two anomalous samples from the anomaly detection results are shown in Figure 17. First, the anomalous sample from by the warehouses results from the data from one working day, i.e., Labor Day in the United States. That is, the anomalous electricity consumption is due to special holidays, and most of the overall anomalous samples lead to anomalous test results due to statutory holidays or special days. The second anomalous business district result occurs due to anomalous low load detection results. According to the location information, the user is located in the coastal area, and the result may be due to extreme weather, such as the rainy season; thus, the business district exhibited an anomalous low load pattern, possibly due to climate factors, but a special event cannot be ruled out as the reason for this result. Therefore, the relevant power departments can prepare for possible anomalous changes according to special festivals and climate characteristics to avoid failure or overload.

5.3. Benefits to the Grid and Users

One of the primary important tasks of smart grids is to construct flexible interactions for smart electricity use, guiding users to change their traditional electricity usage habits. This requires the bidirectional exchange of information and data on the basis of a smart infrastructure to encourage user participation in grid operations. Therefore, demand-side management of smart grids, analyzing and reasonably regulating user electricity consumption behavior, is key to building smart grids. Effective operation of the demand side requires accurate prior knowledge of user electricity consumption behavior, which means that the model proposed in this paper can be applied to regulate the demand side of the grid. Analysis of user electricity consumption behavior can help power supply companies to efficiently and rationally plan and utilize electric power resources, thereby reasonably allocating these resources, ensuring the stable operation of the power system, and aid decision makers in formulating policy plans.
Based on the study of user electricity consumption behavior, the method of guiding user this behavior through demand response is gradually being introduced. This method adjusts factors affecting electricity consumption behavior, such as electricity prices, to regulate users’ electricity usage habits, thereby achieving control and management of user electricity load. On the one hand, through this regulatory method, peak shaving and valley filling, energy saving, and pressure reduction can be achieved, bringing higher environmental and economic benefits. On the other hand, users can also obtain more affordable electricity prices and a stable power supply, ultimately resulting in a win–win situation.

6. Conclusions and Future Work

To conduct electricity behavior modeling analysis of industrial and commercial users and to solve the two typical power behavior research problems of load pattern generation and anomalous electricity behavior detection, this paper proposes fine-grained electricity behavior modeling and an analysis algorithm based on a deep variational autoencoder (DVAE). The proposed algorithm improves the adaptive problem analysis scenario by learning from the variational autoencoder model. This paper introduces the convolution layer, the abnormal score, and a sliding window adaptive framework. Then, the model is applied to the industrial and commercial user load data, extracts the typical load pattern through the decoder generation model, and calculates the anomalous scores, such as the reconstruction probability for the anomalous electricity behavior detection. Compared to other methods, the proposed anomaly score incorporates reconstruction probability, the Pearson coefficient, and load mean, which can describe the load anomaly from different perspectives. Based on this, the anomaly detection method can better detect user electricity consumption anomalies and guide users to consume electricity scientifically and correctly.
In addition, a large number of experiments have been carried out using load datasets from America and Southeast China. By comparing the experimental results, it is confirmed that the improved anomaly score calculation and reconstruction probability significantly improve the effect of anomaly detection, making this technique superior to other benchmark methods.

Author Contributions

Conceptualization, S.C. and R.L.; methodology, R.L.; software, S.C. and Z.H.; validation, S.C.; formal analysis, S.C.; investigation, B.W., X.Z. and S.C.; resources, B.W., Q.L. and H.Z.; data curation, X.Z.; writing—original draft preparation, S.C.; writing—review and editing, S.C. and R.L.; visualization, S.C.; supervision, R.L.; project administration, R.L.; funding acquisition, R.L. All authors have read and agreed to the published version of the manuscript.

Funding

This research was funded by the Science and Technology Project of State Grid Corporation of China, grant number 5108-202218280A-2-380-XG (The project’s ERP system number is 520625220031), whose project title is “Research and Application of Hierarchical Precise Adjustment Technology for Industrial User Demand Response with Safety Constraints”.

Data Availability Statement

The data are contained within the article.

Conflicts of Interest

Authors Xin Zhao and Qiushuang Li were employed by the company State Grid Shandong Electric Power Company. The remaining authors declare that the research was conducted in the absence of any commercial or financial relationships that could be construed as a potential conflict of interest.

References

  1. Sobhani, M.; Hong, T.; Martin, C. Temperature anomaly detection for electric load forecasting. Int. J. Forecast. 2020, 36, 324–333. [Google Scholar] [CrossRef]
  2. Sun, M.; Zhang, J. Data-driven anomaly detection in modern power systems. In Security of Cyber-Physical Systems; Springer: Berlin/Heidelberg, Germany, 2020; pp. 131–143. [Google Scholar]
  3. Fahim, M.; Sillitti, A. An anomaly detection model for enhancing energy management in smart buildings. In Proceedings of the 2018 IEEE International Conference on Communications, Control, and Computing Technologies for Smart Grids (SmartGridComm), Aalborg, Denmark, 29–31 October 2018; pp. 1–6. [Google Scholar]
  4. Nakayama, K.; Sharma, R. Energy management systems with intelligent anomaly detection and prediction. In Proceedings of the 2017 Resilience Week (RWS), Wilmington, DE, USA, 18–22 September 2017; pp. 24–29. [Google Scholar]
  5. Capozzoli, A.; Piscitelli, M.S.; Brandi, S.; Grassi, D.; Chicco, G. Automated load pattern learning and anomaly detection for enhancing energy management in smart buildings. Energy 2018, 157, 336–352. [Google Scholar] [CrossRef]
  6. Liu, X.; Ding, Y.; Tang, H.; Xiao, F. A data mining-based framework for the identification of daily electricity usage patterns and anomaly detection in building electricity consumption data. Energy Build. 2021, 231, 110601. [Google Scholar] [CrossRef]
  7. Hosseinzadehtaher, M.; Khan, A.; Shadmand, M.B.; Abu-Rub, H. Anomaly detection in distribution power system based on a condition monitoring vector and ultra-short demand forecasting. In Proceedings of the 2020 IEEE CyberPELS (CyberPELS), Miami, FL, USA, 13 October 2020; pp. 1–6. [Google Scholar]
  8. Shah, G.; Tiwari, A. Anomaly detection in iiot: A case study using machine learning. In Proceedings of the ACM India Joint International Conference on Data Science and Management of Data, Goa, India, 11–13 January 2018; pp. 295–300. [Google Scholar]
  9. Yue, M.; Hong, T.; Wang, J. Descriptive analytics-based anomaly detection for cybersecure load forecasting. IEEE Trans. Smart Grid 2019, 10, 5964–5974. [Google Scholar] [CrossRef]
  10. Saraswat, D.; Bhattacharya, P.; Zuhair, M.; Verma, A.; Kumar, A. AnSMart: A SVM-based anomaly detection scheme via system profiling in Smart Grids. In Proceedings of the 2021 2nd International Conference on Intelligent Engineering and Management (ICIEM), London, UK, 28–30 April 2021; pp. 417–422. [Google Scholar]
  11. Lin, J.; Fernández, J.A.; Rayhana, R.; Zaji, A.; Zhang, R.; Herrera, O.E.; Liu, Z.; Mérida, W. Predictive analytics for building power demand: Day-ahead forecasting and anomaly prediction. Energy Build. 2022, 255, 111670. [Google Scholar] [CrossRef]
  12. Fenza, G.; Gallo, M.; Loia, V. Drift-aware methodology for anomaly detection in smart grid. IEEE Access 2019, 7, 9645–9657. [Google Scholar] [CrossRef]
  13. Zheng, R.; Gu, J.; Jin, Z.; Peng, H.; Zhu, Y. Load forecasting under data corruption based on anomaly detection and combined robust regression. Int. Trans. Electr. Energy Syst. 2020, 30, e12103. [Google Scholar] [CrossRef]
  14. Wang, L.; Turowski, M.; Zhang, M.; Riedel, T.; Beigl, M.; Mikut, R.; Hagenmeyer, V. Point and contextual anomaly detection in building load profiles of a university campus. In Proceedings of the 2020 IEEE PES Innovative Smart Grid Technologies Europe (ISGT-Europe), Hague, The Netherlands, 26–28 October 2020; pp. 11–15. [Google Scholar]
  15. Yue, M. Evaluation of a data analytic based anomaly detection method for load forecasting data. In Proceedings of the 2018 IEEE Power & Energy Society General Meeting (PESGM), Portland, OR, USA, 5–10 August 2018; pp. 1–5. [Google Scholar]
  16. Krawiec, P.; Junge, M.; Hesselbach, J. Comparison and Adaptation of Two Strategies for Anomaly Detection in Load Profiles Based on Methods from the Fields of Machine Learning and Statistics. Open J. Energy Effic. 2021, 10, 37–49. [Google Scholar] [CrossRef]
  17. Wang, X.; Ahn, S.-H. Real-time prediction and anomaly detection of electrical load in a residential community. Appl. Energy 2020, 259, 114145. [Google Scholar] [CrossRef]
  18. Rajabi, A.; Eskandari, M.; Ghadi, M.J.; Li, L.; Zhang, J.; Siano, P. A comparative study of clustering techniques for electrical load pattern segmentation. Renew. Sustain. Energy Rev. 2020, 120, 109628. [Google Scholar] [CrossRef]
  19. Ryu, S.; Choi, H.; Lee, H.; Kim, H. Convolutional autoencoder based feature extraction and clustering for customer load analysis. IEEE Trans. Power Syst. 2019, 35, 1048–1060. [Google Scholar] [CrossRef]
  20. Wang, Y.; Gan, D.; Sun, M.; Zhang, N.; Lu, Z.; Kang, C. Probabilistic individual load forecasting using pinball loss guided LSTM. Appl. Energy 2019, 235, 10–20. [Google Scholar] [CrossRef]
  21. Piscitelli, M.S.; Brandi, S.; Capozzoli, A. Recognition and classification of typical load profiles in buildings with non-intrusive learning approach. Appl. Energy 2019, 255, 113727. [Google Scholar] [CrossRef]
  22. Huang, X.; Hu, T.; Ye, C.; Xu, G.; Wang, X.; Chen, L. Electric load data compression and classification based on deep stacked auto-encoders. Energies 2019, 12, 653. [Google Scholar] [CrossRef]
  23. Ullah, A.; Haydarov, K.; Haq, I.U.; Muhammad, K.; Rho, S.; Lee, M.; Baik, S.W. Deep learning assisted buildings energy consumption profiling using smart meter data. Sensors 2020, 20, 873. [Google Scholar] [CrossRef] [PubMed]
  24. Laib, O.; Khadir, M.T.; Mihaylova, L. Toward efficient energy systems based on natural gas consumption prediction with LSTM Recurrent Neural Networks. Energy 2019, 177, 530–542. [Google Scholar] [CrossRef]
  25. Wang, Y.; Chen, J.; Chen, X.; Zeng, X.; Kong, Y.; Sun, S.; Guo, Y.; Liu, Y. Short-term load forecasting for industrial customers based on TCN-LightGBM. IEEE Trans. Power Syst. 2020, 36, 1984–1997. [Google Scholar] [CrossRef]
  26. Kingma, D.P.; Welling, M. Auto-Encoding Variational Bayes. In Proceedings of the 2nd International Conference on Learning Representations, ICLR 2014, Banff, AB, Canada, 14–16 April 2014. [Google Scholar] [CrossRef]
  27. O’Shea, K.; Nash, R. An Introduction to Convolutional Neural Networks. arXiv 2015, arXiv:1511.08458. [Google Scholar] [CrossRef]
  28. Kingma, D.P.; Salimans, T.; Welling, M.J.A. Variational dropout and the local reparameterization trick. In Proceedings of the 28th International Conference on Neural Information Processing Systems, Montreal, QC, Canada, 7–12 December 2015; Volume 2, pp. 2575–2583. [Google Scholar]
Figure 1. Schematic diagram of power pattern identification and anomalous outlier detection based on the clustering algorithm.
Energies 17 03904 g001
Figure 2. Overall flow chart of the electricity behavior modeling analysis of industrial and commercial users based on a deep variational autoencoder.
Energies 17 03904 g002
Figure 3. Flow chart of electricity behavior modeling and analysis algorithm for industrial and commercial users based on DVAE.
Energies 17 03904 g003
Figure 4. Schematic representation of the variational autoencoder structure.
Energies 17 03904 g004
Figure 5. Overall network structure diagram of deep variational autoencoder (DVAE).
Energies 17 03904 g005
Figure 6. The adaptive structure diagram of the sliding window.
Energies 17 03904 g006
Figure 7. vae_loss changes for Industry #1 (triangle), Industry #2 (diamond), and Industry #3 (square).
Energies 17 03904 g007
Figure 8. Generated samples of Industry #1 under trained DVAE model.
Energies 17 03904 g008
Figure 9. Industry load pattern analysis results of Industry #1, Industry #2, and Industry #3.
Energies 17 03904 g009
Figure 10. Reconstruction results of Industry #1 test sample #A (top left), #B (top right), and #C (bottom).
Energies 17 03904 g010
Figure 11. Reconstruction results of test sample #D (left) and #E (right).
Energies 17 03904 g011
Figure 12. Reconstruction results of Industry #3 test samples #F (left) and #G (right).
Energies 17 03904 g012
Figure 13. Reconstruction probability of the 2-month test load data for this industrial user.
Energies 17 03904 g013
Figure 14. Daily load pattern (left) and late daily load pattern (right) of the test set.
Energies 17 03904 g014
Figure 15. Comparing results of experimental performance indicators.
Energies 17 03904 g015
Figure 16. Weekly load pattern for 16 building types in some parts of the United States (The y-axis unit is /MWh; the x-axis unit is /hour; lines of different colors represent different weeks).
Energies 17 03904 g016aEnergies 17 03904 g016bEnergies 17 03904 g016c
Figure 17. Anomalous warehouse (left) and business district (right) samples.
Energies 17 03904 g017
Table 1. Description of some industrial and commercial experimental datasets in Southeast China.
DateUsersAnomalous
Industry #12014/1~2015/15162330
Industry #22014/1~2015/1387104
Industry #32014/1~2015/14762821
Table 2. Index of anomalous scores for test case samples.
Test SampleReconstruction ProbabilityPearson CorrelationMean Load
#A0.67790.816659.98001
#B0.36880.5660916.11646
#C0.69890.8875421.09903
#D0.73060.9122234.97619
#E0.26700.4497132.66502
#F0.75450.8705611.96069
#G0.32260.5063212.17643
Table 3. Comparison of the experimental performance indicators. (Bold indicates the best result).
AlgorithmAUC F 1 _ S c o r e
DVAE0.8480.644
VAE0.7810.517
AE0.5960.433
Table 4. Anomaly detection results for warehouses, business districts, and fast service restaurants.
TypeTest SamplesAnomalous SamplesAnomalous Ratio (%)
Warehouse15,334279418.22%
Business district16,80016139.60%
Fast service restaurant16,2955543.39%
Disclaimer/Publisher’s Note: The statements, opinions and data contained in all publications are solely those of the individual author(s) and contributor(s) and not of MDPI and/or the editor(s). MDPI and/or the editor(s) disclaim responsibility for any injury to people or property resulting from any ideas, methods, instructions or products referred to in the content.