Article

Application of Electrical Protection on Subsea Electrically Trace Heated Pipe-in-Pipe Line

1
TechnipFMC Poland, Al. Jana Pawla II 43B, 31-864 Krakow, Poland
2
Faculty of Electrical Engineering, Warsaw University of Technology, Pl. Politechniki 1, 00-661 Warsaw, Poland
*
Author to whom correspondence should be addressed.
Energies 2024, 17(15), 3825; https://doi.org/10.3390/en17153825
Submission received: 12 June 2024 / Revised: 12 July 2024 / Accepted: 17 July 2024 / Published: 2 August 2024
(This article belongs to the Section F: Electrical Engineering)

Abstract

:
The deployment of Electrically Trace Heated Pipe-in-Pipe (ETH-PiP) brings the challenges of reliable protection selection and setting. This paper presents a study of relays and protection function optimization for ETH-PiP systems. The study is based on the developed simulation model of a typical ETH-PiP system. The paper presents simulation studies of physical phenomena occurring during electrical disturbances in the ETH-PiP system and offers detailed analyses applicable to system protection, including detection of disturbances, location, and elimination.

1. Introduction

Power systems in the Oil and Gas (O and G) industry are often project-specific and, therefore, unique in their topology and operation [1]. One example is the Electrically Trace Heated Pipe-in-Pipe (ETH-PiP) technology developed to reduce plugging risks of very long subsea flowlines by controlling transported fluid temperature and avoiding hydrate formation or wax deposition [2]. Similar heating technologies are also used in onshore applications [3]. Moreover, the ETH-PiP technology can be seen as an enabler for significant CAPEX (Capital Expenditure) reduction via architecture simplification [4,5].
On one side, the operational principle of the ETH-PiP system is relatively simple—three-phase trace heating cables are wound on a flowline and are terminated with a permanent 3-phase short-circuit (star-end) isolated from grounding potential. The heat production in the cables is based on the Joule effect. The electrical power required to supply the ETH-PiP system is delivered by dedicated topside infrastructure. However, the operating conditions of ETH-PiP trace heating cables are not suited to most of the conventional protection functions used in distribution and transmission systems. As reported in [6], phase-to-phase faults located above ~80% of the total length of the heating cable are particularly difficult to identify. This is one of the major challenges in the electrical protection of the ETH-PiP system.
Additionally, the high importance of protection systems requires extensive testing before deployment. This can be achieved during computational simulations where different fault current scenarios can be modeled, and the response of applicable electrical protection functions can be verified. The most common simulation packages in the field of electrical protection are Matlab/Simulink Simscape Electrical [7], PSCAD V5 [8], ATP-EMTP 7.5 [9], and ETAP 2024 [10].
The main goal of the paper is to cover the applicability assessment of selected well-known protection functions—distance/impedance protection function (also known as ANSI 21 [11]; ANSI—American National Standard Institute) and directional ground fault over-current protection function (also known as ANSI 67N [12]) for protection against phase-to-phase and phase-to-screen faults. Analyses are based on a PSCAD [8] model of an ETH-PiP system (as reported in [13] the most suitable model of an ETH-PiP system is a chain of electrical parameters distributed along the cable length). Additionally, the paper briefly presents flow assurance aspects (plugging risk reduction) related to long subsea flowlines, and it describes the structure of the ETH-PiP system.
Flow assurance is a term in the oil and gas industry that refers to ensuring a reliable and economical flow of hydrocarbons from reservoir to topside (platform or FPSO—floating production, storage, and offloading system). It comprises a large number of specialized engineering aspects such as modeling of transient multiphase flow and preventing solid deposits such as waxes, gas hydrates, asphaltenes, or naphthenates from forming. The formation of deposits primarily depends on production and environmental factors such as temperature, pressure, flow rate, transported liquid composition, etc. If it is not monitored and controlled, it may lead to flow reduction and eventually complete blockage of the flowline. An example of such a case is presented in Figure 1. Typical hydrate appearance temperatures (HAT) can be around 25 °C but depend on pressure and the properties of the particular reservoir. Typical wax appearance temperatures (WAT) are around 30 °C and depend on the properties of the reservoir only. More information about flowline aspects can be found in [14,15]. Technical evaluation of the deposition process in subsea oil pipeline systems together with descriptions of mitigation technologies used and planned can be found in [16,17,18].
Although it is possible to provide flow assurance with various technologies (e.g., chemicals injection, mechanical cleaning (pipeline pigging), thermal insulation, hot water heating), electrical heating technology provides the flexibility of different heating strategies (heating modes, heating power regulation, etc.). There are two main electrical subsea heating technologies presently available: DEH (Direct Electrical Heating; single-phase solution based on electric current conduction in the steel flowline) [19] and ETH-PiP (Electrically Trace Heated Pipe-in-Pipe; 3-phase solution based on multiple conductors wound helically on the inner steel flowline) [2]. This paper focuses on the electrical protection aspects of the ETH-PiP solution.
The flowchart in Figure 2 presents the methodology used in the study. Firstly, an electrical model was prepared in PSCAD 4.5.0 software based on the construction and working principles of the ETH-PiP system. The computational results are amplitudes and trajectories of phase currents, phase voltages, zero-sequence currents, and zero-sequence voltages obtained for selected fault cases and fault locations. Next, the functionalities of the directional protection function (67N) and distance protection function (21) have been implemented in the PSCAD model to verify their behavior in a steady state and various fault scenarios. The last step of work (out of this paper’s scope) was a validation of protection function behavior in real protection devices. The computed signals of currents and voltages were collected for the same location of a modeled power system as in a real ETH-PiP system and used to feed real protection relays in RTS (real-time simulator). Thanks to such an approach the evaluation of analyzed protection functions (67N and 21) was provided.

2. ETH-PiP System Overview

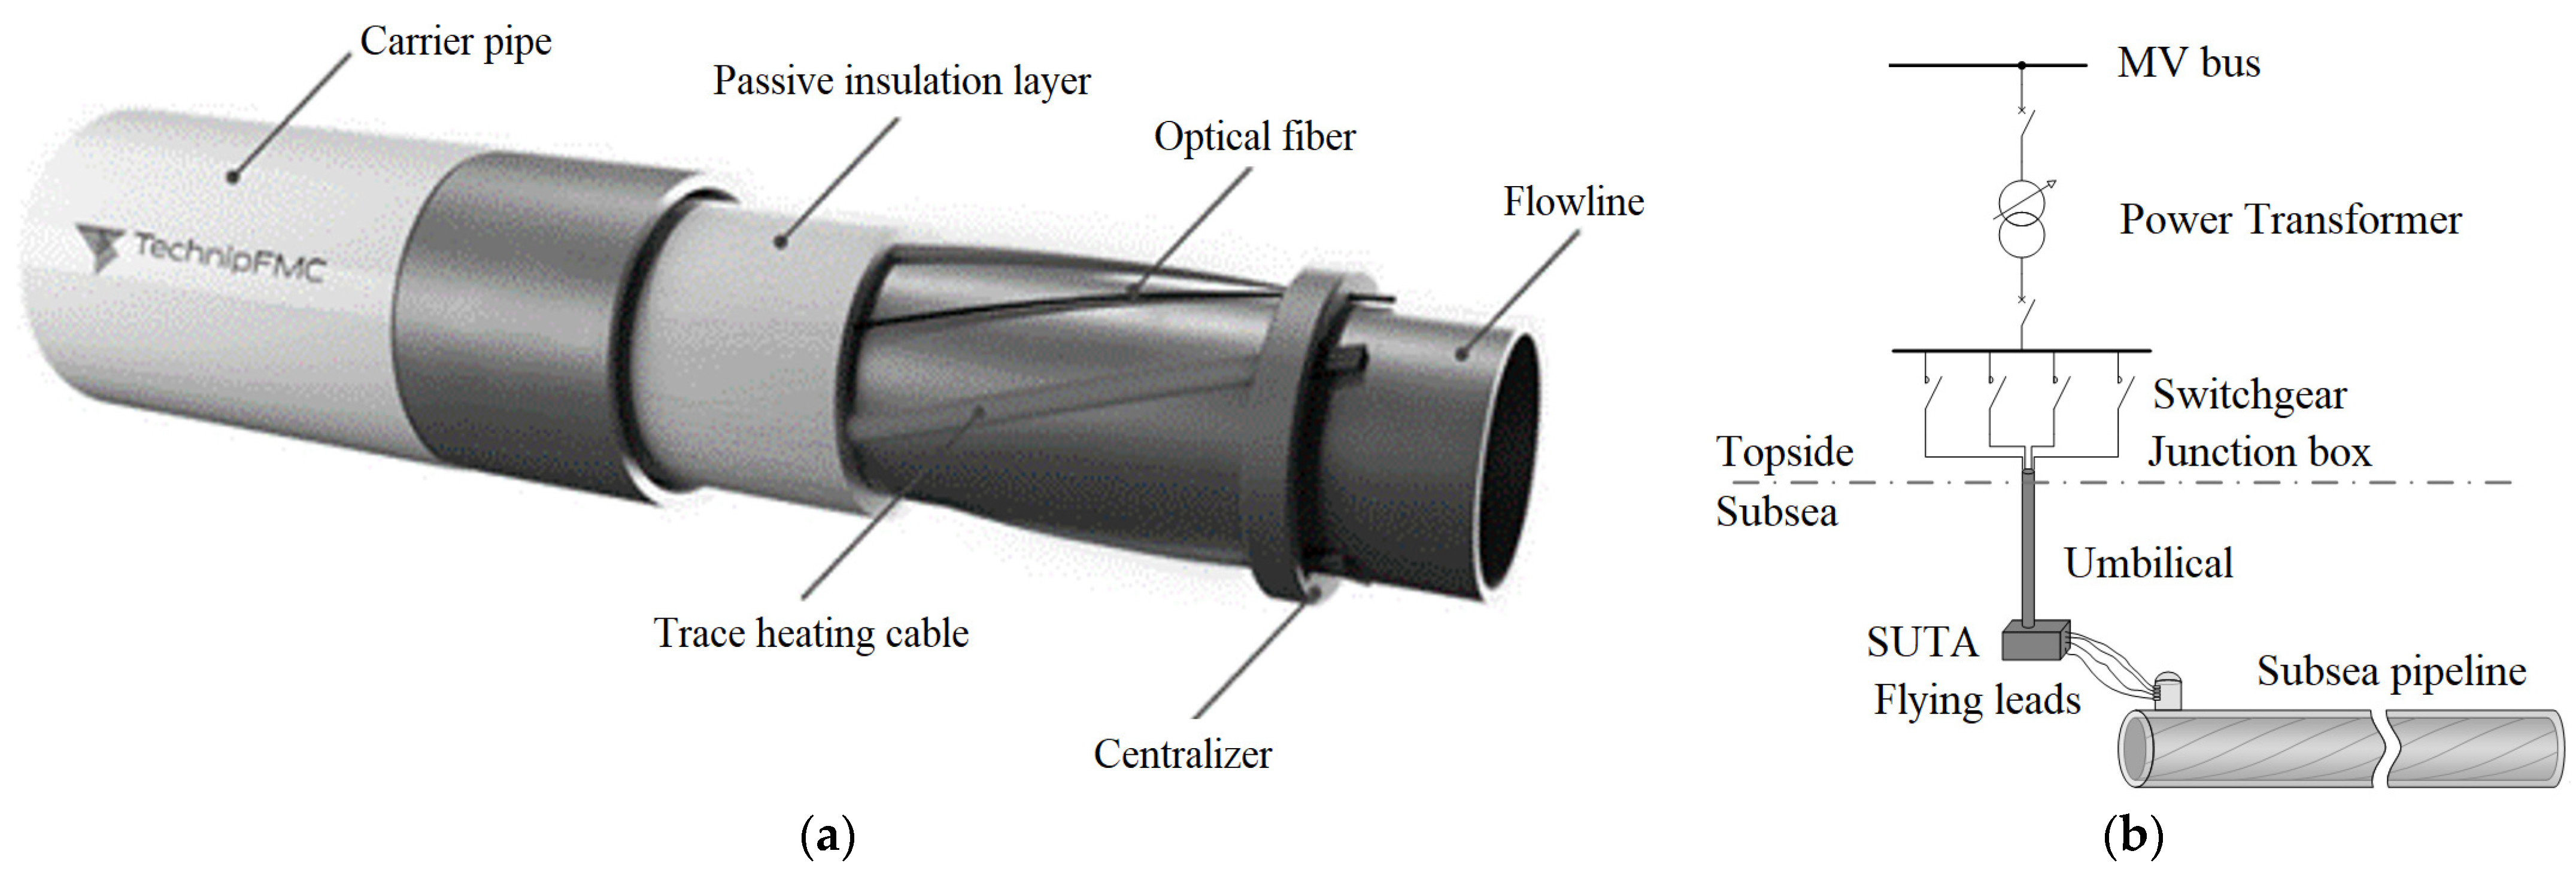
A typical ETH-PiP flowline arrangement is presented in Figure 3a. It consists of an inner steel pipe referred to as a flowline, on which electrical heating cables are wound. The flowline and cables are covered with aerogel-based thermal insulation and packed in an outer steel tube called the carrier pipe. The alignment between the flowline and carrier pipe is ensured by centralizers. The operation of the ETH-PiP system is based on the Joule effect (power losses in a cable conducting current) allowing the operator to maintain the production fluid temperature transported in the flowline above a target value. The entire system is supplied from topside (platform or FPSO—floating production, storage, and offloading vessel) with a power system topology presented in Figure 3b.
Typically, the ETH-PiP system is supplied by a dedicated three-phase transformer with an isolated neutral point. The transformer is equipped with an OLTC (On-Load Tap Changer) used to regulate the supply voltage and thus control the heating power produced by the heating cables. The topside part of the system additionally includes switchgear (to provide safe energizing and de-energizing of the heating cables and monitoring of the system parameters) and a junction box (used as the interface between topside cabling and subsea umbilical cable). The junction box in oil and gas vocabulary is often called the TUTA (Topside Umbilical Termination Assembly).
On the seabed side, an umbilical cable is used to transfer the electrical energy from the topside infrastructure to the ETH-PiP system. The umbilical is terminated with a SUTA (Subsea Umbilical Termination Assembly). From the power system topology point of view, the umbilical cable operates as a transmission line and it is designed to transfer energy with limited power losses. Next, the SUTA is connected to the ETH-PiP pipeline through dedicated wet-mate connectors and flying leads. This area of the seabed infrastructure is called the near-end. On the other end of the pipeline (called the far-end) the conductors of the heating cables are connected together (directly short-circuited) forming isolated star/wye points. The screens of the heating cables are also shorted but they are electrically connected to the grounded pipeline (in contrast to the power conductors). It should be noticed that from the entire system perspective, the ETH-PiP cable plays the role of an electrical load.
This work focuses on the protection of heating cables within the annulus of the pipeline, thus umbilical cables and flying leads are not further considered. A more detailed design description was previously published in [6].

3. Applicability Assessment of Protection Functions in the Simplified Case of the ETH-PiP System

The applicability of an electrical protection strategy is assessed using a simplified case of the ETH-PiP system. This chapter includes the analysis based on:
  • system definition (fundamental parameters of the analyzed ETH-PiP system);
  • fault scenarios and monitored parameters;
  • computational model;
  • electrical protection criteria;
  • operations of selected protection functions.

3.1. System Definition

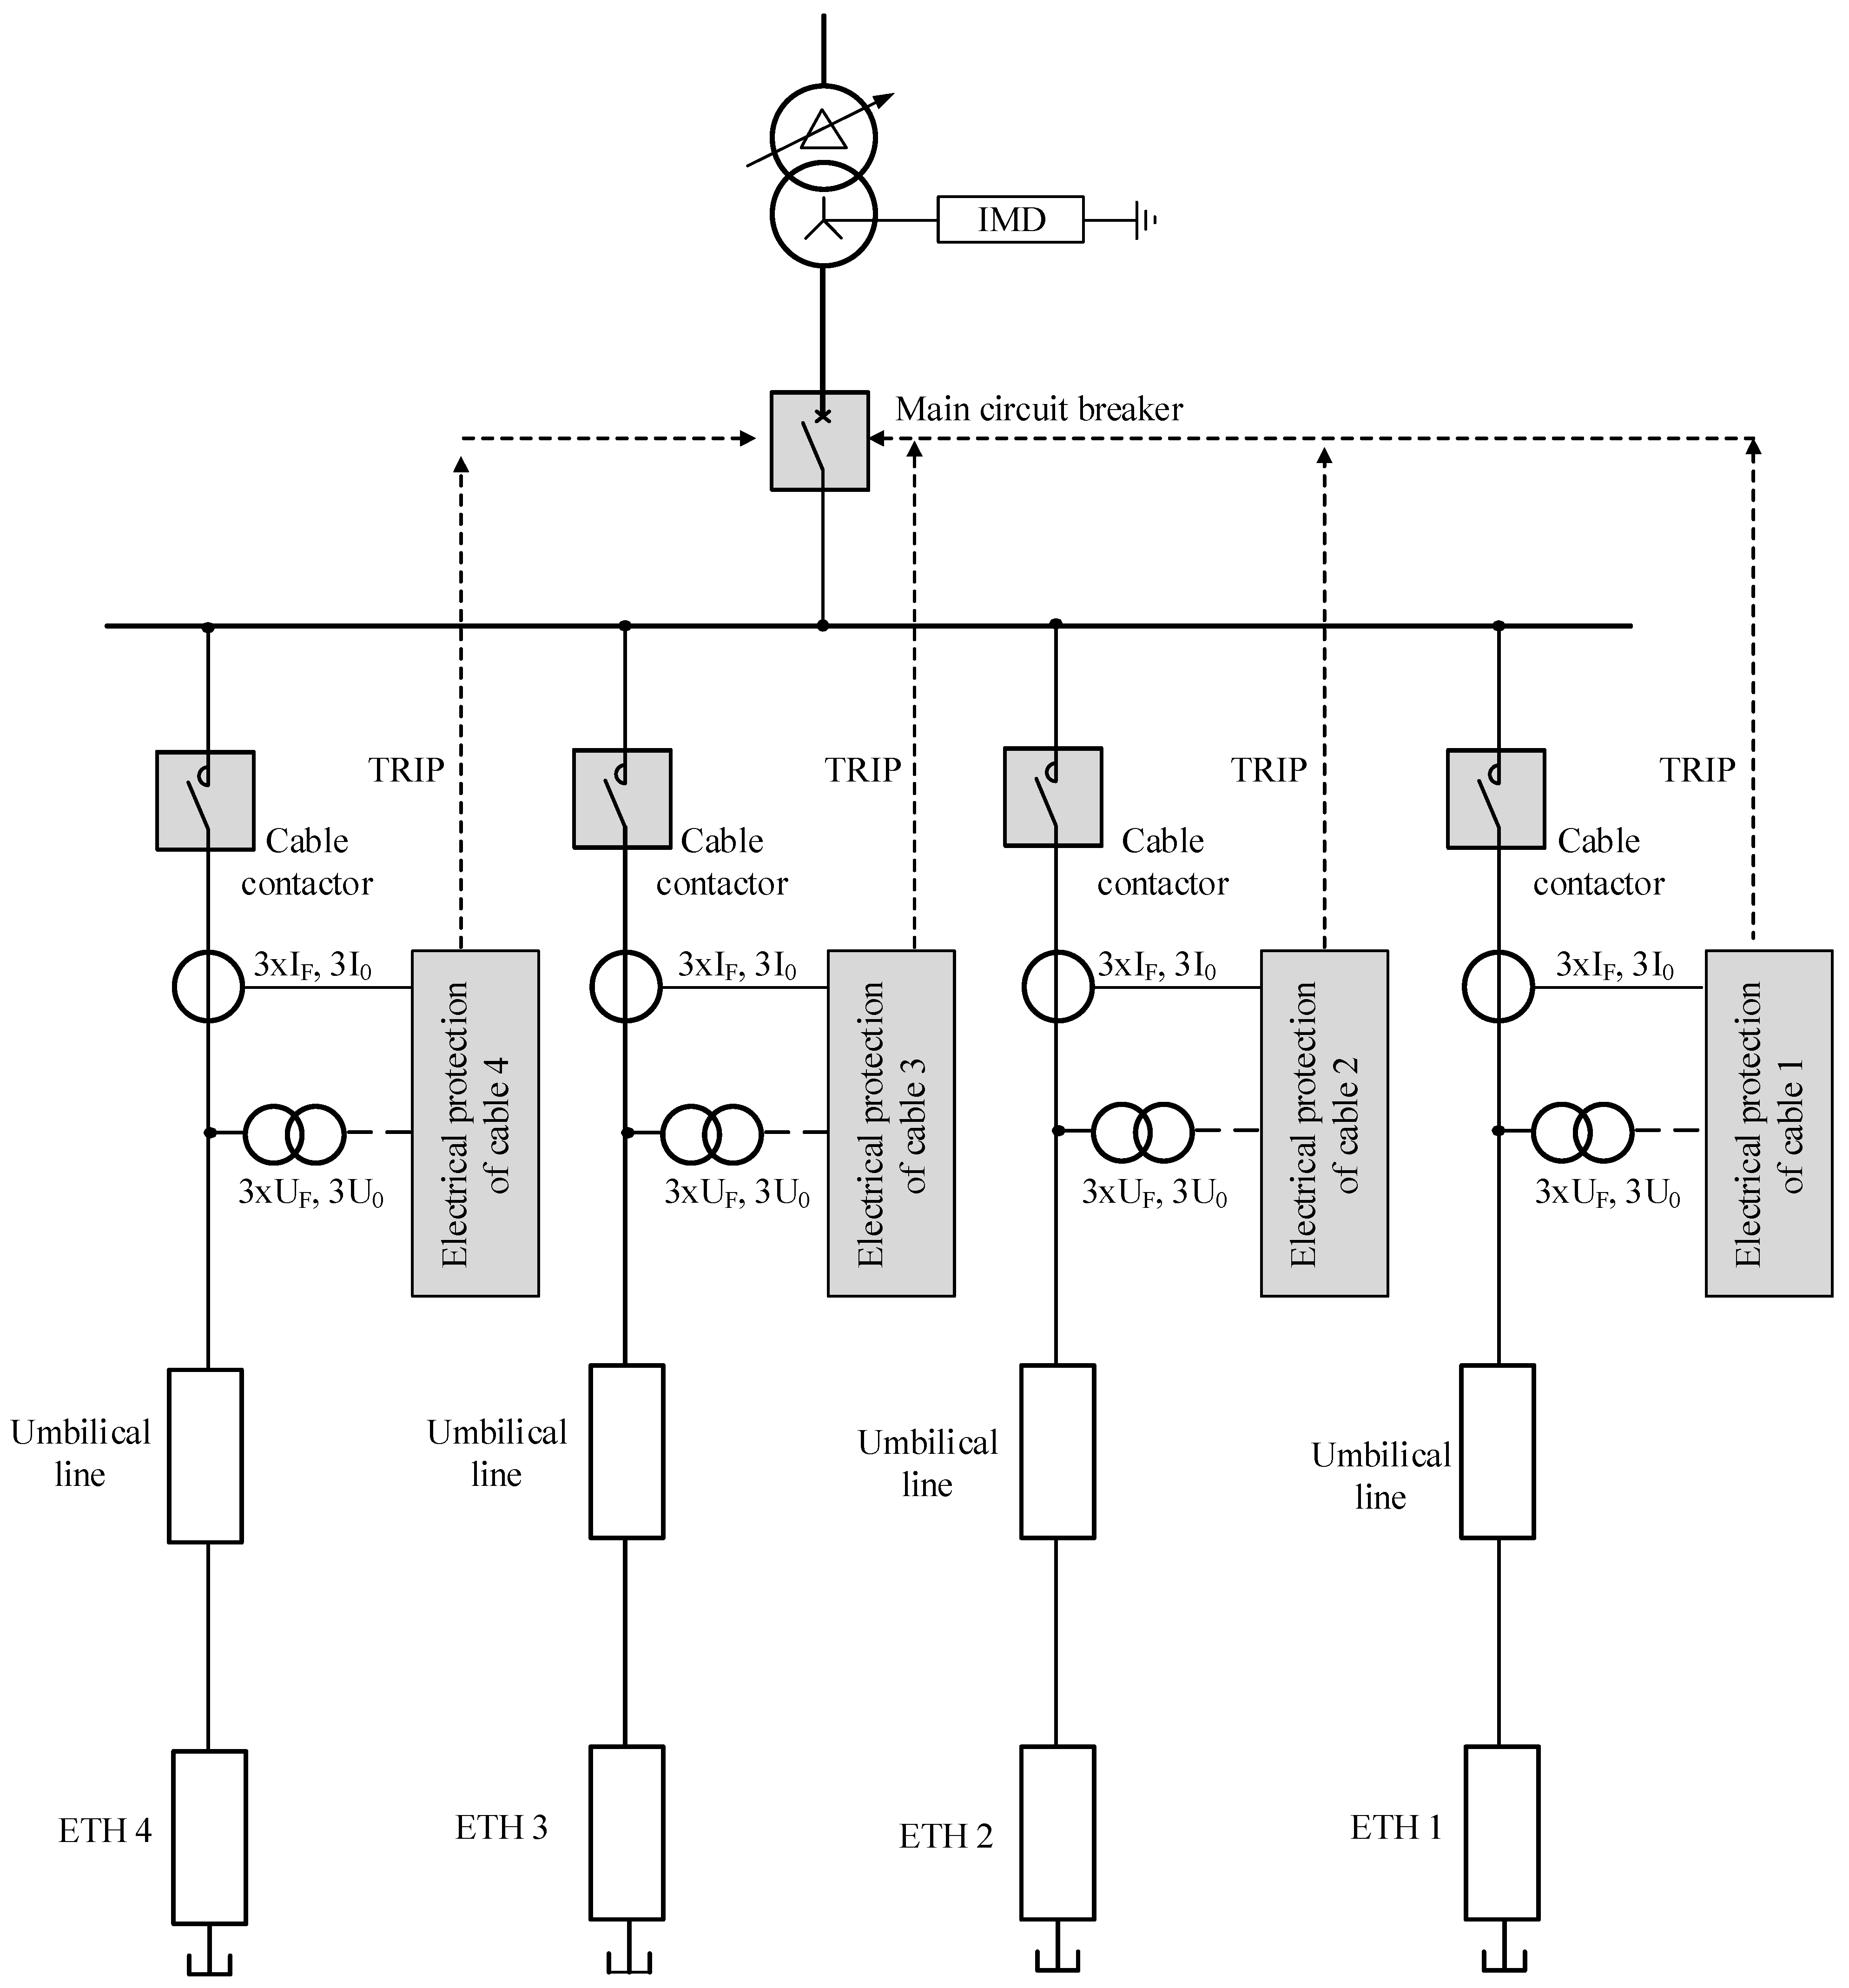
The analyzed ETH-PiP system topology (Single Line Diagram) is presented in Figure 4. The system comprises four identical heating lines composed of umbilical cables (as power transfer lines) and the ETH-PiP (as an appropriate load). Each line can be energized/de-energized independently (typically in normal operation, two lines are supplied while the other two remain offline as a spare). The entire system is supplied from the topside power supply via a step-down transformer (delta/wye topology). The neutral point of the transformer secondary winding at the topside and the short-circuited conductors of the ETH-PiP cables at the far-end are isolated from grounding potential (i.e., the entire system operates as IT topology where acronym IT means that a neutral terminal of a power supply or a transformer is not grounded). Braided screens of the ETH cables are short-circuited and grounded at the near-end and at the far-end of the pipeline. Each line is equipped with an electrical protection system based on relays with protection algorithms implemented to ensure reliability in various system conditions. The protection algorithms are based on phase-to-phase voltages and phase currents for each line of the system. The electrical protection of each line is considered separately with no mutual coupling. The assumed parameters of the analyzed case (length, heating power, electrical parameters of the umbilical and the ETH cable, etc.) are collected in Table 1.

3.2. Fault Scenarios and Monitored Parameters

The analyses have been provided for different arbitrarily selected fault scenarios. They are listed below:
  • fault between conductor and screen in one phase (1 ph. fault)
  • fault between conductors and screens in two phases (2 ph. fault)
  • fault between conductors and screens in three phases (3 ph. fault)
Each fault scenario has been analyzed for 3 fault locations along the length of the pipeline measured from the SUTA (near-end): 1 km, 25 km, 49 km (correspondingly 2.0%, 50.0%, and 98.0% of the entire cable length).
For all fault cases (combined fault scenario and fault location) the following parameters have been monitored: phase currents, phase-phase voltages, zero sequence (residual) currents, and zero sequence (residual) voltages.
Voltage and current measurements are realized by a dedicated system equipped with current and voltage transducers (used to transfer currents and voltages from original amplitudes to levels acceptable by protection relays). The transducer ratio is Vu = 54.54 for voltage and Vi = 100 for current.

3.3. Computational Model

An overview of the model developed in PSCAD [8,20] is depicted in Figure 5. This generalized model can be used to analyze the heating system with varying parameters (e.g., heating power, the length of umbilical and heating lines, the number of heating cables operated simultaneously, etc.). It is composed of four heating lines connected to the power generator via the step-down transformer and the switchgear unit where each ETH line can be switched on arbitrarily and independently from the others. In the analyzed case, only two ETH lines (which are three phases) are simultaneously in service. The remaining two lines function as a backup, implying the need for selective protection and identifying faults occurring in individual lines. Additionally, the ETH lines can operate under different power supply voltages to control the heating power of the system. The model allows to change both the supply voltage and the type of fault. The screen always participates in a simulated fault.
To validate the PSCAD model developed within the study, the simulation results obtained with the use of the model were compared to the measurement results obtained in a real system operating in a physical oil and gas installation. Simulation and measurement data were obtained for a system in which all four cable systems comprising umbilicals (power supply lines) and ETH cables were operating simultaneously.

4. Analysis of Protection Criteria

The simulated ETH-PIP system shows physical features similar to the nature of a medium voltage (MV) network operating in a system with an insulated neutral point. The main difference in the case of the ETH-PIP line is that it operates permanently in a short circuit mode (star-end at the far-end). This causes problems with the detection of short circuits at the end of the ETH-PIP line, in the immediate vicinity of the galvanic connection of the three phases of the ETH-PIP line.
Each of the three assumed fault scenarios requires an individual approach to the nature of the phenomena occurring during short-circuits and criteria selected for fault detection. In this paper, the analyzed criteria are: phase current Iph, phase–phase voltage Uph, residual current (zero-sequence of current) I0, residual voltage (zero-sequence of voltage) U0, and variation of an impedance Z.

4.1. Phase Current, Phase to Phase Voltage, Residual Current and Residual Voltage

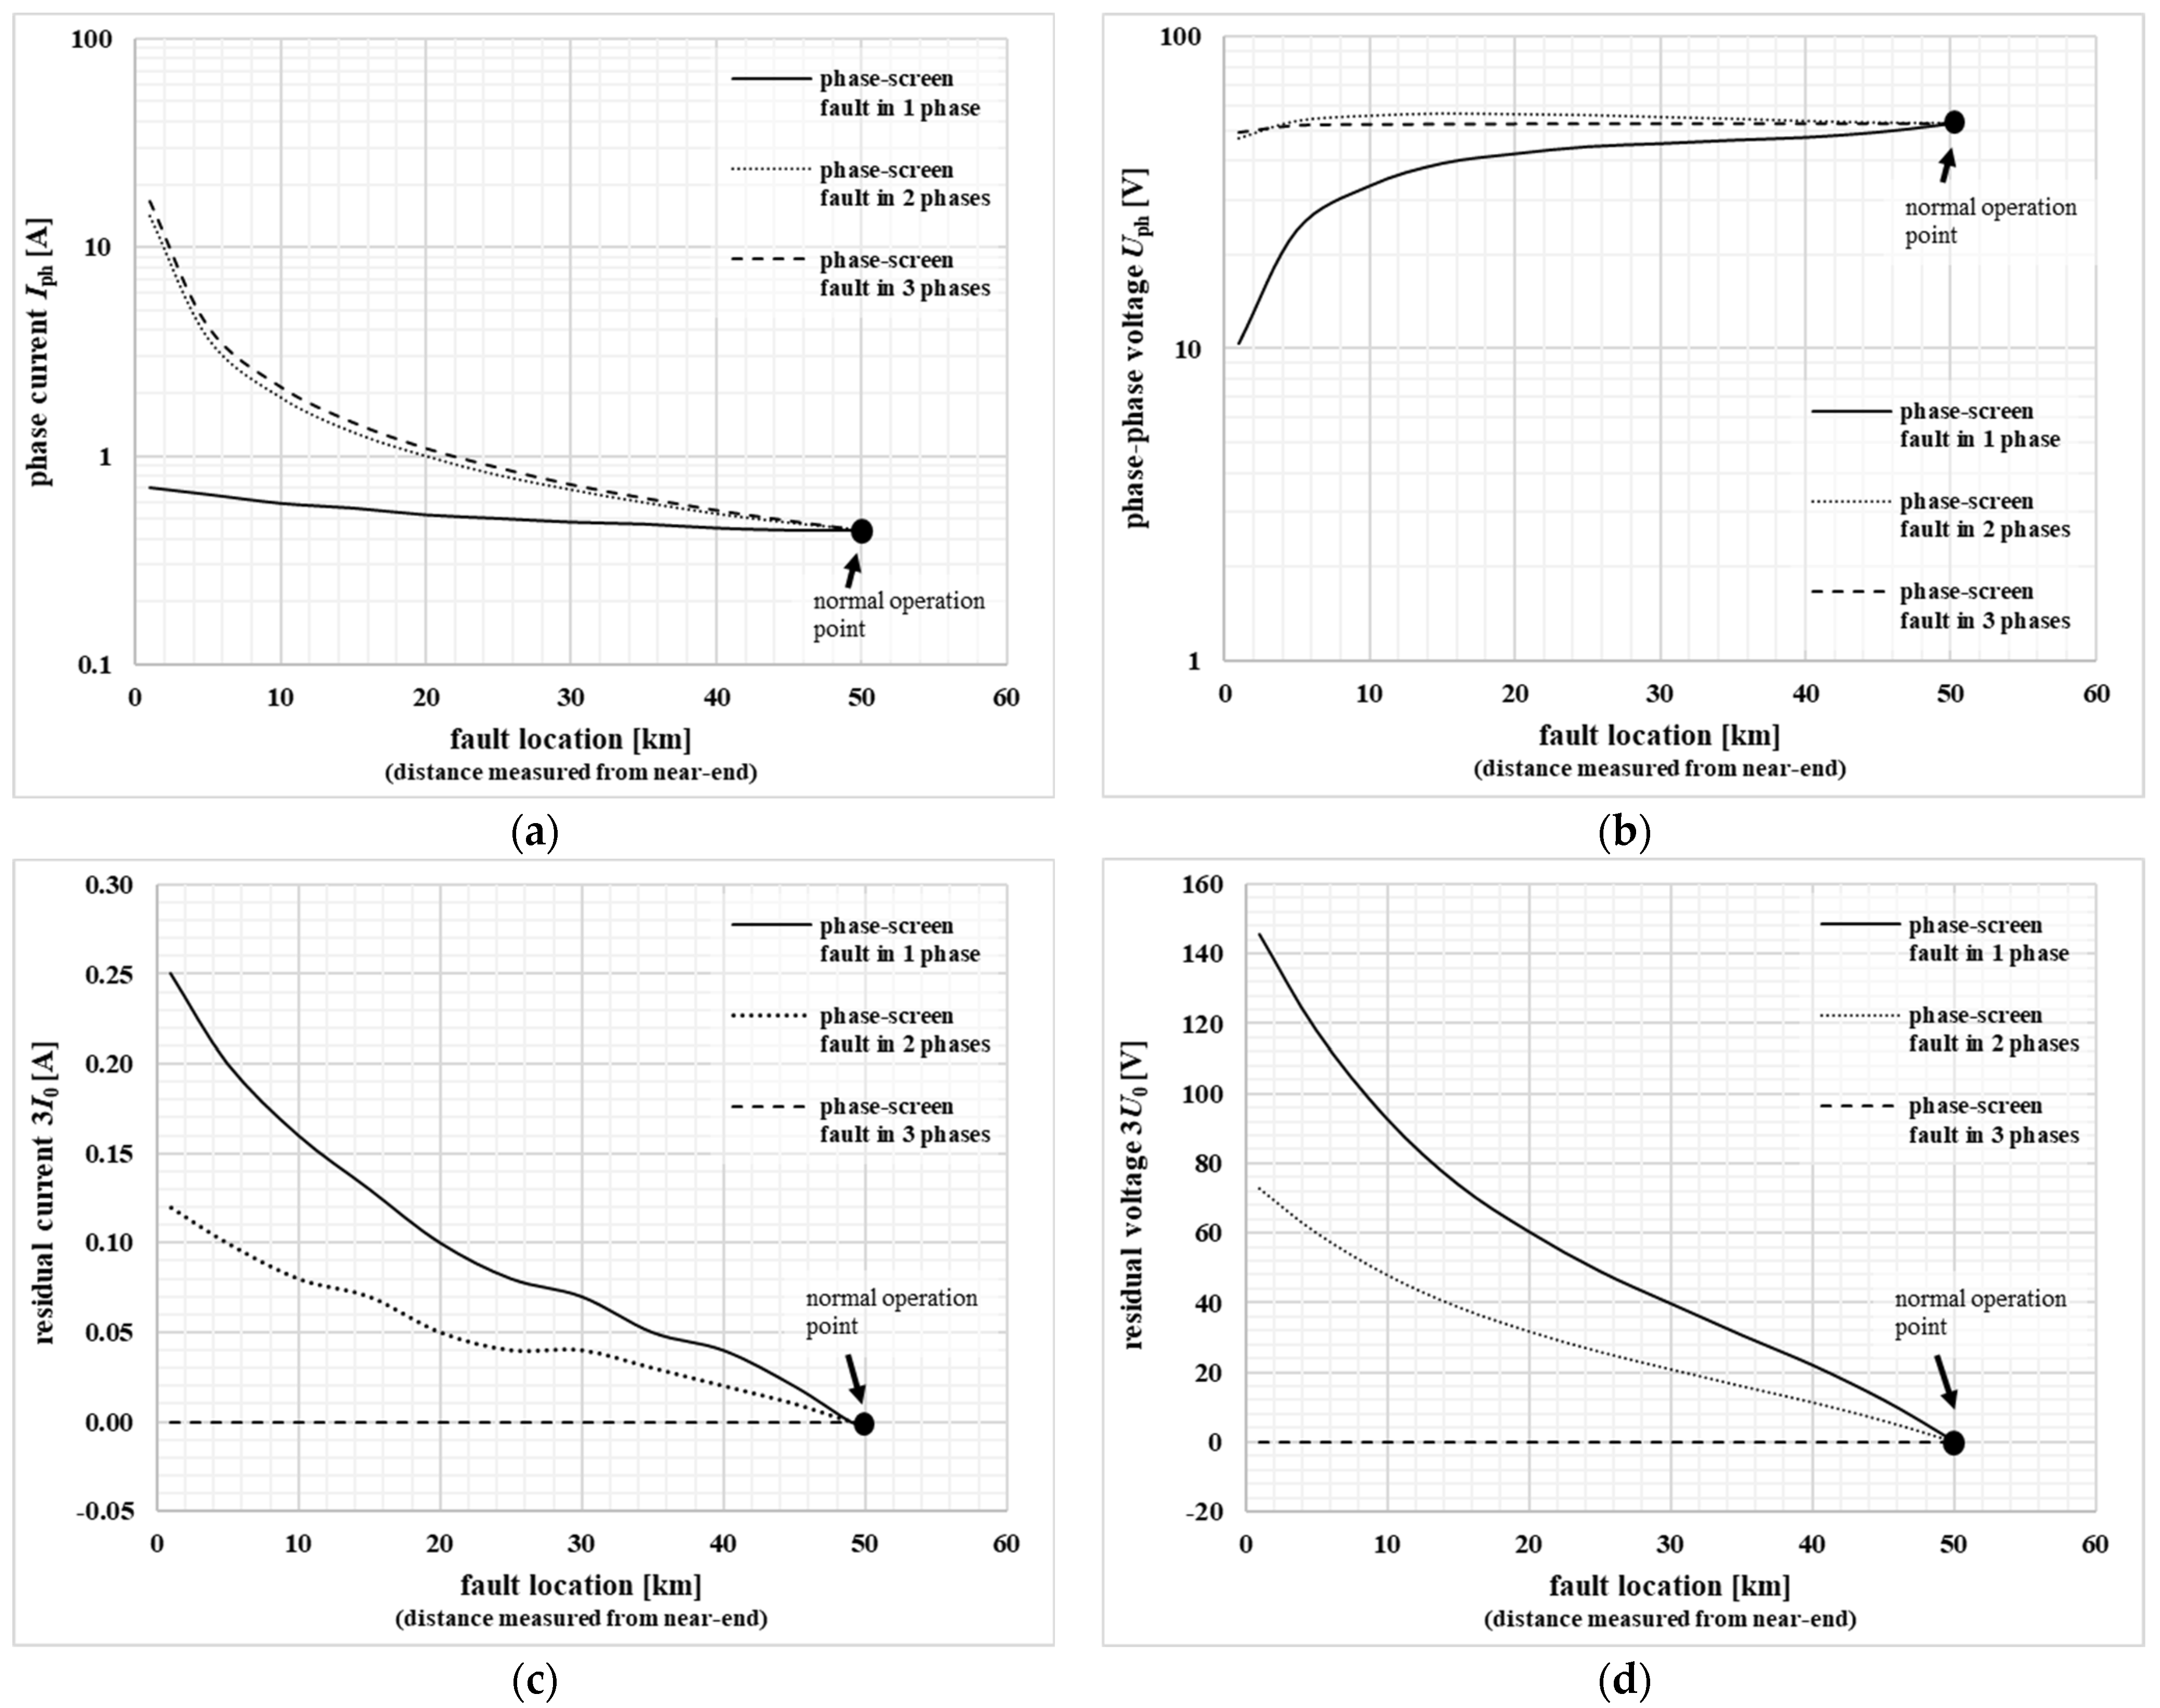
Phase current Iph, phase–phase voltage Uph, residual current (zero-sequence of current) I0, and residual voltage (zero-sequence of voltage) U0 are the most common parameters used as electrical protection criteria. For the analyzed case of the ETH-PiP system, these parameters are collected in Table 2 and Figure 6 (for better resolution the table includes values not only for assumed fault locations but also for intermediate locations).
It should be noted that the above values of fault parameters are valid for a nominal supply voltage level. However, the heating power of the ETH-PiP system is regulated by the supply voltage adjustment. Any change in supply voltage level has a direct impact on measured currents and voltages not only in normal operation but in fault states as well. This is especially important when the start-up values of individual protection functions of the ETH-PiP system are determined.

4.2. Phase Shift between Residual Voltage and Residual Current Vectors

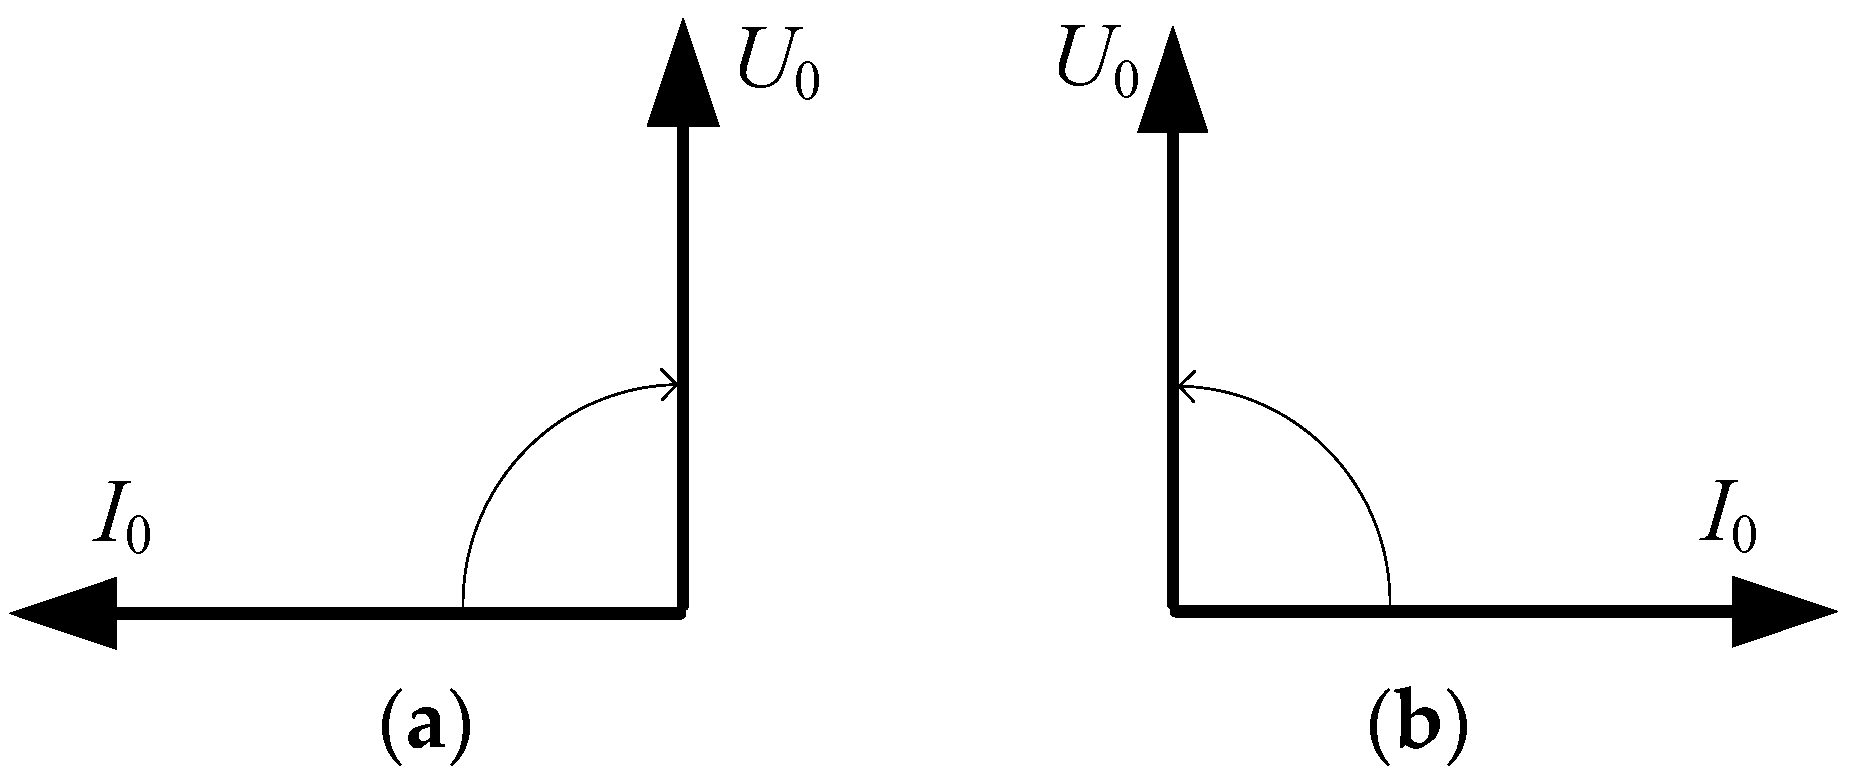
The other criteria implemented for the electrical protection of the ETH-PiP system is a phase shift between the residual current and the residual voltage. Considering the behavior of the system during single-phase faults, one can notice an analogy to low-current faults in isolated MV distribution networks (according to the assumptions that all faults have metallic connections to the ground via cable screens). In the case of a healthy line, the phase shift between voltage and current vectors is close to −90° (capacitive load character, the zero-sequence voltage lags the zero-sequence current in the faulted line—Figure 7a). As a consequence, during a single-phase short-circuit the phase shift between the residual current measured at the relay measurement point and the residual voltage is close to +90° (inductive load character, the zero-sequence voltage leads the zero-sequence current in the faulted line—Figure 7b). For the detection of single-phase faults in such networks the directional residual overcurrent protection with sine characteristics is used.

4.3. Impedance Variation (Distance Protection)

The dependence of the impedance changes on the fault location is presented in Figure 8. The cable impedance is measured at the near-end based on voltage and current waveforms (Figure 8a). For normal operation (no fault case) the cable impedance is distributed uniformly along the length of a cable and is equal to the sum of partial impedances Z1. When a fault occurs at location F1 the impedance measured at near-end is much lower and is equal to 1·Z1. Respectively, for the fault located at F2, the impedance is equal to 2·Z1 while for the fault located at Fn, the impedance is equal to n·Z1 and is very close to the nominal cable impedance for the normal operation. Generally, the cable impedance measured by current transducers (CT) and voltage transducers (VT) can be presented on the impedance plane as the line shown in Figure 8b.
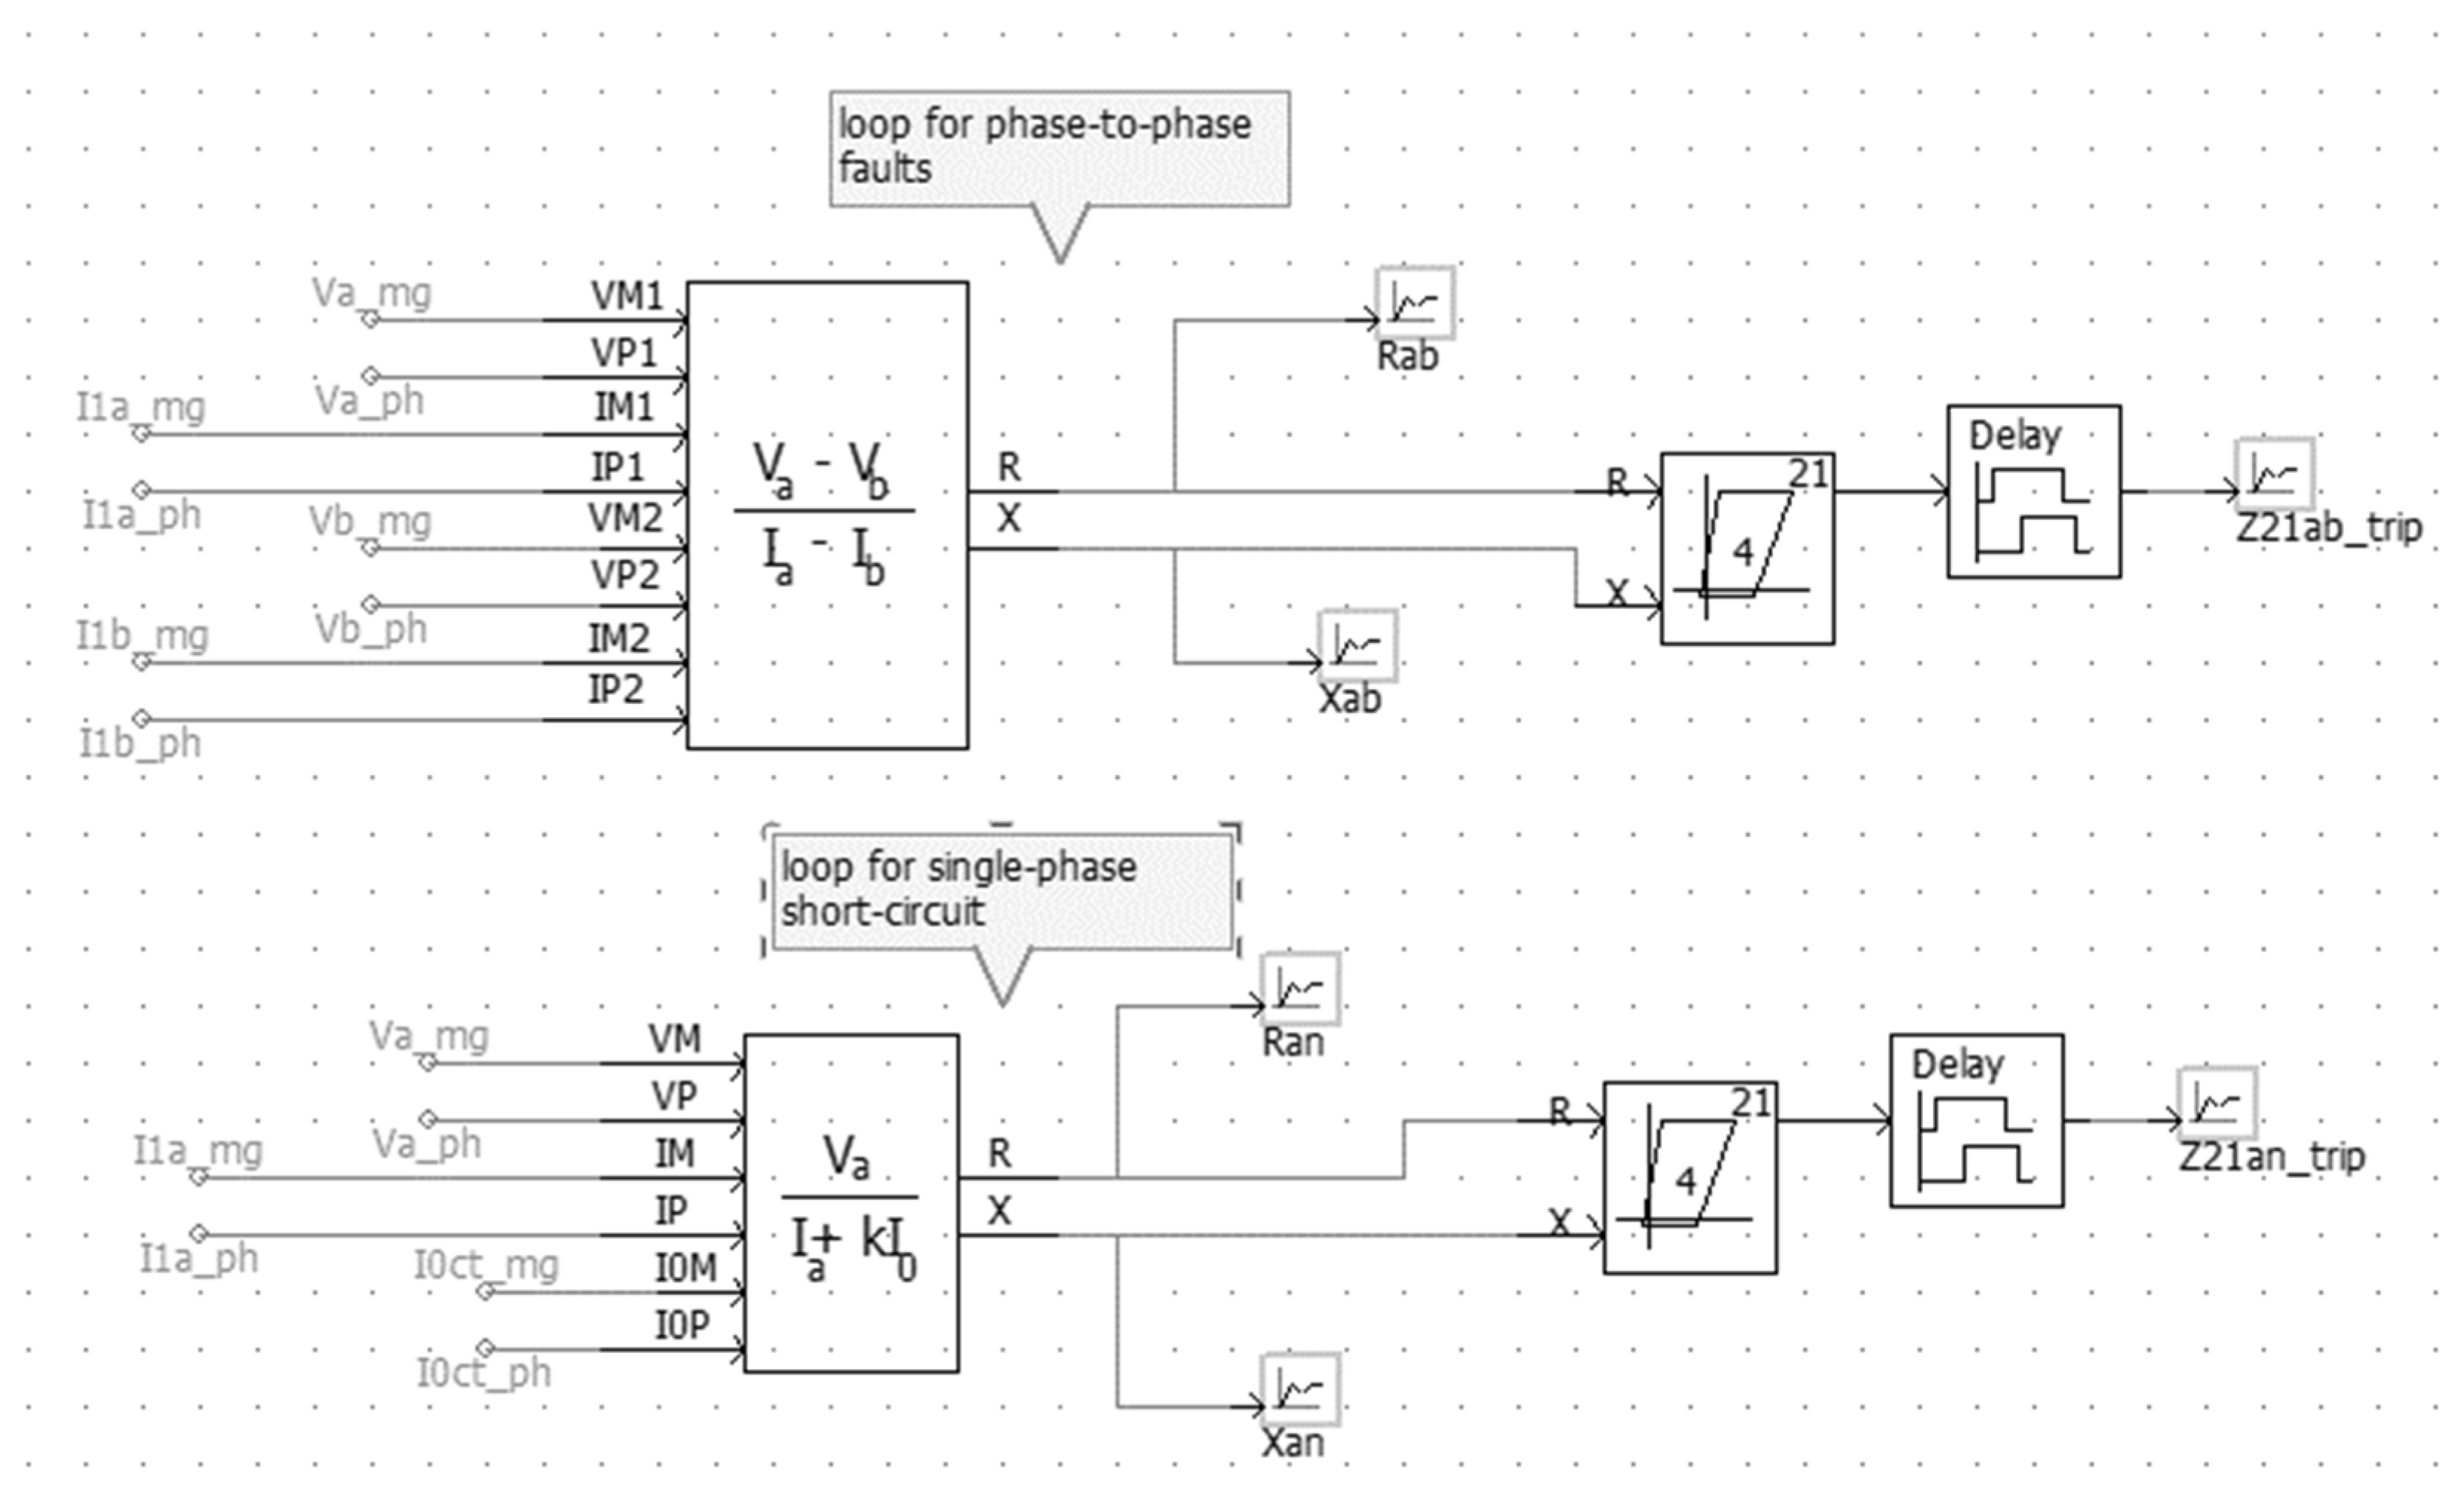
Details of the distance protection modeling method are depicted in Figure 9. The model consists of a part responsible for determining the measured impedance Z0 of the protected line and then providing these data for comparison to the part representing the safe operation zone, which generates a logic-triggering signal.
It should be noted that the method of fault loop impedance calculation depends on the fault type. For phase-to-phase faults, this impedance is expressed by Formula (1) where UL1 and UL2 are RMS values of two corresponding phase voltages while IL1 and IL2 are RMS currents in these phases.
Z P = U P I P = U L 1 U L 2 I L 1 I L 2
For a single-phase fault, the fault loop impedance is described by Formula (2), where UL1 is the RMS voltage of a faulty phase, IL1 is the RMS current of this phase while IN is a grounding current and kk is the earth-fault compensation factor.
Z P = U P I P = U L 1 I L 1 + k k I N
In a general case, the kk factor is described by Formula (3) where Z0 is the zero-sequence impedance while Z1 is the positive-sequence impedance of a protected line. The value of kk factor may vary from 0 to 1 (“0”—for lines entirely compensated, “1”—for lines not compensated). For the ETH-PiP model, the value of the kk factor is arbitrarily set as “0”.
k k = Z 0 Z 1 3 Z 1
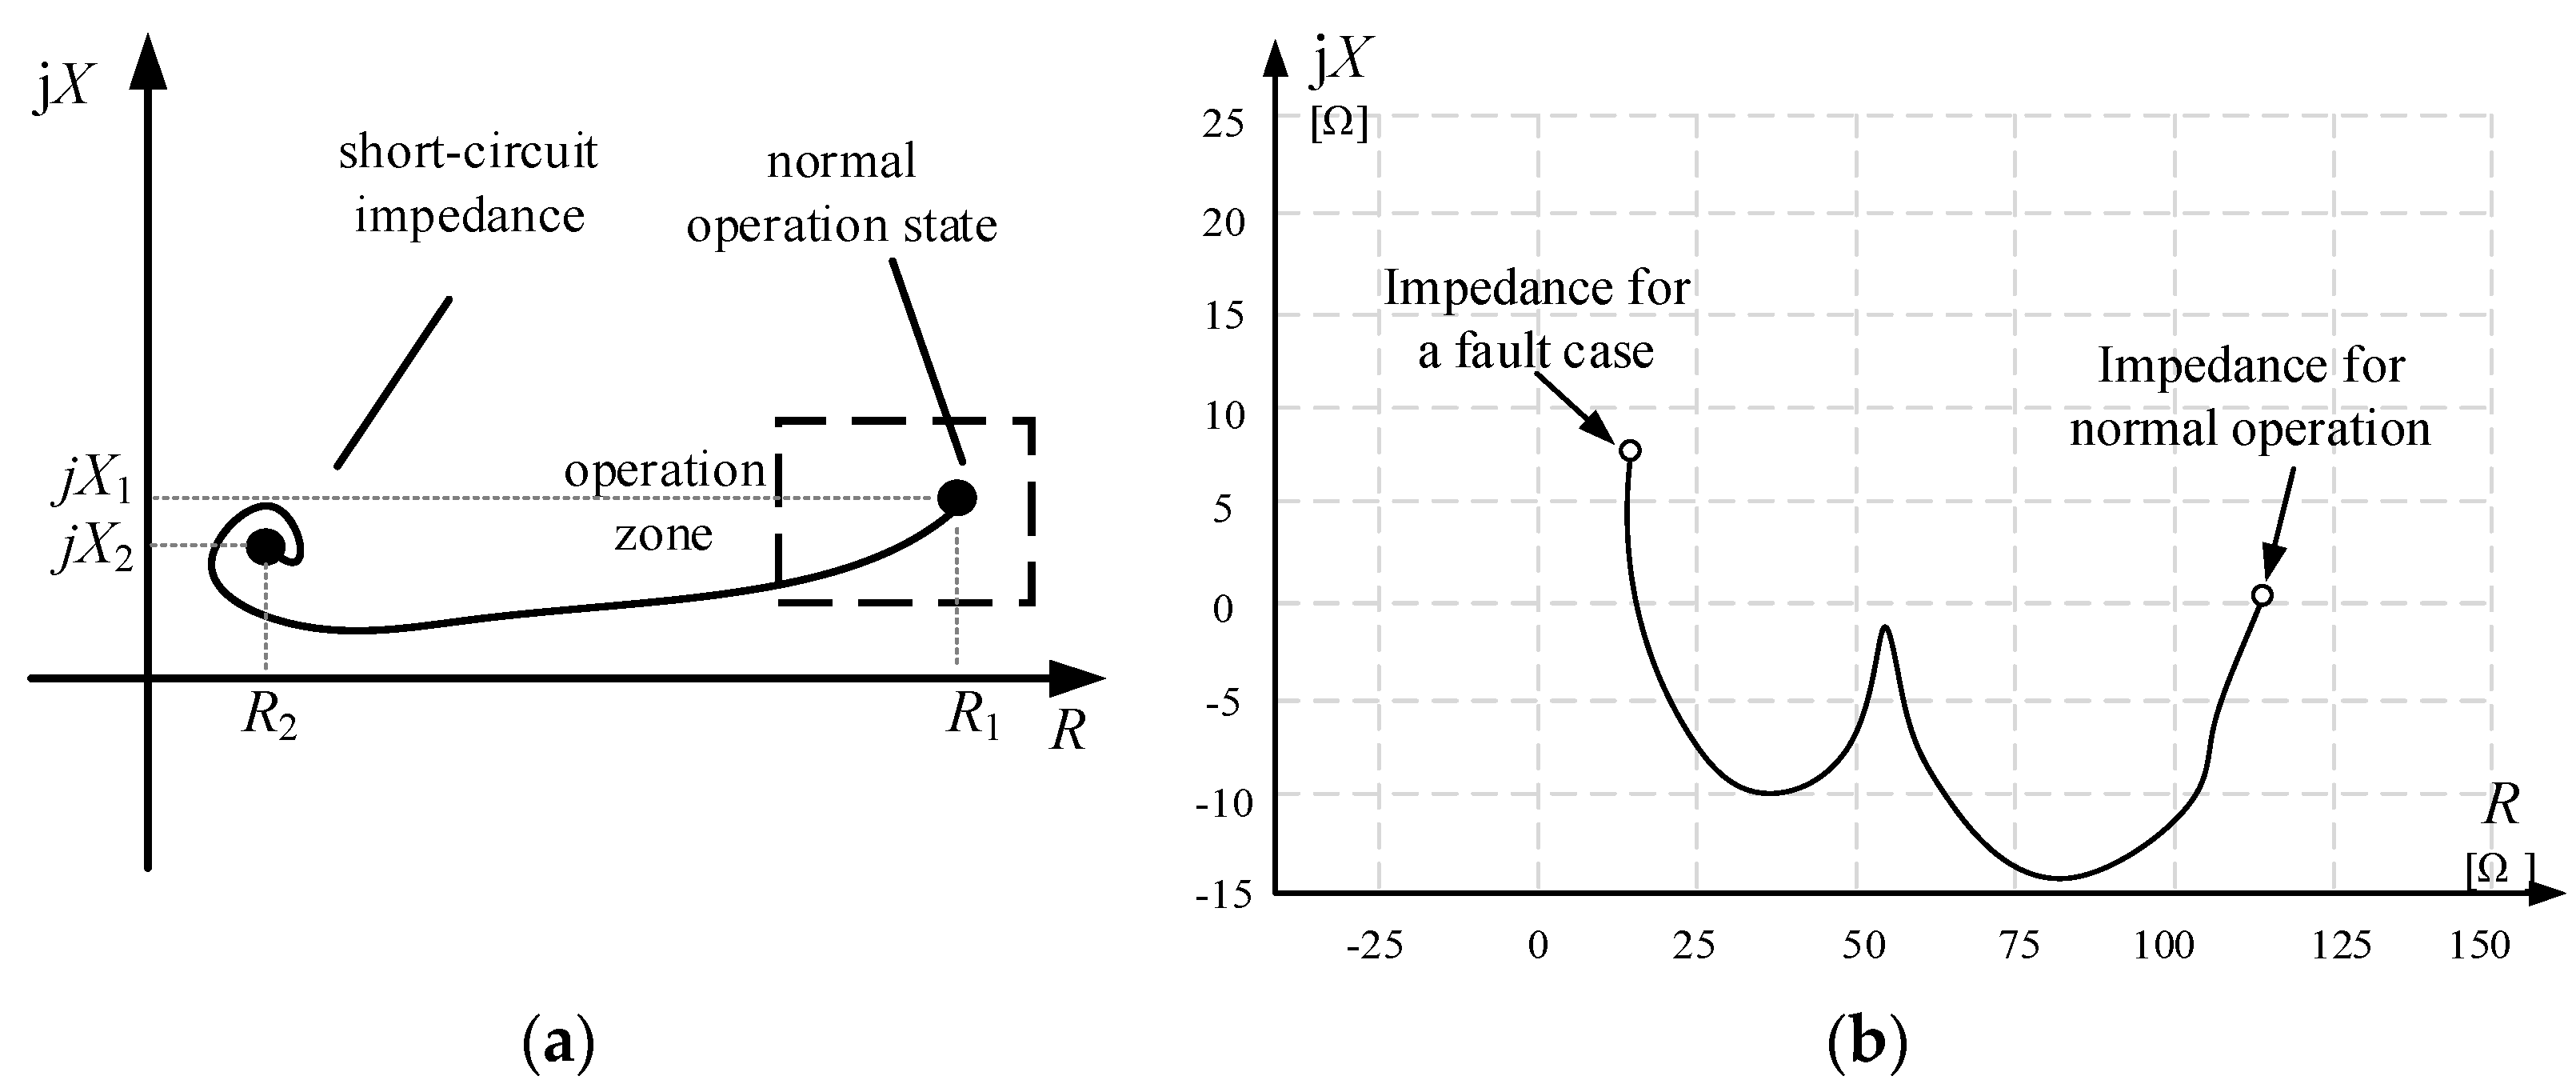
The variation of the line impedance vector (R + jX) caused by a fault is the base of distance criterion implementation in the protection of the ETH-PiP system. The theoretical example of impedance vector changes is shown in Figure 10a. In a normal operation case, the monitored impedance occupies one point in the impedance plane (R1, jX1). In a fault case, the impedance vector moves to other points (R2, jX2) drawing the impedance variation trajectory. The coordinates of the new impedance vector point (R2, jX2) depend on the location and type of a short circuit. Figure 10b presents the operation of the developed distance relay (see Figure 9) for the modeled ETH-PiP system. A clear transition of impedance towards lower resistance R and reactance jX values can be observed.
A great advantage of the distance relay for the protection of the ETH-PIP line is its insensitivity to supply voltage variation. As a result, once correctly selected the operation zone range setting will be appropriate at the rated supply voltage and at the reduced voltage caused by the operating condition of the ETH cable.

5. Operation of Selected Protection Functions in the Analyzed ETH-PiP System

5.1. Protection Function 67N

The proper set of the 67N protection function operating range requires the knowledge of a minimal triggering value of residual current I0 [12,21]. It should be kept in mind that a higher triggering value of residual current means lower sensitivity of a protection relay (and in the opposite direction—lower triggering value of residual current means higher sensitivity). Theoretically, in a three-phase entirely symmetrical system the residual current value is I0 = 0. However, in real systems, an amount of residual current always occurs due to natural asymmetries e.g., different loads’ phase impedances, varying supply voltages, and changing operation conditions. Therefore, in commercial protection relays the minimal value of residual current able to be set is typically I0 = 0.01 A. Such value was arbitrarily selected as a setting for PSCAD package simulation tests of single-phase faults at successive locations of the ETH line (1 km, 25 km, 47 km, and 49 km; starting from the near-end).
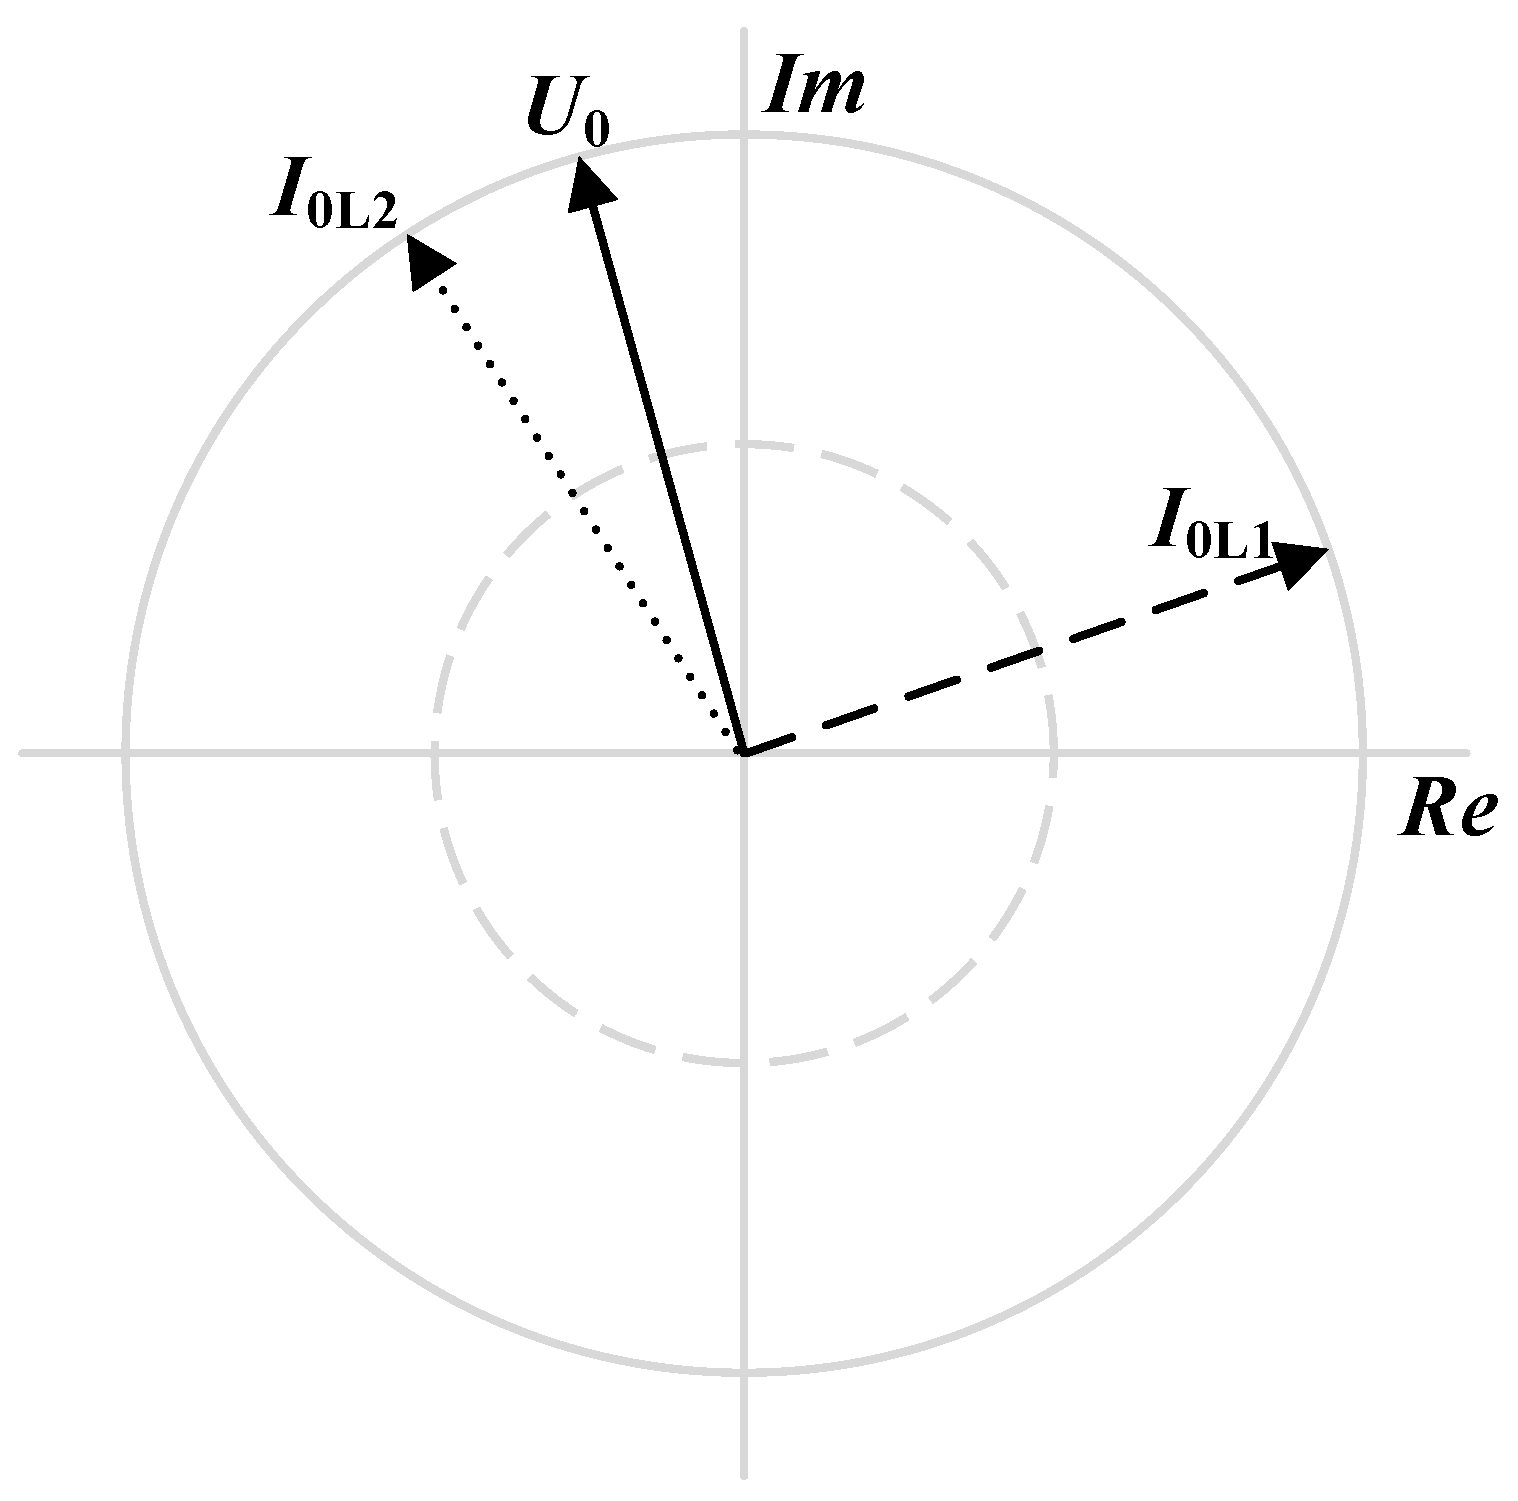
Additionally, the correct setting of the 67N function covers selective operation, meaning that the faulty phase is identified uniquely. Such functionality is available due to the phase shift between zero-sequence currents in two neighboring lines. The faulted line is marked by the zero-sequence voltage vector being ahead of zero zero-sequence current vector. In a healthy phase for the insulated system, the zero-sequence voltage vector follows the zero-sequence current vector. This phenomenon is illustrated by the phasors shown in Figure 11:
  • The dashed line vector is the zero-sequence current in the line where the fault has occurred I0L1.
  • The solid line vector is the zero-sequence voltage that occurs during a fault U0.
  • The dotted line vector is the zero-sequence current in the healthy line I0L2.
For analyzed ETH-PiP fault cases, the operation of protection function 67N depends significantly on the fault location. For the fault located at 1 km, 25 km, and 47 km of the ETH line, the protection relay picked up and tripped selectively only on a faulted line. As expected for the proposed setting (the lowest residual current and the highest sensitivity of a protection relay operation) the 67N protection tripped successfully and selectively cleared the fault.
In the case of the single-phase fault at 49 km (close to the far-end of the ETH-PiP pipeline) the 67N relay set to I0 = 0.01 A did not trip. It can be concluded that for the analyzed case 47 km (94% of the entire length) is the maximum length at which the function 67N operates properly assuming the defined minimal triggering value of residual current.

5.2. Protection Function 21

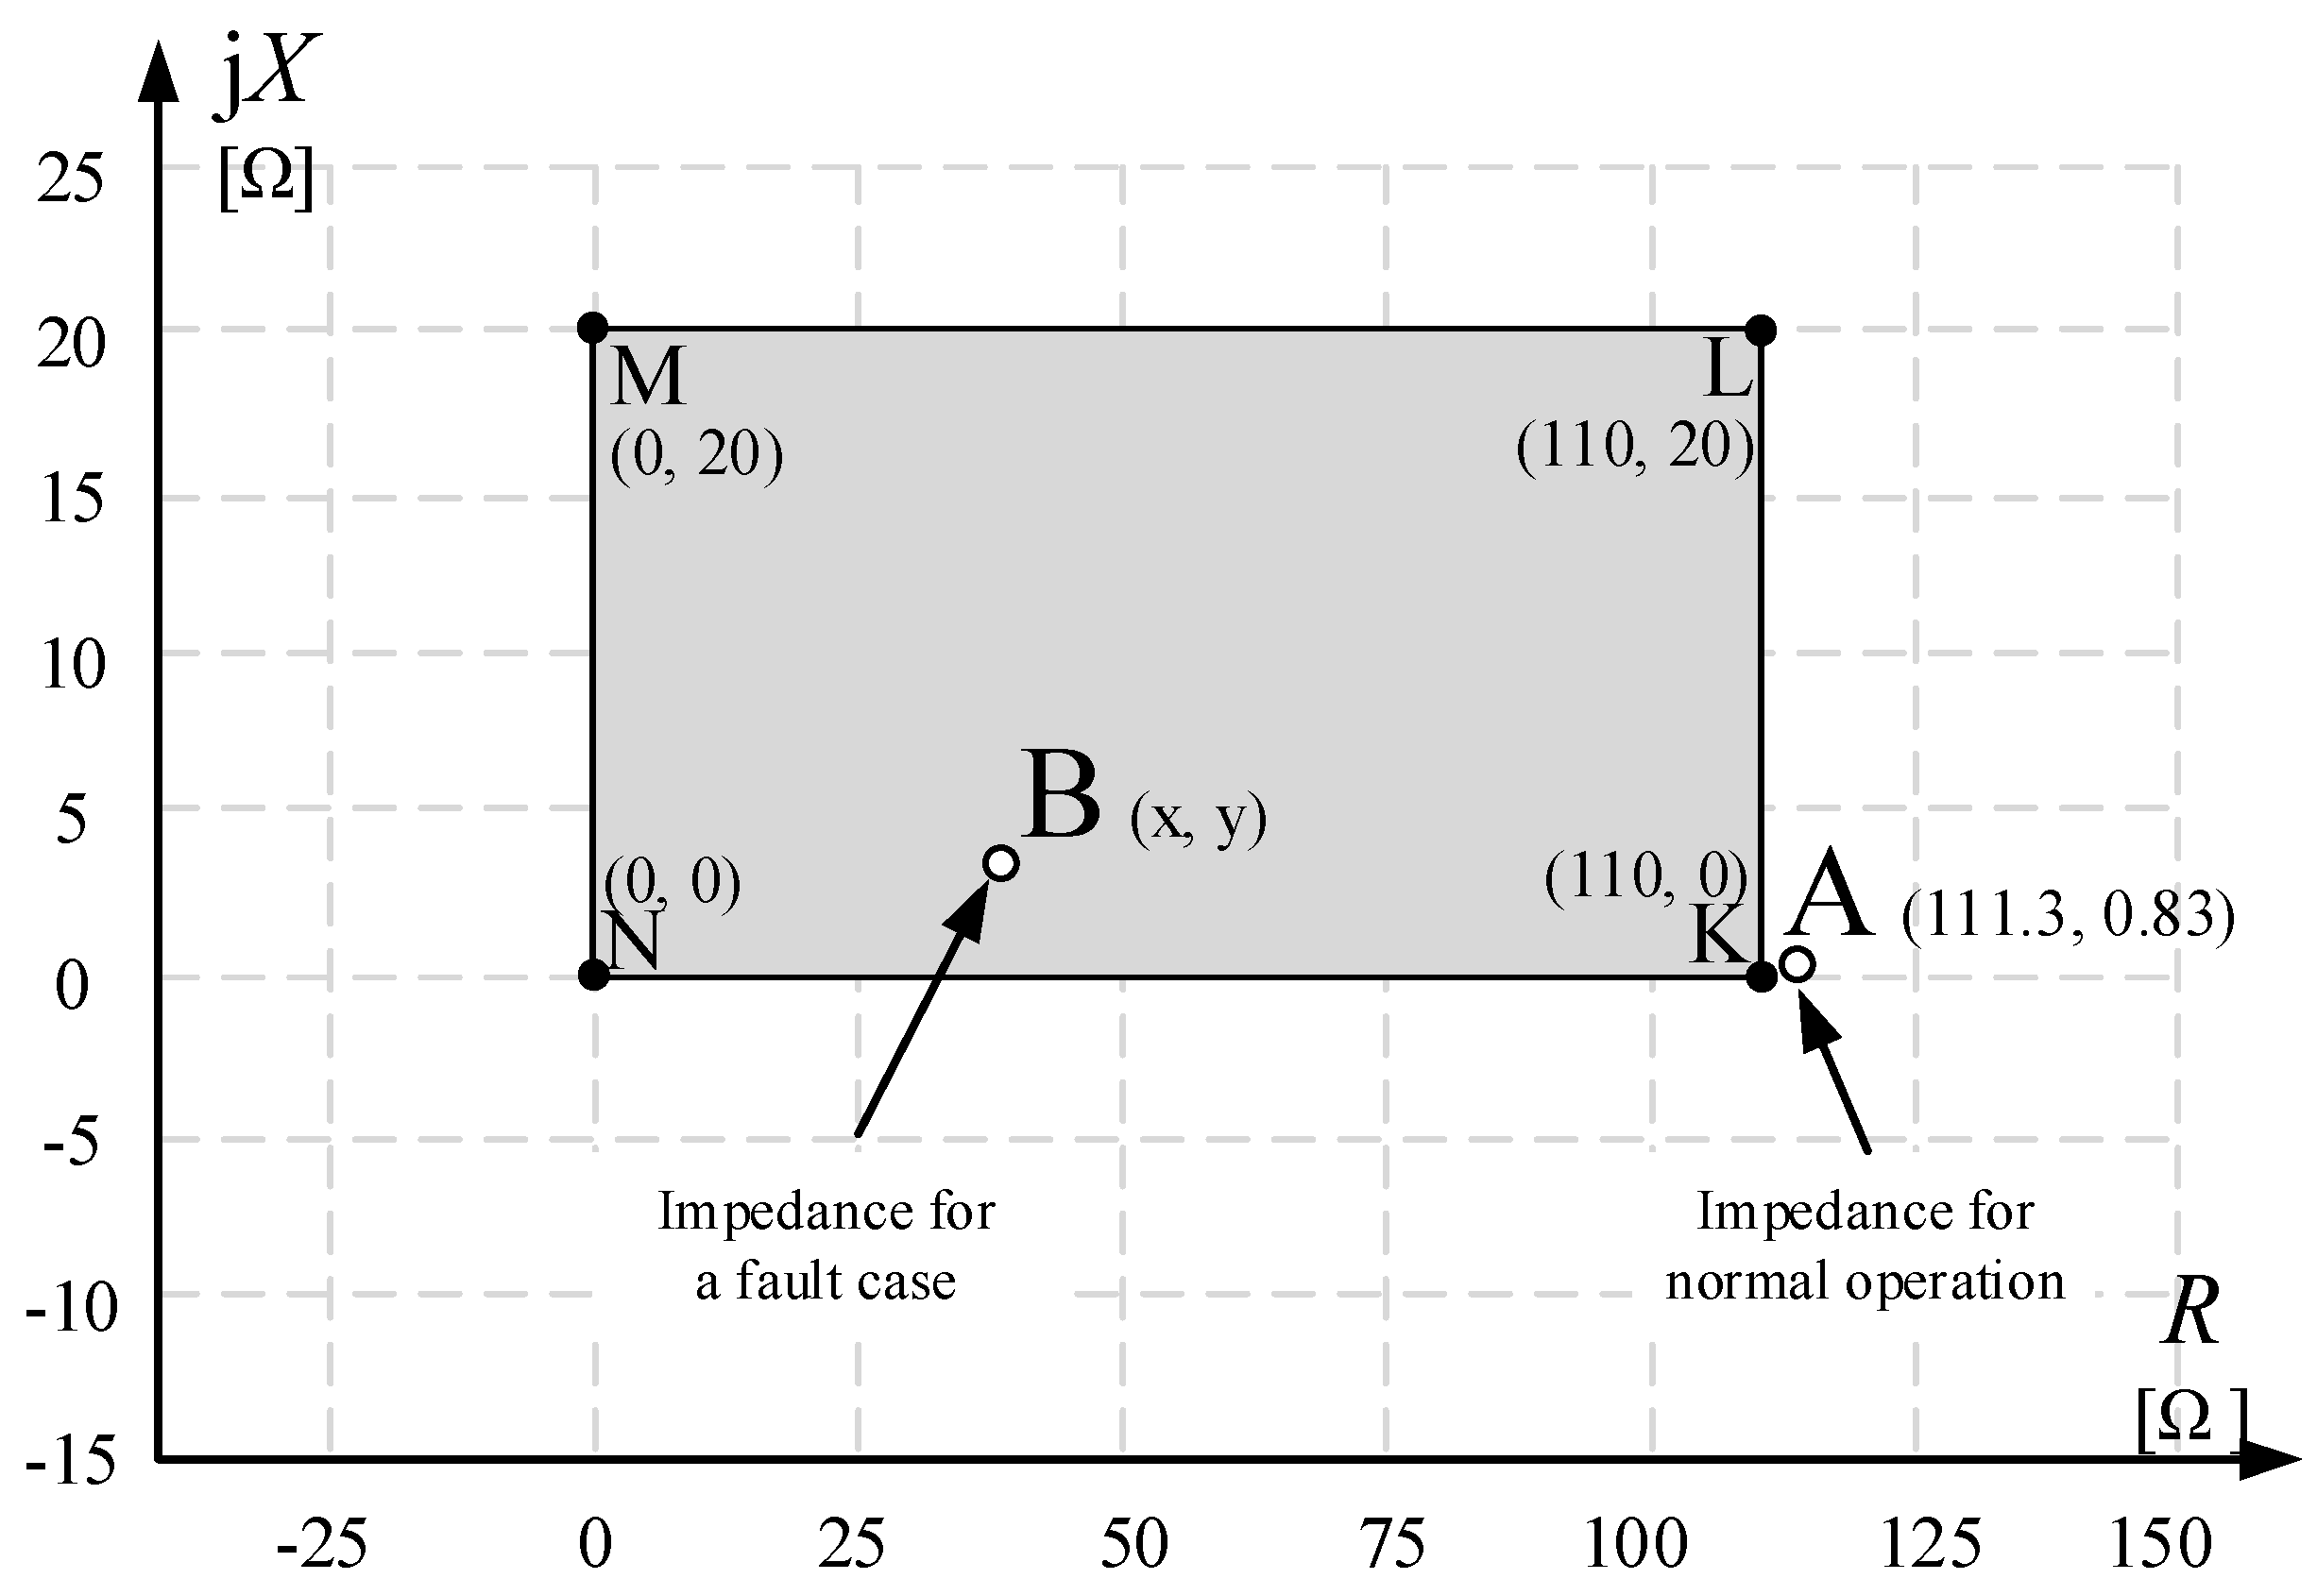
The applicability of protection function 21 [11] for the ETH-PiP system was verified based on simulation tests. In the first step, the potential range of impedance changes measured by the relay 21 for different fault locations were defined. It allowed the determination of impedance zones dedicated to normal operation and to protection against single-phase and phase-to-phase short circuits. The presented results were obtained for the rated supply voltage. Resultant changes are shown in Figure 12 on the impedance plane.
The impedance seen during normal conditions is marked on the impedance plane by the point R = 111.3 Ω, jX = 0.83 Ω (see point A(111.3, 0.83) in Figure 12). In the case of fault occurrence, the impedance jumps to point B(x, y) with “x” and “y” dependent on the fault type and fault location.
Simulation tests were conducted for the combination of three locations (1 km, 25 km, and 49 km) and two fault types (single phase-to-screen and phase-to-phase). Finally, six different fault combinations have been analyzed. The main goal of the analysis was to propose a method of setting the operating zones for protection function 21 that would ensure the elimination of all fault types.
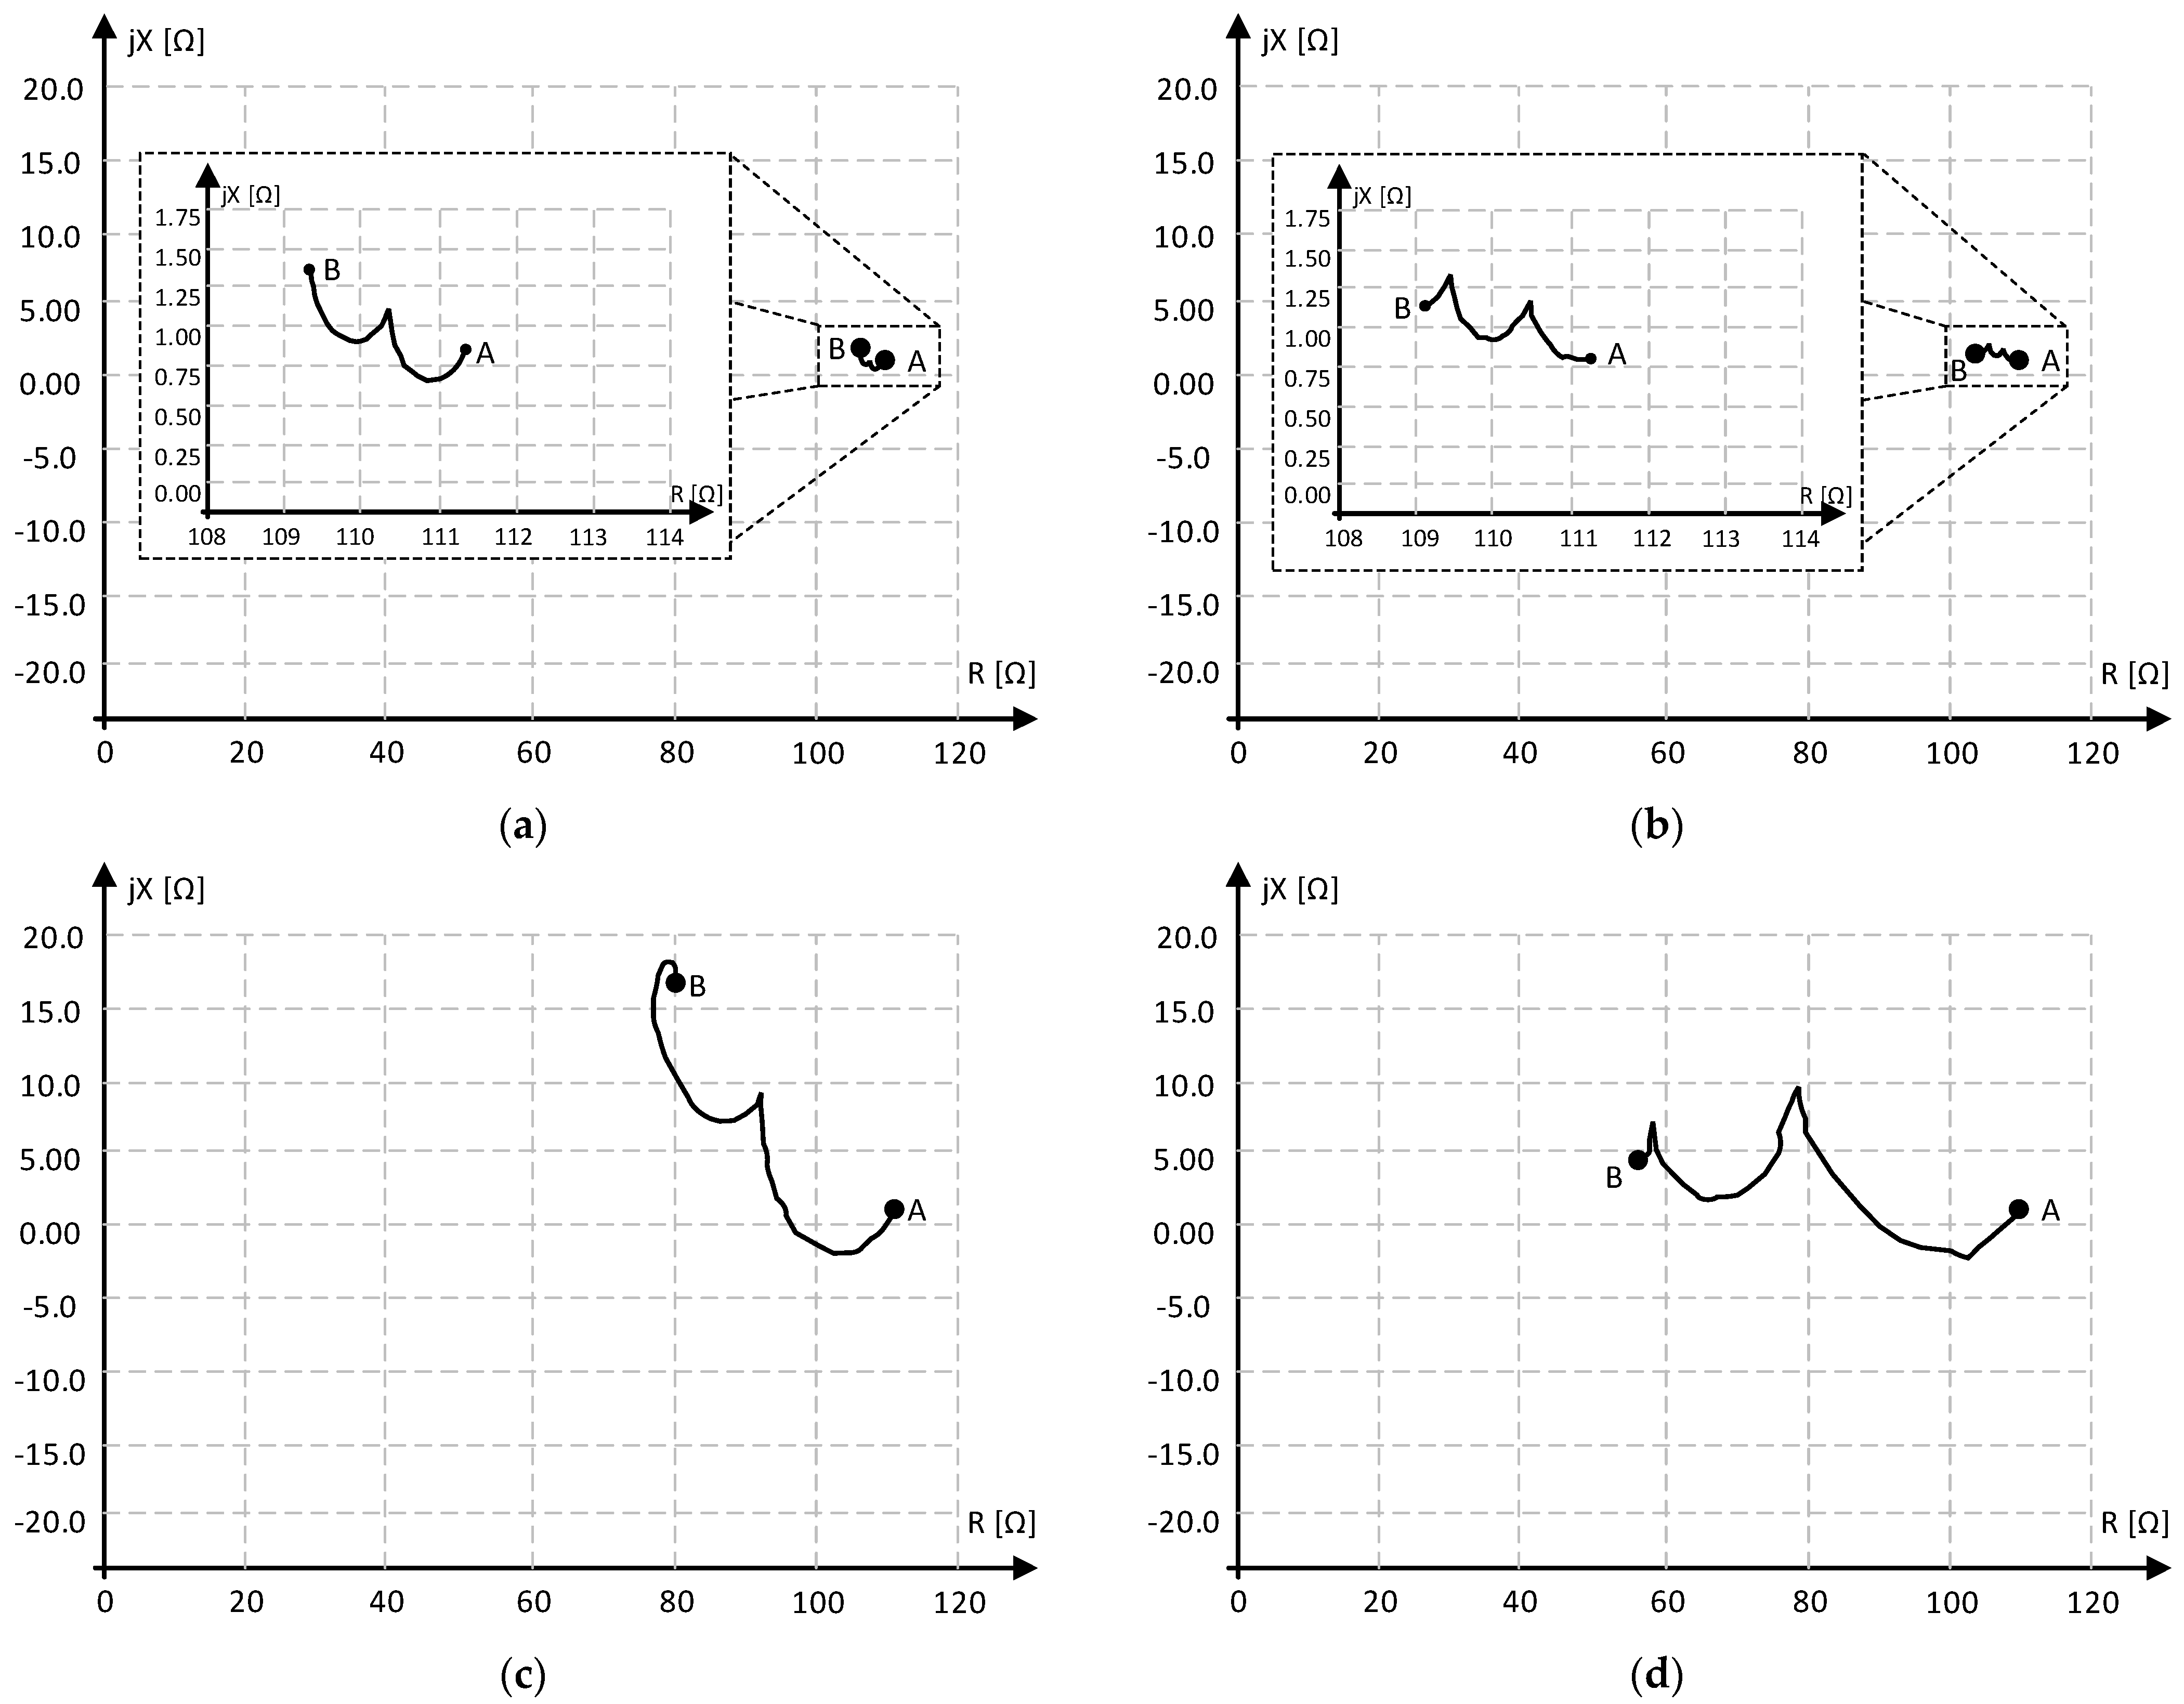
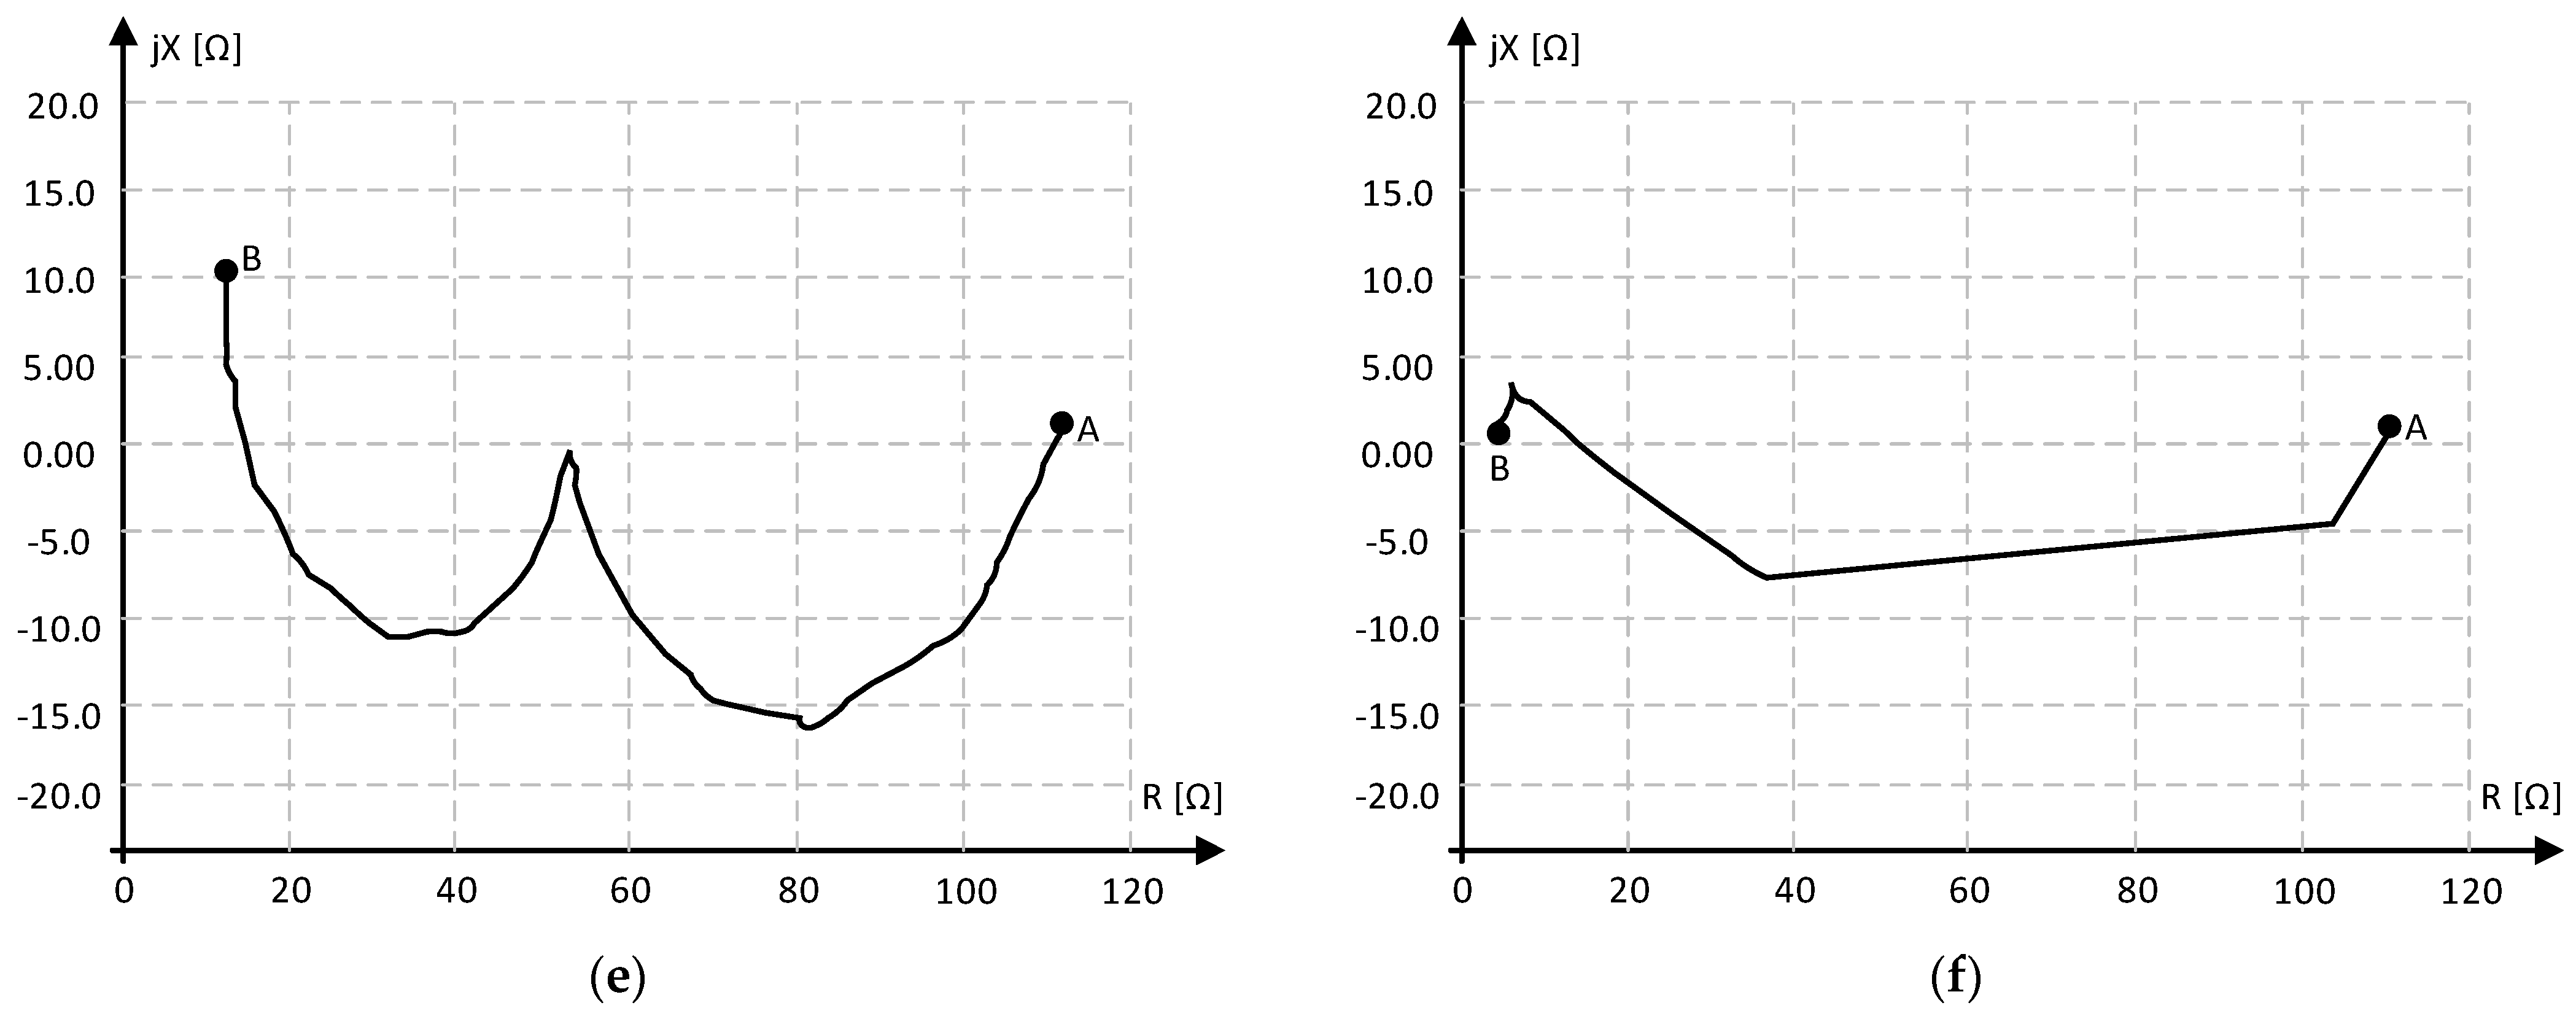
The results of impedance trajectories for all analyzed fault cases are presented in Figure 13. The point “A” is an impedance for normal conditions (healthy system) while the point “B” is an impedance for faulty conditions (faulty system). For both fault types located at 49 km at the far-end, the impedance changes are relatively small. For other fault locations (1 km—close to the near-end and 25 km—middle of the ETH-PiP) the change of measured impedance is much more significant.
Based on the above results and additional simulations for intermediate fault locations (not presented in the paper), a dedicated impedance zone was proposed, in which the fault will be detected and distance protection relay 21 will be triggered (see gray rectangle KLMN in Figure 12). This zone is identical for each fault type. The simulation tests confirmed that the distance protection relay will detect faults up to 49 km (98%) of the analyzed case for the ETH-PIP line, irrespective of whether for single-phase or phase-to-phase faults.

6. Conclusions

The reported tests and analyses lead to a conclusion that protection function 67N with the characteristic angle of 90° can selectively clear faults that occur up to the 47 km distance (94% of the entire length). This conclusion is specific to the example ETH-PIP analyzed here and the minimal starting value of residual current predetermined of I0 = 0.01 A. An additional assumption was made that the relay actively measures the value of 3I0 current (tripled residual current). In the case of single I0 current measurements, the maximum distance of operation is shortened.
The distance relay 21 can be used to protect the ETH-PIP line. For the analyzed case it clears single-phase and phase-to-phase faults effectively up to 49 km (98% of the entire length) ensuring selectivity of the faulty phase. Additionally, supply voltage changes do not have an impact on the relay behavior and once correctly set impedance zone is valid for all supply voltages.
However, it should be noted that for faults that occur at the far-end of the ETH-PIP line, the changes in the line impedance measured can be too small to be measured accurately by the distance relay 21. Therefore, it is highly recommended to validate the applicability range of commercial distance protection relays to the ETH-PiP line where detailed mapping of fault types and fault locations. An example of such validation is a subject of current research.

Author Contributions

Conceptualization, R.J. and R.K.; methodology, R.J., M.L., R.K. and M.J.; software, M.J., K.K., L.N. and R.S.; validation, M.L., J.E.-M., R.K. and M.S.; formal analysis, R.J., R.K. and M.J.; writing—original draft preparation, R.K., M.J., K.K. and L.N.; writing—review and editing, R.J., M.L., J.E.-M. and M.S., visualization, R.J. and M.J.; project administration, R.J., J.E.-M. and R.K. All authors have read and agreed to the published version of the manuscript.

Funding

This research received no external funding.

Data Availability Statement

The data presented in this study are available on request from the corresponding author.

Conflicts of Interest

The authors declare no conflicts of interest.

References

  1. Durham, R.A.; Brinner, T.R. Oilfield Electric Power Distribution. IEEE Trans. Ind. Appl. 2015, 51, 3532–3547. [Google Scholar] [CrossRef]
  2. Gooris, F.; Ansart, B.; Rageot, O.; Kaye, D. Electrically Trace Heated Pipe in Pipe: Technology Upgrade for Extended Application Range. In Proceedings of the Offshore Technology Conference, Houston, TX, USA, 2–5 May 2016. [Google Scholar] [CrossRef]
  3. Hamill, M.; Chakkalakal, F.; Beres, J. Building the World’s Longest Heated Pipeline—A Technology Application Review. IEEE Trans. Ind. Appl. 2017, 53, 709–717. [Google Scholar] [CrossRef]
  4. Ansart, B.; Marret, A.; Parenteau, T.; Rageot, O. Technical and Economical Comparison of Subsea Active Heating Technologies. In Proceedings of the Offshore Technology Conference-Asia, Kuala Lumpur, Malaysia, 25–28 March 2014. OTC-24711-MS. [Google Scholar]
  5. Doughlas, P.W.; Ervina, W.; Janardhan, D. Subsea Long-Distance Tie-Back. In Proceedings of the Offshore Technology Conference, Houston, TX, USA, 6–9 May 2019. OTC-29319-MS. [Google Scholar]
  6. Jez, R.; Lazarczyk, M. Understanding Trace-Heated Pipelines Electrical Protection Challenges and Associated Solutions. In Proceedings of the 2021 IEEE/IAS 57th Industrial and Commercial Power Systems Technical Conference (I&CPS), Las Vegas, NV, USA, 27–30 April 2021; pp. 1–9. [Google Scholar]
  7. Official Webpage of Matlab/Simulink Package. Available online: https://www.mathworks.com/products/simulink.html (accessed on 10 July 2024).
  8. Official Webpage of PSCAD Package. Available online: https://www.pscad.com/ (accessed on 10 July 2024).
  9. Official Webpage of ATP-EMTP Package. Available online: https://www.atpdraw.net/ (accessed on 10 July 2024).
  10. Official Webpage of ETAP Package. Available online: https://etap.com/ (accessed on 10 July 2024).
  11. Zolfaghari, M.; Chabanlo, R.M.; Abedi, M.; Shahidehpour, M.A. Robust Distance Protection Approach for Bulk AC Power System Considering the Effects of HVDC Interfaced Offshore Wind Units. IEEE Syst. J. 2018, 12, 3786–3795. [Google Scholar] [CrossRef]
  12. Senarathna, T.S.S.; Hemapala, K.T.M.U. Optimized Adaptive Overcurrent Protection Using Hybridized Nature-Inspired Algorithm and Clustering in Microgrids. Energies 2020, 13, 3324. [Google Scholar] [CrossRef]
  13. Jez, R.; Ejma-Multanski, J.; Vivet, R. On the Modelling of Long Heating Cables for Electrically Trace Heated Pipe-in-Pipe ETH-PiP Systems. In Proceedings of the Offshore Technology Conference, Houston, TX, USA, 4–7 May 2020. [Google Scholar] [CrossRef]
  14. Kaye, D. Effective Flow Assurance Method for Long Tiebacks: Electrically Trace Heated Pipe-in-Pipe (ETH-PiP), TechnipFMC TechTalk. 2022. Available online: https://www.youtube.com/watch?v=6ku57Lwfuo4 (accessed on 10 July 2024).
  15. Kak, A.; Meng, W.; Carnahan, N. Flow Assurance; Wiley: Hoboken, NJ, USA, 2017. [Google Scholar] [CrossRef]
  16. Sarmento, R.C.; Ribbe, A.S.; Azevedo, L. Wax Blockage Removal by Inductive Heating of Subsea Pipelines. Heat Transf. Eng. 2004, 7, 2–12. [Google Scholar] [CrossRef]
  17. Makwashi, N.; Akubo, S.; Sarkodie, K.; Zhao, D. Engaging best practices during waxy crude oil production to prevent deposition in the subsea pipeline. In Proceedings of the International Conference on Professionalism and Ethics in Construction, London, UK, 22–23 November 2018. [Google Scholar]
  18. Abass, A. Olajire: Review of wax deposition in subsea oil pipeline systems and mitigation technologies in the petroleum industry. Chem. Eng. J. Adv. 2021, 6, 100104. [Google Scholar] [CrossRef]
  19. Nysveen, A.; Kulbotten, H.; Lervik, J.K.; Bornes, A.H.; Hoyer-Hansen, M.; Bremnes, J.J. Direct Electrical Heating of Subsea Pipelines—Technology Development and Operating Experience. IEEE Trans. Ind. Appl. 2007, 43, 118–129. [Google Scholar] [CrossRef]
  20. Shin, H.; Chae, S.H.; Kim, E.-H. Design of Microgrid Protection Schemes Using PSCAD/EMTDC and ETAP Programs. Energies 2020, 13, 5784. [Google Scholar] [CrossRef]
  21. Jones, D.; Kumm, J.J. Future Distribution Feeder Protection Using Directional Overcurrent Elements. IEEE Trans. Ind. Appl. 2014, 50, 1385–1390. [Google Scholar] [CrossRef]
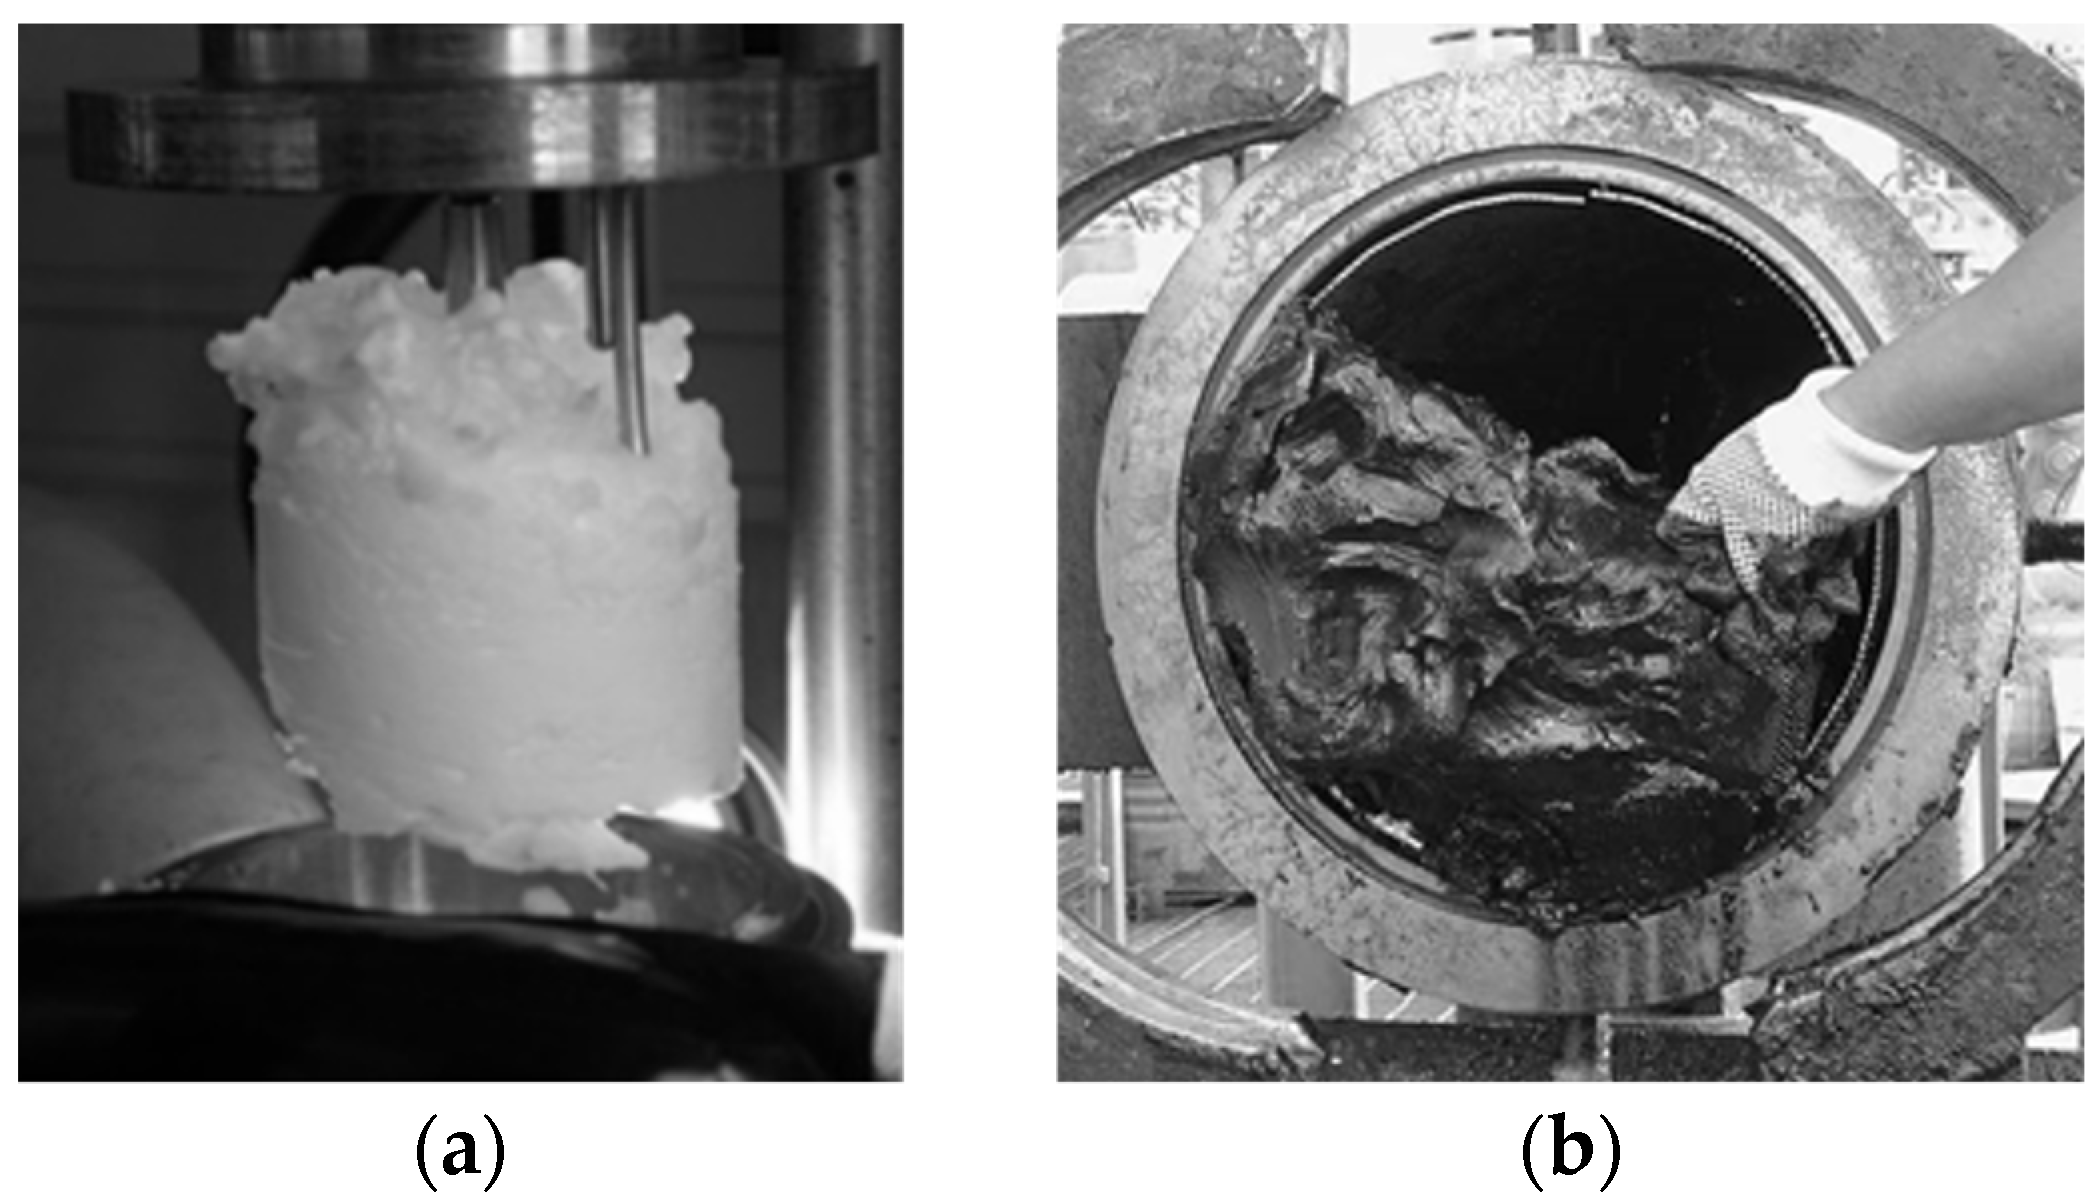
Figure 1. Appearance of plugs in a flowline [14]: (a) hydrate, (b) wax.
Energies 17 03825 g001
Figure 2. Flowchart of the methodology used in the study.
Energies 17 03825 g002
Figure 3. ETH-PiP heated pipeline arrangement: (a) pipeline structure; (b) power system topology.
Energies 17 03825 g003
Figure 4. Analyzed ETH-PiP system topology.
Energies 17 03825 g004
Figure 5. Overview of the ETH-PiP model in PSCAD software: generator, step-down transformer, switchgear unit, four heating cables (each cable consists of an umbilical cable and an ETH cable).
Energies 17 03825 g005
Figure 6. Dependence of main electrical protection parameters on a fault type and fault location: (a) phase current Iph; (b) phase–phase voltage Uph; (c) residual current 3I0; (d) residual voltage 3U0; (note: results include transducers ratio: voltage Vu = 54.54, current Vi = 100).
Energies 17 03825 g006
Figure 7. Vector plot presenting relationship between zero-sequence voltage and zero-sequence current in a healthy and faulty line of isolated network: (a) healthy line; (b) faulty line.
Energies 17 03825 g007
Figure 8. Working principle of distance protection of a power line: (a) generalized topology of a power line with measurements location (MP) and several fault locations (F1, F2, Fn), (b) the power line impedance measured in MP location for (F1, F2, Fn) fault locations. Note: CT—current transducer, VT—voltage transducer, R—resistance (real part or impedance Z), jX—reactance (imaginary part of impedance).
Energies 17 03825 g008
Figure 9. Block scheme of impedance variation (distance protection) function.
Energies 17 03825 g009
Figure 10. Impedance change trajectory: (a) theoretical; (b) obtained from simulation model.
Energies 17 03825 g010
Figure 11. Phasors of two neighboring ETH lines during the fault in line L1.
Energies 17 03825 g011
Figure 12. Zone setting of distance protection 21 (note: impedance values are based on measurements of secondary sides of voltage and current transducers).
Energies 17 03825 g012
Figure 13. Impedance change trajectory for different locations and fault types: (a) phase-to-screen; location 49 km; (b) phase-to-phase; location 49 km; (c) phase-to-screen; location 25 km; (d) phase-to-phase; location 25 km; (e) phase-to-screen; location 1 km; (f) phase-to-phase; location 1 km.
Energies 17 03825 g013aEnergies 17 03825 g013b
Table 1. Assumed parameters of the analyzed ETH-PiP case.
Power System ParameterSymbolValue
Nominal phase to phase voltageUn5.0 kV, 50 Hz
Nominal currentIn43.7 A
Number of energized lines/spare linesno/ns2/2
Entire length of umbilical cablelUMB1.5 km
Resistance of umbilical conductorRUMB0.19 Ω/km
Inductance of umbilical conductorLUMB0.35 mH/km
Capacitance between umbilical conductor and screenCUMB0.40 µF/km
Resistance of umbilical screenRUMB_sc5.00 Ω/km
Inductance of umbilical screenLUMB_sc0.50 mH/km
Entire length of ETH cablelETH50.0 km
Resistance of ETH conductorRETH1.20 Ω/km
Inductance of ETH conductorLETH0.35 mH/km
Capacitance between conductor and screenCETH0.20 µF/km
Resistance of ETH screenRETH_sc5.00 Ω/km
Inductance of ETH screenLETH_sc0.50 mH/km
Source impedanceZSource(3.3 + j40.8) mΩ
Table 2. Phase current Iph, phase–phase voltage Uph, residual current 3I0 and residual voltage 3U0 dependence on a fault type and fault location (note: results include transducers ratio: voltage Vu = 54.54, current Vi = 100).
Fault Location (Distance Measured from Near-End) [km]
1.05.010.015.020.025.030.035.040.045.049.0
fault between conductor and screen in one phase (1 ph. fault)
Iph [A]0.700.650.590.560.520.500.480.470.450.440.44
Uph [V]10.3724.0333.2739.3142.2244.4845.5246.6647.6449.5251.98
3I0 [A]0.250.200.160.130.100.080.070.050.040.020.00
3U0 [V]145.41117.9592.6573.9060.3649.0239.7430.7122.0912.142.69
fault between conductor and screen in two phases (2 ph. fault)
Iph [A]14.133.661.911.301.000.810.690.600.530.480.45
Uph [V]47.1153.5855.6656.5556.2755.9255.1254.4053.5452.9252.75
3I0 [A]0.120.100.080.070.050.040.040.030.020.040.00
3U0 [V]72.9060.2048.0638.8631.8625.9720.9616.1111.456.191.35
fault between conductor and screen in three phases (3 ph. fault)
Iph [A]16.674.182.151.451.090.880.730.630.550.490.45
Uph [V]49.3152.0552.4552.5952.6652.7052.7352.7552.7652.7852.78
3I0 [A]0.000.000.000.000.000.000.000.000.000.000.00
3U0 [V]0.000.000.000.000.000.000.000.000.000.000.00
normal operating condition—no fault (reference case)
50.0
Iph [A]0.44
Uph [V]52.79
3I0 [A]0.00
3U0 [V]0.00
Disclaimer/Publisher’s Note: The statements, opinions and data contained in all publications are solely those of the individual author(s) and contributor(s) and not of MDPI and/or the editor(s). MDPI and/or the editor(s) disclaim responsibility for any injury to people or property resulting from any ideas, methods, instructions or products referred to in the content.