Article

Evaluation of Transport–Burnup Coupling Strategy in Double-Heterogeneity Problem

1
Shanghai Institute of Applied Physics, Chinese Academy of Sciences, Shanghai 201800, China
2
Fundamental Science on Nuclear Safety and Simulation Technology Laboratory, College of Nuclear Science and Technology, Harbin Engineering University, Harbin 150001, China
3
Laboratory for Advanced Nuclear Energy Theory and Applications, Zhejiang Institute of Modern Physics, Department of Physics, Zhejiang University, Hangzhou 310058, China
*
Authors to whom correspondence should be addressed.
Energies 2024, 17(15), 3792; https://doi.org/10.3390/en17153792
Submission received: 20 June 2024 / Revised: 26 July 2024 / Accepted: 26 July 2024 / Published: 1 August 2024
(This article belongs to the Special Issue Advanced Technologies in Nuclear Engineering)

Abstract

:
The simulation of fuel composition requires coupled calculations of neutron transport and burnup. It is generally assumed that the neutron flux density and cross-sections remain constant within a burnup step. However, when there are strong absorber poisons present, the reaction rates of the absorbers change too rapidly over time, necessitating extremely fine step sizes to ensure computational accuracy, which in turn leads to low computational efficiency. As a type of accident tolerant fuel (ATF), fully ceramic micro-encapsulated (FCM) fuel is a promising new type of nuclear fuel. Accelerated algorithms for burnup calculations of FCM fuel containing gadolinium isotopes have been developed based on the ALPHA code, including the projected predictor–corrector (PPC), the log-linear rate (LLR), and the high-order predictor–corrector (HOPC) methods (including CE/LI, CE/QI, LE/LI, and LE/QI). The performances of different algorithms under the two forms of Gd2O3 existence were analyzed. The numerical results show that the LE/QI method performs the best overall. For Gd2O3 existing in both forms, the LE/QI algorithm can maintain accuracy with a burnup step size of up to 1.0 GWd/tU, keeping the infinite multiplication factor kinf within 100 pcm, and it exhibits high accuracy in simulating the atomic number densities of Gd-155 and Gd-157 throughout the burnup process.

1. Introduction

Burnup calculation is an indispensable part of the numerical simulation of reactor physics. By solving the point depletion equation of each burnup region, the time-dependent atom number density is provided for neutron transport calculation. Accurately predicting the material composition changes in fuel assemblies during irradiation is crucial for nuclear fuel management and reactor design. Gadolinium oxide (Gd2O3), an important neutron absorber, plays a role in adjusting reactivity in nuclear fuel and is widely used in light water reactors (LWRs), including pressurized water reactors (PWRs) and boiling water reactors (BWRs) [1]. In LWRs, Gd2O3 is blended with uranium dioxide (UO2) fuel to extend the operational life of the reactor and flatten the power distribution. Owing to their high neutron absorption cross-section, gadolinium isotopes Gd-155 and Gd-157 are employed to offset the initial surplus of positive reactivity in the reactor core. As these isotopes undergo burnup concurrently with the fuel, the positive reactivity is progressively liberated. The burnup dynamics of Gd2O3 exhibit a notable complexity, thus they require refined computational models to accurately capture and describe their behavior. In the depletion calculations of fuel assemblies containing Gd2O3, a gadolinia-bearing fuel pellet is annularly divided into regions ranging in number from several to more than a dozen [2]. In asymmetric problems, further subdivision in the circumferential quadrants may be required. However, this is still not sufficient; due to the strong absorption effects of Gd-155 and Gd-157, their reaction rates change too rapidly, and even with the traditional predictor—corrector (PC) method [3,4,5,6] extremely fine time steps are needed.
To enhance the efficiency of assembly burnup calculations, a series of burnup calculation methods for Gd2O3 have been developed in recent years. In traditional predictor–corrector methods, it is assumed that the reaction rates in the burnup equation remain constant over a time step, while many improved methods have challenged this assumption, taking into account the variation of reaction rates within a time step. Yamamoto proposed the projected predictor–corrector (PPC) [7] method for PWR assembly burnup calculations in 2009. The PPC method takes advantage of the correlation between the number density of fissionable materials and reaction rates, improving the accuracy of microscopic reaction rates in the corrector step by estimating the “projected” reaction rates. The PPC method has been implemented in the AEGIS [8] code and has demonstrated better performance in reducing temporal discretization errors in calculations of PWR assembly problems. Its accuracy is comparable to that of the conventional PC method, which uses a time step half the length of the PPC method’s. Subsequently, the log-linear rate (LLR) [9] method was introduced in the joint development project of MC21 (2010). This method assumes that the microscopic reaction rates of strongly absorbing nuclides are linearly related to the natural logarithm of the nuclide’s atom number density. The LLR method has a significant advantage over the PPC method in predicting the concentrations of Gd-155 and Gd-157. The CASMO-5 code employs the quadratic gadolinium depletion model [8], which posits that the microscopic reaction rates of Gadolinium isotopes are quadratic functions of the Gd-155 atom number density. Numerical results indicate that the quadratic model can achieve satisfactory accuracy using four times the traditional PC step length. Isotalo [10] systematically proposed higher-order coupling methods for burnup—transport in 2011. Based on the traditional predictor–corrector (PC) method, linear extrapolation instead of constant extrapolation as the prediction step and quadratic interpolation instead of linear interpolation as the correction step are proposed. These high-order methods were implemented in Serpent [11]. The results showed that under thermal spectrum conditions, the performance of using linear extrapolation in the prediction step was superior to that of constant extrapolation, while the effect of quadratic interpolation in the correction step was not as good as linear interpolation. Subsequently, Isotalo [12] conducted a more in-depth comparison of the performance of various higher-order methods in 2015. The test cases included PWR, BWR, SFR (sodium-cooled fast reactor), and a PWR constant flux density case, revealing that the LE/QI (linear extrapolation with quadratic interpolation) method performed the best in most situations.
Previous research on various burnup–transmutation coupling strategies for Gd2O3 was primarily focused on conventional light water reactor (LWR) fuels. As a type of accident tolerant fuel, the fully ceramic micro-encapsulated (FCM) [13] fuel offers better fuel utilization, thermal conductivity, and fission product containment compared to traditional fuels, making it a promising new type of nuclear fuel in recent years. FCM fuel exhibits a double heterogeneity (DH) not found in conventional LWR fuels, which is characterized by the fuel pellets and the moderator, the tristructural isotropic (TRISO) particles, and the surrounding matrix. It should be noted that the double heterogeneity mentioned in this article refers specifically to the FCM fuel in LWRs, not the fuel pebbles of high-temperature reactors (HTRs) [14,15]. Among the many designs for LWRs using FCM fuel, the dispersed particle poison design often employs Gd2O3 [16,17,18]. Currently, there has been no research on the burnup calculation methods for Gd2O3 under the double heterogeneity conditions of FCM fuel. In the design of the FCM fuel element, when using pure gadolinium Oxide (Gd2O3) in the form of particles or coatings as a burnable poison, the requirements for burnup step sizes are more refined due to the higher initial concentrations of Gd-155 and Gd-157. Therefore, building upon the previously developed computational code ALPHA [19] for FCM fuel assembly, this paper has developed a variety of accelerated calculation methods for the strong absorber Gd2O3, including PPC, LLR, and four high-order burnup methods: CE/LI, CE/QI, LE/LI, and LE/QI. Additionally, this research analyzes the performance of various algorithms when Gd2O3 is present in the form of a particle core and as a coating.
The organization of this paper is as follows. Section 2 briefly describes the double heterogeneity (DH) burnup calculation capability of ALPHA and various transport–burnup coupling strategies developed in the program for poison. Section 3 presents the analysis results of various coupling strategies. Conclusions are drawn in Section 4.

2. Deterministic Code and Coupling Strategies

2.1. Double Heterogeneity Lattice Code ALPHA

2.1.1. Treatment of Particles in ALPHA

The ALPHA code is an advanced high-fidelity lattice calculation tool, developed by Harbin Engineering University, which has the ability to handle conventional pressurized water reactor fuel and random medium fuel elements. When dealing with random medium fuels, ALPHA adopts an implicit modeling method for random particles, and the transport calculation adopts the MOC [20,21] (method of characteristics) method based on the Sanchez-Pomraning [22] method (Sanchez–MOC). This method can merge particles according to the traditional flat source region, while providing the distribution of micro flux inside the particles, making it possible to refine fuel burnup calculation.
In the Sanchez–MOC model, a statistically equivalent macroscopic cross-section is defined for materials containing stochastically distributed particles, as shown in Equation (1).
Σ ˜ t = Σ t , m a t r i x + V t o t a l V m a t r i x i = 1 I k = 1 K p i , k Σ t , i k E i , k G
In Equation (1), Σ ˜ t and Σ t , m a t r i x are the statistically equivalent macroscopic cross-section and the total macroscopic cross-section of the matrix, while V t o t a l and V m a t r i x are the total volume of the fuel element and the matrix, respectively. The subscript i represents the type of particle and k is the layer number of particles. p i , k represents the ratio of the volume of layer k of the i th particle to the total fuel element volume. Σ t , i k is the macroscopic total cross-section of the k th layer material of the i th particle, and E i , k G is the probability of neutrons generated in the k th layer material of the i th particle.
The Sanchez–MOC method merges particles according to the traditional flat source region while providing internal particle flux distribution, which enables ALPHA to calculate fine internal particle burnup. The neutron flux inside the particles reconstructed by the Sanchez–MOC method is shown in Equation (2):
ϕ ¯ i , k = E ^ i , k G ϕ ¯ 0 + ( E i , k G E ^ i , k G ) φ a s + 1 V i k Σ t , i k l = 1 K V i l q i l P i k , i l

2.1.2. DH Depletion Capability

In the burnup calculation of FCM fuel, due to the presence of TRISO particles, the data dimension of physical variables is much larger than the uniformity problem. To reduce memory usage, ALPHA adopts a simplified burnup chain of 198 nuclides derived from HELIOS1.11 [23]. This chain contains 28 actinide nuclides, 140 fission product nuclides, and 50 absorber nuclides. The types of decay reactions include beta decay and isomeric transitions. Neutron reactions include ( n , γ ) , ( n , f ) , ( n , 2 n ) , and ( n , 3 n ) reactions. The multi-group cross-section library of nuclides comes from ENDF/B-VII.0 [24].
ALPHA has a built-in 16-order CRAM [25] solver for solving the point depletion equation, and Formula (3) is the solution formula of the CRAM algorithm. In Formula (3), α i is the residue of the pole θ i , and k is the order of the rational approximation.
N ( t ) = e A t N 0 r ^ k , k ( x ) = α 0 n 0 2 Re { i = 1 k / 2 [ ( θ i I + A t ) 1 α i n 0 ] }
ALPHA supports both macroscopic and macroscopic discretization of the burnup region. The macroscopic burnup region refers to the classification of particles in the radial direction of the fuel pellet, while the microscopic burnup zone refers to the burnup zone within the particle. Both the macroscopic and microscopic discretizations are divided by equal volume.

2.2. Coupling Strategies

2.2.1. Predictor–Corrector (PC)

A common and classic scheme for transport–burnup coupling is the predictor–corrector method. In this method, the nuclide density is obtained by averaging the densities from the predictor and corrector steps. It allows for a larger step size to be adopted for the depletion calculation of strong absorbers, compared to the beginning of step (BOS) method. In the predictor–corrector method, the nuclide number density is calculated by Formula (4).
N n + 1 = N n + 1 P ( ϕ n , σ n ) + N n + 1 C ( ϕ n + 1 P , σ n + 1 P ) 2
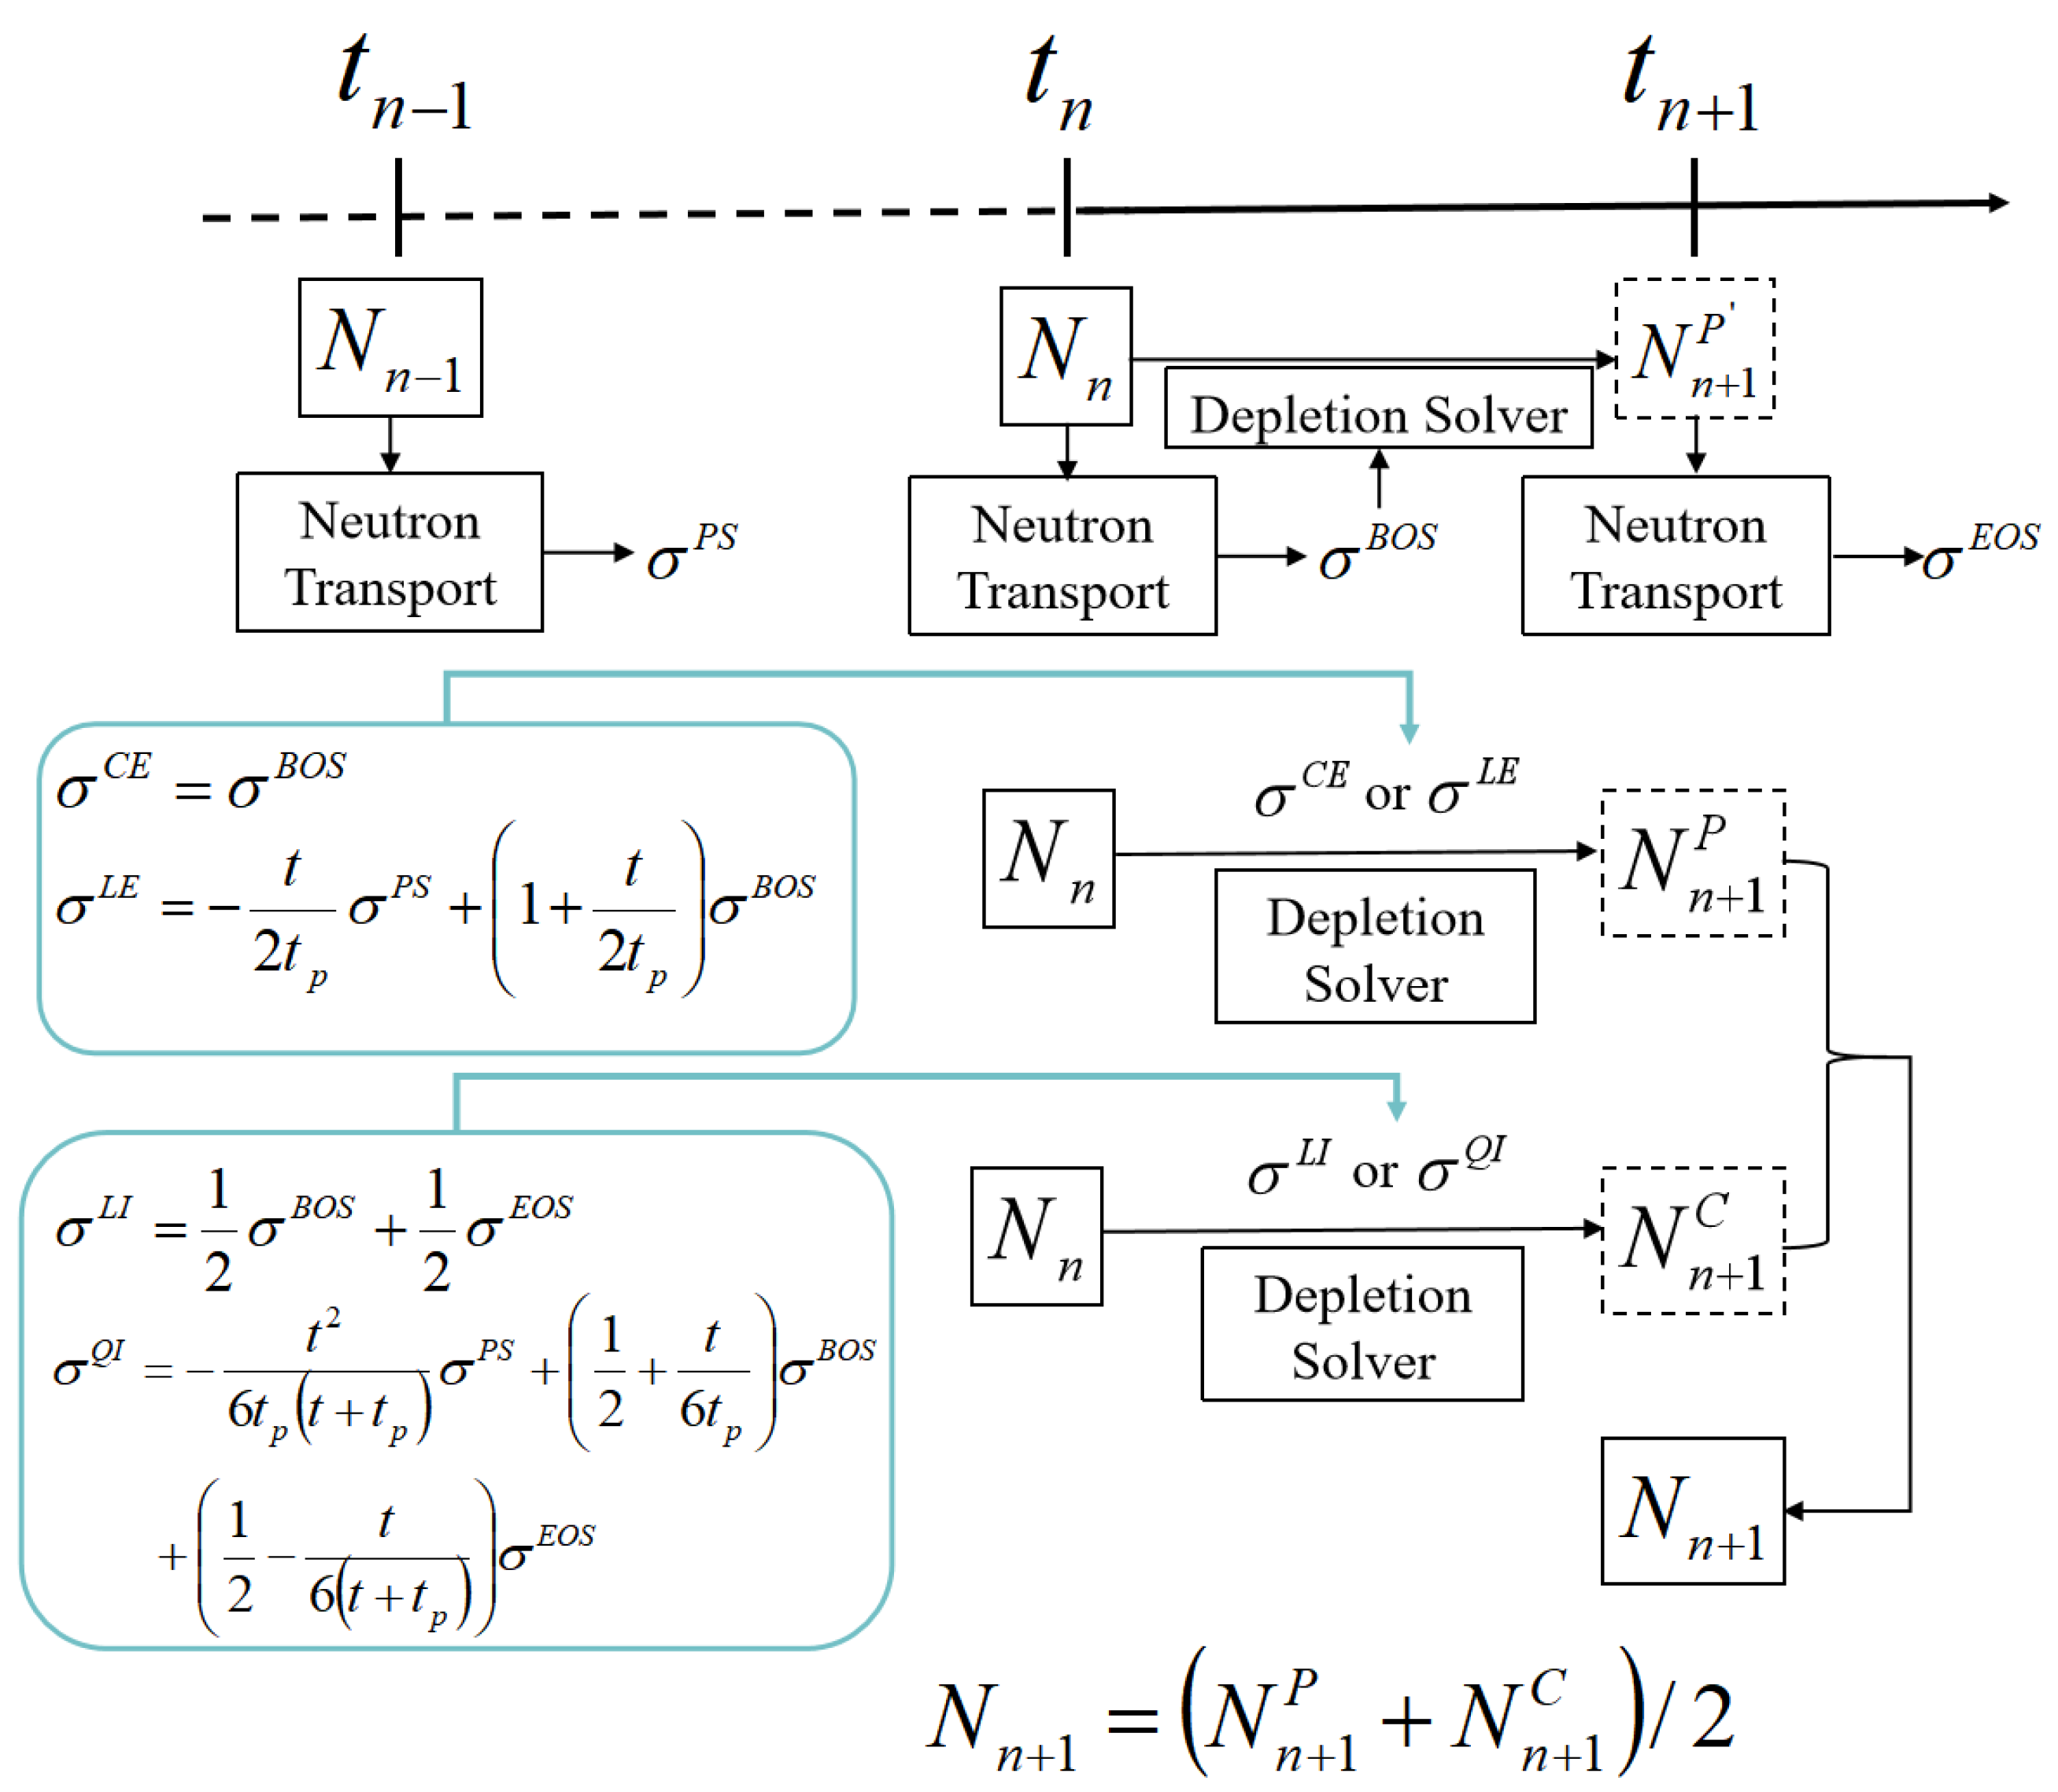
ϕ n and σ n are the one-group neutron flux and the microscopic cross-section at time t n , respectively. The nuclide densities N n + 1 P of the predictor step at time t n + 1 can be calculated with ϕ n and σ n . Then, the new one-group neutron flux ϕ n + 1 P and the microscopic cross-section σ n + 1 P at time t n + 1 are obtained with N n + 1 P . Next, the nuclide densities of the corrector step N n + 1 C are calculated with ϕ n + 1 P and σ n + 1 P , and the final nuclide densities are averaged by N n + 1 P and N n + 1 C . The explanation diagram of the predictor–corrector algorithm is shown in Figure 1.

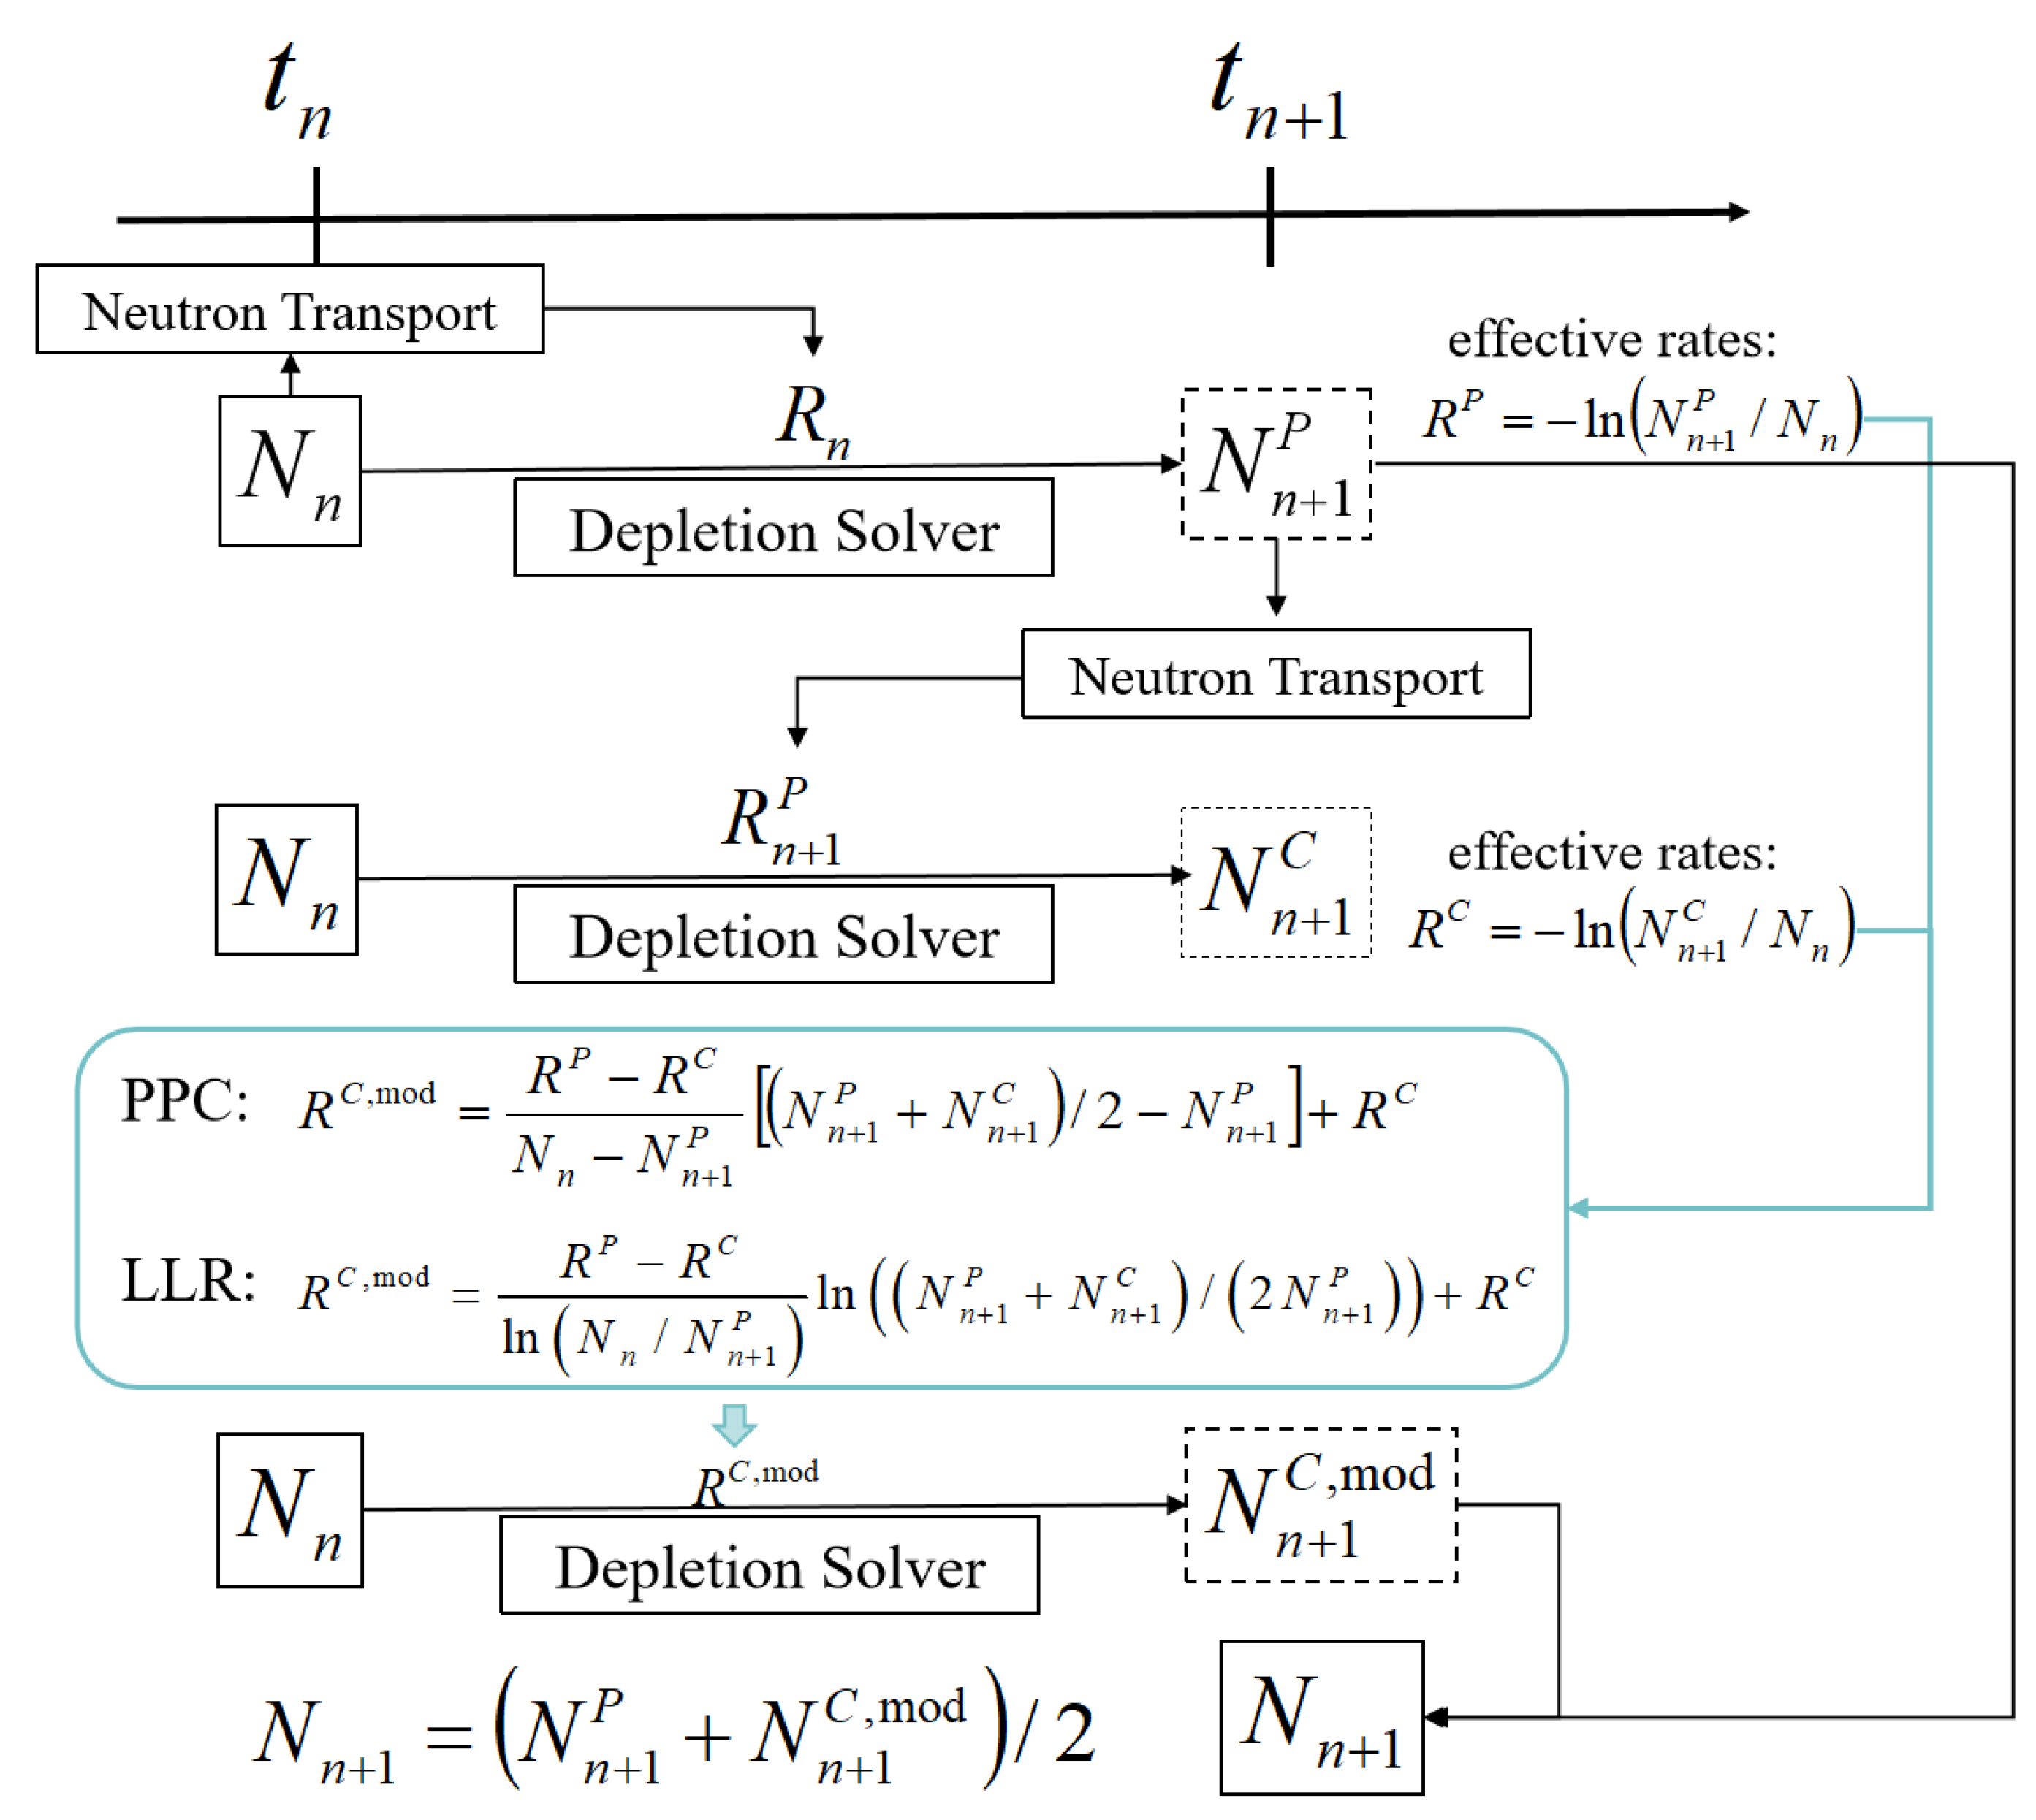
2.2.2. Projected Predictor–Corrector (PPC)

The assumption of the PPC method is that there is a linear relationship between the reaction rate of nuclides with strong absorption cross-sections and their nuclide densities. The detailed approach is as follows:
(1)
Based on the nuclide densities N n at time t n , the transport calculation is performed to obtain the microscopic reaction rate R n , and the nuclide densities N n + 1 P of the predictor step are obtained by solving the burnup equation with R n ;
(2)
Use N n + 1 P at time t n + 1 to perform the transport calculation to obtain the microscopic reaction rate R n + 1 P . Subsequently, the point depletion equation is solved to obtain the nuclide densities N n + 1 C of the corrector step;
(3)
Calculating the effective microscopic reaction rates R P and R C with Equations (5) and (6);
N n + 1 P = N n exp ( R P )
N n + 1 C = N n exp ( R C )
Then, the effective reaction rates can be obtained:
R P = ln ( N n + 1 P / N n )
R C = ln ( N n + 1 C / N n )
(4)
The effective reaction rates are calculated by the nuclide densities at the interval beginning point and the predictor nuclide densities. According to the assumption that the effective microscopic reaction rate is linearly related to the nuclide densities in one step, then the relationship between the nuclide densities and the effective reaction rates can be expressed as:
R = R P R C N n N n + 1 P ( N N n + 1 P ) + R C
(5)
A more accurate modified reaction rate corresponding to the nuclide densities N = ( N n + 1 P + N n + 1 C ) / 2 at time t n + 1 can be obtained with the above Equation (10);
R c , mod = R P R C N n N n + 1 P [ ( N n + 1 P + N n + 1 C ) / 2 N n + 1 P ] + R C
(6)
The nuclide densities of the corrector step are further corrected by using the modified microscopic reaction rates of the corrector step;
N n + 1 mod = N n exp ( R C , mod )
(7)
The final nuclide densities at time t n + 1 are averaged by the following equation:
N n + 1 = ( N n + 1 P + N n + 1 C , mod ) / 2
Compared with the conventional PC method, the PPC method only performs one additional burnup calculation at the predictor step and does not increase the total number of calculations. Therefore, the additional computational load can be considered negligible.

2.2.3. Log-Linear Rate Method (LLR)

The LLR method assumes that the microscopic reaction rate of the burnable poison nuclide is linearly related to the logarithm of its atomic number density. Then, Formula (9) becomes:
R = R P R C ln ( N n / N n + 1 P ) ln ( N / N n + 1 P ) + R C
The microscopic reaction rate correction expression of the corresponding corrector step is as follows:
R C , mod = R P R C ln ( N n / N n + 1 P ) ln ( ( N n + 1 P + N n + 1 C ) / ( 2 N n + 1 P ) ) + R C
The other steps of the LLR method are the same as those of the PPC method. The explanation diagram of the PPC and LLR algorithm is shown in Figure 2.

2.2.4. High-Order Predictor–Corrector (HOPC)

In the PC method, constant extrapolation is used to predict the atomic number density at the predictor step, and linear interpolation of the beginning of step (BOS) and end of step (EOS) reaction rates is used to perform the burnup calculation. In the HOPC method, the reaction rate at the beginning of the previous burnup step is also considered to construct a higher-order prediction form. Therefore, the constant extrapolation and linear fitting of the predictor step and corrector step of the conventional PC method can be replaced by linear and quadratic fitting, respectively. This method only requires storing the reaction rate of the previous step and does not necessitate additional transport calculations. In the HOPC method, the cross-sections within the burnup step are adjusted using Formula (15).
σ = w P S σ P S + w B O S σ B O S + w E O S σ E O S
where σ P S , σ B O S , and σ E O S are the microscopic cross-sections of the previous step, the beginning of this step, and the end of this step, respectively, while w P S , w B O S , and w E O S are the corresponding weights, as shown in Table 1. The neutron flux is also corrected using Formula (15).
In Table 1, t p is the time step of the previous burnup step and t is the time step of the current step. When calculating the prediction step, the reaction rate information at the end of the burn-up step is unknown, so the prediction step cannot be interpolated. The prediction step can be calculated with constant or linear extrapolation, and the correction step can be calculated with linear or quadratic interpolation. Therefore, there are four combination schemes, namely CE/LI, CE/QI, LE/LI, and LE/QI. The explanation diagram of the high-order algorithm is shown in Figure 3.

3. Numerical Results

3.1. Testing Cases

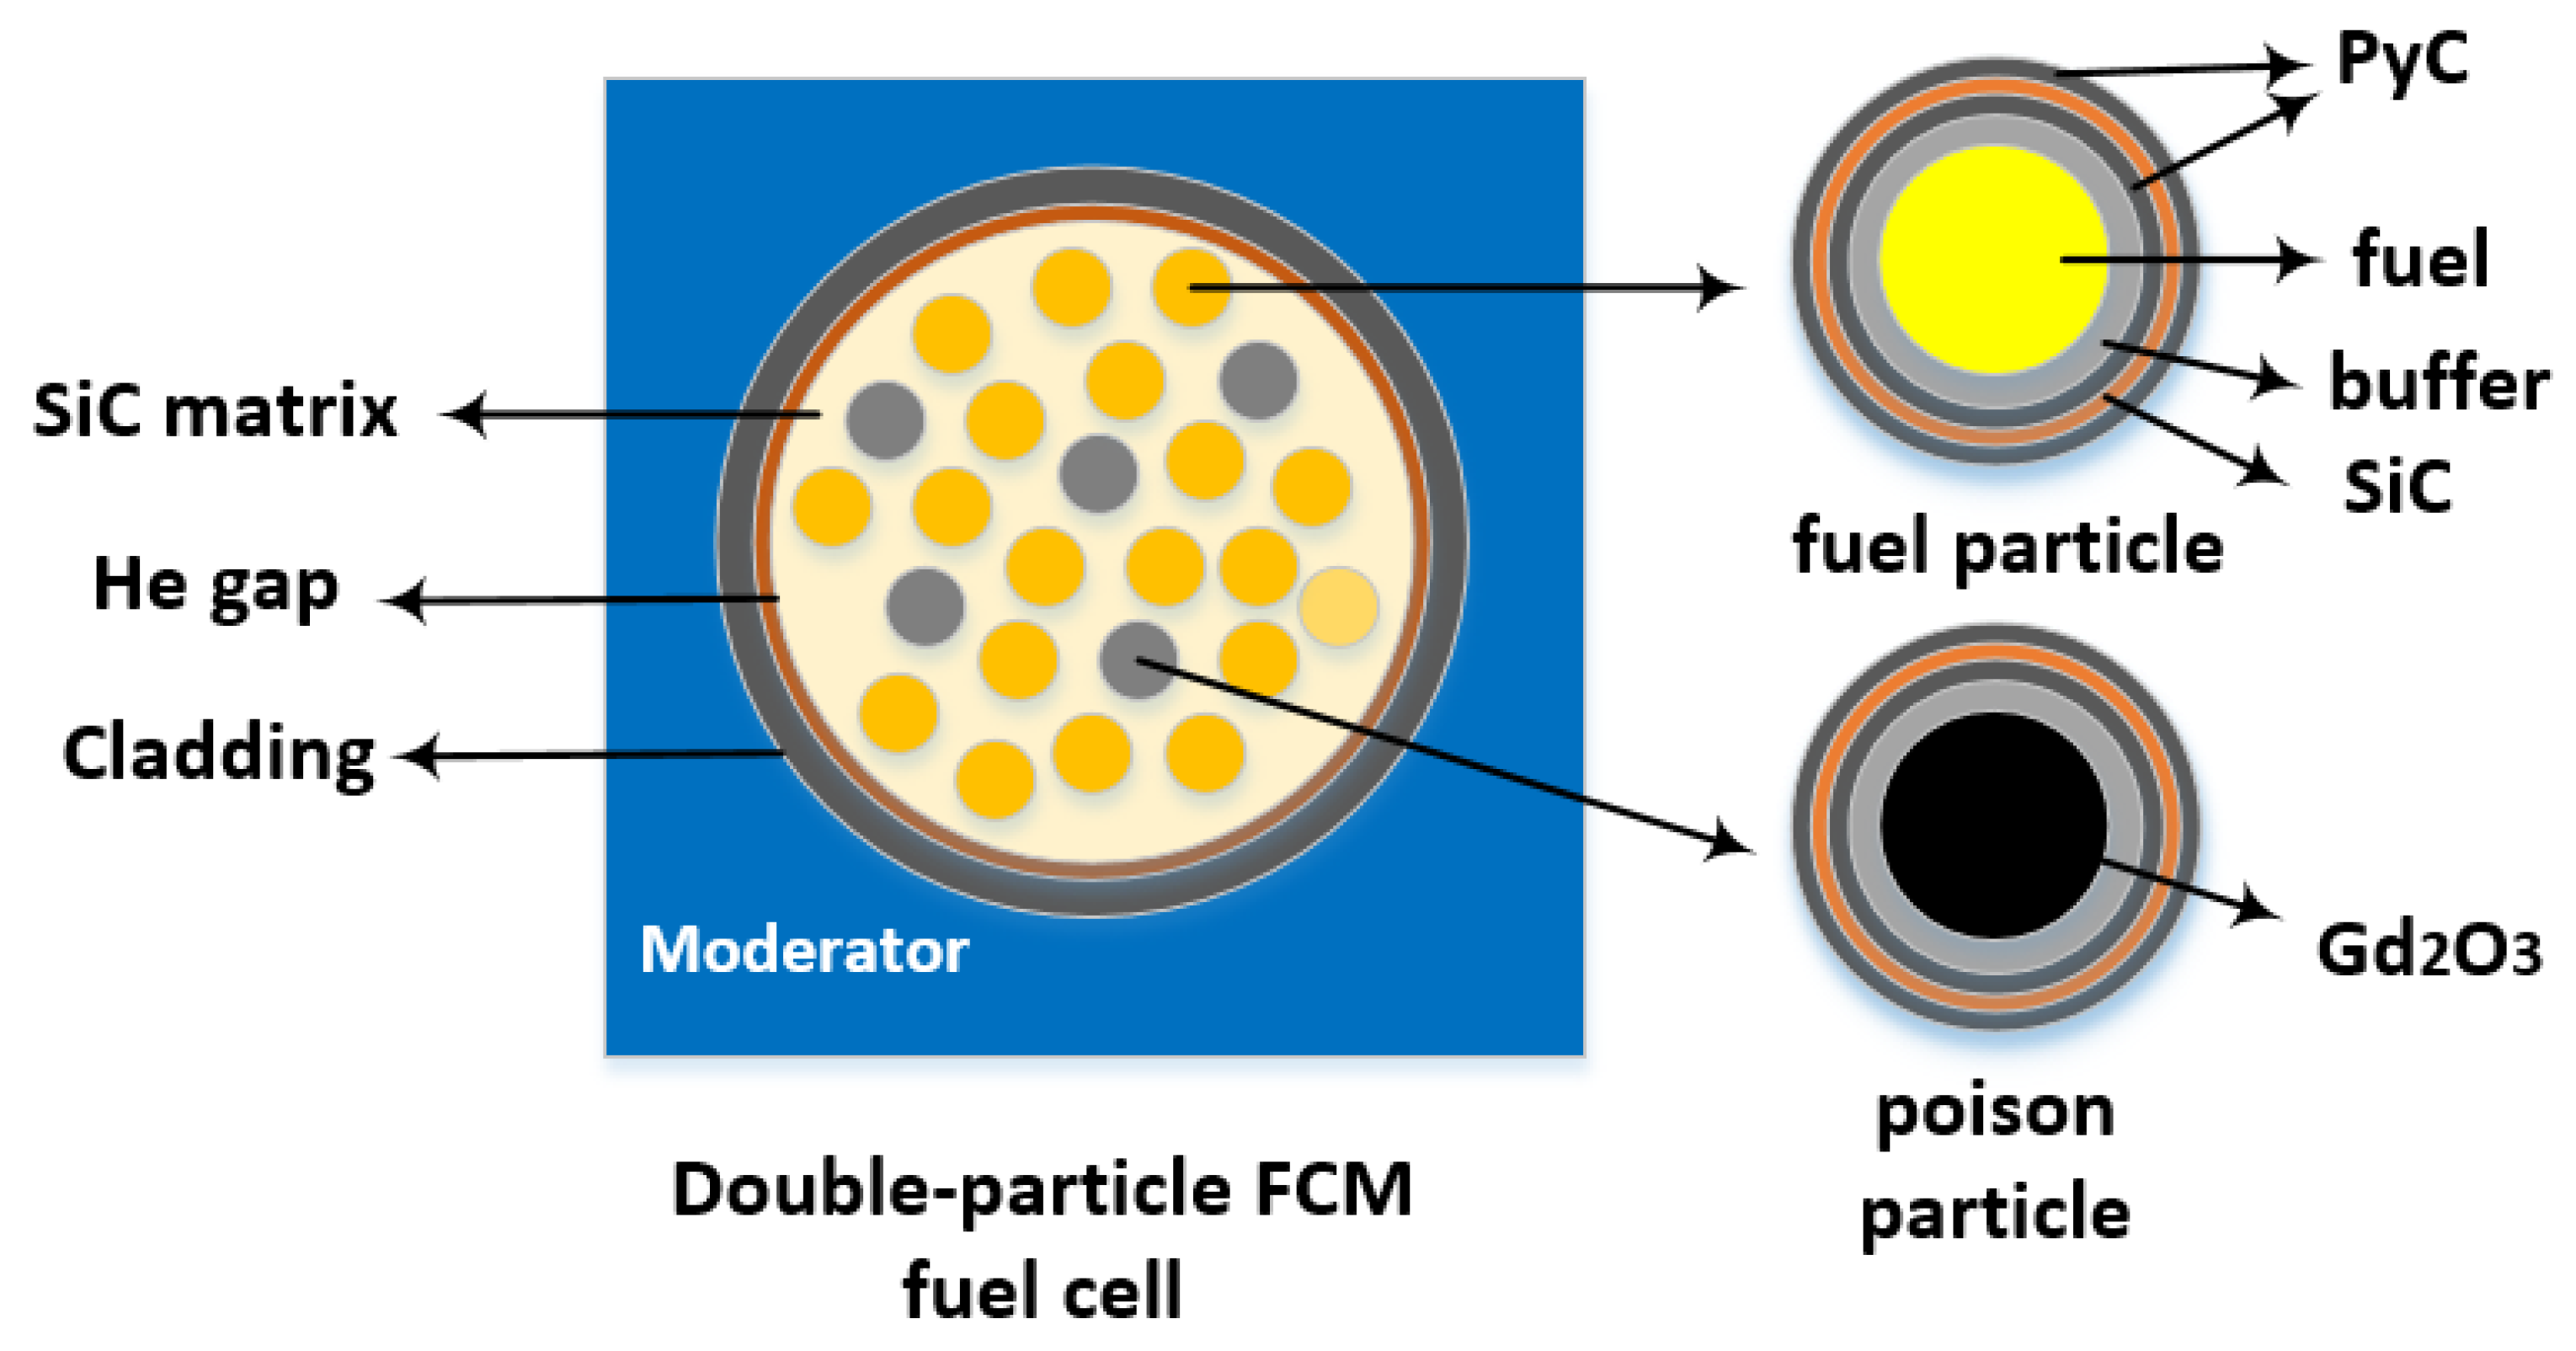
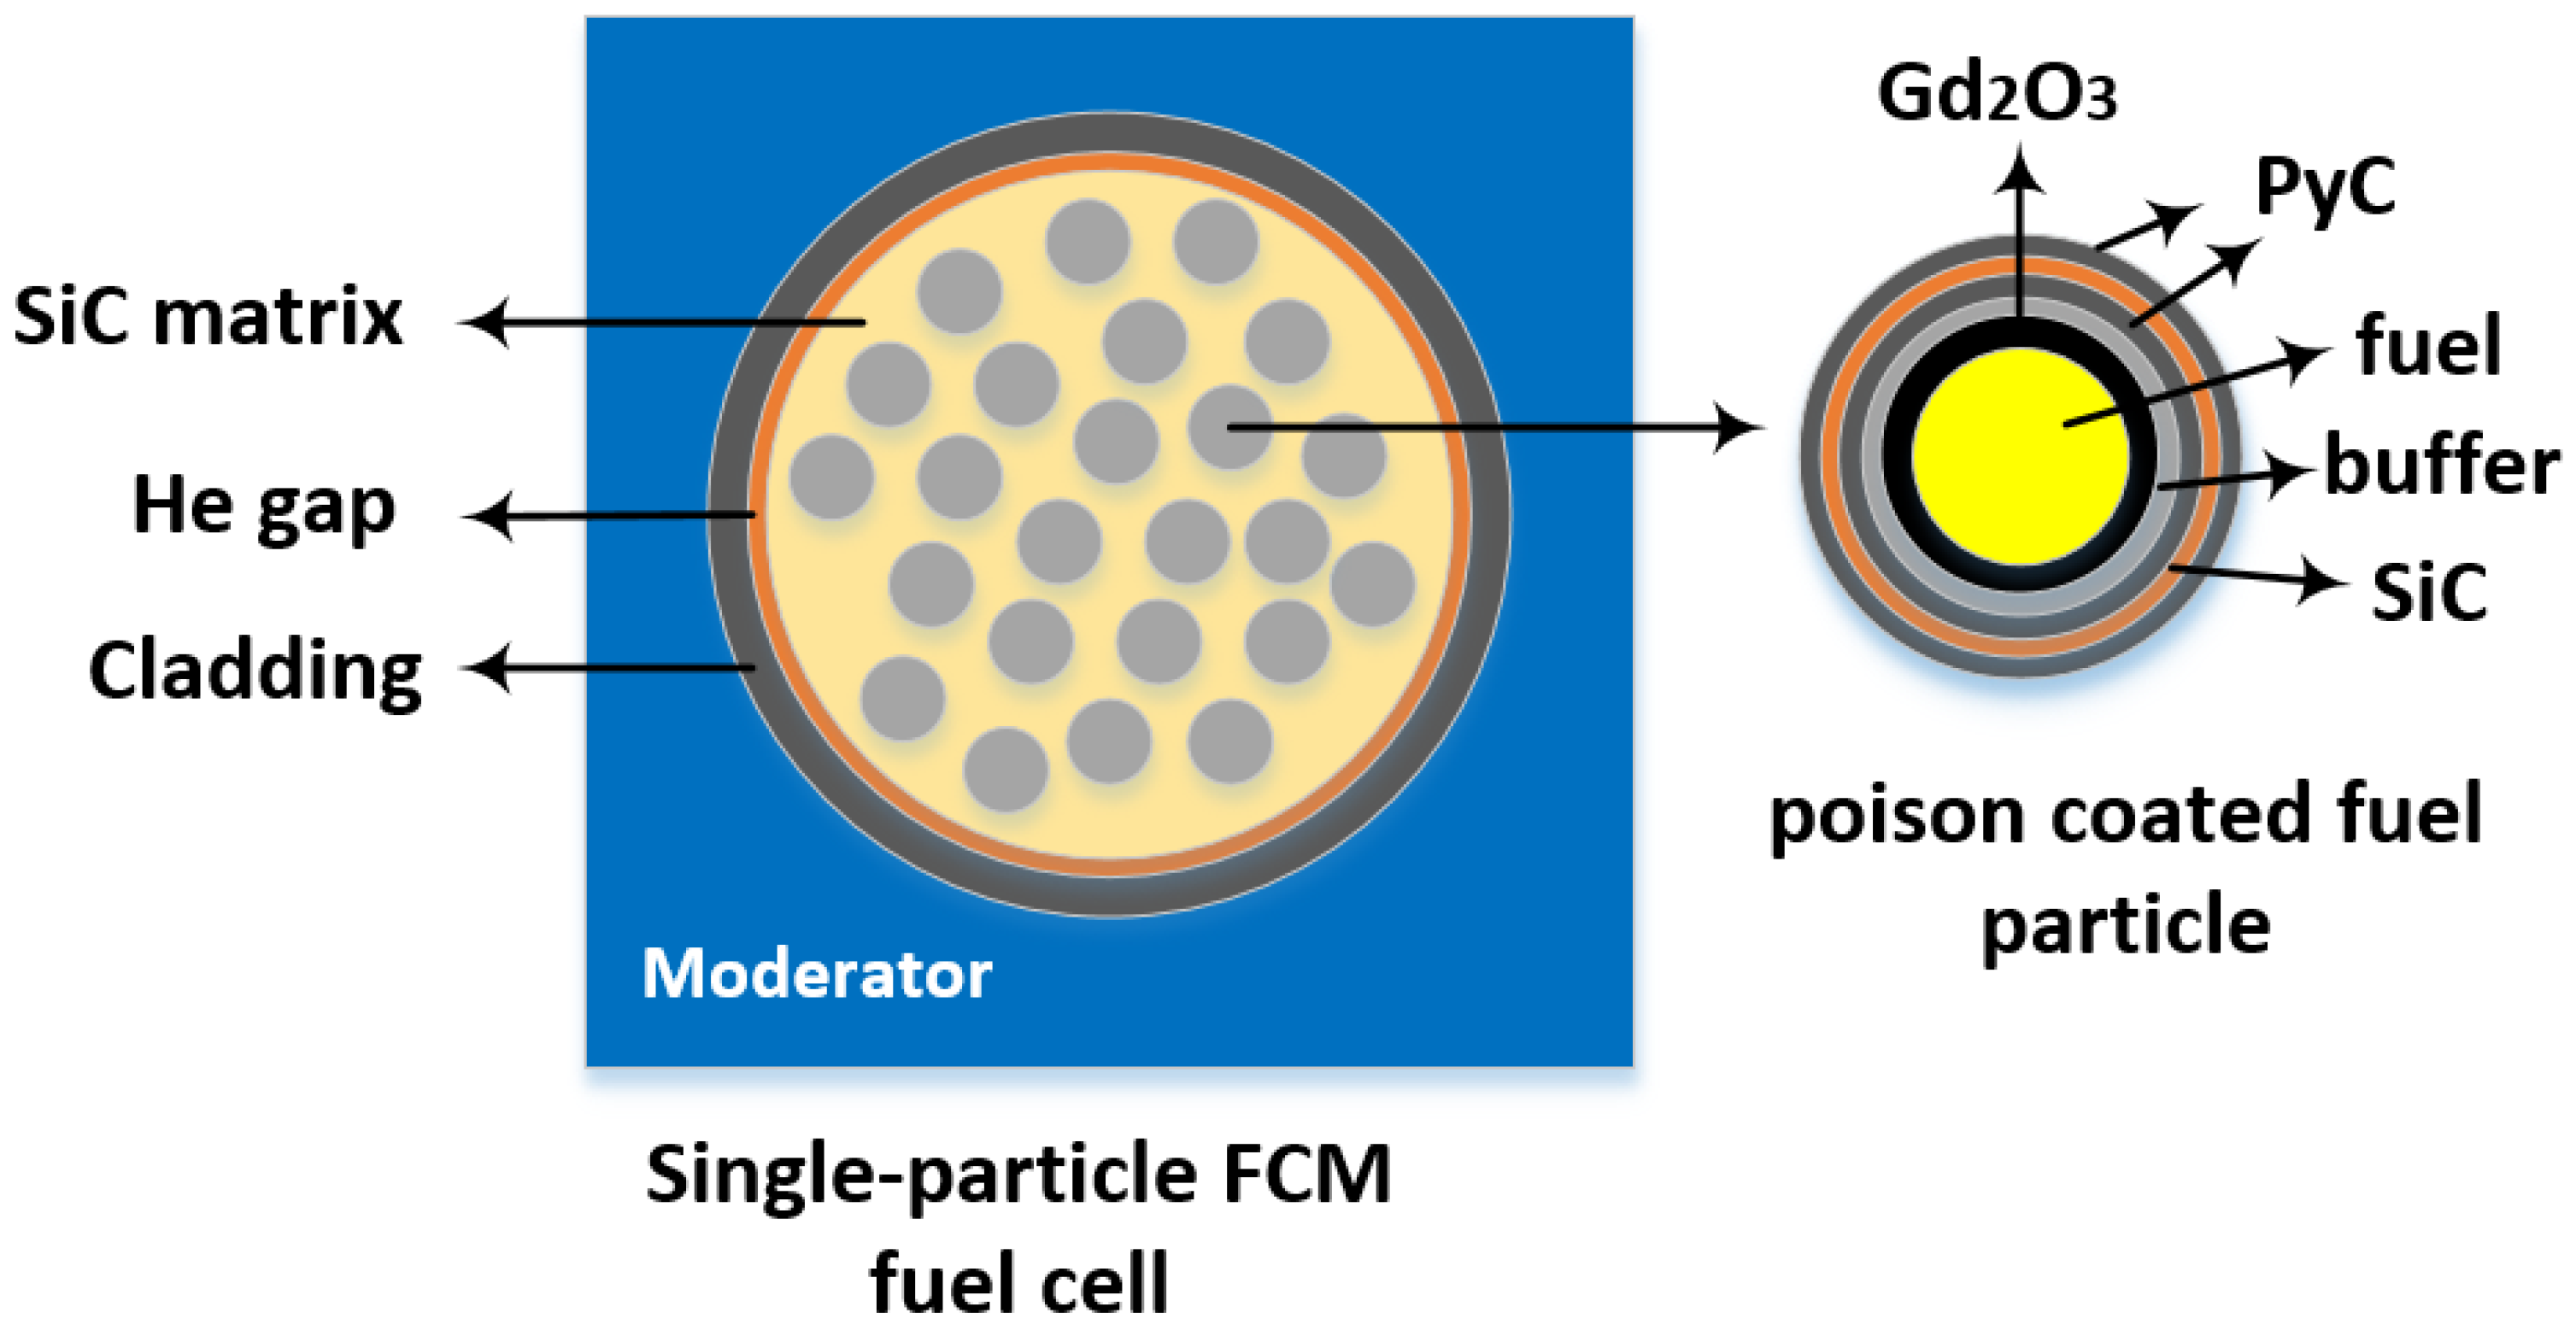
To explore the performance of various algorithms in the context of double heterogeneity issues, two scenarios are established for the strong absorption problem involving gadolinium oxide. The first scenario involves single-particle problems, where gadolinium oxide is applied as a coating adhered to the surface of fuel particles. The second scenario presents a double-particle problem, where gadolinium oxide exists in the form of a particle kernel mixed with fuel particles. The diagrams illustrating these two calculation scenarios are depicted in Figure 4 and Figure 5.
Three packing fractions are set for both single-particle and double-particle problems, with the list of test cases provided in Table 2. The geometric information for the particles and fuel cells is shown in Table 3 and Table 4, respectively, while the material information is presented in Table 5.
Based on the calculation results of a uniform step size of 0.1 GWd/tU using the estimated correction method, the other correction algorithms have set four step size schemes in each case: 0.25 GWd/tU, 0.50 GWd/tU, 1.0 GWd/tU, and 2.0 GWd/tU. The specific step size allocation is shown in Table 6.
Due to the large thermal neutron absorption cross-sections of Gd-155 and Gd-157, these isotopes rapidly absorb thermal neutrons, leading to a swift reduction in their content. After reaching burnup levels of 20.0 or 30.0 GWd/tU, Gd-155 and Gd-157 are nearly depleted and the subsequent burnup process resembles a scenario without gadolinium present. Consequently, each case is depleted to 20.0 or 30.0 GWd/tU under a constant power density of 100.0 W/gHM.
The macroscopic burnup regions for both types of calculation cases are divided into five equal-volume zones. In the single-particle problem, the fuel kernel is divided into two equal-volume regions and the Gd2O3 coating is not further subdivided into burnup zones. In the double-particle problem, the kernel of the poison particle is divided into ten burnup zones, while the kernel of the fuel particle is not subdivided into burnup zones. This division scheme ensures that all calculation cases are geometrically convergent.

3.2. Results and Analysis

3.2.1. Multiplication Factor vs. Burnup

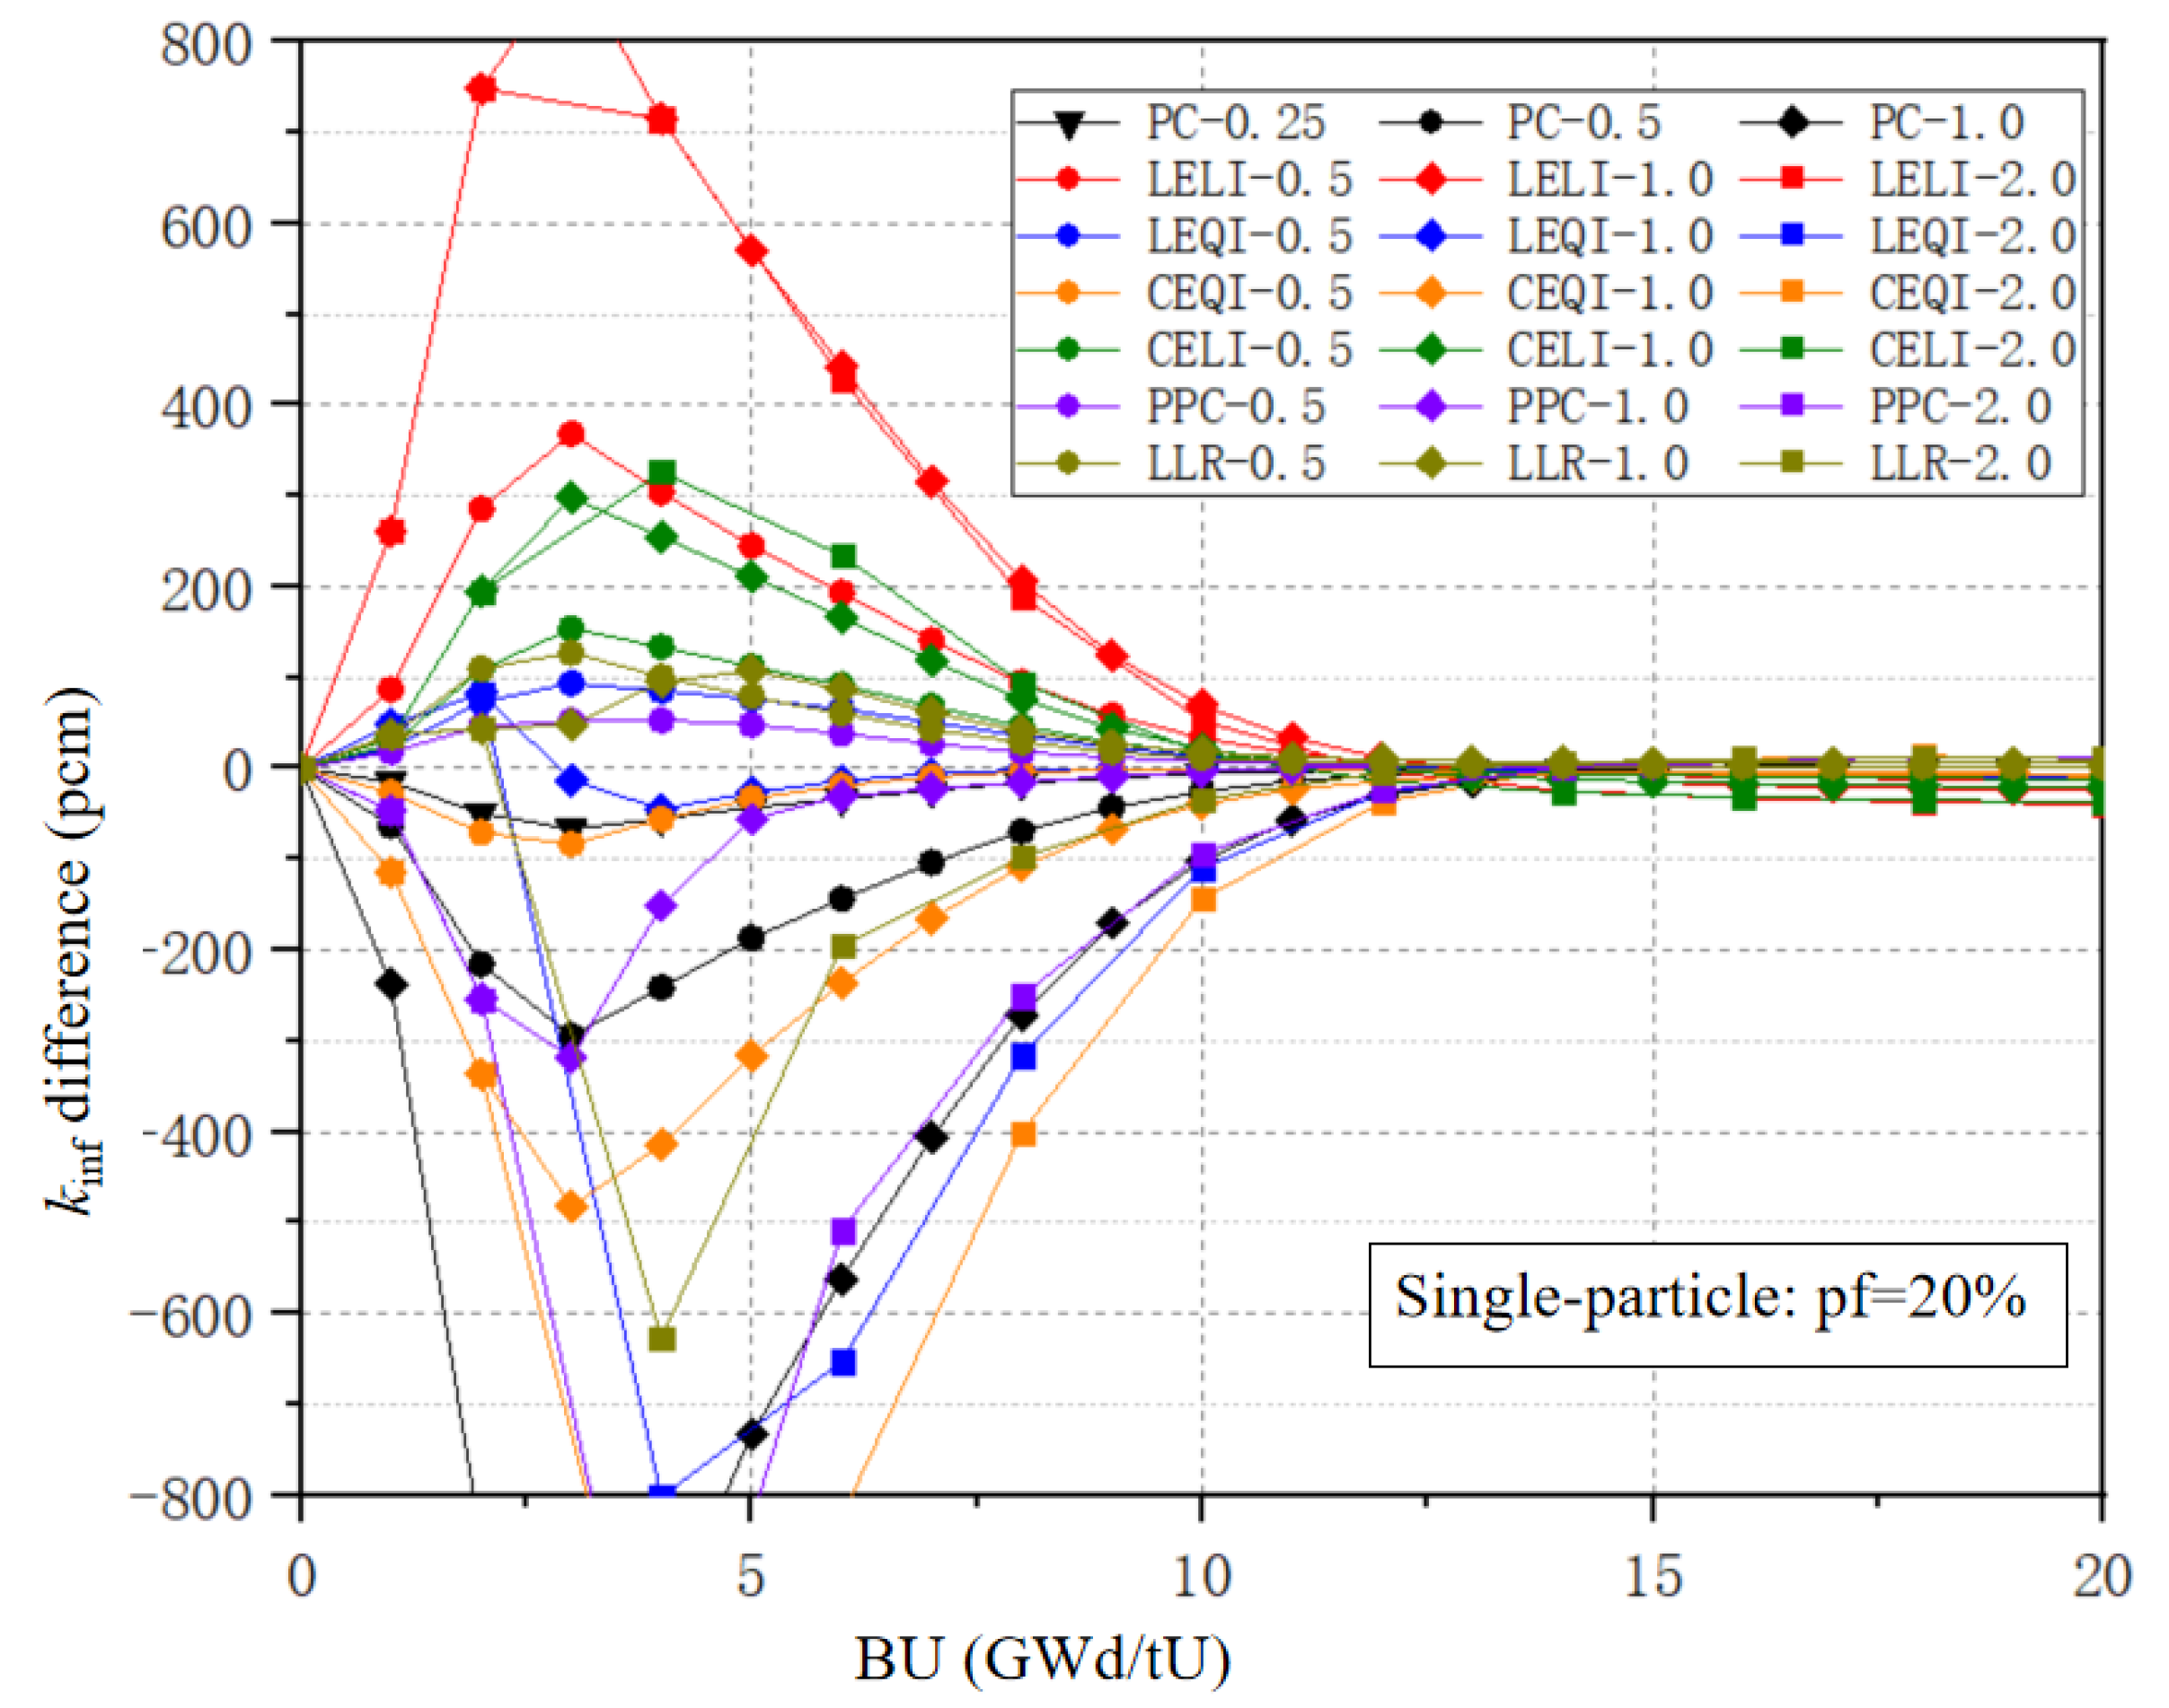
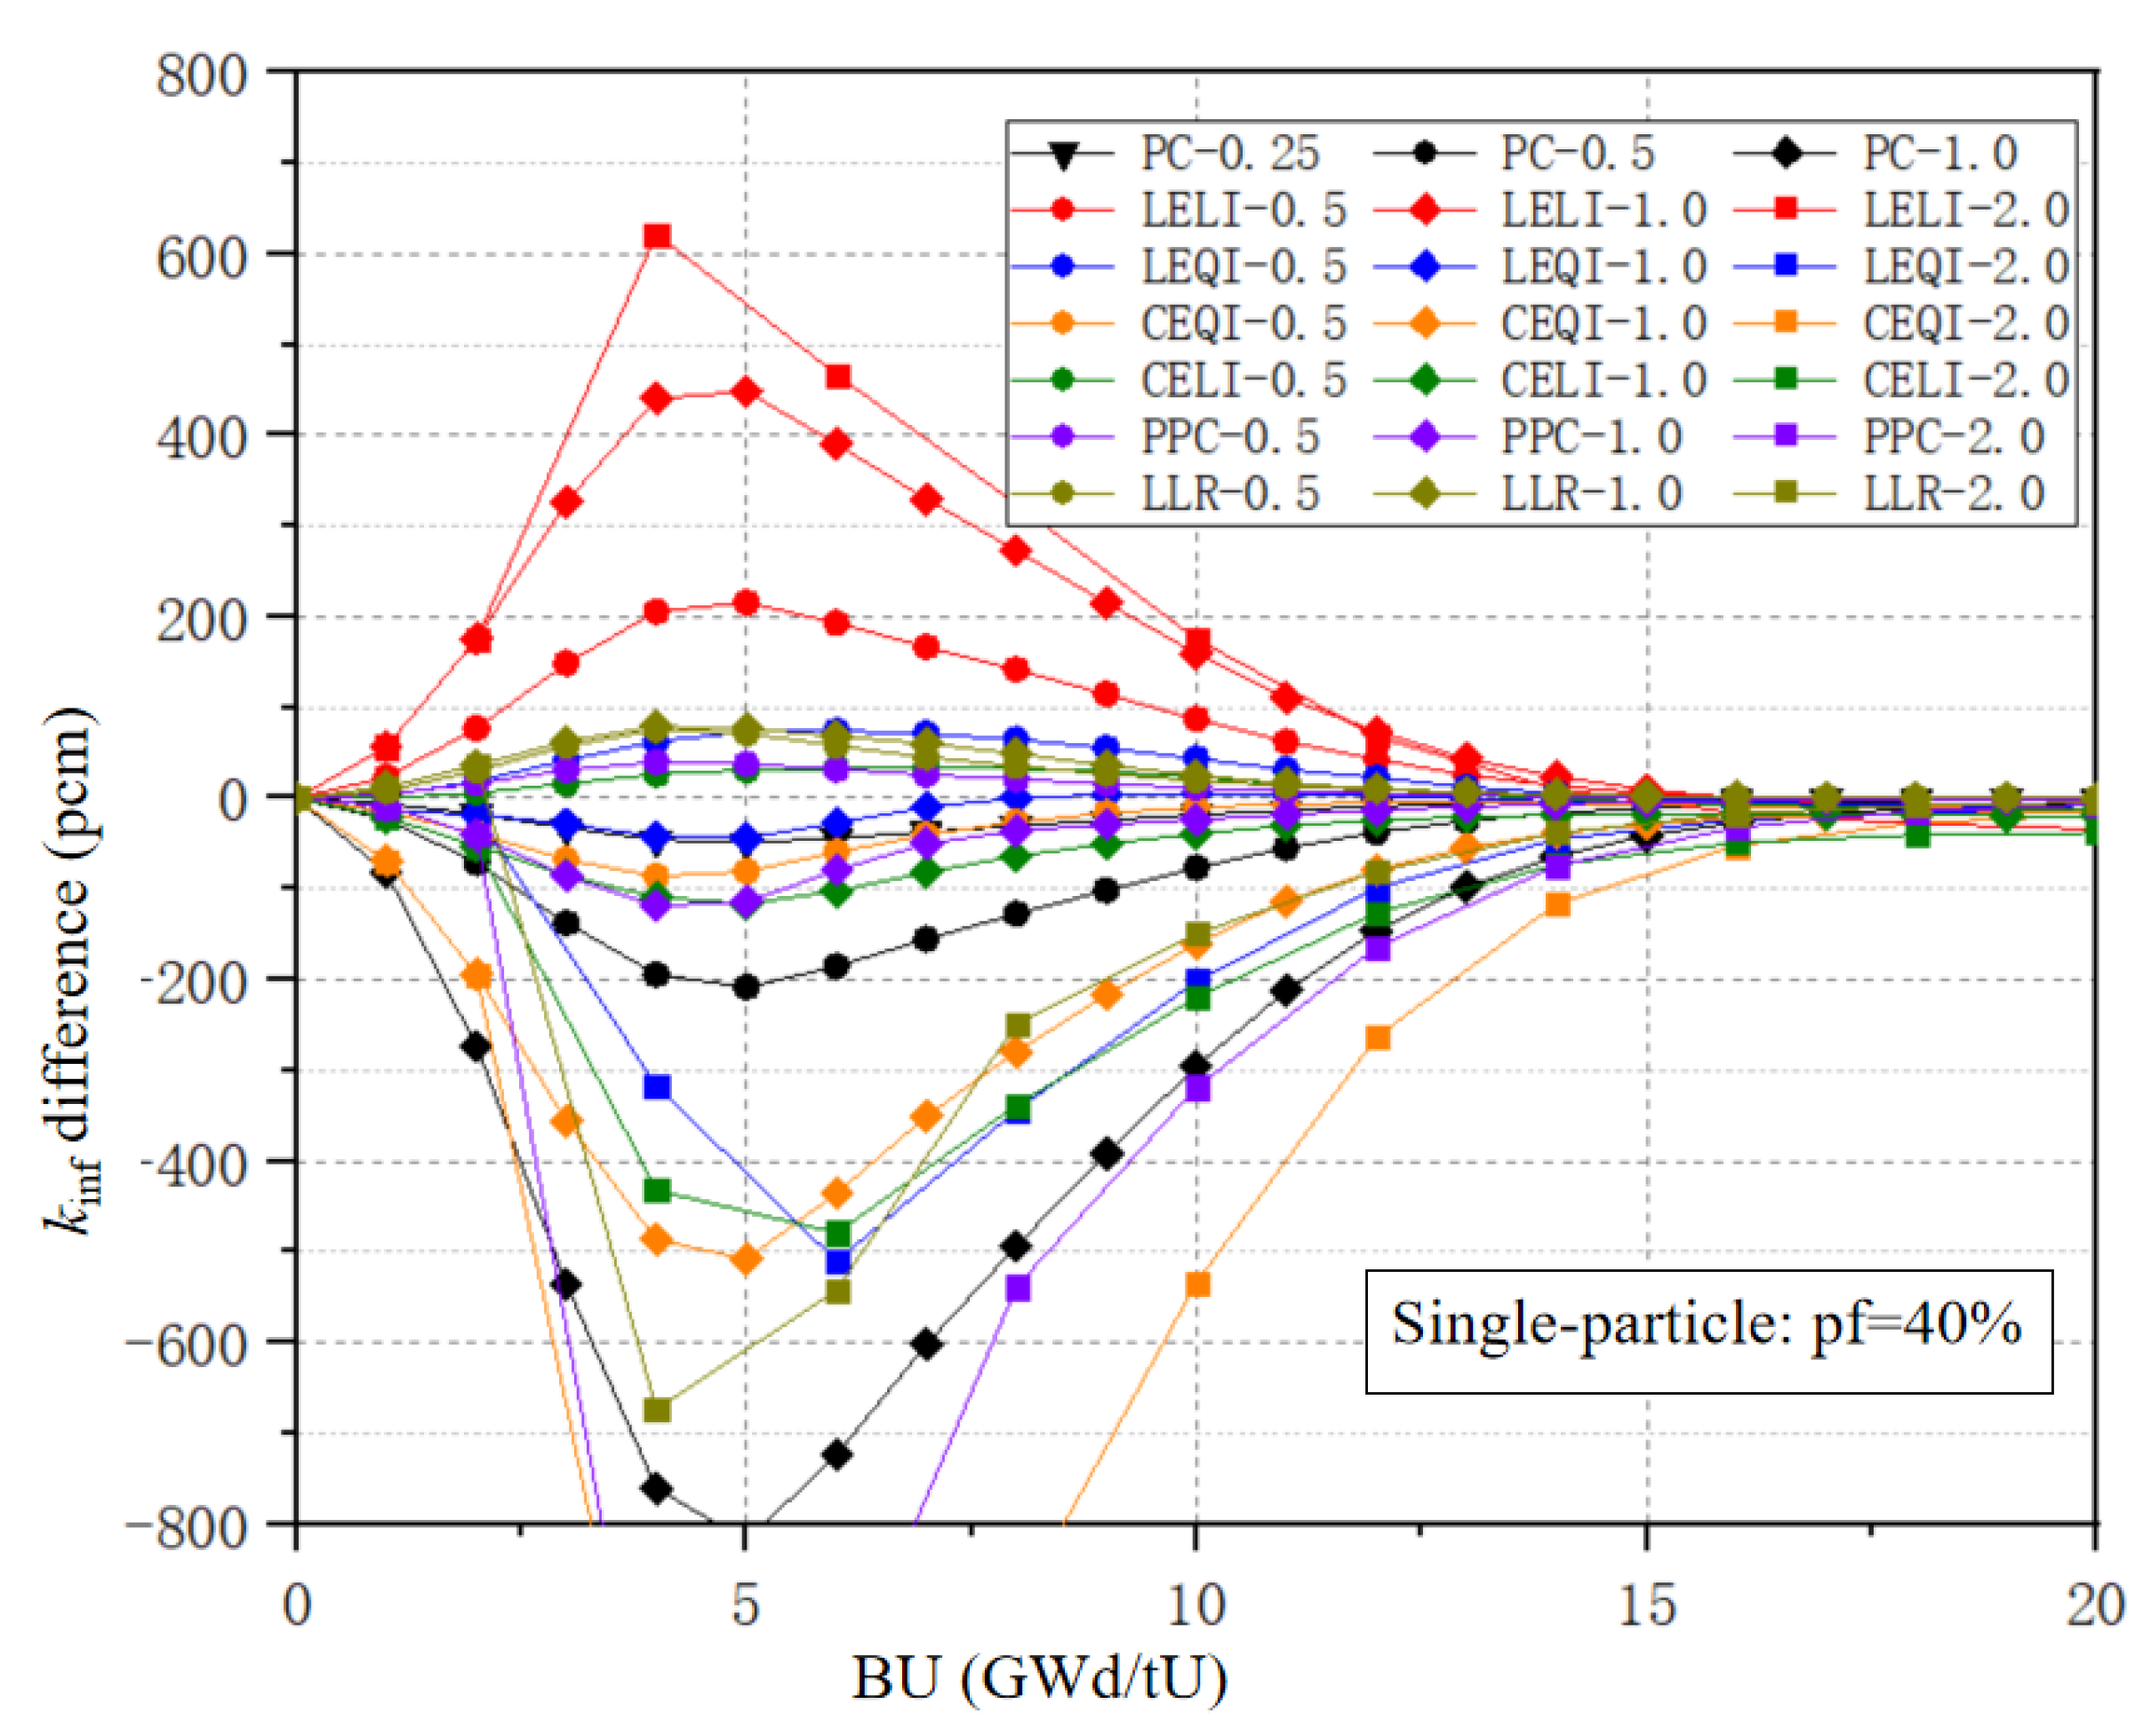
This section analyzes the kinf accuracy of six reaction rate correction algorithms, namely PPC, LLR, CE/LI, CE/QI, LE/LI, and LE/QI, under different dispersed particle fuel burnup problems. For the burnup of gadolinium particles, kinf errors calculated by different coupling algorithms are depicted in Figure 6, Figure 7, Figure 8, Figure 9, Figure 10 and Figure 11. Table 7 presents the root mean square data of kinf errors for various methods in both the single-particle and double-particle burnup problems, while Table 8 shows the maximum deviation data during the burnup process. In problems involving Gd2O3-bearing dispersed particle fuel, the traditional PC method with a step size of 0.25 GWd/tU can maintain kinf errors within 100 pcm in the burnup calculation. When the step size is increased to 0.5 GWd/tU, the original PC method fails to accurately track the depletion rate of the gadolinium isotope over time steps, resulting in a deviation of more than 200 pcm in both the single-particle and double-particle Gd2O3-bearing dispersed particle scenarios, which further escalates to thousands of pcm at a step size of 1.0 GWd/tU.
In the burnup problem of gadolinium-bearing fuel in conventional pressurized water reactors, LE/LI is the combination with the highest accuracy among the higher-order methods [26]. However, in the double heterogeneity problem involving Gd2O3-bearing particles, this method shows no improvement in accuracy compared to the traditional PC method. Even with a step size of 0.5 GWd/tU, the maximum kinf deviations in the single-particle problem are 215.6 pcm, 273.5 pcm, and 368.1 pcm for packing fractions of 40%, 30%, and 20%, respectively. In the double-particle problem, the maximum deviations are 151.2 pcm, 246.9 pcm, and 358.9 pcm for poison particle packing fractions of 10%, 15%, and 20%, respectively.
For the single-particle Gd2O3-bearing problem, LE/QI is the best-performing coupling algorithm, which can keep the kinf error within 100 pcm using a 1.0 GWd/tU step size scheme with packing fractions of 20%, 30%, and 40%. The second best is the LLR algorithm. For single-particle problems with three different packing fractions, the maximum deviation calculated by LLR-1.0 occurs in the case of a 20% packing fraction, with a maximum deviation of 107 pcm. CE/LI performs close to LE/QI when the packing fractions are 30% and 40%, but the kinf accuracy decreases significantly at a packing fraction of 20%. When a step size of 0.5 GWd/tU is adopted, the kinf calculated by the CE/QI and PPC methods exhibit similar accuracy, and for single-particle problems with different packing fractions, the deviation of kinf can be kept below 100 pcm.
For double-particle cases, the best-performing algorithm is still the LE/QI algorithm. With the poison particle packing fractions of 10%, 15%, and 20%, using a large step size of 1.0 GWd/tU can ensure that the deviation of kinf does not exceed much more than 100 pcm. The maximum deviation of LE/QI-1.0 is 108.9 pcm, which occurs in the case of a 20% packing fraction of poison particle. The use of a 1.0 GWd/tU step size in other methods is not suitable for problems with different packing fractions, leading to significant deviations. When using a 0.5 GWd/tU step size, CE/QI and CE/LI can maintain high accuracy in the double-particle problem. However, the LLR method exhibits abnormal behavior in the double-particle problem. Specifically, when the packing fraction of the poison particles is 20%, the error with a 2.0 GWd/tU step size is significantly smaller than that with a 1.0 GWd/tU step size, which may be due to excessive correction of the absorption cross-section by the LLR method at a 1.0 GWd/tU step size. Therefore, an analysis was conducted using a double-particle case with poison particle packing fraction of 20%. The absolute deviation of the atomic number density of Gd-155 and Gd-157 calculated by the LLR method is shown in Figure 12 and Figure 13. The deviation in the atomic number density of Gd-155 calculated with LLR-2.0 is slightly less than that of LLR-0.5, while the atomic number density of Gd-157 calculated with LLR-2.0 is significantly more accurate than that of LLR-1.0. This may be the reason why LLR-2.0 is far superior to LLR-1.0 in terms of kinf accuracy.

3.2.2. Nuclide Densities vs. Burnup

Since the methods of CE/LI, CE/QI, PPC, and LE/QI perform better than other methods when calculating the macroscopic parameter kinf for FCM fuel burnup calculations, further evaluation of these four methods for predicting the density of nuclides Gd-155 and Gd-157 was conducted.

Step Size of 0.5 GWd/tU

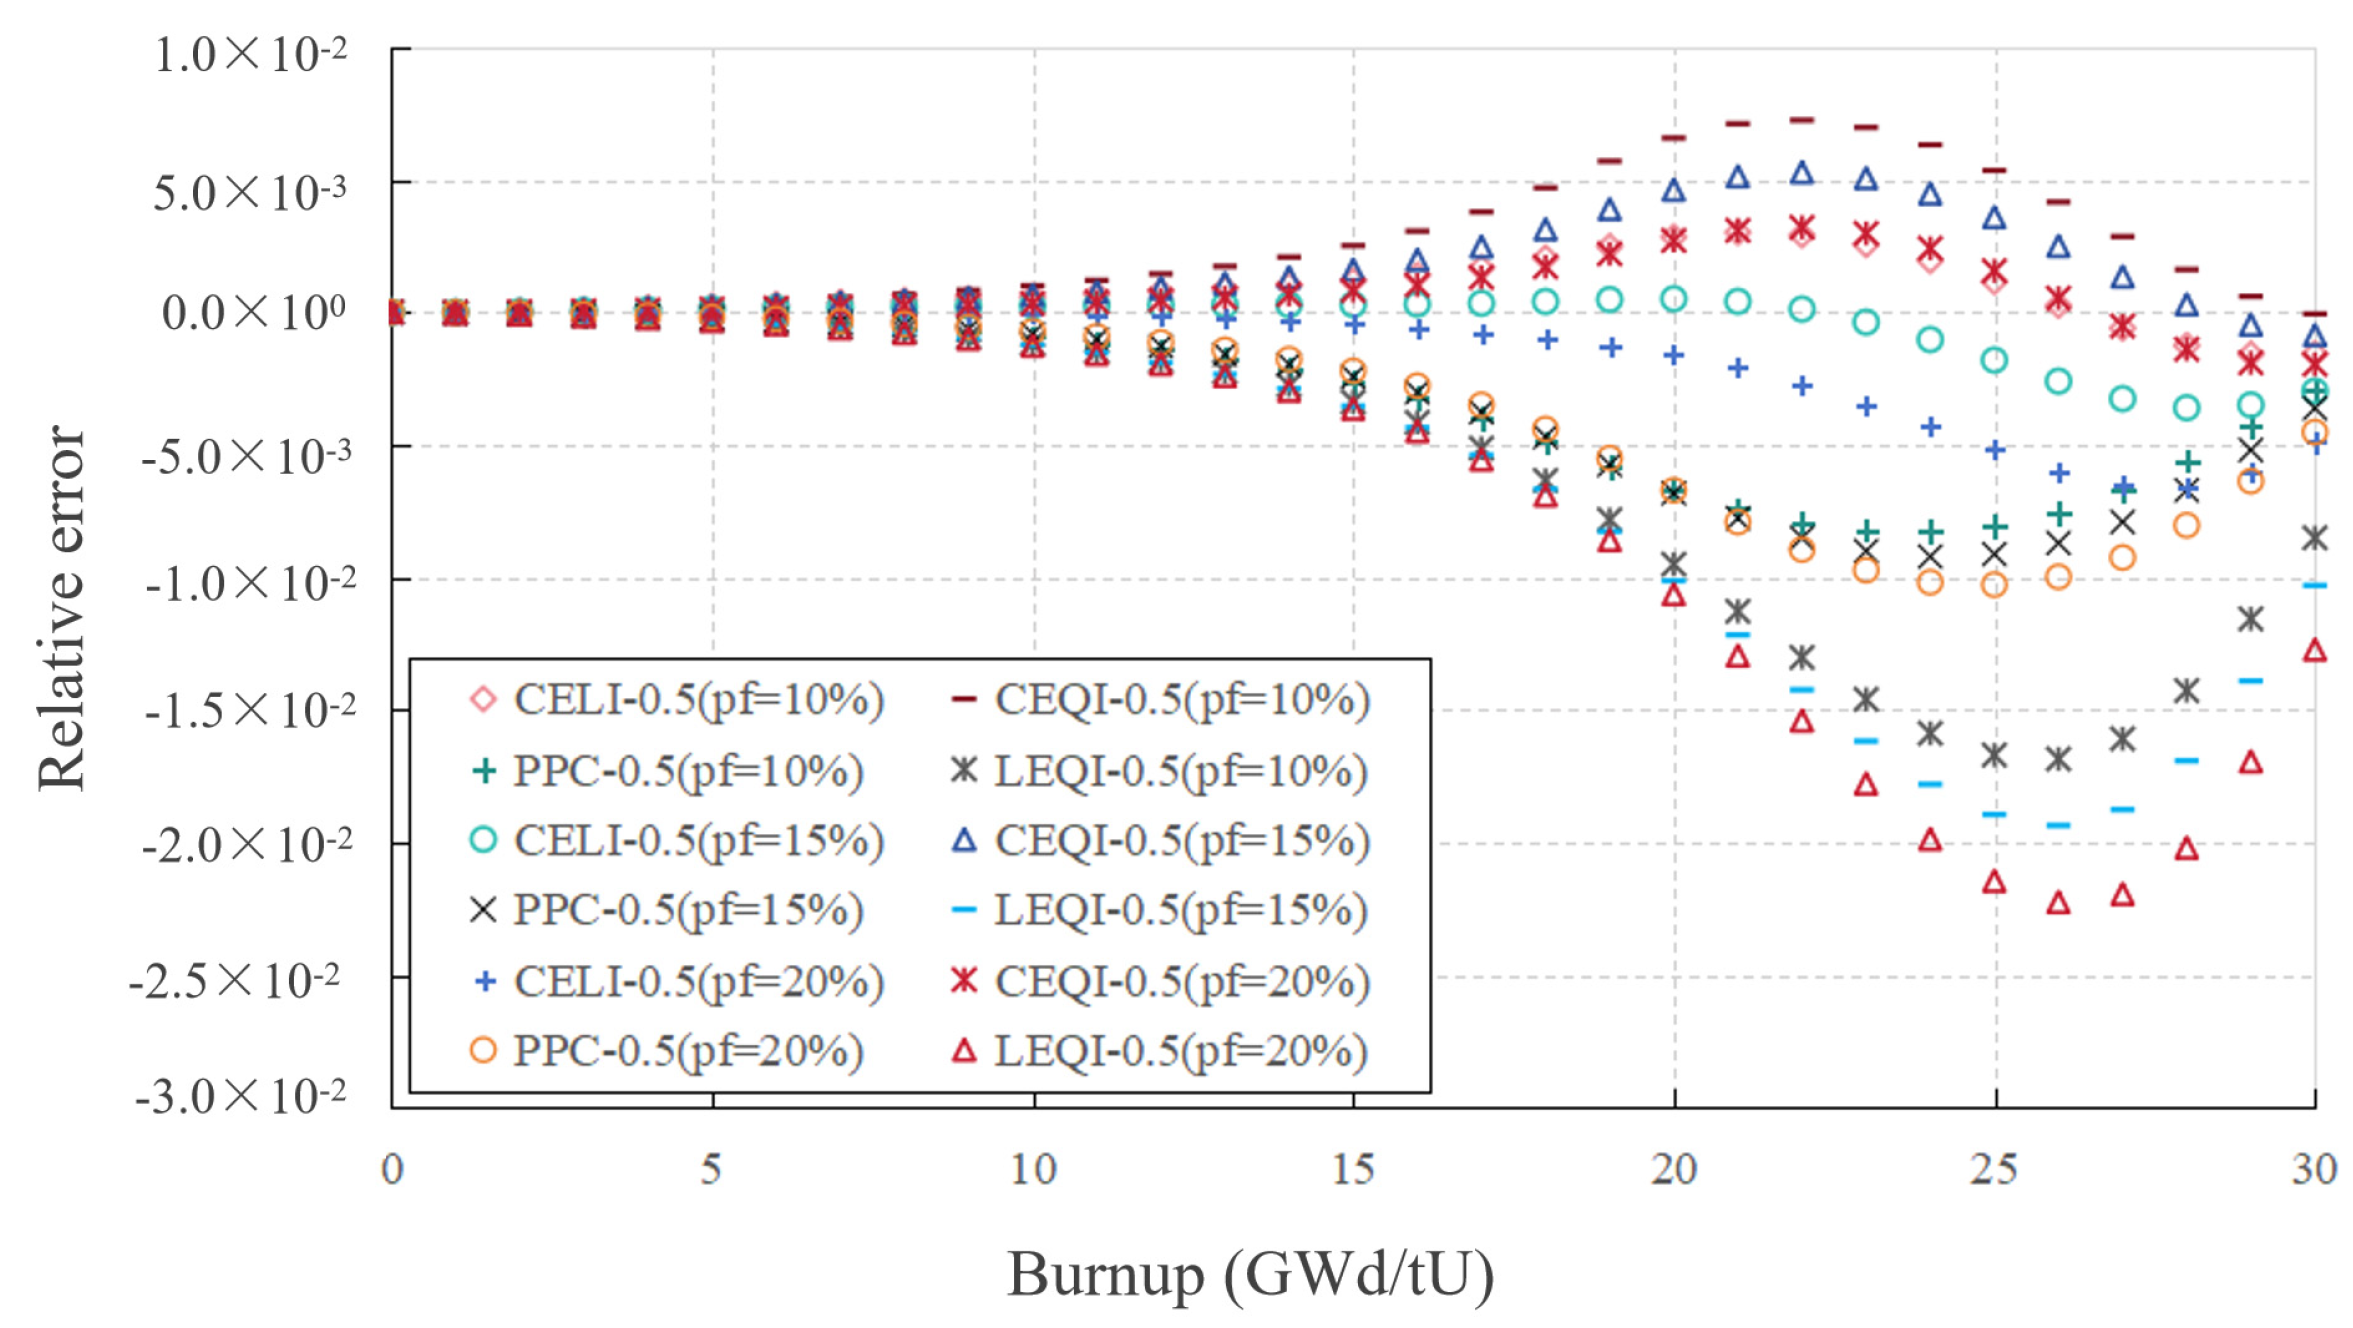
When the step size is set at 0.5 GWd/tU, the PPC method achieves the highest prediction accuracy for the atomic number density of the nuclide Gd-155 in the single-particle problem. For packing fractions of 20%, 30%, and 40%, the maximum relative deviations of Gd-155 are 0.264%, 0.233%, and 0.196%, respectively, as shown in Figure 14 and Figure 15. The prediction accuracy of the CE/QI method for Gd-155 is slightly inferior to the PPC method. The performances of CE/LI and LE/QI are similar, with the errors in calculation of the atomic number density of the Gd-155 for both methods remaining below 1% throughout the burnup process. In the double-particle problems, the CE/LI and CE/QI methods exhibit the best prediction accuracy for Gd-155. When the packing fractions of poison particles are 10%, 15%, and 20%, the maximum relative errors in the atomic number density of Gd-155 calculated with the CE/LI method are 0.301%, 0.361%, and 0.661%, respectively, while the corresponding errors for CE/QI are 0.724%, 0.528%, and 0.320%.
Due to the larger absorption cross-section of Gd-157, its prediction of atomic number density is even more difficult than that of Gd-155. The relative errors of the predicted Gd-157 atomic number density with CE/LI, CE/QI, PPC, and LE/QI under the step size of 0.5 GWd/tU are shown in Figure 16 and Figure 17. For the single-particle problem, when a step size of 0.5 GWd/tU is used for the burnup calculation, the PPC method achieves the highest accuracy in calculating the Gd-157 atom number density. In the cases with packing fractions of 20%, 30%, and 40%, the maximum relative errors of PPC are 0.496%, 0.435%, and 0.480%, respectively. The CE/QI method follows in terms of accuracy, with maximum relative errors of 0.781%, 0.960%, and 0.893%, respectively. However, in the case of the two-particle problem, CE/LI exhibits the best prediction accuracy for the Gd-157 atom number density. For the scenarios where the packing fractions of the poison particles are 10%, 15%, and 20%, the relative errors for CE/LI are 0.966%, 0.538%, and 0.411%, respectively. Under this step size setting, among these four methods, LE/QI has the lowest prediction accuracy for the atom number density of Gd-157. In the single-particle problem, the maximum deviation calculated by LE/QI is 1.1% in the case of a packing fraction of 20%. In the double-particle problem, the maximum error of LE/QI is 2.76% in the case of a packing fraction of 20% for a poison particle.

Step Size of 1.0 GWd/tU

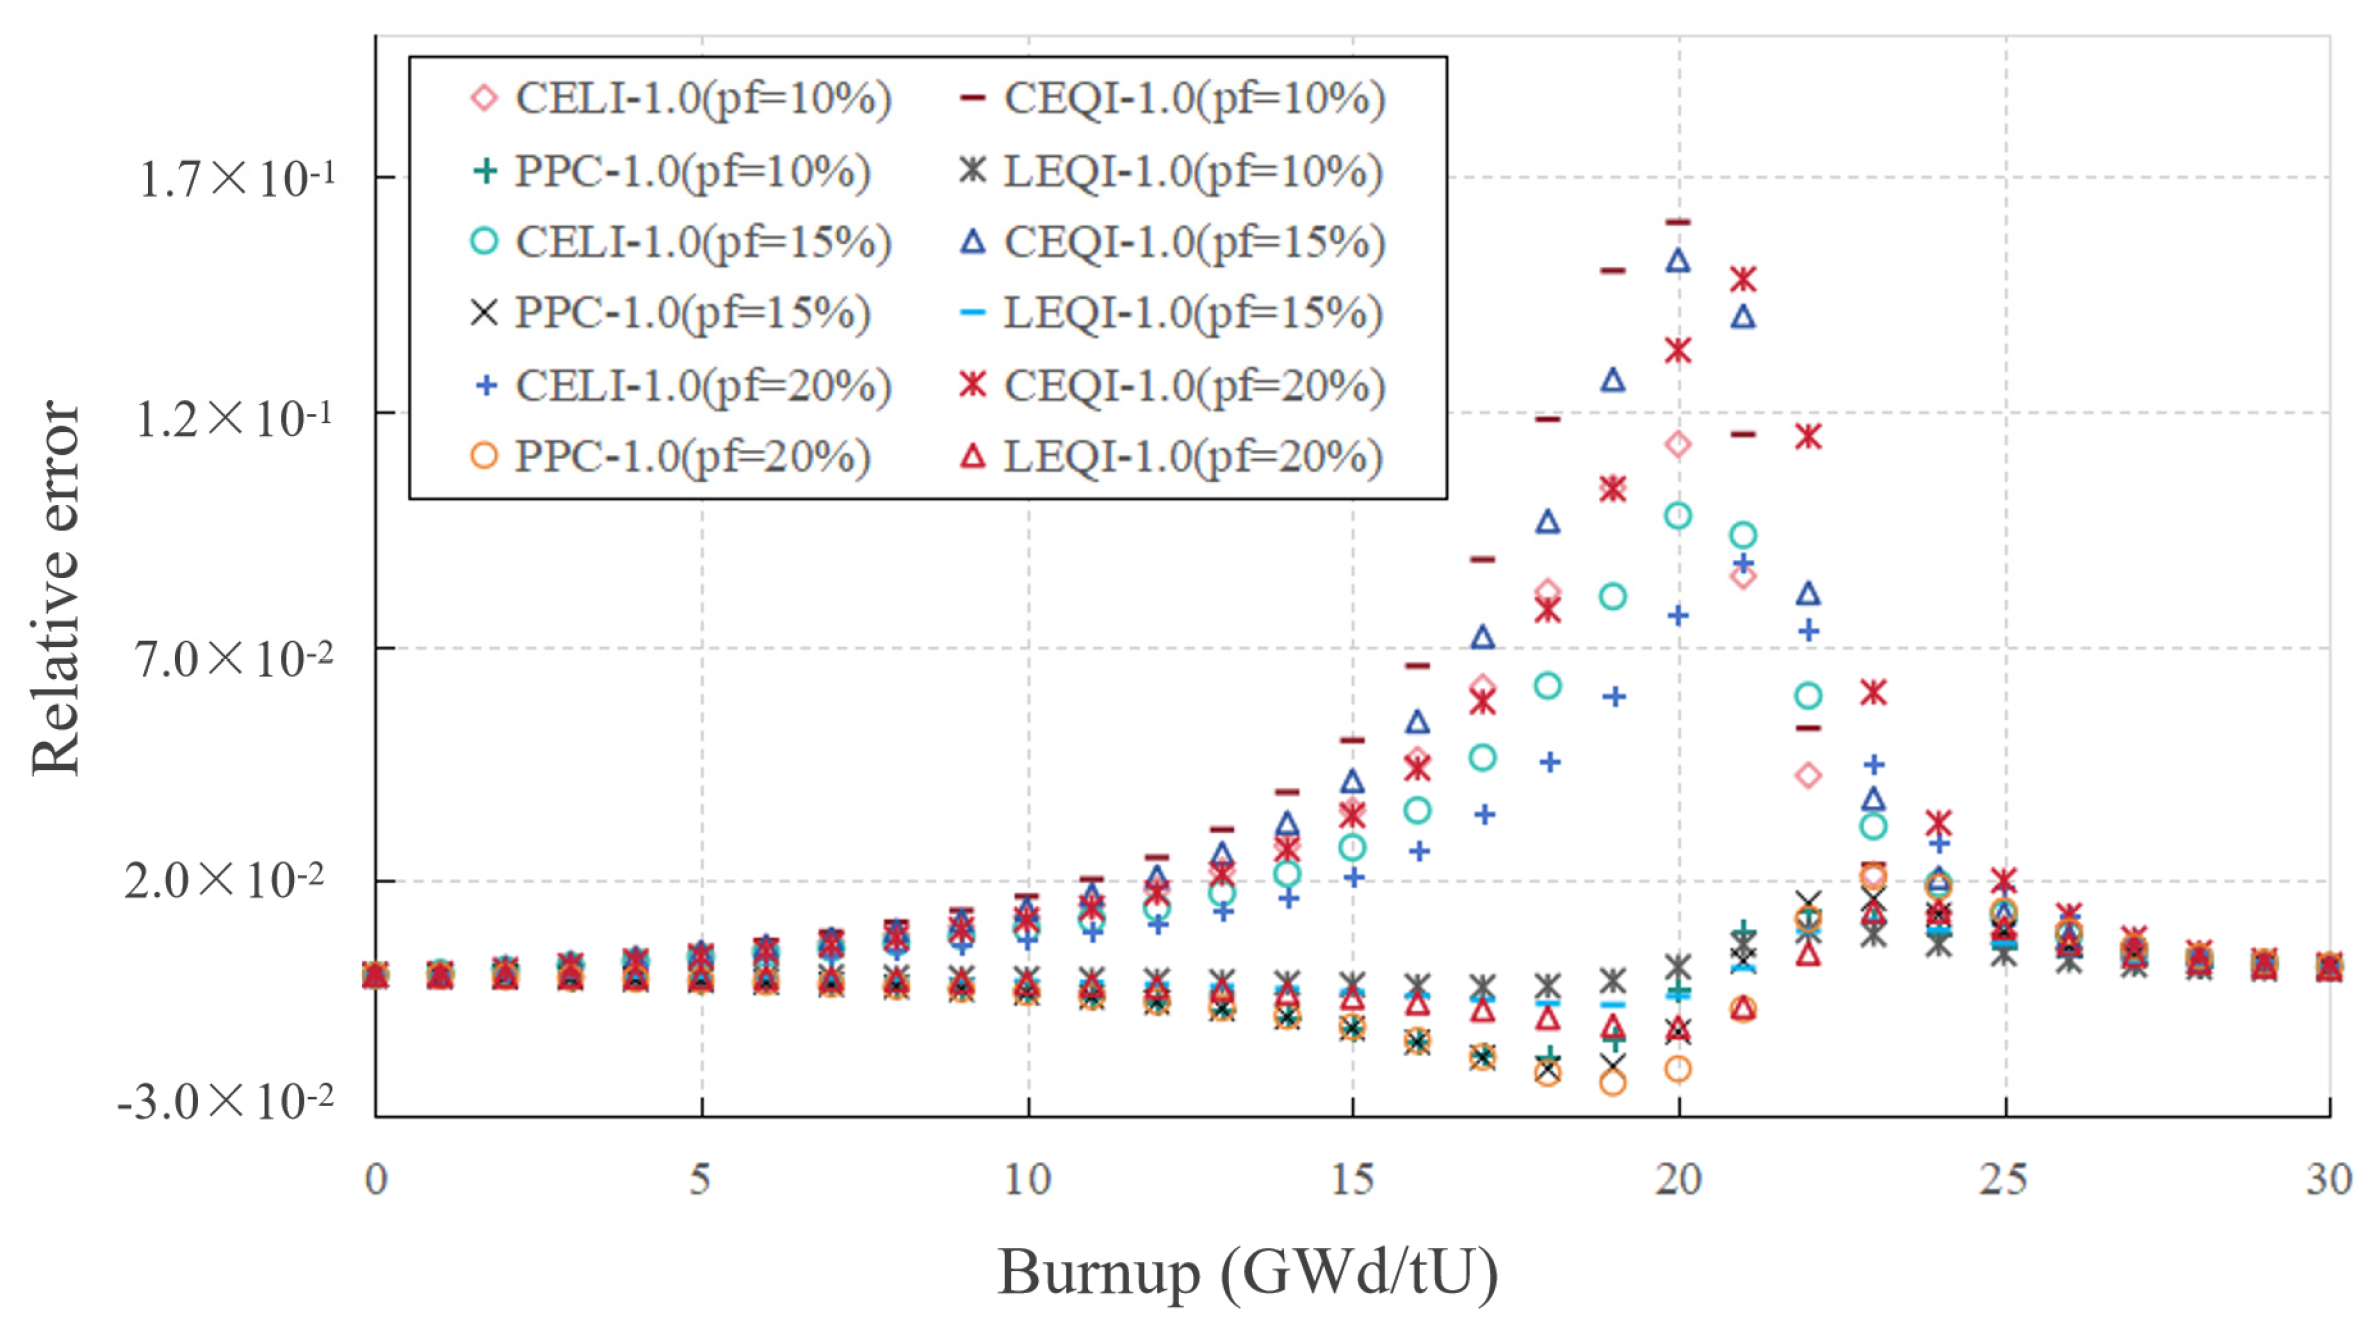
When the step size is increased to 1.0 GWd/tU, the relative errors of the predicted Gd-155 atomic number density by the CE/LI, CE/QI, PPC, and LE/QI methods are shown in Figure 18 and Figure 19. In the single-particle problem, the errors when calculating the Gd-155 atomic number density by PPC and LE/QI are always less than 1%. The relative deviations of PPC in cases with packing fractions of 20%, 30%, and 40% are 0.351%, 0.275%, and 0.207%, respectively, while the deviations of LE/QI are 0.345%, 0.517%, and 0.611%. The CE/QI method has the lowest accuracy for calculating the Gd-155 atomic number density, with errors exceeding 1% in cases with packing fractions of 20%, 30%, and 40%. In the double-particle cases, the deviations for Gd-155 are greater than those in the single-particle case. The method with the highest accuracy for Gd-155 calculation is LE/QI, with deviations of 0.885%, 1.173%, and 1.526% at poison particle packing fractions of 10%, 15%, and 20%, respectively. The PPC method is nearly as accurate as the LE/QI, with errors of 1.086%, 1.356%, and 1.636%, respectively.
The relative errors of the predicted Gd-157 atomic number density by CE/LI, CE/QI, PPC, and LE/QI are shown in Figure 20 and Figure 21. It can be observed that when a step size of 1.0 GWd/tU is used, LE/QI demonstrates significantly better accuracy in calculating Gd-157 for both single-particle and double-particle problems compared to the other three methods. In the single-particle problem, the maximum relative errors of the Gd-155 atomic number density calculated with the LE/QI method are 1.713%, 1.396%, and 1.111% at packing fractions of 20%, 30%, and 40%, respectively. Correspondingly, in the double-particle problem, the maximum relative deviation of LE/QI in cases with poison particle packing fractions of 10%, 15%, and 20% are 0.942%, 1.162%, and 1.353%, respectively. The PPC method significantly lags behind LE/QI in every case, with maximum relative errors at the three packing fractions of 7.021%, 4.666%, and 3.198% in the single-particle problem, and 1.725%, 1.992%, and 2.285% in the double-particle problem. The accuracy of the CE/QI method becomes very poor in the double-particle cases, with the maximum deviation of the Gd-157 atomic number density calculated by this method exceeding 10%. The accuracy of CE/LI in the single-particle problems lies between the PPC and LE/QI method, with the maximum relative errors at the three packing fractions being 3.085%, 1.578%, and 1.860%. However, CE/LI performs very poorly in the double-particle problems, reaching a maximum deviation of 11.283% at a poison particle packing fraction of 10%. The ability to accurately predict the Gd-157 atomic number density with a large step size is the main reason that LE/QI maintains the overall kinf accuracy.

4. Conclusions

The transport–burnup coupling strategies for Gd2O3 have been developed in the ALPHA code, including six coupling methods: PPC, LLR, CE/LI, CE/QI, LE/LI, and LE/QI. These six methods have made different corrections to the reaction rates of Gd-155 and Gd-157. This study conducted a comprehensive analysis of these methods using two types of FCM fuel cell types: a single-particle cell and a double-particle cell. Overall, the LE/QI method has the highest accuracy, showing good performance in terms of the overall kinf of burnup and the atomic number density of Gd-155 and Gd-157. This method can use a step size four times that of the traditional estimation correction method in most cases, while maintaining satisfactory accuracy. The CE/QI, CE/LI, and PPC methods have the next levels of accuracy and, in most cases, a step size twice that of the PC method can achieve good accuracy. The LLR method has poor stability in the double-particle type of lattice cell calculations, showing an abnormal phenomenon where the accuracy of large steps is better than that of small steps. This study provides a reference for the selection of coupling strategies for Gd2O3-bearing fuel under double heterogeneity conditions.
Constrained by computational resources, the current analysis of various coupling strategies is limited to FCM pin cell problems, without being tested on lattice or core problems. Therefore, it is also impossible to quantify their impact on more macroscopic physical parameters, such as lattice power distribution and core reactivity coefficients, etc. Future work will focus on studying the evolution of reaction rates for Gd-155 and Gd-157 under double heterogeneous conditions and developing coupling strategies based on feature extraction techniques to significantly reduce the time consumption of burnup calculations.

Author Contributions

Conceptualization, Y.Z. (Yunfei Zhang), Y.Z. (Yang Zou) and Q.Z.; methodology, Y.Z. (Yunfei Zhang) and B.Z.; software, Y.Z. (Yunfei Zhang); writing, Y.Z. (Yunfei Zhang); supervision, R.Y. and G.Z.; project administration, J.G. and A.Z. All authors have read and agreed to the published version of the manuscript.

Funding

This research was funded by Chinese Academy of Sciences Talent Introduction Youth Project (No. SINAP-YCJH-202303), Chinese TMSR Strategic Pioneer Science and Technology Project (No. XDA02010000), New Generation of Fission Energy Technology—Key Technologies of the Hundred-Megawatt Thorium-Based Molten Salt Reactor Nuclear Energy System (No. 24GZ010200), Frontier Science Key Program of Chinese Academy of Sciences (No. QYZDY-SSW-JSC016), Chinese TMSR Strategic Pioneer Science and Technology Project [No. XDA02010000], Project of Young Talents of China National Nuclear Corporation, Natural Science Foundation of China (NSFC, Grant No. 12005290). And the APC was funded by Chinese Academy of Sciences Special Research Assistant Project.

Data Availability Statement

Data are contained within the article.

Conflicts of Interest

The authors declare no conflict of interest.

Abbreviations

AbbreviationsFull Name
ATFAccident Tolerant Fuel
FCMFully Ceramic Micro-encapsulated
PWRPressurized Water Reactor
BWRBoiling Water Reactor
PCPredictor–Corrector
PPCProjected Predictor–Corrector
LLRLog-Linear Rate
SFR Sodium-Cooled Fast Reactor
LWRLight Water Reactor
HTRHigh-Temperature Reactor
DHDouble Heterogeneity
MOCMethod Of Characteristics
CRAMChebyshev Rational Approximation Method
HOPCHigh-Order Predictor–Corrector
BOSBeginning Of Step
EOSEnd Of Step
PSPrevious Step
CEConstant Extrapolation
LELinear Extrapolation
LILinear Interpolation
QIQuadratic Interpolation
BUBurnup
HMHeavy Metal
RMSERoot Mean Square Error

References

  1. Evans, J.A.; DeHart, M.D.; Weaver, K.D.; Keiser, D.D. Burnable absorbers in nuclear reactors—A review. Nucl. Eng. Des. 2022, 391, 111726. [Google Scholar] [CrossRef]
  2. Knott, D.; Yamamoto, A. Lattice Physics Computations. In Handbook of Nuclear Engineering; Cacuci, D.G., Ed.; Springer: Boston, MA, USA, 2010; pp. 913–1239. [Google Scholar]
  3. Los Alamos National Laboratory. Development of a Fully-Automated Monte Carlo Burnup Code Monteburns, LA-UR-99-42. In Proceedings of the Annual Meeting of the American Nuclear Society (ANS), Boston, MA, USA, 6–10 June 1999. [Google Scholar]
  4. Sun, G.M.; Cheng, M.S. Development of a MCNP5 and ORIGEN2 based burnup code for molten salt reactor. Nucl. Sci. Technol. 2016, 27, 65. [Google Scholar] [CrossRef]
  5. Zhang, Y.F.; Zhang, Q.; Zhao, Q.; Chi, X.; Zhang, Z.; Huang, K. Development and verification of point-depletion code for PWR. In Proceedings of the International Conference on Nuclear Engineering 2019, Tsukuba, Japan, 19–24 May 2019. [Google Scholar]
  6. Liu, Z.Q.; Zhao, Z.L.; Yang, Y.W.; Gao, Y.C.; Meng, H.Y.; Gao, Q.Y. Development and validation of depletion code system IMPC-Burnup for ADS. Nucl. Sci. Tech. 2019, 30, 44. [Google Scholar] [CrossRef]
  7. Yamamoto, A.; Tatsumi, M.; Sugimura, N. Projected Predictor-Corrector Method for Lattice Physics Burnup Calculations. Nucl. Sci. Eng. 2009, 163, 144–151. [Google Scholar] [CrossRef]
  8. Sugimura, N.; Yamamoto, A.; Ushio, T.; Mori, M.; Tabuchi, M.; Endo, T. Neutron Transport Models of AEGIS: An Advanced Next-Generation Neutronics Design System. Nucl. Sci. Eng. 2007, 155, 276–289. [Google Scholar] [CrossRef]
  9. Carpenter, D.C. The log linear rate constant power depletion method. In Proceedings of the International Conference on the Physics of Reactors 2010, PHYSOR 2010, Pittsburgh, PA, USA, 9–14 May 2010. [Google Scholar]
  10. Lee, D.; Rhodes, J.; Smith, K. Quadratic Depletion Method for Gadolinium Isotopes in CASMO-5. Nucl. Sci. Eng. 2013, 174, 79–86. [Google Scholar] [CrossRef]
  11. Isotalo, A.E.; Aarnio, P.A. Higher order methods for burnup calculations with Bateman solutions. Ann. Nucl. Energy 2011, 38, 1987–1995. [Google Scholar] [CrossRef]
  12. Isotalo, A.; Sahlberg, V. Comparison of Neutronics-Depletion Coupling Schemes for Burnup Calculations. Nucl. Sci. Eng. 2015, 179, 434–459. [Google Scholar] [CrossRef]
  13. Terrani, K.A.; Snead, L.L.; Gehin, J.C. Microencapsulated fuel technology for commercial light water and advanced reactor application. J. Nucl. Mater. 2012, 427, 209–224. [Google Scholar] [CrossRef]
  14. Bomboni, E.; Cerullo, N.; Lomonaco, G. Analysis of Pebble-Fueled Zone Modeling Influence on High-Temperature Reactor Core Calculations. Nucl. Sci. Eng. 2009, 162, 282–298. [Google Scholar] [CrossRef]
  15. Bomboni, E.; Cerullo, N.; Lomonaco, G. Simplified models for pebble-bed HTR core burn-up calculations with Monteburns2.0©. Ann. Nucl. Energy 2012, 40, 72–83. [Google Scholar] [CrossRef]
  16. Powers, J.J.; Lee, W.J.; Venneri, F.; Snead, L.L.; Jo, C.K.; Hwang, D.H.; Chun, J.H.; Kim, Y.M.; Terrani, K.A. Fully Ceramic Microencapsulated (FCM) Replacement Fuel for LWRs; Oak Ridge National Lab. (ORNL): Oak Ridge, TN, USA, 2013. [Google Scholar] [CrossRef]
  17. Deng, Q.; Li, S.; Wang, D.; Liu, Z.; Xie, F.; Zhao, J.; Liang, J.; Jiang, Y. Neutronic design and evaluation of the solid microencapsulated fuel in LWR. Nucl. Eng. Technol. 2022, 54, 3095–3105. [Google Scholar] [CrossRef]
  18. Snead, L.L.; Terrani, K.A.; Venneri, F.; Kim, Y.; Tulenko, J.E.; Forsberg, C.W.; Peterson, P.F.; Lahoda, E.J. Fully Ceramic Microencapsulated Fuels: A Transformational Technology for Present and Next Generation Reactors—Properties and Fabrication of FCM fuel. Trans. Am. Nucl. Soc. 2011, 104, 668–670. [Google Scholar]
  19. Zhang, Y.; Zhang, Q.; Li, S.; Liang, Y.; Lou, L.; Wang, X.; Zhao, Q.; Zhang, Z. Evaluation of burnup calculation for double-heterogeneity system based on Sanchez-MOC framework in LWR. Ann. Nucl. Energy 2020, 147, 107668. [Google Scholar] [CrossRef]
  20. Cho, N.Z.; Lee, G.S.; Park, C.J. Fusion of method of characteristics and nodal method for 3-D whole-core transport calculation. Trans. Am. Nucl. Soc. 2002, 87, 322–324. [Google Scholar]
  21. Boyd, W.; Shaner, S.; Li, L.; Forget, B.; Smith, K. The OpenMOC method of characteristics neutral particle transport code. Ann. Nucl. Energy 2014, 68, 43–52. [Google Scholar] [CrossRef]
  22. Sanchez, R. Renormalized treatment of the double heterogeneity with the method of characteristics. In Proceedings of the PHYSOR 2004, The Physics of Fuel Cycles and Advanced Nuclear Systems: Global Developments, Chicago, IL, USA, 25–29 April 2004. [Google Scholar]
  23. Stamm’ler, HELIOS Methods; Studsvik Scandpower: Wilmington, NC, USA, 2008.
  24. Chadwick, M.B.; Obložinský, P.; Herman, M.; Greene, N.M.; McKnight, R.D.; Smith, D.L.; Young, P.G.; MacFarlane, R.E.; Hale, G.M.; Frankle, S.C.; et al. ENDF/B-VII.0: Next Generation Evaluated Nuclear Data Library for Nuclear Science and Technology. Nucl. Data Sheets 2006, 107, 2931–3060. [Google Scholar] [CrossRef]
  25. Pusa, M. Rational Approximations to the Matrix Exponential in Burnup Calculations. Nucl. Sci. Eng. 2011, 169, 155–167. [Google Scholar] [CrossRef]
  26. Tian, C.; Zheng, Y.Q.; Li, Y.; Zhang, H.; Ying, D.; Tan, Y.; Lou, L. Application of High-order Predict-correct Burnup Method in PWR Assembly Calculation. At. Energy Sci. Technol. 2017, 51, 1765–1770. [Google Scholar]
Figure 1. Illustration of predictor–corrector algorithm.
Energies 17 03792 g001
Figure 2. Illustratation of PPC and LLR algorithms.
Energies 17 03792 g002
Figure 3. Illustration of HOPC algorithms.
Energies 17 03792 g003
Figure 4. Structural diagram of FCM lattice cell with double-particle type.
Energies 17 03792 g004
Figure 5. The structural diagram of FCM lattice cell with single-particle type.
Energies 17 03792 g005
Figure 6. Single particle with Gd2O3 layer (pf = 20%).
Energies 17 03792 g006
Figure 7. Single particle with Gd2O3 layer (pf = 30%).
Energies 17 03792 g007
Figure 8. Single particle with Gd2O3 layer (pf = 40%).
Energies 17 03792 g008
Figure 9. Double particle (fuel particle pf = 30%, Gd2O3 particle pf = 10%).
Energies 17 03792 g009
Figure 10. Double particle (fuel particle pf = 25%, Gd2O3 particle pf = 15%).
Energies 17 03792 g010
Figure 11. Double particle (fuel particle pf = 20%, Gd2O3 particle pf = 20%).
Energies 17 03792 g011
Figure 12. Atomic number density results for Gd-155 calculated with the LLR method.
Energies 17 03792 g012
Figure 13. Atomic number density results for Gd-157 calculated with the LLR method.
Energies 17 03792 g013
Figure 14. Relative error of nuclide number density for Gd-155 in single-particle problem with a step size of 0.5 GWd/tU.
Energies 17 03792 g014
Figure 15. Relative error of nuclide number density for Gd-155 in double-particle problem with a step size of 0.5 GWd/tU.
Energies 17 03792 g015
Figure 16. Relative error of nuclide number density for Gd-157 in single-particle problem with a step size of 0.5 GWd/tU.
Energies 17 03792 g016
Figure 17. Relative error of nuclide number density for Gd-157 in double-particle problem with a step size of 0.5 GWd/tU.
Energies 17 03792 g017
Figure 18. Relative error of nuclide number density for Gd-155 in single-particle problem with a step size of 1.0 GWd/tU.
Energies 17 03792 g018
Figure 19. Relative error of nuclide number density for Gd-155 in double-particle problem with a step size of 1.0 GWd/tU.
Energies 17 03792 g019
Figure 20. Relative error of nuclide number density for Gd-157 in single-particle problem with a step size of 1.0 GWd/tU.
Energies 17 03792 g020
Figure 21. Relative error of nuclide number density for Gd-157 in double-particle problem with a step size of 1.0 GWd/tU.
Energies 17 03792 g021
Table 1. Weight coefficient table of high-order correction method.
Modified MethodAbbreviation w P S w B O S w E O S
Constant extrapolationCE010
Linear extrapolationLE t 2 t p 1 + t 2 t p 0
Linear interpolationLI0 1 2 1 2
Quadratic interpolationQI t 2 6 t p ( t + t p ) 1 2 + t 6 t p 1 2 t 6 ( t + t p )
Table 2. List of problem types.
Case TypePacking Fraction 1Packing Fraction 2Packing Fraction 3
Single-particle20%30%40%
Double-particle30% fuel particles + 10% poison particles25% fuel particles + 15% poison particles20% fuel particles +20% poison particles
Table 3. Particle size.
Fuel ParticlePoison Kernel ParticlePoison Coated Particle
MaterialRadius (cm)MaterialRadius (cm)MaterialRadius (cm)
UC (14.3 wt%)0.0350Gd2O30.020UC (14.3 wt%)0.0350
Gd2O30.0355
Buffer0.0400Buffer0.0400Buffer0.0400
IPyC0.0435IPyC0.0435IPyC0.0435
SiC0.0470SiC0.0470SiC0.0470
OPyC0.0490OPyC0.0490OPyC0.0490
Table 4. Geometry parameters of a pin cell.
ComponentMaterialRadius or Half-Pitch (cm)
FuelTRISO and matrix0.6252
GapHelium0.6357
CladdingSS3040.6907
ModeratorWater0.8250
Table 5. Material density.
MaterialDensity (g·cm−3)
UC (14.3 wt%)12.95
Er2O38.64
B4C2.52
Gd2O37.407
Buffer1.05
IPyC/OPyC1.90
SiC3.18
Helium6.0 × 10−3
SS-3047.90
Water (300K)1.0
Table 6. Step size settings.
Step Size SchemeStep Size Setting
Base step size: 0.10 GWd/tU0.10 × 300
Test step size: 0.25 GWd/tU0.10, 0.15, 0.25 × 118
Test step size: 0.50 GWd/tU0.10, 0.40, 0.50 × 58
Test step size: 1.00 GWd/tU0.10, 0.90, 1.00 × 28
Test step size: 2.00 GWd/tU0.10, 0.90, 1.00, 2.00 × 14
Table 7. Root mean square error (RMSE) of each case (pcm).
PC-0.25PC-0.5PC-1.0LE/LI-0.5LE/LI-1.0LE/LI-2.0LE/QI-0.5
Single, pf = 40%23.2298.05382.33104.60214.18255.1039.78
Single, pf = 30%25.09108.03424.92121.78271.18311.4140.32
Single, pf = 20%25.89113.23449.31146.16353.36337.1841.99
Double, pf = 20%27.41123.94506.21158.82267.65327.2295.49
Double, pf = 15%22.69102.38418.08112.33187.63204.4664.49
Double, pf = 10%17.0176.35311.0970.29116.00106.7137.94
LE/QI-1.0LE/QI-2.0CE/QI-0.5CE/QI-1.0CE/QI-2.0CE/LI-0.5CE/LI-1.0
Single, pf = 40%17.74210.6935.92234.31590.8319.0355.79
Single, pf = 30%13.20235.0437.49226.98534.1932.3912.33
Single, pf = 20%24.51315.0228.98186.69433.9263.09117.43
Double, pf = 20%49.22285.0933.87394.871474.498.47260.10
Double, pf = 15%22.98258.7042.35344.791237.6615.84249.07
Double, pf = 10%6.85206.7642.14269.10929.4725.37209.53
CE/LI-2.0PPC-0.5PPC-1.0PPC-2.0LLR-0.5LLR-1.0LLR-2.0
Single, pf = 40%225.1818.0047.96474.5233.2238.15264.73
Single, pf = 30%78.3722.3367.82503.4142.3042.73293.00
Single, pf = 20%133.5725.0096.52377.5750.1644.15192.66
Double, pf = 20%1074.0556.4886.37330.2168.57162.0617.04
Double, pf = 15%950.9043.1760.25295.7252.87121.1038.79
Double, pf = 10%748.4329.6336.29238.5636.8080.7754.58
Table 8. Max error of each case (pcm).
PC-0.25PC-0.5PC-1.0LE/LI-0.5LE/LI-1.0LE/LI-2.0LE/QI-0.5
Single, pf = 40%49.1208.4818.3215.6448.3621.674.4
Single, pf = 30%57.8250.6996.6273.5613.2812.779.7
Single, pf = 20%66.7294.21183.4368.1892.0747.893.5
Double, pf = 20%61.3277.21129.1358.9607.6743.4214.9
Double, pf = 15%49.0221.3901.7246.9413.1467.0140.5
Double, pf = 10%35.3158.8645.4151.2249.4237.881.2
LE/QI-1.0LE/QI-2.0CE/QI-0.5CE/QI-1.0CE/QI-2.0CE/LI-0.5CE/LI-1.0
Single, pf = 40%44.1510.285.9508.11290.433.9116.2
Single, pf = 30%41.8543.093.9538.21275.165.420.5
Single, pf = 20%82.9801.683.2482.01127.8153.9297.9
Double, pf = 20%108.9683.574.6882.73444.019.1570.7
Double, pf = 15%47.4602.990.0746.12782.828.1528.8
Double, pf = 10%16.0466.885.4560.22020.947.2427.5
CE/LI-2.0PPC-0.5PPC-1.0PPC-2.0LLR-0.5LLR-1.0LLR-2.0
Single, pf = 40%479.039.8118.61128.375.679.3673.3
Single, pf = 30%188.248.0188.51491.598.085.3926.8
Single, pf = 20%326.153.0318.11145.7127.1107.7626.6
Double, pf = 20%2473.8126.7191.6771.5153.9362.835.6
Double, pf = 15%2117.493.7127.8686.2115.2261.399.4
Double, pf = 10%1604.662.075.4527.378.3168.7131.2
Disclaimer/Publisher’s Note: The statements, opinions and data contained in all publications are solely those of the individual author(s) and contributor(s) and not of MDPI and/or the editor(s). MDPI and/or the editor(s) disclaim responsibility for any injury to people or property resulting from any ideas, methods, instructions or products referred to in the content.