Article

A Physics-Based Equivalent Circuit Model and State of Charge Estimation for Lithium-Ion Batteries

1
GAC Automotive Research & Development Center, Guangzhou 511434, China
2
School of Mechanical & Automotive Engineering, South China University of Technology, Guangzhou 510641, China
*
Author to whom correspondence should be addressed.
Energies 2024, 17(15), 3782; https://doi.org/10.3390/en17153782
Submission received: 6 July 2024 / Revised: 28 July 2024 / Accepted: 30 July 2024 / Published: 31 July 2024
(This article belongs to the Section E: Electric Vehicles)

Abstract

:
This paper proposes a novel physics-based equivalent circuit model of the lithium-ion battery for electric vehicle applications that has comprehensive electrochemical significance and an acceptable level of complexity. Initially, the physics-based extended single particle (ESP) model is improved by adding a correction term to mitigate its voltage bias. Then, the equivalent circuit model based on the improved extended single particle (ECMIESP) model is derived. In this model, the surface state of charge (SOC) of solid particles is approximated using a capacity and multi first-order resistance-capacity equivalent circuits with only two lumped parameters. The overpotential of electrolyte diffusion is approximated using a first-order resistance-capacitance equivalent circuit. The electrochemical reaction overpotential is characterized by a nonlinear resistance. The voltage accuracies of ECMIESP and conventional 2RC equivalent circuit model (ECM2RC) are compared across the entire SOC range under various load profiles. The results demonstrate that the ECMIESP model outperforms ECM2RC model, particularly at low SOC or when the electrochemical reaction overpotential exceeds 50 mV. For instance, the ECMIESP model shows an 820.4 mV reduction in voltage error compared to the ECM2RC model at the endpoint during a 2C constant current discharge test. Lastly, the ECMIESP model was used for SOC estimation with extended Kalman filter, resulting in significantly improved accuracy compared to the conventional ECM2RC model. Therefore, the ECMIESP model has great potential for real-time applications in enhancing voltage and SOC estimation precision.

1. Introduction

Lithium-ion batteries have been widely utilized as the power source for many systems due to their numerous advantages [1,2]. In order to ensure safety, efficiency, and durability during operation, a reliable battery management system (BMS) is essential in the lithium-ion battery system. In battery management techniques, battery modeling is a fundamental issue for almost all functions [3], such as state of charge (SOC) estimation, state of health (SOH) estimation, and state of power (SOP) capability prediction. Therefore, there is a strong need for a simple yet accurate battery model that can represent the dynamic performance of lithium-ion batteries [3].
The commonly utilized lithium-ion battery models can be categorized into equivalent circuit models (ECMs) [4,5,6,7,8] and physics-based electrochemical models [9,10,11,12,13] and data-driven models [14,15,16,17]. Data-driven models use data and computational intelligence to describe battery behavior without requiring prior understanding of the battery’s internal structure. However, data-driven models have the disadvantage of their accuracy being completely dependent on the quality of the training data and high storage requirements [14]. Comparing to various experiential equivalent circuit models, the physics-based electrochemical model can capture electrochemical reaction dynamics and predict the batteries’ behavior under any type of operating conditions with better accuracy [12]. Among the physics-based electrochemical models, the rigorous physics-based pseudo-two-dimensional model (P2D model) developed by M. Doyle et al. is widely used to describe the electrochemical behavior of lithium-ion batteries [9]. The precision of the P2D model is very high, and the various electrochemical processes inside the battery could be simulated [18]. Unfortunately, the P2D model requires extensive computations due to its involvement with complex coupled partial differential equations (PDEs). As a result, it cannot be directly utilized in BMS for real-time estimation and control on actual vehicles [18]. Several attempts have been made to simplify the P2D model by making different assumptions and approximations. By assuming a uniform reaction distribution within each electrode and neglecting the spatial differences of potential and lithium-ion concentration in electrolyte, Santhanagopalan et al. [19] developed the single-particle model (SP). The SP model can be quickly simulated, but is only valid for limited conditions, such as low rates and thin electrodes [10]. The SP model was further enhanced by incorporating the electrolyte potential, resulting in the extended single particle (ESP) model [11,12,18,20,21]. The complexity of the ESP model is heightened in comparison to the SP model, due to its inclusion of potential in the electrolyte. ESP demonstrates higher accuracy over the SP model, particularly in high-rate conditions [18,22].
Several studies have been conducted to simplify the calculation of the ESP model and obtain its approximate transfer function. For example, Rahimian et al. [20] used the volume averaging method to solve lithium-ion concentration in solid particles within the ESP model and employed polynomial approximation to determine the potential distribution in the electrolyte. Marcicki et al. [23] utilized Padé approximation to obtain transfer functions for lithium-ion concentration in solid particles and electrolyte. Xu et al. [24] simplified the liquid-phase and solid-phase diffusion processes in aged LiFePO4 batteries using Padé approximation. Yuan et al. [25,26] utilized Padé approximation to derive transfer functions for lithium-ion concentration in solid particles and electrolyte by modifying the boundary conditions of electrolyte distribution in the P2D model. They simplified the calculation of solid-electrolyte interface reaction overpotential by linearizing the Butler–Volmer equation. Li et al. [3,27] utilized fractional-order transfer function to estimate lithium-ion concentration in solid particles and modeled the electrolyte diffusion overpotential using a first-order resistance-capacity equivalent circuit based on polynomial approximation method. They also utilized the linearized approximation of the Butler–Volmer equation to calculate the reaction overpotential at the solid electrolyte interface (SEI). Guo et al. [28] utilized the Padé approximation method to derive a fractional-order transfer function for calculating the lithium-ion concentration on the surface of solid particle, while also considering the impact of double-layer capacitance effects on SEI film. These approximated transfer functions of the ESP model can be applied to the online estimation of battery state in applications. However, these models are still much more complex than ECMs.
The equivalent circuit model (ECM) represents battery performance through an electrical circuit consisting of fundamental electrical components such as resistors, capacitors, and inductors [29]. Due to its computational simplicity and ease of parameterization, the ECM is widely employed in onboard Battery Management Systems (BMSs) and their parameters are typically derived from curve fitting methods [18,29]. However, it should be noted that conventional ECMs lack immediate electrochemical significance, resulting in lower accuracy compared to electrochemical models under many conditions [18,29]. The existing literature suggests that while the conventional ECM can provide satisfactory voltage and SOC results in high and middle SOC ranges, its accuracy tends to decrease at low SOC levels [29,30]. To overcome this limitation, researchers have recently incorporated more electrochemical principles into equivalent circuit models to enhance their accuracy. For instance, Fleischer et al. [31,32] proposed a novel simplified equivalent circuit model that incorporates a current-dependent resistance and represents mass transport effects using a Warburg element. Ouyang et al. [29] proposed an extended equivalent circuit model based on the single particle model, which represents solid-phase diffusion processes through SOC differences within solid particles and determines battery terminal voltage based on the surface SOC of solid particles. Results indicate that this new equivalent circuit model significantly improves modeling accuracy at low SOC stages. Zheng et al. [33] developed an electrochemistry-based equivalent circuit model by adding lithium-ion concentration in the solid phase to the conventional ECM., demonstrating superior performance compared to conventional 2RC model, particularly at low SOC stages.
The above results show that incorporating electrochemical mechanisms into the ECM model can effectively improve the accuracy of the ECM model. An equivalent circuit model with more thorough electrochemical significance and acceptable complexity for the onboard applications is still desired. To address this objective, we propose a novel physics-based equivalent circuit model that is well-suited for onboard applications. This model offers computational simplicity, ease of parameterization and clear electrochemical significance. At the beginning, the bias of the electrochemical reaction overpotential in the physics-based ESP model is analyzed. The ESP model is then enhanced by incorporating a correction term to mitigate this bias, resulting in an improved model called the Improved Extended Single Particle (IESP) model. Subsequently, every electrochemical process in the IESP model is represented by an equivalent circuit model. Specifically, the diffusion kinetics in the solid phase is approximated using multi first-order resistance-capacity equivalent circuits with only two lumped parameters. The overpotential of electrolyte diffusion is approximated by a first-order resistance-capacitance equivalent circuit with only two lumped parameters [3]. The electrochemical reaction overpotential, governed by the Butler–Volmer equation, is represented as a nonlinear resistance that effectively captures the nonlinear current-dependent behavior of the electrochemical reaction overpotential. In contrast to the conventional approach of approximating the Butler–Volmer equation with a linear equation, this method can significantly improve the accuracy of the electrochemical reaction overpotential when it exceeds 0.05 V. The correction term of the IESP is derived and approximated as one-third of the voltage drop in the electrolyte. Ultimately, a novel equivalent circuit model based on the IESP model (ECMIESP) is derived by combining the equivalent circuit models of all electrochemical processes of the IESP model. The ECMIESP model is much simpler than the original IESP model, featuring only 12 lumped parameters instead of the original 32. This simplification will facilitate the application of the ECMIESP model in engineering. Furthermore, the ECMIESP model possesses explicit and conceptually electrochemical significance, making it more precise and conceptually clear than conventional equivalent circuit models. The modeling accuracies of the ECMIESP model and the conventional 2RC equivalent circuit model (ECM2RC) are compared across four distinct load profiles. The results indicate that, as expected, the ECMIESP model exhibits higher accuracy compared to the conventional ECM2RC model, particularly at low SOC stages. Furthermore, the ECMIESP also surpasses the ECM2RC in capturing non-linear current-dependent behavior of battery internal resistance, resulting in significantly enhanced accuracy at high currents. Lastly, the ECMIESP model has been used in SOC estimation based on extended Kalman filter (EKF), and the results show that its accuracy is significantly improved compared to the estimating accuracy obtained using the ECM2RC model.
The outline of this paper is as follows: Section 2 introduces the physics-based model, including P2D, ESP, and IESP models. Section 3 presents the transformation of the IESP model into equivalent circuit model. In Section 4, a comparison between the voltage obtained in the ECMIESP model and those of the P2D and ECM2RC models is conducted to validate the accuracy of ECMIESP. Section 5 compares the SOC estimations using both ECMIESP and ECM2RC models. Finally, conclusions are provided in Section 6.

2. Electrochemical Model of Lithium-Ion Battery

2.1. The Pseudo-Two-Dimensional Model

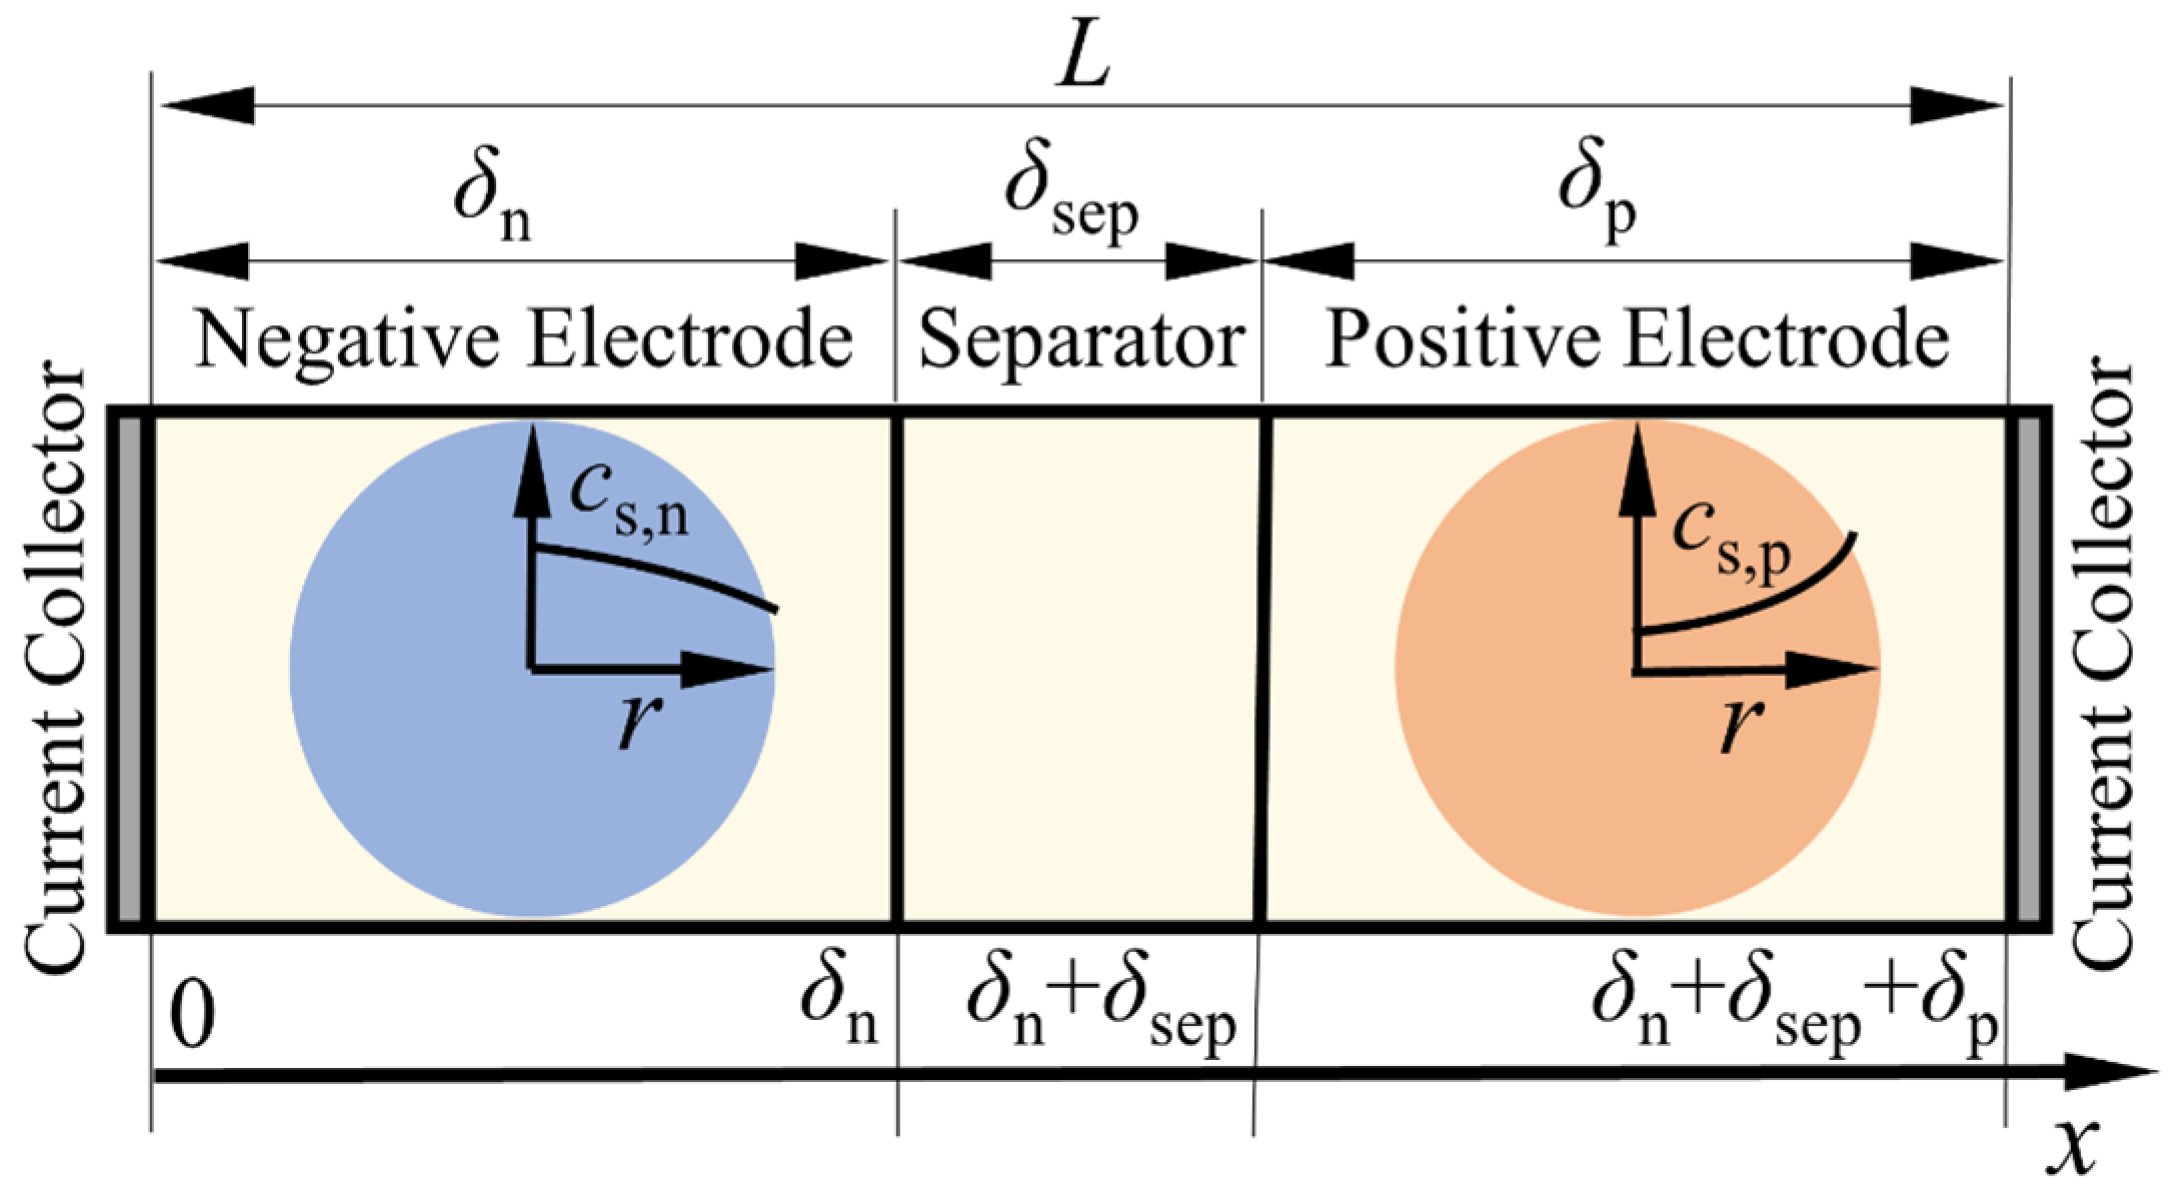
The pseudo-two-dimensional (P2D) model, proposed by Doyle, Fuller, and Newman, is a widely used rigorous physics-based full-order lithium-ion battery model [9]. It is based on porous electrode theory and concentrated solution theory. Figure 1 illustrates the physical structure of the P2D model. In this model, the electrode is considered as a superposition of the electrolyte phase and solid phase. The solid phase consists of spherical particles at micrometer scale, through which lithium ions propagate via diffusion along the diameter direction. The P2D model focuses solely on the transport of lithium ions along the thickness direction in the electrolyte phase during discharge (lithium ions diffuse from negative electrode to positive electrode through separator) and charging (vice versa). Electrochemical reactions occur at the interface between solid particles and electrolyte according to Butler–Volmer kinetics. Table 1 presents detailed governing equations for the P2D model while Table 2 provides battery parameters used in subsequent simulations [12,22]. Specifically, LiCoO2 serves as the positive electrode active material, while MCMB (mesocarbon microbead) serves as the negative electrode active material.
Negative electrode open circuit potential:
V ocp , n = E e q , n ( θ n ) = 0.194 + 1.5 exp ( 120 θ n ) + 0.0351 tanh ( ( θ n 0.286 ) / 0.083 ) 0.0045 tanh ( ( θ n 0.849 ) / 0.119 ) 0.035 tanh ( ( θ n 0.9233 ) / 0.05 ) 0.0147 tanh ( ( θ n 0.5 ) / 0.034 ) 0.102 tanh ( ( θ n 0.194 ) / 0.142 ) 0.022 tanh ( ( θ n 0.9 ) / 0.0164 ) 0.011 tanh ( ( θ n 0.124 ) / 0.0226 ) + 0.0155 tanh ( ( θ n 0.105 ) / 0.029 )
Positive electrode open circuit potential:
V ocp , p = E e q , p ( θ p ) = 2.16216 + 0.07645 tanh ( 30.834 54.4806 θ p ) + 2.1581 tanh ( 52.294 50.294 θ p ) 0.14169 tanh ( 11.0923 19.8543 θ p ) + 0.2501 tanh ( 1.4684 5.4888 θ p ) + 0.2531 tanh ( ( 0.56478 θ p ) / 0.1316 ) 0.02167 tanh ( ( θ p 0.525 ) / 0.006 )
The precision of the P2D model is very high, enabling accurate simulation of various electrochemical processes occurring within the battery [18]. However, since the P2D model requires spatial discretization (in x and r dimensions) through a finite difference method using a set of differential equations in terms of the field variables, it usually takes minutes to hours to numerically solve the system depending on the solvers, routines, computers, etc. [12,34]. Consequently, the direct application of the P2D model for online estimation and real-time control in BMS on actual vehicles poses significant challenges. Therefore, simplification of the P2D model is necessary [18].

2.2. The Extended Single Particle Model

The widely used simplified physics-based model, known as the extended single particle (ESP) model [11,12,18,20,21], is based on the assumption of uniform electrochemical reaction along the x-axis in each electrode. It assumes that all particles in the electrode exhibit identical behavior and that current passing through the electrode is uniformly distributed among all particles. Consequently, each electrode can be represented by a single spherical particle. For enhanced accuracy, the ESP model incorporates both ohmic effect and concentration distribution of the electrolyte, which are described by sets of partial differential equations. Figure 2 illustrates the physical structure of the ESP model while Table 3 presents its governing equations. The parameters utilized in the ESP model are also taken from Table 2.

2.3. Improved Extended Single Particle Model

In reference [22], Han indicates that the voltage obtained from the ESP model is consistently lower than that of the P2D model during discharge. To mitigate this bias, Han proposes a method to correct the electrolyte overpotential in the ESP model using a calibration factor [22]. The correction coefficient is determined by comparing the voltages of both models under constant current discharge. In this section, we propose an alternative approach to derive a correction term for mitigating the bias in ESP model.
As an example for analysis, Figure 3 compares the potential distributions inside the battery of both P2D and ESP models after discharging at a current rate of 2C for 140 s from an initial SOC of 30%. The electrochemical reaction overpotentials along the thickness direction in both electrodes of the ESP model can be calculated as follows:
η bv , ESP , n ( x ) = η bv , avg , n + ϕ e x = 0 ϕ e ( x ) η bv , ESP , p ( x ) = η bv , avg , p + ϕ e x = L ϕ e ( x )
where η bv , avg , n and η bv , avg , p are calculated using the Butler–Volmer equation, as shown in Equation (25), based on the j f avg shown in Equation (28). Then, the actual average electrochemical reaction overpotential of both electrodes in the ESP model can be calculated by:
η bv , ESP , n avg = 0 δ n η bv , ESP , n ( x ) d x δ n = η bv , avg , n + ϕ e x = 0 0 δ n ϕ e ( x ) d x δ n η bv , ESP , p avg = δ n + δ sep L η bv , ESP , p ( x ) d x δ n = η bv , avg , p + ϕ e x = L δ n + δ sep L ϕ e ( x ) d x δ p
Define:
Δ ϕ e , SP , avg , n = ϕ e x = 0 0 δ n ϕ e ( x ) d x δ n , Δ ϕ e , SP , avg , p = ϕ e x = L δ n + δ sep L ϕ e ( x ) d x δ p
where Δ ϕ e , SP , avg , n represents the voltage difference between the electrolyte potential at x = 0 and the average electrolyte potential in the negative electrode of the ESP model, while Δ ϕ e , SP , avg , p represents the difference between the electrolyte potential at x = L and the average electrolyte potential in the positive electrode of the ESP model.
As shown from Equation (31), the total average electrochemical reaction overpotential of both electrodes in the ESP model is biased by Δ ϕ e , SP , avg , n + Δ ϕ e , SP , avg , p from the value calculated from the average reaction ion pore wall flux j f avg . The electrochemical reaction overpotentials calculated from the j f avg are considered as closer to the true physics of a battery. Therefore, this bias compromises the accuracy of the ESP model.
To enhance the accuracy of ESP model, we propose an improved extended single particle model (IESP) model, which adds correction terms Δ ϕ e , avg , n and Δ ϕ e , avg , p into the negative and positive electrode potential balance equations of ESP model to mitigate its bias in electrochemical reaction overpotential. Then, the actual electrochemical reaction overpotentials along the x direction in both electrodes of the IESP model can be calculated as follows:
η bv , IESP , x , n ( x ) = η bv , ESP , x , n ( x ) Δ ϕ e , SP , avg , n η bv , IESP , x , p ( x ) = η bv , ESP , x , p ( x ) Δ ϕ e , SP , avg , p
The average electrochemical reaction overpotentials of both electrodes in the IESP model can be calculated as follows:
η bv , IESP , n avg = 0 δ n η bv , ESP , x , n ( x ) Δ ϕ e , SP , avg , n d x δ n = η bv , avg , n η bv , IESP , p avg = δ n + δ sep L η bv , ESP , x , p ( x ) Δ ϕ e , SP , avg , p d x δ p = η bv , avg , p
Equation (34) demonstrates that the average electrochemical reaction overpotentials of the IESP model are not biased compared to those calculated from the average reaction ion pore wall flux. Therefore, it is expected that the IESP model has higher accuracy than the ESP model. The IESP model requires only an additional correction term, denoted as Δ ϕ e , avg , n + Δ ϕ e , avg , p . The terminal voltage of IESP model can be computed using:
V t , IESP = V t , IESP Δ ϕ e , SP , avg , n + Δ ϕ e , SP , avg , p = V ocp , surf , p V ocp , surf , n + η bv , p η bv , n + η SEI , p η SEI , n + Δ ϕ e Δ ϕ e , SP , avg , n + Δ ϕ e , SP , avg , p
A pulse discharge pulse charge (PDPC) test with a maximum current rate of 2C and a highway fuel economy test (HWFET) with a maximum current rate of 4C were utilized to compare the accuracy of the ESP and IESP models. The HWFET starts from an initial SOC of 100% and ends when the terminal voltage reaches the lower cut-off voltage. In the HWFET, the range of SOC for this test is from 100% to 3%. The current profiles of the two tests are illustrated in Figure 4a,b, while Figure 4c–f illustrate the voltages and errors of P2D, ESP, and IESP models under the two tests. The battery voltages of the P2D model were used as the reference value due to its high accuracy. The maximum absolute error (MAXE) of the voltage in the IESP model is 3.0 mV in the PDPC test and 12.8 mV in the HWFET test, which are 15.5 mV and 12.2 mV lower than those of the ESP model, respectively. These results demonstrate that the voltage accuracy of the IESP model is higher than that of the ESP model. Therefore, in this study, we used IESP as our starting point for developing the physics-based ECM model.

3. ECM of Improved Extended Single Particle Model

The physical dynamics of the IESP model are described by partial differential equations (PDEs) and numerous electrochemical parameters. From the perspective of control applications, it is challenging to establish the state transition equations or apply state estimation methods directly to a system described by PDEs. These challenges hinder the application of the ESP model in real-time scenarios. To enhance its suitability for real-time applications, this section simplifies the IESP model into equivalent circuit models.

3.1. Solid Phase Diffusion Approximation

The concentration of lithium ions on the surface of solid particles in the IESP model can be decomposed as follows:
c s , surf = c s , avg + c s , diff
where c s , avg represents the volume average concentration of lithium ions in the solid particle, and c s , diff represents the difference in concentration between the surface and the volume average concentration of lithium ions in the solid particle.
Laplace transform can be applied to Equation (22) in order to obtain the transfer function that relates the surface concentration c s , surf and ion pore wall flux j f avg as [3,25]:
c s , surf s j f avg s = R s D s tanh ρ s ρ s tanh ρ s
where ρ = R s 2 D s .
The transfer function between the volume average concentration c s , avg and the ion pore wall flux j f avg is [3,25,35]:
c s , avg s j f avg s = 3 R s s
Substituting Equations (37) and (38) into Equation (36), the transfer function that relates the c s , diff and the ion pore wall flux j f avg can be expressed as:
c s , diff s j f avg s = R s D s G s , diff , sub s G s , diff , sub s = tanh ρ s ρ s tanh ρ s 3 ρ s = tanh λ λ tanh λ 3 λ
where λ = ρ s .
The transcendental function tanh is included in Equation (39), which makes it difficult to directly use this transfer function for numerical calculation. To simplify, an N-order transfer function consisting of multiple first-order systems is employed to fit the G s , diff , sub . The N-order approximate transfer function can be expressed as:
G s , diff , sub , NRC = α 1 1 + τ d , 1 λ + α 2 1 + τ d , 2 λ + + α N 1 + τ d , N λ
One of the constraints for fitting the G s , diff , sub is that the DC gain of G s , diff , sub , NRC and G s , diff , sub must be equal. Therefore, an equality constraint can be obtained as:
G s , diff , sub , NRC λ λ 0 = α 1 + α 2 + α n = G s , diff , sub λ λ 0 = 0.2
The genetic algorithm is utilized to identify the coefficients of G s , diff , sub , NRC with an equality constraint expressed in Equation (41). The objective function of the genetic algorithm is the Root Mean Square Error (RMSE) between G s , diff , sub , NRC and G s , diff , sub , which is:
O G s , diff , sub = Re G s , diff , sub , NRC Re G s , diff , sub 81 + Im G s , diff , sub , NRC Im G s , diff , sub 81
where · represents the Euclidean length of the vectors. Within the optimization framework, 81 logarithmically spaced frequency points have been taken within the frequency-band of λ 10 4 , 10 4 .
The identification results of G s , diff , sub , NRC are presented in Table 4. The frequency responses of G s , diff , sub and G s , diff , sub , NRC are compared in Figure 5. It is evident that the fitting accuracy increases as the order of the approximate transfer function increases. The frequency response of the 3rd and 4th approximate transfer functions are very close to those of G s , diff , sub .
This study employs normalized SOC to describe the lithium-ion concentration in the solid particle using ECM. The normalized SOC values of positive and negative solid particles are defined as follows:
Z p = c s , p c s , p , soc = 0 % c s , p , soc = 100 % c s , p , soc = 0 % Z n = c s , n c s , n , soc = 0 % c s , n , soc = 100 % c s , n , soc = 0 %
The full battery capacity is determined by:
C cap = A δ P ε s , p F ( c s , p , soc = 100 % c s , p , soc = 0 % ) = A δ n ε s , n F ( c s , n , soc = 100 % c s , n , soc = 0 % )
According to the definition of normalized SOC, the volume average normalized SOC of each solid particle is equal to the SOC of full battery Z full . This can be expressed as:
Z full = Z avg , p = Z avg , n = c s , avg , p c s , p , soc = 0 % c s , p , soc = 100 % c s , p , soc = 0 % = c s , avg , n c s , n , soc = 0 % c s , n , soc = 100 % c s , n , soc = 0 %
Define the normalized SOC difference between the surface and the volume average value of the solid particle as Z diff . The Z diff values of both solid particles are expressed as:
Z diff , p = Z surf , p Z avg , p Z diff , n = Z surf , n Z avg , n
By substituting Equations (28), (50), (48), and (40) into Equation (39), the transfer function that relates the surface normalized SOC of the solid particles and the applied load current is obtained as:
Z diff , p s I t s = ρ p 3 C cap α 1 1 + τ d , 1 ρ p s + α 2 1 + τ d , 2 ρ p s + + α N 1 + τ d , N ρ p s Z diff , n s I t s = ρ n 3 C cap α 1 1 + τ d , 1 ρ n s + α 2 1 + τ d , 2 ρ n s + + α N 1 + τ d , N ρ n s
where α k and τ d , k are the identified parameters as shown in Table 4, ρ p and ρ n are:
ρ i = R s , i 2 D s , i ,   i = n , p
Therefore, only two control parameters, namely the solid-phase diffusion control coefficient ρ i and the full battery capacity C cap , are required to calculate the Z diff , i .
In order to transform Equation (51) into an equivalent circuit, we define:
R k , n = α k ρ n 3 C cap k = 1 , 2 , , N R k , p = α k ρ p 3 C cap k = 1 , 2 , , N C k , n = C k , p = 3 τ d , k C cap α k k = 1 , 2 , , N
Subsequently, Equation (51) can be formulated as:
Z diff , p s I t s = R 1 , p 1 + R 1 , p C 1 , p s + + R N , p 1 + R N , p C N , p s Z diff , n s I t s = R 1 , n 1 + R 1 , n C 1 , n s + + R N , n 1 + R N , n C N , n s
By substituting Equations (28), (48), and (49) into Equation (38), the transfer function that relates the volume average normalized SOC of the solid particles and the applied load current is obtained as:
Z avg , n s I t s = Z avg , p s I t s = Z full s I t s = 1 C cap s
By combining Equations (54) and (55), the normalized SOC on the surface of solid particles can be obtained as:
Z surf , p s I t s = Z diff , p s + Z avg , p s I t s = 1 C cap s + R 1 , p 1 + R 1 , p C 1 , p s + + R N , p 1 + R N , p C N , p s Z surf , n s I t s = Z diff , n s + Z avg , n s I t s = 1 C cap s + R 1 , n 1 + R 1 , n C 1 , n s + + R N , n 1 + R N , n C N , n s
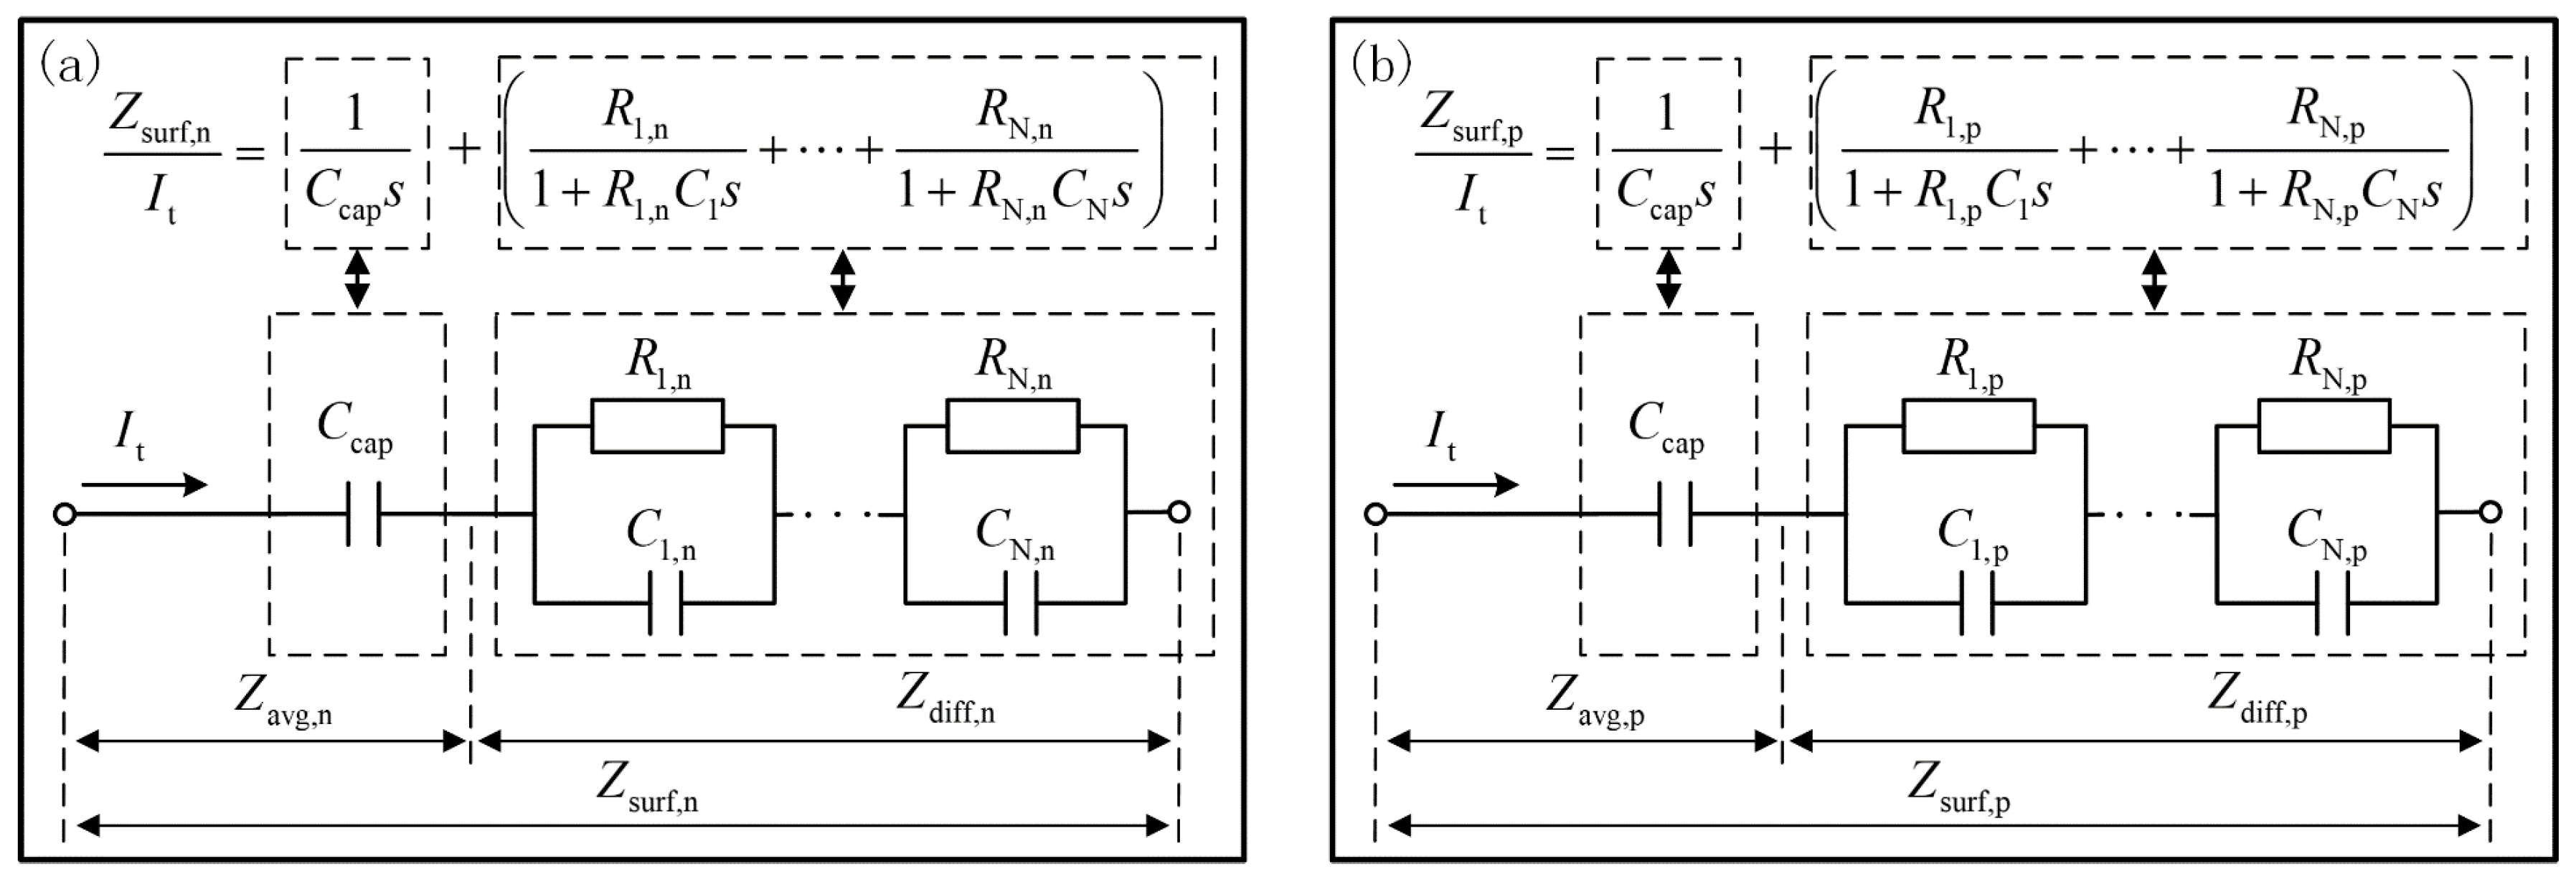
According to Equation (56), the equivalent circuit models that describe the relationship between the normalized SOC on the surface of solid particles and the applied load current can be derived, as illustrated in Figure 6.
The normalized SOC and errors on surface of positive solid particles, calculated by equivalent circuit models (ECMs) ranging from order 1 to 4 during the first cycle of the HWFET test, are illustrated in Figure 7. The surface normalized SOC calculated by the finite element method (FEM) method is considered as the true value and is also plotted in Figure 7. In the FEM method, the solid particle was divided evenly into 20 elements. It can be observed that the errors of Z surf , p decrease as the ECM order increases. The accuracies of the 3rd order and 4th order ECMs are quite good, with a MAXE of less than 0.1% in the 3rd order ECM and less than 0.05% in the 4th order ECM.
The relationships between the open circuit potential (OCP) of the solid particles and the normalized state of charge (SOC) can be expressed as follows:
V o c p , p = E e q , n o r m , p Z p = E e q , p θ p = E e q , p Z p c s , soc = 100 % , p c s , soc = 0 % , p + c s , soc = 0 % , p c s , max , p V o c p , n = E e q , n o r m , n Z n = E e q , n θ n = E e q , n Z n c s , soc = 100 % , n c s , soc = 0 % , n + c s , soc = 0 % , n c s , max , n
Then, the equivalent circuit model describing the relationship between the OCP and the normalized SOC at the surface of solid particles can be obtained as depicted in Figure 8a. The relationships between the normalized SOC and the OCP (SOC–OCP curves) of negative and positive solid particles are shown in Figure 8b,c.
Figure 9 illustrates the OCP and errors on the surface of positive solid particle calculated by the 1st to 4th order equivalent circuit models in the first cycle of HWFET test. It is evident that the errors of V o c p , p decrease as the ECM order increases. Taking into account both complexity and accuracy, the 3rd order approximate function is selected as the approximate solution for G s , diff , sub in this paper.

3.2. Electrolyte Diffusion Approximation

Li et al. [3] derived that the difference in electrolyte concentration between two current collectors in the ESP model can be approximated using a first-order resistance-capacity equivalent circuit with only two lumped physical parameters. In this approach, the polynomial approximation method [3,12,18,22,27] is utilized to obtain an approximate solution for the distribution of electrolyte concentration. This method was adopted in our study to simplify the calculation of electrolyte diffusion. To simplify further, the x coordinate was transformed to:
x n = x , 0 x δ n x sep = x δ n , δ n x δ n + δ sep x p = δ n + δ sep + δ p x , δ n + δ sep x δ n + δ sep + δ p
Quadratic and linear polynomials are used to approximate the distribution of electrolyte concentration in the electrodes and separator [3].
c e , n ( x n ) = a 1 x n 2 + a 2 x n + a 3 , 0 x n δ n c e , sep ( x sep ) = a 4 x sep + a 5 , 0 x sep δ sep c e , p ( x p ) = a 6 x p 2 + a 7 x p + a 8 , 0 x δ p
where a i are the coefficients to be identified.
Convert Equation (59) into the form of Laplace equation, resulting in:
c e , n ( s , x n ) = a 1 ( s ) x n 2 + a 2 ( s ) x n + a 3 ( s ) , 0 x n δ n c e , sep ( s , x sep ) = a 4 ( s ) x sep + a 5 ( s ) , 0 x sep δ sep c e , p ( s , x p ) = a 6 ( s ) x p 2 + a 7 ( s ) x p + a 8 ( s ) , 0 x δ p
According to the boundary conditions for electrolyte concentration in Equation (19), a total of 6 equations can be derived as:
a 2 ( s ) = 0 a 7 ( s ) = 0 D e , n eff 2 a 1 ( s ) δ n + a 2 ( s ) = D e , sep eff a 4 ( s ) D e , sep eff a 4 ( s ) = D e , p eff 2 a 6 ( s ) δ p + a 7 ( s ) a 1 ( s ) δ n 2 + a 2 ( s ) δ n + a 3 ( s ) = a 5 ( s ) a 4 ( s ) δ sep + a 5 ( s ) = a 6 ( s ) δ p 2 + a 7 ( s ) δ p + a 8 ( s )
The volume averaging of Equation (18) yields:
s a 1 ( s ) 3 δ n 3 + a 2 ( s ) 2 δ n 2 + a 3 ( s ) δ n = D e , n eff ε e , n 2 a 1 ( s ) δ n + a 2 ( s ) ( 1 t + ) I t ε e , n A F s a 6 ( s ) 3 δ p 3 + a 7 ( s ) 2 δ p 2 + a 8 ( s ) δ p = D e , p eff ε e , p 2 a 6 ( s ) δ p + a 7 ( s ) + ( 1 t + ) I t ε e , p A F
By solving the linear Equations (61) and (62), the eight undetermined coefficients in Equation (60) can be obtained. Subsequently, the approximate distribution of electrolyte concentration could be derived. Define the electrolyte concentration difference between two current collectors as Δ c e , full . The transfer function that relates Δ c e , full and the applied load current can be obtained as:
Δ c e , full I t = c e , p ( s , x p ) x p = 0 c e , n ( s , x n ) x n = 0 I t = a 8 ( s ) a 3 ( s ) I t = R ce , full τ ce , full s + 1
where:
R ce , full = ( 1 t + ) ε e , p A F δ n + ( 1 t + ) ε e , n A F δ p 2 ε e , n B r u g g ε e , p B r u g g δ s + ε e , n B r u g g ε e , sep B r u g g δ p + ε e , p B r u g g ε e , sep B r u g g δ n D e 2 ε e , n B r u g g ε e , sep B r u g g ε e , p B r u g g ε e , p δ n + 2 ε e B r u g g ε e , sep B r u g g ε e , n B r u g g ε e , n δ p τ ce , full = ε e , p B r u g g ε e , sep B r u g g δ n 2 δ p + ε e , n B r u g g ε e , sep B r u g g δ n δ p 2 + 3 ε e , n B r u g g ε e , p B r u g g δ n δ sep δ p D e 3 ε e , n B r u g g ε e , sep B r u g g ε e , p B r u g g ε e , p δ n + 3 ε e , p B r u g g ε e , sep B r u g g ε e , n B r u g g ε e , n δ p

3.3. Electrolyte Potential Approximation

Prada [11] derived the electrolyte potential difference between two current collectors in the ESP model as:
Δ ϕ e = ϕ e x = L ϕ e x = 0 = 2 R T ( 1 + β ) ( 1 t + ) F ln c e x = L c e x = 0 + δ n 2 A κ n eff + δ sep A κ sep eff + δ p 2 A κ p eff I t
Equation (65) reveals that the Δ ϕ e is composed of two parts, with the first part being associated with the difference of lithium-ion concentration in the electrolyte. Let us define this component as η e , full , ce . η e , full , ce can be mathematically expressed as:
η e , full , ce = 2 R T ( 1 + β ) ( 1 t + ) F ln c e x = L c e x = 0
The second part is related to the Ohmic resistance of the electrolyte. Define this part as η e , full , ohm , which can be expressed as:
η e , full , ohm = R e , full , ohm I t
where:
R e , full , ohm = δ n 2 A κ n eff + δ sep A κ sep eff + δ p 2 A κ p eff
The κ n eff , κ sep eff , and κ p eff are the effective electrolyte conductivity of the negative electrode, separator, and positive electrode, respectively. We assumed that the distributed electrolyte concentrations do not deviate significantly from the initial concentration. Therefore, when calculating the values of κ n eff , κ sep eff and κ p eff in the ECMIESP model, it was assumed that the lithium ion concentration in the electrolyte is equal to the initial value. This simplification allows R e , full , ohm to be represented by a linear ohmic internal resistance. Based on the assumption that the distributed electrolyte concentrations do not deviate significantly from the initial concentration, the first-order Taylor expansion can be utilized to simplify Equation (66) [3], yielding:
η e , full , ce = 2 R T ( 1 + β ) ( 1 t + ) F c e x = L c e x = 0 c e , o = 2 R T ( 1 + β ) ( 1 t + ) F Δ c e , full c e , o
where c e , o is the initial lithium-ion concentration of electrolyte.
By substituting Equation (63) into Equation (69), the transfer function relating the η e , full , ce and the applied load current is obtained as:
η e , full , ce ( s ) I t ( s ) = R e , full , ce τ e , full , ce s + 1
where:
R e , full , ce = 2 R T ( 1 + β ) ( 1 t + ) ( 1 t + ) ε e , p A F δ n + ( 1 t + ) ε e , n A F δ p 2 ε e , n B r u g g ε e , p B r u g g δ s + ε e , n B r u g g ε e , sep B r u g g δ p + ε e , p B r u g g ε e , sep B r u g g δ n F c e , o D e 2 ε e , n B r u g g ε e , sep B r u g g ε e , p B r u g g ε e , p δ n + 2 ε e B r u g g ε e , sep B r u g g ε e , n B r u g g ε e , n δ p τ e , full , ce = ε e , p B r u g g ε e , sep B r u g g δ n 2 δ p + ε e , n B r u g g ε e , sep B r u g g δ n δ p 2 + 3 ε e , n B r u g g ε e , p B r u g g δ n δ sep δ p D e 3 ε e , n B r u g g ε e , sep B r u g g ε e , p B r u g g ε e , p δ n + 3 ε e , p B r u g g ε e , sep B r u g g ε e , n B r u g g ε e , n δ p
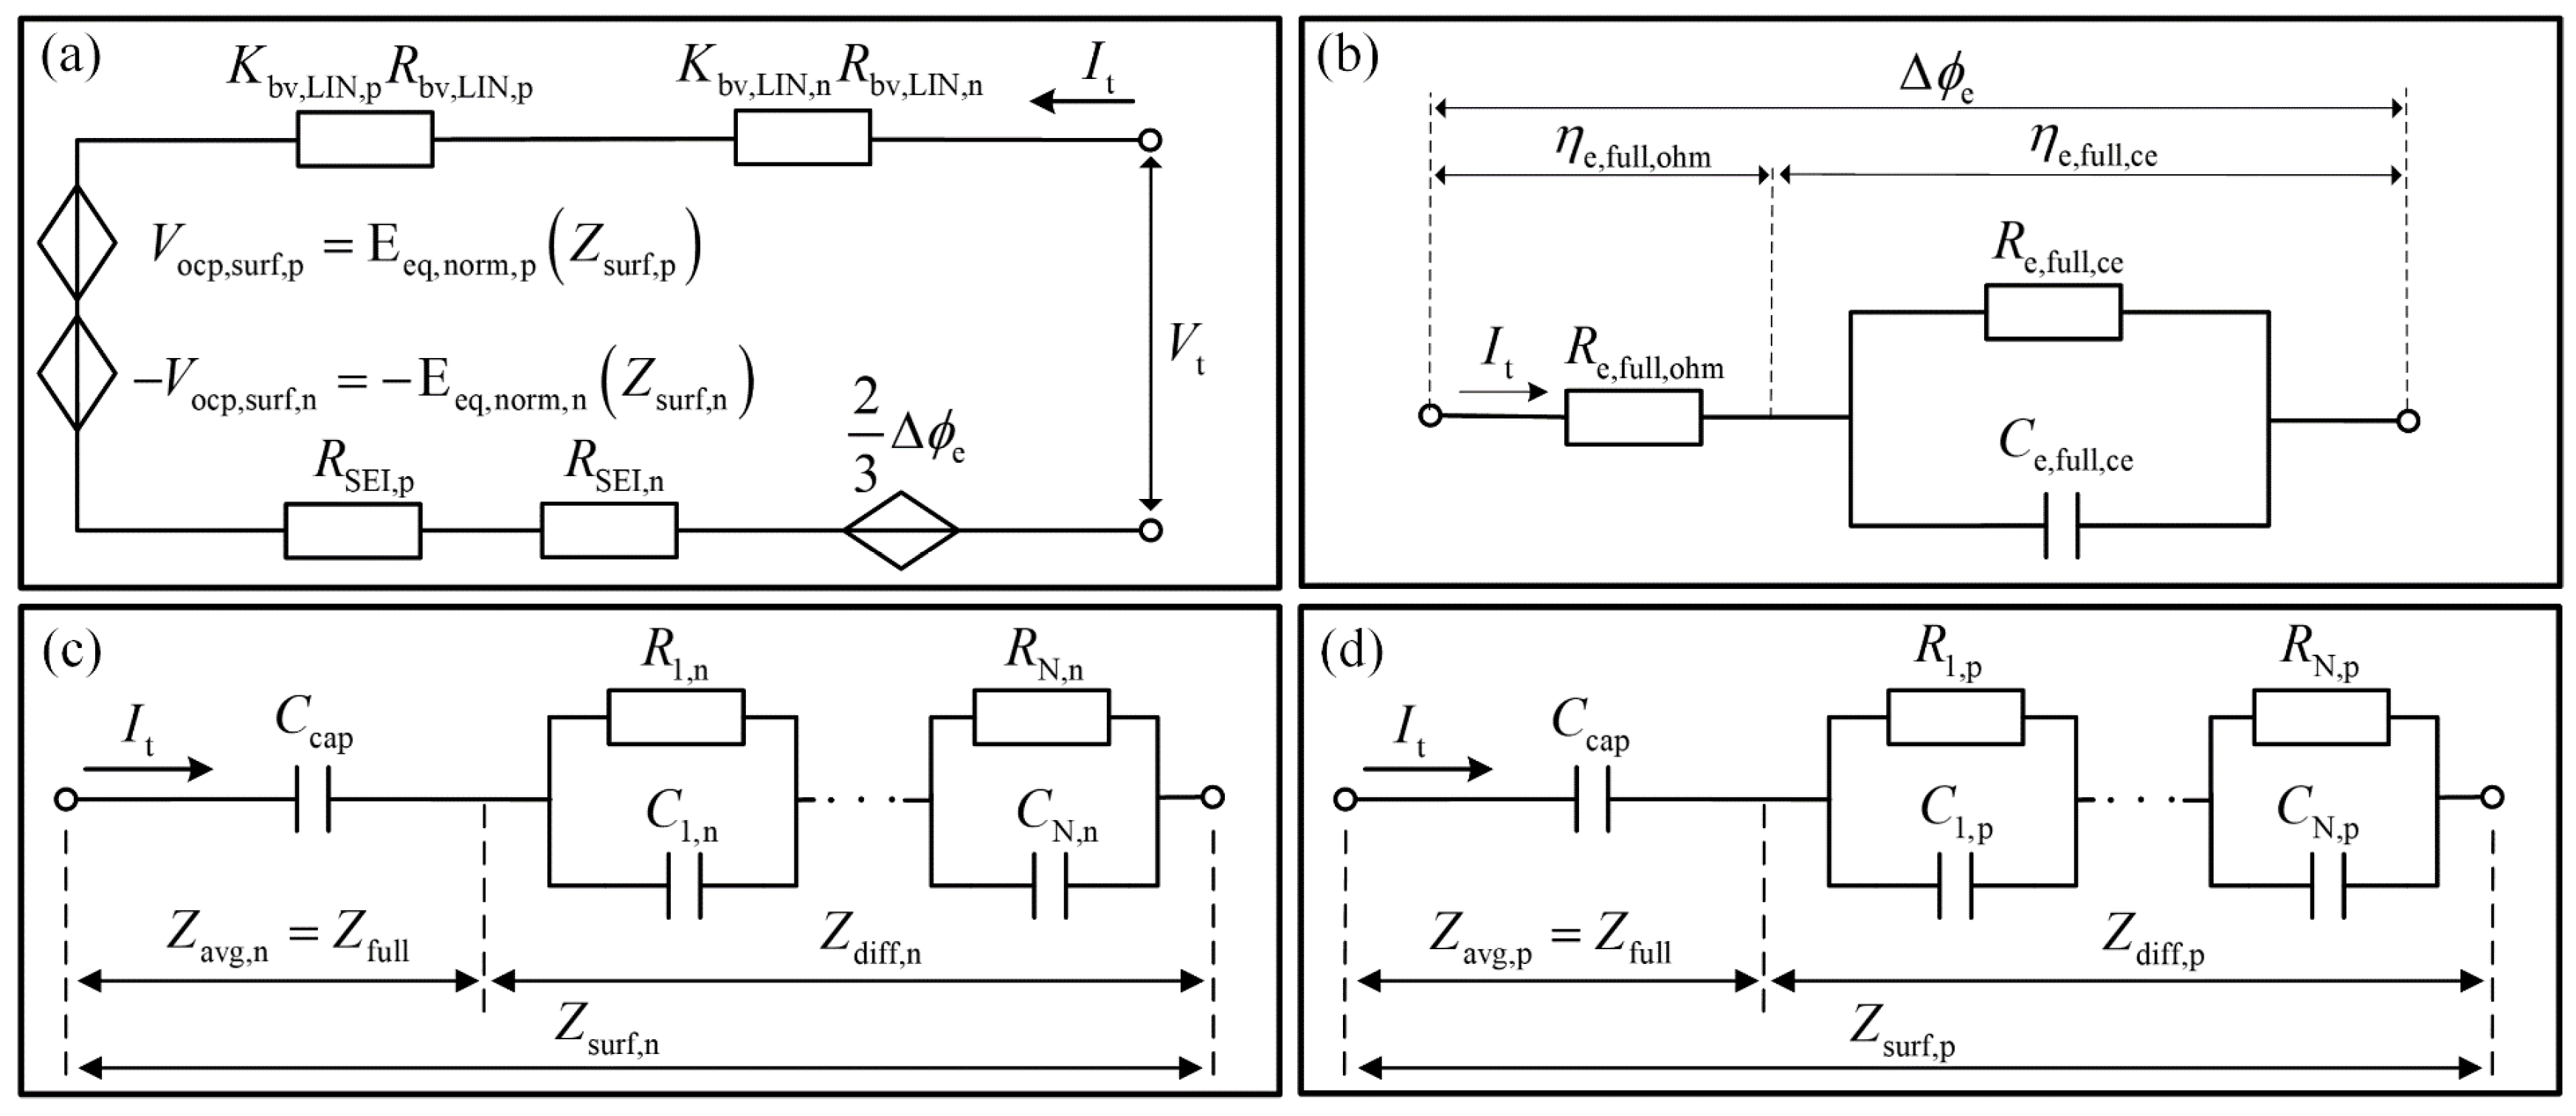
Equation (70) can be represented by a circuit consisting of one resistor and one capacitor connected in parallel. Similarly, Equation (67) can be represented by a circuit with only one resistor. Therefore, the equivalent circuit model (ECM) for calculating Δ ϕ e is obtained, as illustrated in Figure 10a, where:
C e , full , ce = τ e , full , ce R e , full , ce
The comparison of the Δ ϕ e calculated by the ECM and P2D models in the first cycle of the HWFET test is illustrated in Figure 10b. Regarding the Δ ϕ e obtained from the P2D model as the reference value, the error of Δ ϕ e calculated by ECM is presented in Figure 10c. It is evident that the ECM yields satisfactory results with small errors when compared to the P2D model. Therefore, this ECM could be used in real applications.

3.4. Approximation of Correction Terms in IESP

Based on the ESP, Prada et al. [11] estimated the electrolyte potential by analytically solving the charge conservation Equation (20), yielding
ϕ e ( x ) = ϕ e x = 0 + 2 R T ( 1 + β ) ( 1 t + ) F ln c e ( x ) c e x = 0 + x 2 I t 2 A δ n κ n eff , 0 x δ n ϕ e ( x ) = 2 R T ( 1 + β ) ( 1 t + ) F ln c e ( x ) c e x = L L x 2 I t 2 A δ p κ p eff , δ n + δ sep x L
By substituting Equation (59) into Equation (73), the following was obtained:
ϕ e ( x ) = ϕ e x = 0 + 2 R T ( 1 + β ) ( 1 t + ) F ln 1 + a 1 x 2 a 3 ( t ) + x 2 I t 2 A δ n κ n eff , 0 x δ n ϕ e ( x ) = ϕ e x = L + 2 R T ( 1 + β ) ( 1 t + ) F ln 1 + a 6 L x 2 a 8 L x 2 I t 2 A δ p κ p eff , δ n + δ sep x L
By applying the first-order Taylor expansion to simplify Equation (74), the following was obtained:
ϕ e ( x ) ϕ e x = 0 + a ex , n x 2 , 0 x δ n ϕ e ( x ) ϕ e x = L + a ex , p L x 2 , δ n + δ sep x L
where
a ex , n = 2 R T ( 1 + β ) ( 1 t + ) F a 1 a 3 + I t 2 A δ n κ n eff ,   a ex , p = 2 R T ( 1 + β ) ( 1 t + ) F a 6 a 8 I t 2 A δ p κ p eff
By substituting Equation (75) into Equation (32), the approximate solution for the correction term ( Δ ϕ e , SP , avg , n + Δ ϕ e , SP , avg , p ) can be obtained as
Δ ϕ e , SP , avg , n + Δ ϕ e , SP , avg , p = 0 δ n a ex , n x 2 d x δ n + δ n + δ sep L a ex , p L x 2 d x δ p = a ex , n δ n 2 3 a ex , p δ p 2 3 = ϕ e x = 0 ϕ e x = δ n 3 + ϕ e x = L δ p ϕ e x = L 3
As shown in Figure 3, the potential drop of the electrolyte in the separator is significantly smaller than that in the positive and negative electrodes. If the potential drop in the separator is ignored, the correction term in the IESP model can be obtained as
Δ ϕ e , SP , avg , n + Δ ϕ e , SP , avg , p = ϕ e x = 0 ϕ e x = δ n 3 + ϕ e x = L δ p ϕ e x = L 3 ϕ e x = 0 ϕ e x = L 3 = Δ ϕ e 3
By substituting Equation (78) into Equation (35), the terminal voltage of IESP model is obtained as
V t , IESP = V ocp , surf , SP , p V ocp , surf , SP , n + η bv , p , SP η bv , n , SP + η SEI , p , SP η SEI , n , SP + 2 Δ ϕ e 3

3.5. ECM of Electrochemical Reaction

The electrochemical reaction is governed by the Butler–Volmer equation, which is described in Equation (27). This equation can be transformed into:
η bv = 2 R T F ln j f 2 i 0 + j f 2 i 0 2 + 1
When the reaction overpotential η bv is small, the Butler–Volmer equation can be linearized to [3,36]:
η bv , LIN = R T i 0 F j f
Figure 11 illustrates the reaction overpotentials calculated using the Butler–Volmer equation and its linear approximation Equation (81). It is evident that there is minimal difference between the two results within the range of [ 0.05 V , 0.05 V ] . However, beyond this range, a notable deviation occurs between the two curves as the amplitude of reaction overpotential increases [36].
In order to represent the Butler–Volmer equation with an equivalent circuit model, this study utilizes a correction factor K bv , LIN to describe the ratio of η bv to η bv , LIN , which is:
K bv , LIN = η bv η bv , LIN
By substituting Equations (80) and (81) into Equation (82), K bv , LIN can be obtained as:
K bv , LIN = ln ( χ bv , LIN + χ bv , LIN 2 + 1 ) χ bv , LIN χ bv , LIN 0 K bv , LIN = 1 χ bv , LIN = 0
where:
χ bv , LIN = F 2 R T η bv , LIN
The relationship between K bv , LIN and χ bv , LIN is shown in Figure 12a. K bv , LIN can be determined by utilizing Equation (83) or by interpolating the curve shown in Figure 12a. By substituting Equation (28) into Equation (81), the reaction overpotentials calculated from load current using the linear approximation of the Butler–Volmer equation can be obtained as:
η bv , LIN , n = R bv , LIN , n I t η bv , LIN , p = R bv , LIN , p I t
where:
R bv , LIN , n = R T i 0 , n F R s , n 3 ε s , n A δ n R bv , LIN , p = R T i 0 , p F R s , p 3 ε s , p A δ p
By substituting Equation (85) into Equation (82), the relationships between the electrochemical reaction overpotential and the applied load current can be expressed as:
η bv , n = K bv , LIN , n η bv , LIN , n = K bv , LIN , n R bv , LIN , n I t η bv , p = K bv , LIN , p η bv , LIN , p = K bv , LIN , p R bv , LIN , p I t
According to Equation (87), the electrochemical reaction overpotential in each electrode can be calculated using an ECM, which consists of a nonlinear resistance as illustrated in Figure 12b.
By substituting Equation (47) into Equation (25), i 0 , n and i 0 , p can be expressed as:
i 0 , n = k n c e 0.5 c s , max , n Z surf , n c s , soc = 100 % , n c s , soc = 0 % , n + c s , soc = 0 % , n 0.5 Z surf , n c s , soc = 100 % , n c s , soc = 0 % , n + c s , soc = 0 % , n 0.5 i 0 , p = k p c e 0.5 c s , max , p Z sur , p c s , soc = 100 % , p c s , soc = 0 % , p + c s , soc = 0 % , p 0.5 Z surf , p c s , soc = 100 % , p c s , soc = 0 % , p + c s , soc = 0 % , p 0.5
By substituting Equation (88) into Equation (86), the relation between the linearized reaction resistances and normalized SOC at the surface of solid particles can be obtained as depicted in Figure 13a. The reaction overpotential of positive solid particles calculated using the linearized reaction resistance in the Hybrid Pulse Power Characteristic (HPPC) test is shown in Figure 13b, while Figure 13c displays the reaction overpotential calculated by combining correction factor with the linearized reaction resistance. The HPPC consists of seven sets of impulse current pairs with different current rates, namely 0.25C, 0.5C, 1C, 2C, 3C, 4C, and 5C. The battery’s initial SOC is set to 50%. For comparison purposes, the accurate reaction overpotential calculated by the Butler–Volmer equation is also presented in Figure 13b,c. It can be observed that the reaction overpotential, calculated by the linearized reaction resistance, gradually deviates from the accurate value as the current amplitude increases. This confirms that the linear approximation form of Butler–Volmer is only accurate within a limited potential range. In contrast, the reaction overpotential calculated using the reaction resistance with correction factor perfectly aligns with true value. This suggests that the ECM depicted in Figure 13a accurately models the nonlinear current dependence of the reaction overpotential.

3.6. ECM of SEI Film Resistance

Combining Equations (26) and (28), the overpotential caused by the resistance of the SEI film in both electrodes can be obtained as shown in Equation (89). This equation can be equivalent to two ECMs consisting of two linear resistances, as shown in Figure 14.
η SEI , n = R SEI , n I t η SEI , p = R SEI , p I t
where
R SEI , n = R film , n R s , n 3 ε s , n A δ n R SEI , p = R film , p R s , p 3 ε s , p A δ p

3.7. Construction of the Full ECM of IESP Model

All components in the IESP model are converted into ECMs from Section 3.1Section 3.6, and by combining these ECMs, the equivalent circuit model based on the improved extended single particle (ECMIESP) model is obtained, as illustrated in Figure 15.
The parameters of the ECMIESP model are presented in Table 5. These parameters were derived from the battery parameters listed in Table 2. The IESP model consists of 32 parameters, whereas the ECMIESP model lumps these into 12 parameters, resulting in a reduction of 62.5% compared to the IESP model. This simplification makes parameter identification and engineering application of ECMIESP model relatively more efficient.
The discrete state space form of the ECMIESP model is:
x k = A x k 1 + B u k 1 y k = G x k , u k
where u is the model input and here it is the load current I t . y is the battery terminal voltage V t . The parameter matrices in Equation (91) are as follows:
A = diag A 11 A 22 φ e 1 B = B 1 B 2 R e , full , ce 1 φ e T s C cap T x = Z diff , 1 , p Z diff , 2 , p Z diff , 3 , p Z diff , 1 , n Z diff , 2 , n Z diff , 3 , n η e , full , ce Z full T G x , u = E e q , n o r m , p ( Z surf , p ) + E e q , n o r m , n ( Z surf , n ) + 2 3 η e , full , ce + R e , full , ohm I t + K bv , LIN , p R bv , LIN , p I t + K bv , LIN , n R bv , LIN , n I t + R SEI , p I t + R SEI , n I t
where T s is the sampling time, Z diff , p and Z diff , n are calculated by Equation (93), Z surf , p and Z surf , n are calculated by Equation (94); A 11 , A 22 , φ e , B 1 , B 2 are illustrated in Equation (95).
Z diff , p = Z diff , 1 , p + Z diff , 2 , p + Z diff , 3 , p Z diff , n = Z diff , 1 , n + Z diff , 2 , n + Z diff , 3 , n
Z surf , p = Z avg , p + Z diff , p = Z full + Z diff , p Z surf , n = Z avg , n + Z diff , n = Z full + Z diff , n
A 11 = diag exp T s ρ rd , p τ d , 1 exp T s ρ rd , p τ d , 2 exp T s ρ rd , p τ d , 3 A 22 = diag exp T s ρ rd , n τ d , 1 exp T s ρ rd , n τ d , 2 exp T s ρ rd , n τ d , 3 φ e = exp T s τ ϕ e , full , ce B 1 = R 1 , p 1 exp T s ρ rd , p τ d , 1 R 2 , p 1 exp T s ρ rd , p τ d , 2 R 3 , p 1 exp T s ρ rd , p τ d , 3 B 2 = R 1 , n 1 exp T s ρ rd , n τ d , 1 R 2 , n 1 exp T s ρ rd , n τ d , 2 R 3 , n 1 exp T s ρ rd , n τ d , 3

4. Model Verification under Different Load Profiles

The voltage accuracy of the proposed ECMIESP is validated under four distinct current profiles in this section. For comparison, the ECM2RC model, which is one of the most commonly used 2RC equivalent-circuit models, is employed as a comparative model. Considering the high modeling precision of the P2D model, its voltage and SOC are utilized as reference values in this study.

4.1. Model Verification under MHPPC Test and Parameter Identification of ECM2RC

The schematic of the ECM2RC model, which includes a voltage source, a resistor and two parallel resistor-capacitor circuits, is presented in Figure 16a. The voltage accuracy of the proposed ECMIESP model is compared to that of the ECM2RC model in multi MHPPC tests. The current profile of MHPPC test is modified by lengthening the period of HPPC to reflect both the mass transport effect and dynamic voltage performance of the battery. Figure 16b illustrates the current profile and SOC variation for a single MHPPC test. With a 10% SOC gap, the MHPPC test was executed 10 times on the P2D model with initial SOC from 95% to 5%.
The simulation results of the P2D model from ten MHPPC tests were utilized to identify the parameters of the ECM2RC model. The identification process consists of 2 steps. In the first step, the pure resistor component R 0 in the ECM2RC model is determined by calculating the average ohmic resistance at each current change edge in the MHPPC test. The ohmic resistance at one current change edge is calculated using R 0 = Δ V t / Δ I L . In the second step, the genetic algorithm (GA) is employed to determine the optimum parameters of the two parallel resistor-capacitor circuits in ECM2RC model by minimizing the root mean square error (RMSE) between voltage obtained from P2D and ECM2RC models. The identification results of ECM2RC are presented in Table 6, along with corresponding RMSEs of voltages calculated by both ECM2RC and ECMIESP models.
The results presented in Table 6 demonstrate that the voltage RMSEs of the ECMIESP model consistently outperform those of ECM2RC model. Notably, the voltage RMSEs of ECM2RC model exhibit significant variability across different SOC segments, particularly when SOC is below 10%, reaching a value of 60.1 mV. In contrast, the voltage RMSEs of the ECMIESP model remain consistently low across all SOC ranges and only slightly increase to 1.2 mV when the SOC is below 10%. This represents a remarkable improvement of 58.9 mV compared to the RMSE achieved by the ECM2RC model.
The results of MHPPC2 and MHPPC10 tests were selected for more detailed analysis. Figure 17 presents the terminal voltages, overvoltages, and errors calculated by the models in the MHPPC2 and MHPPC10 tests. The overvoltage is defined as the difference between the battery terminal voltage and the OCV computed from battery SOC.
The normalized SOC and OCP of the two solid particles, calculated by the ECMIESP model in MHPPC2 and MHPPC10 tests, are presented in Figure 18. The volume average normalized SOC and surface normalized SOC are illustrated in Figure 18a1,a2, the volume average OCP and surface OCP are illustrated in Figure 18b1,b2, as well as Figure 18c1,c2. The voltage drops resulting from lithium-ion diffusion within the solid particles are exhibited in Figure 18d1,d2.
The volume average OCPs of both solid particles are calculated by:
V o c p , avg , p = E e q , n o r m , p Z avg , p = E e q , n o r m , p Z full V o c p , avg , n = E e q , n o r m , n Z avg , p = E e q , n o r m , n Z full
The surface OCPs of both solid particles are calculated by:
V o c p , surf , p = E e q , n o r m , p Z surf , p = E e q , n o r m , p Z avg , p + Z diff , p = E e q , n o r m , p Z full + Z diff , p V o c p , surf , n = E e q , n o r m , n Z surf , n = E e q , n o r m , n Z avg , n + Z diff , n = E e q , n o r m , n Z full + Z diff , n
The voltage drops caused by lithium-ion diffusion in solid particles are calculated by:
V o c p , diff , p = V o c p , surf , p V o c p , avg , p = E e q , n o r m , p Z full + Z diff , p E e q , n o r m , p Z full V o c p , diff , n = V o c p , surf , n V o c p , avg , n = E e q , n o r m , n Z full + Z diff , n E e q , n o r m , n Z full
The V ocp , diff calculated by Equation (98) can be regarded as the voltage drop caused by the diffusion in solid particles. Therefore, V ocp , diff is not only influenced by the SOC difference caused by lithium-ion diffusion but also closely associated with the slope of the SOC–OCP curve. The magnitude of V ocp , diff will be higher in regions where there is a steep slope in the SOC–OCP curve compared to regions with a gentler slope. As depicted in Figure 8b, when normalized SOC is below 0%, the SOC–OCP curve of negative solid particle exhibits a pronounced nonlinear characteristic with an abrupt increase in slope as SOC decreases. From Figure 18, it can be observed that during discharge pulses of MHPPC10 tests, surface normalized SOC of negative solid particles drops below 0%, leading to a nonlinear and sharp rise in V ocp , diff in the negative electrode.
As known, the ECM2RC model employs linear RC networks to simulate the voltage drop resulting from the mass transport effect. So, the accuracy of the ECM2RC model is good in regions with a strong SOC–OCP linearity, but deteriorates significantly in regions with poor SOC–OCP linearity. As depicted in Figure 18, during the MHPPC2 test, the ECM2RC model closely tracks the voltage of the P2D model. Conversely, during the MHPPC10 test, significant deviation between the ECM2RC and P2D models’ voltages is observed. However, the ECMIESP model directly computes the surface OCPs of solid particles based on the normalized SOC. Consequently, variations in slope of SOC–OCP curve do not affect surface OCPs in this model. This characteristic enables high accuracy maintenance for the ECMIESP model even in regions with poor SOC–OCP linearity.

4.2. Model Verification under HPPC Test

In this section, the voltage responses of the ECMIESP model and conventional ECM2RC model are compared in a HPPC test to validate the capability of ECMIESP model in capturing the nonlinear current-dependent behavior of the reaction overpotentials. The HPPC test consists of seven sets of impulse current pairs with different current rates: 0.25C, 0.5C, 1C, 2C, 3C, 4C, and 5C. The current profile for this HPPC test is shown in Figure 19a. The initial SOC of the battery is set to be 30% for this specific test. Figure 19b compares the model-calculated terminal voltages from the ECMIESP model and ECM2RC model with the terminal voltage obtained from the P2D model. Additionally, Figure 19c illustrates the terminal voltage errors associated with both ECMIESP and ECM2RC models when compared to the P2D model’s voltage. Table 7 provides voltage MAXEs observed in each current pulse within both ECMIESP and ECM2RC models.
As shown in Figure 19 and Table 7, the voltage of the ECM2RC model gradually deviates from the voltage of P2D model as the current increases. The reason for this is that the ECM2RC model does not incorporate the nonlinear current-dependent behavior of the electrochemical reaction overpotentials. In contrast, the ECMIESP model, which incorporates this nonlinear feature, can closely track the voltage of the P2D model in every current pulse and exhibits a significantly lower voltage MAXE than the ECM2RC model when the current rate exceeds 3C.

4.3. Model Verification under Constant Current Discharge Test

The voltage accuracy of the ECMIESP model is evaluated in this section through a constant current discharge (CCD) test with 2C current rate. The test starts at 100% initial SOC and ends when the terminal voltage of the P2D model reaches the lower cut-off voltage. Figure 20 presents the model-calculated terminal voltages, overvoltages, and errors during the CCD test.
The normalized SOC and OCPs of both solid particles, calculated using ECMIESP model in CCD test, are presented in Figure 21. The volume average and surface normalized SOC of the solid particles are shown in Figure 21a. The volume average OCPs and surface OCPs of both solid particles are illustrated in Figure 21b,c. The voltage drops resulting from lithium-ion diffusion in the solid particles are depicted in Figure 21d.
The RMSEs and MAXEs of the voltages calculated by ECM2RC and ECMIESP models in the high, medium, and low SOC segments of CCD test are presented in Table 8, with the voltage of the P2D model serving as the reference value.
The ECM2RC model simulates voltage drops resulting from mass transfer in both the electrolyte and solid phase through linear RC networks, as stated in Section 4.1. However, the accuracy of the ECM2RC model decreases as the nonlinearity of the SOC–OCP curve increases. Figure 21 and Table 8 demonstrate that during the high SOC segment of the CCD test, minimal voltage error is observed for theECM2RC model due to the excellent linearity of the SOC–OCP curve. Nevertheless, in the medium SOC segment, there is a moderate increase in voltage error for the ECM2RC model because of a slight decrease in linearity of the SOC–OCP curve. In contrast, during low SOC segments where there is a sharp increase in voltage drop caused by lithium-ion diffusion within negative solid particles, it becomes challenging for the ECM2RC model to accurately track nonlinear changes in terminal voltage leading to significant increases in voltage error.
In contrast, the ECMIESP model demonstrates outstanding accuracy across all SOC segments in the CCD test, due to its ability to mitigate the impact of the nonlinearity of SOC–OCP curve by directly calculating the surface OCP of solid particle via surface SOC. Notably, compared with the ECM2RC model, the ECMIESP model shows significantly lower voltage MAXEs with only 16.7 mV and 10.8 mV in medium and low SOC segments respectively, representing a reduction of 13.9 mV and 820.2 mV.

4.4. Model Verification under HWFET Test

The voltage accuracy of the proposed ECMIESP model is validated in this section under a HWFET test with maximum current rate of 4C to assess the dynamic performance of the model. The test starts from an initial SOC of 100% and ends when the terminal voltage of the P2D model reaches the lower cut-off voltage. Figure 22 illustrates the model-calculated terminal voltages, overvoltages, and errors in the HWFET test.
The normalized SOC and OCP of the solid particles, calculated using ECMIESP model in the HWFET test, are presented in Figure 23. The volume average and surface normalized SOC of solid particles are shown in Figure 23a. The volume average OCP and surface OCP of the solid particles are illustrated in Figure 23b,c. The voltage drops resulting from lithium-ion diffusion in both solid particles are depicted in Figure 23d.
The linear approximate of reaction overpotentials η bv , LIN in both electrodes during HWFET test are shown in Figure 24a. η bv , LIN is calculated by the linear approximation of the Butler–Volmer equation as listed in Equation (85). Figure 24b shows the reaction overpotentials calculated by ECMIESP model, which incorporates a correction factor K bv , LIN to rectify the error of η bv , LIN , as shown in Equation (87). Defining η bv as the error of η bv , LIN and regarding as the reference value, we can quantify the η bv , LIN , error by Equation (99). The η bv , LIN , error for both electrodes during the HWFET test are shown in Figure 24c.
η bv , LIN , error , p = η bv , LIN , p η bv , p η bv , LIN , error , n = η bv , LIN , n η bv , n
As illustrated in Figure 24a, the amplitude of η bv surpasses the linearizable range ([−50 mV, 50 mV]) of the Butler–Volmer equation at multiple regions. Consequently, a significant deviation between η bv , LIN and η bv is observed within these regions. The maximum amplitude of η bv , LIN , error surpasses 20 mV in the high and medium SOC segments, while it exceeds 150 mV in the Low SOC segment.
The RMSEs and MAXEs of the voltage calculated by ECM2RC and ECMIESP models in the high, medium, and low SOC segments of HWFET test are presented in Table 9, with the voltage of P2D model serving as the reference value.
The ECM2RC model demonstrates a voltage RMSE of only 2.8 mV in the high SOC segment of the HWFET test, as shown in Table 9. However, due to neglecting the nonlinear current-dependent behavior of electrochemical reaction overpotentials in the ECM2RC model, voltage MAXE of ECM2RC model reaches a significantly higher value of 21.5 mV. Because the reaction overpotentials surpass the linearizable range at multiple regions, consequently, a significant error occurs when one electrode’s reaction overpotential exceeds 50 mV. There is a moderate increase in voltage error for the ECM2RC model caused by degradation in linearity of the SOC–OCP curve within the medium SOC segment and a substantial rise in MAXE up to 704.7 mV for the ECM2RC model within low SOC segment due to sharp elevation in voltage drop resulting from diffusion within negative solid particles.
In contrast, the ECMIESP model demonstrates superior accuracy across all SOC segments in the HWFET test, as indicated in Figure 24c and Table 9. Specifically, for the ECMIESP model, the RMSEs of voltage are 1.8 mV, 4.0 mV, and 7.0 mV in the high, medium, and low SOC segments, respectively. These values are lower by 1.0 mV, 8.4 mV, and 66.4 mV compared to those of the ECM2RC model. Furthermore, using the ECMIESP model, the MAXEs of voltage in the high, medium, and low SOC segments were found to be 3.8 mV, 14.2 mV, and 64.3 mV, respectively. These values are lower by 17.7 mV, 19.4 mV, and 640.4 mV than those obtained with the ECM2RC model.
The above results demonstrate that, due to including more electrochemical mechanisms in the physics-based ECMIESP model, it can accurately capture both the nonlinear current-dependent behavior of electrochemical reaction overpotentials and nonlinear voltage drops caused by solid phase diffusion. The accuracy of the ECMIESP model surpasses that of the conventional ECM2RC model, especially when dealing with cases where the electrochemical reaction overpotential exceeds 50 mV or when there is poor linearity between OCP and SOC.

5. SOC Estimation Based on the ECMIESP Model

5.1. SOC Estimation Based on the ECMIESP Model through Extended Kalman Filter

An important application of the battery model discussed in this paper is to estimate the state of charge (SOC) in real time. Accurate estimation of the SOC of batteries is essential in energy storage systems [37]. Numerous model-based methods for SOC estimation have been proposed [38]. These methods combine coulomb counting results with model voltages to achieve high accuracy. Among them, the extended Kalman filter (EKF) is widely adopted due to its applicability for nonlinear systems and relatively simple computational process. Therefore, the EKF is employed for the model-based SOC estimation in this study. The accuracy of the employed model significantly influences the performance of the model-based SOC estimation, and thus evaluating the model accuracy can be achieved through analyzing the SOC estimation results.
To utilize the EKF for model-based SOC estimation, the system noise and measurement noise should be added to the discrete state space form of the model as:
x k = A x k 1 + B u k 1 + w k y k = G x k , u k + v k
where w k represents the system noise and v k represents the measurement noise.
C o v ( w k , w j ) = Σ w δ k , j C o v ( v k , v j ) = Σ v δ k , j
The EKF algorithm is expressed as Equations (102)–(108) [39]. The terms u k and y k represent the model input and output, respectively, which stand for the measured load current I t and terminal voltage V t . In EKF, G x k , u k is linearized in each time step using first-order Taylor expansion and expressed as parameter matrices C k in Equation (109). The EKF algorithm compares the measured battery terminal voltage with the predicted value from the battery model. The difference between these quantities is used to adjust the state of the battery model, so that it closely matches both the measured battery voltage and estimated real quantities [39].
Initialization, for k = 0 , set:
x ^ 0 = E x 0
Σ x , 0 = E x 0 x ^ 0 + x 0 x ^ 0 + T
Computation, for k = 1 , 2 , compute:
State   estimate   time   update :   x ^ k = A k 1 x ^ k 1 + + B k 1 u k 1
Error   covariance   time   update :   Σ x , k = A k 1 Σ x , k 1 + A k 1 T + Σ w
Kalman   gain   matrix :   L k = Σ x , k C k T C k Σ x , k C k T + Σ v 1
State   estimate   measurement   update :   x ^ k + = x ^ k + L k y k G ( x ^ k , u k )
Error   covariance   measurement   update :   Σ x , k + = I K k C k Σ x , k
C k is defined as:
C k = G ( x k , u k 1 ) x k x k = x ^ k

5.2. Results and Comparison

The SOC estimations based on ECM2RC and ECMIESP models were evaluated through CCD and HWFET tests, with the voltage and SOC from the P2D model serving as reference. To assess the efficiency of EKF, the initial SOC was set 10% lower than its actual value. Figure 25 illustrates the SOC estimation errors for both models, while Table 10 presents their RMSEs and MAXEs across three different SOC segments.
As shown in Figure 25, all SOC estimations can rapidly converge towards the actual SOC to correct initial errors. By comparing voltage errors in Figure 20c and Figure 22c with SOC estimation errors in Figure 25c,d, a positive correlation between SOC estimation errors and voltage errors becomes evident. In the high SOC segment, both models exhibit small SOC estimation errors due to minimal voltage errors within this specific range of SOC. In the medium SOC segment, the ECM2RC model experiences a slight increase in SOC estimation errors, which can be attributed to a corresponding slight increase in voltage errors. In the low SOC segment, there is a rapid increase of SOC estimation errors when utilizing the ECM2RC model, primarily due to a significant rise in voltage error within this specific range of SOC.
In contrast, the SOC estimation errors based on the ECMIESP model consistently remain small across all SOC segments due to its superior voltage accuracy in entire range of SOC. Specifically, in the low SOC segment, the MAXE values of the ECMIESP model-based SOC estimation exhibit a reduction of 8.7% compared to those obtained from ECM2RC model in CCD test and a reduction of 3.8% compared to those obtained from ECM2RC model in HWFET test.
In summary, the ECMIESP model demonstrates a significant improvement in SOC estimation accuracy compared to the conventional ECM2RC model, particularly in the low SOC segment. If the accuracy of the battery model is improved in the low-SOC area, a smaller SOC limit value could be used and more battery energy could hence be utilized without battery cost increase [29].

6. Conclusions

This paper proposes a novel physics-based equivalent circuit model with comprehensive electrochemical significance and acceptable complexity. Initially, an improved extended single particle (IESP) model is proposed by adding a correction term to mitigate the electrochemical reaction overpotential bias in the extended single particle (ESP) model. Subsequently, the ECMIESP model is derived from the original IESP model by replacing every electrochemical process with equivalent circuit models. Validation across four distinct load profiles demonstrates that the ECMIESP model offers higher accuracy than the conventional ECM2RC model, especially at low SOC or when the electrochemical reaction overpotential exceeds 50 mV. Finally, the ECMIESP model was utilized for SOC estimation based on EKF and indicates a significant enhancement in accuracy compared to that achieved using the conventional ECM2RC model. In summary, the ECMIESP model shows significant potential for real-time applications in improving voltage and SOC estimation precision. One limitation of this study is that the ECMIESP model’s parameters are obtained from known electrochemical parameters. Therefore, future research should explore identifying the ECMIESP model’s parameters using only the battery’s terminal voltage and load current. Another direction for future research involves extending the ECMIESP model to represent lithium-ion batteries at different temperatures and aging states, since electrochemical parameters are closely related to temperature and aging state.

Author Contributions

Conceptualization, Y.L. and H.Q.; methodology, J.C., F.L. and Y.L.; validation, Q.J. and X.S.; formal analysis, Q.J., F.L. and J.C.; writing—original draft preparation, Y.L.; writing—review and editing, F.L. and J.C.; visualization, J.C.; supervision, Q.J.; project administration, Y.L.; funding acquisition, Y.L. and F.L. All authors have read and agreed to the published version of the manuscript.

Funding

Y.L. acknowledges support from the postdoctoral research project of Guangzhou. F.L. acknowledges the support from Guangdong Provincial Science and Technology Planning Project of China, grant numbers [2020B1212060010].

Data Availability Statement

The original contributions presented in this study are included in the article; further inquiries can be directed to the corresponding author.

Conflicts of Interest

The authors declare no conflicts of interest. The funders had no role in the design of the study; in the collection, analyses, or interpretation of data; in the writing of the manuscript; or in the decision to publish the results.

References

  1. Ramadesigan, V.; Northrop, P.W.C.; De, S.; Santhanagopalan, S.; Braatz, R.D.; Subramanian, V.R. Modeling and Simulation of Lithium-Ion Batteries from a Systems Engineering Perspective. J. Electrochem. Soc. 2012, 159, 31–45. [Google Scholar] [CrossRef]
  2. Christensen, G.; Younes, H.; Hong, H.; Widener, C.; Wu, J.J. Nanofluids as Media for High Capacity Anodes of Lithium-Ion Battery—A Review. J. Nanofluids 2019, 8, 657–670. [Google Scholar] [CrossRef]
  3. Li, X.; Fan, G.; Pan, K.; Wei, G.; Zhu, C.; Rizzoni, G.; Canova, M. A physics-based fractional order model and state of energy estimation for lithium ion batteries. Part I: Model development and observability analysis. J. Power Sources 2017, 367, 187–201. [Google Scholar] [CrossRef]
  4. He, H.; Xiong, R.; Fan, J. Evaluation of Lithium-Ion Battery Equivalent Circuit Models for State of Charge Estimation by an Experimental Approach. Energies 2011, 4, 582–598. [Google Scholar] [CrossRef]
  5. Li, J.; Klee Barillas, J.; Guenther, C.; Danzer, M.A. A comparative study of state of charge estimation algorithms for LiFePO4 batteries used in electric vehicles. J. Power Sources 2013, 230, 244–250. [Google Scholar] [CrossRef]
  6. Xiong, R.; Sun, F.; Gong, X.; Gao, C. A data-driven based adaptive state of charge estimator of lithium-ion polymer battery used in electric vehicles. Appl. Energy 2014, 113, 1421–1433. [Google Scholar] [CrossRef]
  7. Li, Y.; Chen, J.; Lan, F. Enhanced online model identification and state of charge estimation for lithium-ion battery under noise corrupted measurements by bias compensation recursive least squares. J. Power Sources 2020, 456, 227984. [Google Scholar] [CrossRef]
  8. Tekin, M.; Karamangil, M.İ. Comparative analysis of equivalent circuit battery models for electric vehicle battery management systems. J. Energy Storage 2024, 86, 111327. [Google Scholar] [CrossRef]
  9. Doyle, M.; Fuller, T.F.; Newman, J. Modeling of galvanostatic charge and discharge of the lithium/polymer/insertion cell. J. Electrochem. Soc. 1993, 140, 1526–1533. [Google Scholar] [CrossRef]
  10. Guo, M.; Sikha, G.; White, R.E. Single-Particle Model for a Lithium-Ion Cell: Thermal Behavior. J. Electrochem. Soc. 2011, 158, 122–132. [Google Scholar] [CrossRef]
  11. Prada, E.; Di Domenico, D.; Creff, Y.; Bernard, J.; Sauvant-Moynot, V.; Huet, F. Simplified Electrochemical and Thermal Model of LiFePO4-Graphite Li-Ion Batteries for Fast Charge Applications. J. Electrochem. Soc. 2012, 159, 1508–1519. [Google Scholar] [CrossRef]
  12. Luo, W.; Lyu, C.; Wang, L.; Zhang, L. A new extension of physics-based single particle model for higher charge–discharge rates. J. Power Sources 2013, 241, 295–310. [Google Scholar] [CrossRef]
  13. Ali, H.A.A.; Raijmakers, L.H.; Chayambuka, K.; Danilov, D.L.; Notten, P.H.; Eichel, R. A comparison between physics-based Li-ion battery models. Electrochim. Acta 2024, 493, 144360. [Google Scholar] [CrossRef]
  14. Kumar, R.R.; Bharatiraja, C.; Udhayakumar, K.; Devakirubakaran, S.; Sekar, S.; Mihet-Popa, L. Advances in batteries, battery modeling, battery management system, battery thermal management, SOC, SOH, and charge/discharge characteristics in EV applications. IEEE Access 2023, 12, 43984–43999. [Google Scholar] [CrossRef]
  15. Tameemi, A.Q.; Kanesan, J.; Khairuddin, A.S.M. Model-based impending lithium battery terminal voltage collapse detection via data-driven and machine learning approaches. J. Energy Storage 2024, 86, 111279. [Google Scholar] [CrossRef]
  16. Kurucan, M.; Özbaltan, M.; Yetgin, Z.; Alkaya, A. Applications of artificial neural network based battery management systems: A literature review. Renew. Sustain. Energy Rev. 2024, 192, 114262. [Google Scholar] [CrossRef]
  17. Renold, A.P.; Kathayat, N.S. Comprehensive review of machine learning, deep learning, and digital twin data-driven approaches in battery health prediction of electric vehicles. IEEE Access 2024, 12, 43984–43999. [Google Scholar] [CrossRef]
  18. Han, X.; Ouyang, M.; Lu, L.; Li, J. Simplification of physics-based electrochemical model for lithium ion battery on electric vehicle. Part I: Diffusion simplification and single particle model. J. Power Sources 2015, 278, 802–813. [Google Scholar] [CrossRef]
  19. Santhanagopalan, S.; Guo, Q.; Ramadass, P.; White, R.E. Review of models for predicting the cycling performance of lithium ion batteries. J. Power Sources 2006, 156, 620–628. [Google Scholar] [CrossRef]
  20. Khaleghi Rahimian, S.; Rayman, S.; White, R.E. Extension of physics-based single particle model for higher charge–discharge rates. J. Power Sources 2013, 224, 180–194. [Google Scholar] [CrossRef]
  21. Tanim, T.R.; Rahn, C.D.; Wang, C. State of charge estimation of a lithium ion cell based on a temperature dependent and electrolyte enhanced single particle model. Energy 2015, 80, 731–739. [Google Scholar] [CrossRef]
  22. Han, X.; Ouyang, M.; Lu, L.; Li, J. Simplification of physics-based electrochemical model for lithium ion battery on electric vehicle. Part II: Pseudo-two-dimensional model simplification and state of charge estimation. J. Power Sources 2015, 278, 814–825. [Google Scholar] [CrossRef]
  23. Marcicki, J.; Canova, M.; Conlisk, A.T.; Rizzoni, G. Design and parametrization analysis of a reduced-order electro-chemical model of graphite/LiFePO4 cells for SOC/SOH estimation. J. Power Sources 2013, 237, 310–324. [Google Scholar] [CrossRef]
  24. Xu, J.; Sun, C.; Ni, Y.; Lyu, C.; Wu, C.; Zhang, H.; Feng, F. Fast identification of micro-health parameters for retired batteries based on a simplified P2D model by using padé approximation. Batteries 2023, 9, 64. [Google Scholar] [CrossRef]
  25. Yuan, S.; Jiang, L.; Yin, C.; Wu, H.; Zhang, X. A transfer function type of simplified electrochemical model with modified boundary conditions and Padé approximation for Li-ion battery: Part 1. lithium concentration estimation. J. Power Sources 2017, 352, 245–257. [Google Scholar] [CrossRef]
  26. Yuan, S.; Jiang, L.; Yin, C.; Wu, H.; Zhang, X. A transfer function type of simplified electrochemical model with modified boundary conditions and Padé approximation for Li-ion battery: Part 2. Modeling and parameter estimation. J. Power Sources 2017, 352, 258–271. [Google Scholar] [CrossRef]
  27. Li, X.; Pan, K.; Fan, G.; Lu, R.; Zhu, C.; Rizzoni, G.; Canova, M. A physics-based fractional order model and state of energy estimation for lithium ion batteries. Part II: Parameter identification and state of energy estimation for LiFePO4 battery. J. Power Sources 2017, 367, 202–213. [Google Scholar] [CrossRef]
  28. Guo, D.; Yang, G.; Feng, X.; Han, X.; Lu, L.; Ouyang, M. Physics-based fractional-order model with simplified solid phase diffusion of lithium-ion battery. J. Energy Storage 2020, 30, 101404. [Google Scholar] [CrossRef]
  29. Ouyang, M.; Liu, G.; Lu, L.; Li, J.; Han, X. Enhancing the estimation accuracy in low state-of-charge area: A novel onboard battery model through surface state of charge determination. J. Power Sources 2014, 270, 221–237. [Google Scholar] [CrossRef]
  30. Andre, D.; Meiler, M.; Steiner, K.; Walz, H.; Soczka-Guth, T.; Sauer, D.U. Characterization of high-power lithium-ion batteries by electrochemical impedance spectroscopy. II: Modelling. J. Power Sources 2011, 196, 5349–5356. [Google Scholar] [CrossRef]
  31. Fleischer, C.; Waag, W.; Heyn, H.; Sauer, D.U. On-line adaptive battery impedance parameter and state estimation considering physical principles in reduced order equivalent circuit battery models Part 1. Requirements, critical review of methods and modeling. J. Power Sources 2014, 260, 276–291. [Google Scholar] [CrossRef]
  32. Fleischer, C.; Waag, W.; Heyn, H.; Sauer, D.U. On-line adaptive battery impedance parameter and state estimation considering physical principles in reduced order equivalent circuit battery models: Part 2. Parameter and state estimation. J. Power Sources 2014, 262, 457–482. [Google Scholar] [CrossRef]
  33. Zheng, Y.; Gao, W.; Han, X.; Ouyang, M.; Lu, L.; Guo, D. An accurate parameters extraction method for a novel on-board battery model considering electrochemical properties. J. Energy Storage 2019, 24, 100745. [Google Scholar] [CrossRef]
  34. Dao, T.; Vyasarayani, C.P.; McPhee, J. Simplification and order reduction of lithium-ion battery model based on porous-electrode theory. J. Power Sources 2012, 198, 329–337. [Google Scholar] [CrossRef]
  35. Subramanian, V.R.; Diwakar, V.D.; Tapriyal, D. Efficient Macro-Micro Scale Coupled Modeling of Batteries. J. Electrochem. Soc. 2005, 152, 2002–2008. [Google Scholar] [CrossRef]
  36. Rahn, C.D.; Wang, C. Battery Systems Engineering, 1st ed.; John Wiley & Sons: West Sussex, UK, 2013; pp. 27–28. [Google Scholar]
  37. Zhang, R.; Li, X.; Sun, C.; Yang, S.; Tian, Y.; Tian, J. State of charge and temperature joint estimation based on ultrasonic reflection waves for lithium-ion battery applications. Batteries 2023, 9, 335. [Google Scholar] [CrossRef]
  38. Xiong, R.; Cao, J.; Yu, Q.; He, H.; Sun, F. Critical Review on the Battery State of Charge Estimation Methods for Electric Vehicles. IEEE Access 2018, 6, 1832–1843. [Google Scholar] [CrossRef]
  39. Plett, G.L. Extended Kalman filtering for battery management systems of LiPB-based HEV battery packs Part 3. State and parameter estimation. J. Power Sources 2004, 134, 277–292. [Google Scholar] [CrossRef]
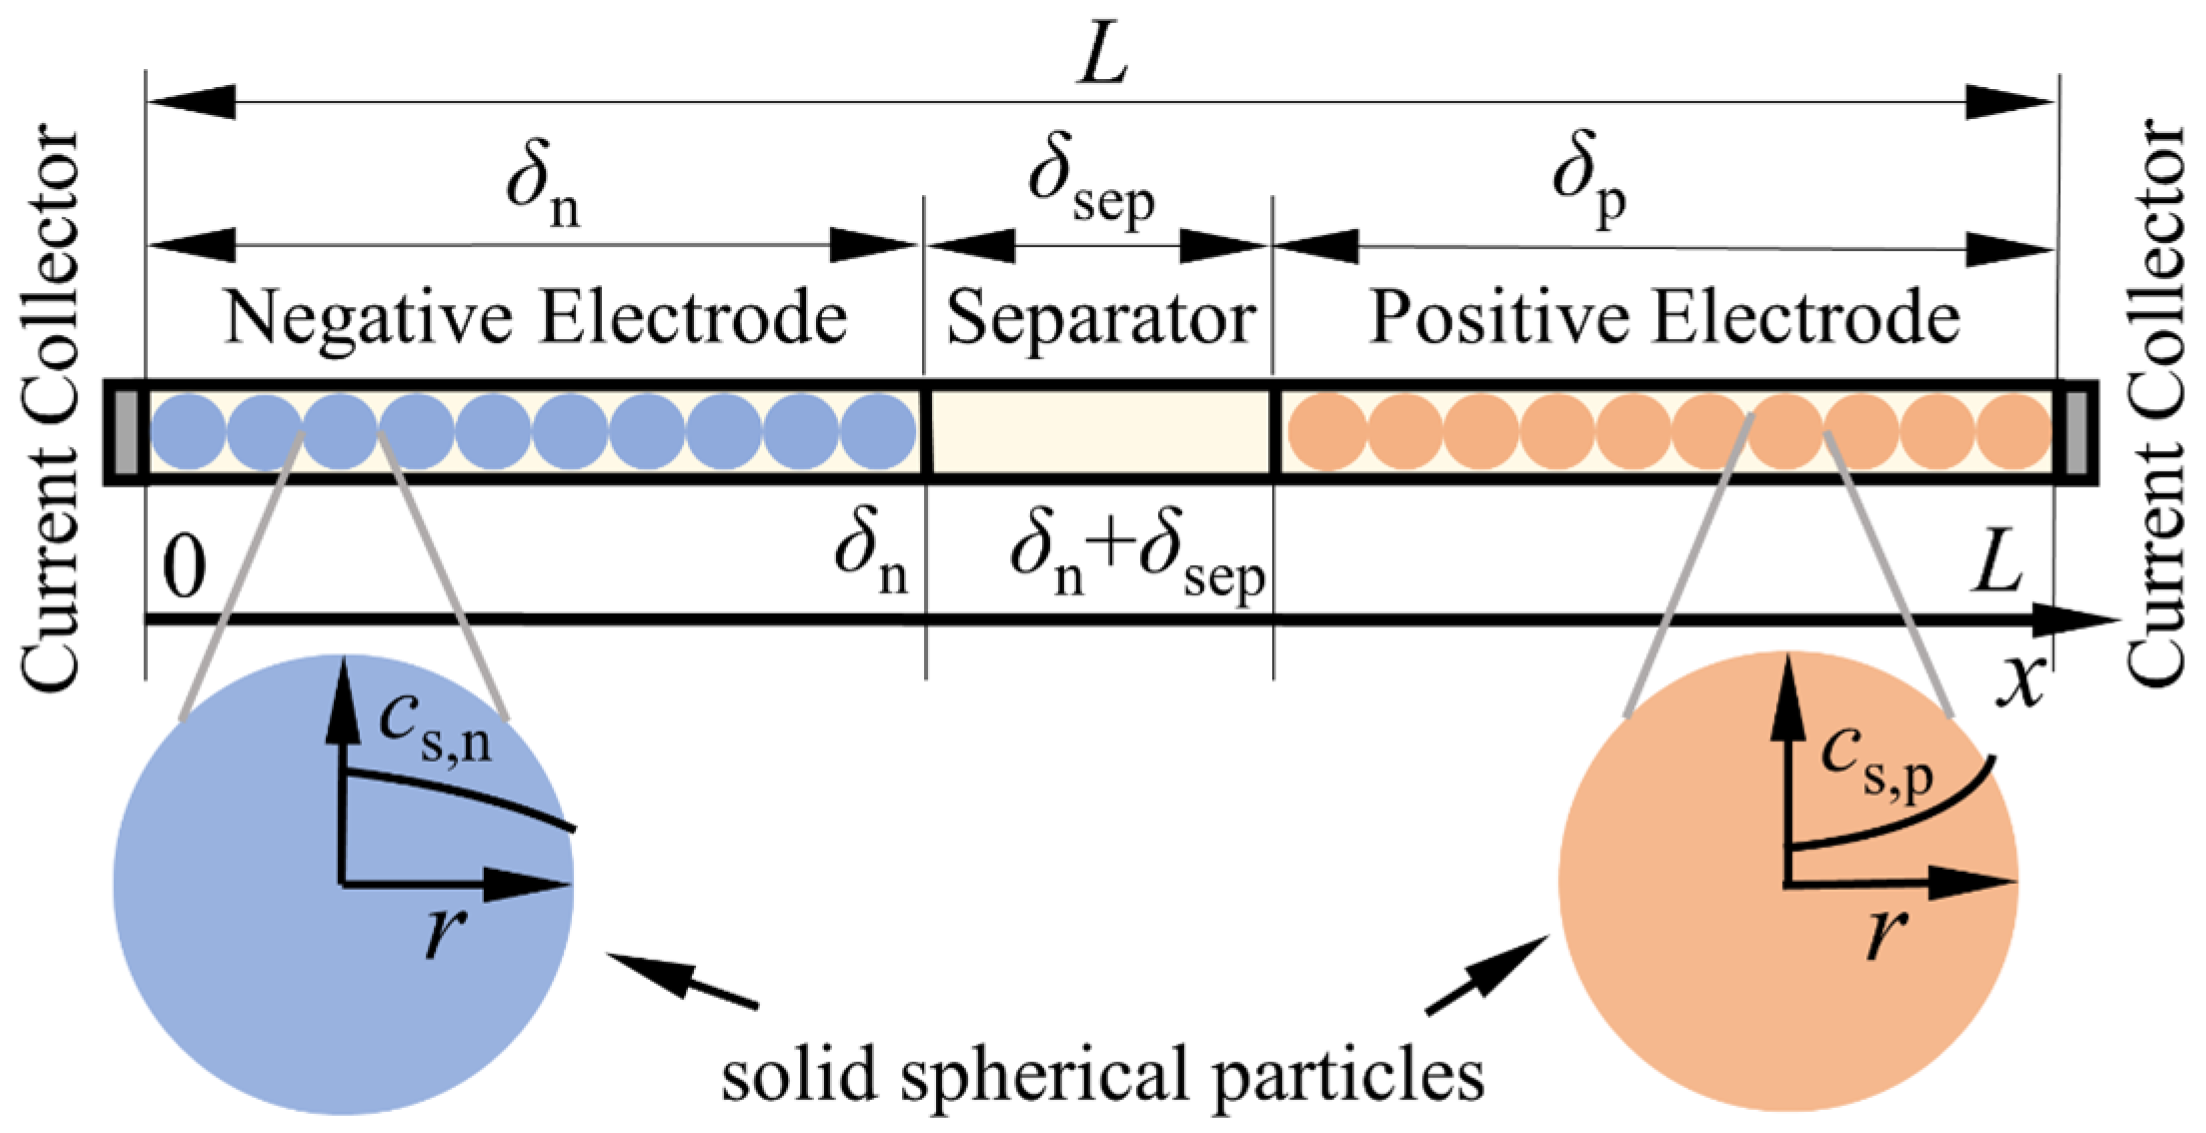
Figure 1. Physical structure of the P2D model.
Energies 17 03782 g001
Figure 2. Physical structure of the ESP model.
Energies 17 03782 g002
Figure 3. (a) Potential distribution inside the battery of P2D model; (b) Potential distribution inside the battery of ESP model.
Energies 17 03782 g003
Figure 4. (a) Current profile of PDPC test; (b) current profile of HWFET test; (c) terminal voltages of P2D, ESP, and IESP models in PDPC test; (d) terminal voltages of P2D, ESP, and IESP models in HWFET test; (e) terminal voltage errors of P2D, ESP, and IESP models in PDPC test; (f) terminal voltage errors of P2D, ESP, and IESP models in HWFET test.
Energies 17 03782 g004
Figure 5. Frequency response of the original function G s , diff , sub and the approximate transfer functions G s , diff , sub , NRC : (a) Nyquist plot; (b) magnitude response; (c) phase response.
Energies 17 03782 g005
Figure 6. Equivalent circuit model for calculating surface normalized SOC of: (a) negative solid particle; (b) positive solid particle.
Energies 17 03782 g006
Figure 7. Surface normalized SOC and errors of positive solid particle in first HWFET cycle calculated by: (a1,a2) 1st order ECM, (b1,b2) 2nd order ECM, (c1,c2) 3rd order ECM, (d1,d2) 4th order ECM.
Energies 17 03782 g007
Figure 8. (a) Equivalent circuit model for calculating OCP at surface of solid particles; (b) relation curve between OCP and normalized SOC of negative solid particle; (c) relation curve between OCP and normalized SOC of positive solid particle.
Energies 17 03782 g008
Figure 9. Surface OCP and errors of positive solid particle in first HWFET cycle calculated by: (a1,a2) 1st order ECM, (b1,b2) 2nd order ECM, (c1,c2) 3rd order ECM, (d1,d2) 4th order ECM.
Energies 17 03782 g009
Figure 10. (a) ECM for calculating Δ ϕ e ; (b) Δ ϕ e calculated by ECM and P2D model; (c) error of Δ ϕ e calculated by ECM.
Energies 17 03782 g010
Figure 11. Reaction overpotentials calculated using the Butler–Volmer equation and its linear approximation.
Energies 17 03782 g011
Figure 12. (a) The relation curve between K bv , LIN and χ bv , LIN ; (b) ECMs for calculating the electrochemical reaction overpotential.
Energies 17 03782 g012
Figure 13. (a) The relation curve between linearized reaction resistance and surface normalized SOC; (b) reaction overpotential calculated by the linearized reaction resistance in HPPC test; (c) reaction overpotential calculated by the linearized reaction resistance and correction factor in HPPC test.
Energies 17 03782 g013
Figure 14. ECM of SEI film resistance: (a) in positive electrode; (b) in negative electrode.
Energies 17 03782 g014
Figure 15. (a) The main schematic of the ECMIESP model, (b) ECM for calculating Δ ϕ e in ECMIESP model, (c) ECM for calculating surface normalized SOC of negative solid particle in ECMIESP model, (d) ECM for calculating surface normalized SOC of positive solid particle in ECMIESP model.
Energies 17 03782 g015
Figure 16. (a) Schematic of ECM2RC model; (b) current profile and state of charge (SOC) variation during the MHPPC test.
Energies 17 03782 g016
Figure 17. (a1c1) Model-calculated voltages in MHPPC2: (a1) terminal voltages, (b1) overvoltages, (c1) terminal voltage errors; (a2c2) model-calculated voltages in MHPPC10: (a2) terminal voltages, (b2) overvoltages, (c2) terminal voltage errors.
Energies 17 03782 g017
Figure 18. (a1) Z avg and Z surf , (b1,c1) V ocp , avg and V ocp , surf , (d1) V ocp , diff of solid particles calculated by ECMIESP model under MHPPC2 test; (a2) Z avg and Z surf , (b2,c2) V ocp , avg and V ocp , surf , (d2) V ocp , diff of solid particles calculated by ECMIESP model under MHPPC10 test.
Energies 17 03782 g018
Figure 19. (a) Current profile of HPPC; (b) model-calculated terminal voltages of the ECMIESP and ECM2RC in HPPC test; (c) terminal voltage errors of ECMIESP and ECM2RC in HPPC test.
Energies 17 03782 g019
Figure 20. (ac) Model-calculated voltages in CCD test: (a) terminal voltages, (b) overvoltages, (c) terminal voltage errors.
Energies 17 03782 g020
Figure 21. SOC and OCP of solid particles calculated by ECMIESP model in CCD test: (a) Z avg and Z surf , (b,c) V ocp , avg and V ocp , surf , (d) V ocp , diff .
Energies 17 03782 g021
Figure 22. Model-calculated voltages in HWFET test: (a) terminal voltages, (b) overvoltages, (c) terminal voltage errors.
Energies 17 03782 g022
Figure 23. SOC and OCPs of both solid particles calculated by ECMIESP model in HWFET test: (a) Z avg and Z surf , (b,c) V ocp , avg and V ocp , surf , (d) V ocp , diff .
Energies 17 03782 g023
Figure 24. (a) Reaction overpotentials calculated by linear approximation of Butler–Volmer equation; (b) reaction overpotentials calculated by ECMIESP model; (c) error of reaction overpotentials calculated by linear approximation of Butler–Volmer equation.
Energies 17 03782 g024
Figure 25. SOC estimation results using the ECM2RC and ECMIESP models in CCD and HWFET tests: (a) SOC under CCD test, (b) SOC under HWFET test, (c) SOC error under CCD test, (d) SOC error under HWFET test.
Energies 17 03782 g025
Table 1. Governing equations of the P2D lithium-ion battery model [12,22].
Governing Equations Boundary Conditions
Negative
electrode
electrolyte
phase diffusion:
ε e , n c e , n t = x D e , n eff c e , n x + ( 1 t + ) a s , n j f , n D e , n eff = D e ε e , n B r u g g , a s , n = 3 ε s , n / R s , n , j f , n ( t , x ) = j v , n a s , n F (1) c e x x = 0 = 0 ,   D e , n eff c e x x = δ n - = D e , sep eff c e x x = δ n +
Negative
electrode
electrolyte phase potential:
x κ n eff ϕ e x + x 2 R T κ n eff ( 1 + β ) ( t + 1 ) F ln ( c e ) x + j v , n = 0 κ n eff = κ ε e , n b r u g g (2) ϕ e x x = 0 = 0 ,   κ n eff ϕ e x x = δ n - = κ sep eff ϕ e x x = δ n +
Negative
electrode Solid phase potential:
x σ s , n eff ϕ s , n x j v , n = 0 σ s , n eff = σ s , n ε s , n B r u g g (3) σ s , n eff ϕ s , n x x = 0 = I t A ,   ϕ s , n x x = δ n = 0
Negative
electrode solid phase diffusion:
c s , n t D s , n r 2 r r 2 c s , n r = 0 (4) D s , n c s , n r r = 0 = 0 ,   D s , n c s , n r r = R s , n = j f , n
Separator area electrolyte phase diffusion: ε e , sep c e , sep t = x D e , sep eff c e , sep x D e , sep eff = D e ε e , sep B r u g g (5) D e , sep eff c e x x = ( δ n + δ sep ) = D e , p eff c e x x = ( δ n + δ sep ) + c e x = δ n = c e x = δ n + , c e x = ( δ n + δ sep ) = c e x = ( δ n + δ sep ) +
Separator area electrolyte phase potential: x κ sep eff ϕ e x + x 2 R T κ sep eff ( 1 + β ) ( t + 1 ) F ln ( c e ) x = 0 κ sep eff = κ ε e , sep b r u g g (6) κ sep eff ϕ e x x = ( δ n + δ sep ) = κ p eff ϕ e x x = ( δ n + δ sep ) + ϕ e x = δ n = ϕ e x = δ n + , ϕ e x = ( δ n + δ sep ) = ϕ e x = ( δ n + δ sep ) +
Positive
electrode
electrolyte phase diffusion:
ε e , n c e t = x D e , p eff c e x + ( 1 t + ) a s , p j f , p D e , p eff = D e ε e , p B r u g g , a s , p = 3 ε s , p / R s , p , j f , p = j v , p a s , p F (7) c e x x = L = 0
Positive
electrode
electrolyte phase potential:
x κ p eff ϕ e x + x 2 R T κ p eff ( 1 + β ) ( t + 1 ) F ln ( c e ) x + j v , p = 0 κ p eff = κ ε e , p b r u g g (8) ϕ e x x = L = 0
Positive
electrode Solid phase potential:
x σ s , p eff ϕ s , p x j v , p = 0 σ s , p eff = σ s , p ε s , p B r u g g (9) σ s , p eff ϕ s , p x x = L = I t A ,   σ s , p eff ϕ s , p x x = δ n + δ sep = 0
Positive
electrode solid phase diffusion:
c s , p t D s , p r 2 r r 2 c s , p r = 0 (10) D s , p c s , p r r = 0 = 0 ,   D s , p c s , p r r = R s , p = j f , p
Butler–Volmer equation: j f , n avg = i 0 , n exp 0.5 F R T η bv , n exp 0.5 F R T η bv , n i 0 , n = k n ( c e ) 0.5 ( c s , max , n c s , surf , n ) 0.5 ( c s , surf , n ) 0.5 j f , p avg = i 0 , p exp 0.5 F R T η bv , p exp 0.5 F R T η bv , p i 0 , p = k p ( c e ) 0.5 ( c s , max , p c s , surf , p ) 0.5 ( c s , surf , p ) 0.5 (11)
Solid/Electrolyte interface (SEI) Ohmic effect: η SEI , n = R film , n F j f , n avg η SEIp = R film , p F j f , p avg (12)
Surface potential of the
active particle:
V OCP , surf , n = E ocp , n ( θ surf , n ) θ surf , n = c s , surf , n c s , max , n , c s , surf , n = c s , n r = R s , n V OCP , surf , p = E ocp , p ( θ surf , p ) θ surf , p = c s , surf , p c s , max , p , c s , surf , p = c s , p r = R s , p (13)
Electrode potential balance: η bv , n = ϕ s , n ϕ e U OCP , surf , n η SEI , n η bv , p = ϕ s , p ϕ e U OCP , surf , p η SEI , p (14)
Terminal
voltage:
V t ( t ) = ϕ s , p x = L ϕ s , n x = 0 = V ocp , surf , p x = L V ocp , surf , n x = 0 + η bv , p x = L η bv , n x = 0 + η SEI , p x = L η SEI , n x = 0 + ϕ e x = L ϕ e x = 0 (15)
Table 2. Battery model parameters [12,22].
ParametersSymbolUnitNegative ElectrodeSeparatorPositive Electrode
Faraday’s constant F C mol 1 96487
Gas constant R J mol 1 K 1 8.314
Temperature T K 298
Bruggman exponent B r u g g 1.5
Electrode plate area A m 2 0.050.050.05
Electrolyte volume fraction ε e 0.310.3
Region thickness δ m 100 × 10 6 25 × 10 6 100 × 10 6
Initial electrolyte concentration c e , 0 mol m 3 100010001000
Li ion transference number t + 0.40.40.4
activity coefficient β 000
Particle radius R s m 10 × 10 6 10 × 10 6
Filler volume fraction ε f 0.1 0.2
Active material volume fraction ε s 1 ε e ε f 1 ε e ε f
Maximum solid phase concentration c s , max mol m 3 24,983 51,218
lithium concentration in the solid phase at SOC = 100% c s , soc = 100 % mol m 3 19,624 20,046
lithium concentration in the solid phase at SOC = 0% c s , soc = 0 % mol m 3 968.6 42,432
Solid phase conductivity σ s S m 1 100 10
1C discharge current density I d _ 1 C A m 2 30
Current I A C _ rate × I d _ 1 C × A
Electrolyte diffusivity D e m 2 s 1 2 . 7877 × 10 10
Electrolyte conductivity κ e S m 1 κ e = 0.0911 + 1.9101 × 10 3 c e 1.052 × 10 6 c e 2 + 0.1554 × 10 9 c e 3
Solid phase diffusivity D s m 2 s 1 D s , n = 3 . 9 × 10 14 D s , p = 1 × 10 13
Reaction rate constant k m 2.5 mol 0.5 s 1 k n = 1 × 10 10 k p = 3 × 10 11
SEI film conductance R film Ω m 2 R film , n = 5 × 10 3 R film , p = 1 × 10 3
Electrode open circuit potential V ocp V Equation (16) Equation (17)
Table 3. Governing equations of the ESP model.
Governing Equations Boundary Conditions
Electrolyte
phase
diffusion:
ε e , n c e , n t = x D e , n eff c e , n x + ( 1 t + ) a s , n j f , n avg ε e , sep c e , sep t = x D e , sep eff c e , sep x ε e , p c e , p t = x D e , p eff c e , p x + ( 1 t + ) a s , p j f , p avg D e , n eff = D e ε e , n B r u g g , a s , n = 3 ε s , n / R s , n D e , p eff = D e ε e , p B r u g g , a s , p = 3 ε s , p / R s , p (18) c e x x = 0 = 0 , c e x x = L = 0 D e , n eff c e x x = δ n - = D e , sep eff c e x x = δ n + D e , sep eff c e x x = ( δ n + δ sep ) = D e , p eff c e x x = ( δ n + δ sep ) + c e x = δ n = c e x = δ n + c e x = ( δ n + δ sep ) = c e x = ( δ n + δ sep ) + (19)
Electrolyte
Phase
Potential:
x κ n eff ϕ e x + x 2 R T κ n eff ( 1 + β ) ( t + 1 ) F ln ( c e ) x = I t A δ n x κ sep eff ϕ e x + x 2 R T κ sep eff ( 1 + β ) ( t + 1 ) F ln ( c e ) x = 0 x κ p eff ϕ e x + x 2 R T κ p eff ( 1 + β ) ( t + 1 ) F ln ( c e ) x = I t A δ p (20) ϕ e x x = 0 = 0 , ϕ e x x = L = 0 κ n eff ϕ e x x = δ n - = κ sep eff ϕ e x x = δ n + κ sep eff ϕ e x x = ( δ n + δ sep ) = κ p eff ϕ e x x = ( δ n + δ sep ) + ϕ e x = δ n = ϕ e x = δ n + ϕ e x = ( δ n + δ sep ) = ϕ e x = ( δ n + δ sep ) + (21)
Solid phase
diffusion:
c s , n t D s , n r 2 r r 2 c s , n r = 0 c s , p t D s , p r 2 r r 2 c s , p r = 0 σ s , p eff = σ s , p ε s , p B r u g g σ s , p eff = σ s , p ε s , p B r u g g (22) D s , n c s , n r r = 0 = 0 , D s , p c s , p r r = 0 = 0 D s , n c s , n r r = R s , n = j f , n avg D s , p c s , p r r = R s , p = j f , p a v g (23)
Electrode
potential
balance:
η bv , n = ϕ s , n ϕ e x = 0 U OCP , surf , n η SEI , n η bv , p = ϕ s , p ϕ e x = L U OCP , p η SEI , p (24)
Butler–Volmer equation: j f , n avg = i 0 , n exp 0.5 F R T η bv , n exp 0.5 F R T η bv , n i 0 , n = k n ( c e ) 0.5 ( c s , max , n c s , surf , n ) 0.5 ( c s , surf , n ) 0.5 j f , p avg = i 0 , p exp 0.5 F R T η bv , p exp 0.5 F R T η bv , p i 0 , p = k p ( c e ) 0.5 ( c s , max , p c s , surf , p ) 0.5 ( c s , surf , p ) 0.5 (25)
Solid/Electrolyte interface Ohmic effect: η SEI , n = R film , n F j f , n avg η SEI , n = R film , n F j f , n avg (26)
Surface
potential of
solid
particle:
V OCP , surf , n = E ocp , n ( θ surf , n ) θ surf , n = c s , surf , n c s , max , n , c s , surf , n = c s , n r = R s , n V OCP , surf , p = E ocp , p ( θ surf , p ) θ surf , p = c s , surf , p c s , max , p , c s , surf , p = c s , p r = R s , p (27)
Average reaction ion pore wall flux: j f , n avg = I t R s , n 3 A δ n ε s , n F j f , p avg = I t R s , p 3 A δ p ε s , p F (28)
Terminal
voltage:
V t , ESP ( t ) = V ocp , surf , p V ocp , surf , n + η bv , p η bv , n + η SEI , p η SEI , n + Δ ϕ e Δ ϕ e = ϕ e x = L ϕ e x = 0 (29)
Table 4. Approximate transfer functions for G s , diff , sub .
Order G s , diff , sub , NRC O G s , diff , sub
N = 1 G s , diff , sub , 1 RC = 0.2 1 + 0.0211 ρ s (43)0.0249
N = 2 G s , diff , sub , 2 RC = 0.0562 1 + 0.00164 ρ s + 0.1438 1 + 0.0355 ρ s (44)0.0074
N = 3 G s , diff , sub , 3 RC = 0.0215 1 + 0.000251 ρ s + 0.0552 1 + 0.0051 ρ s + 0.1233 1 + 0.0426 ρ s (45)0.0024
N = 4 G s , diff , sub , 4 RC = 0.0170 1 + 0.000173 ρ s + 0.0373 1 + 0.00279 ρ s + 0.0572 1 + 0.0174 ρ s + 0.0885 1 + 0.0532 ρ s (46)0.0014
Table 5. Parameters of ECM-IESP model.
ParametersSymbolUnitCalculation FormulasValues
Solid-phase diffusion control coefficient in positive electrode: ρ p s Equation (52)1000.0
Solid-phase diffusion control coefficient in negative electrode: ρ n s Equation (52)2564.1
Equivalent resistance of overpotential related to lithium ions concentration difference in the electrolyte phase: R e , full , ce Ω Equation (71)0.00871
Time constant of overpotential related to lithium ions concentration difference in electrolyte: τ e , full , ce s Equation (71)23.17
Ohmic resistance of electrolyte: R e , full , ohm Ω Equation (68)0.0115
Linearized reaction resistance in positive electrode: R bv , LIN , p Ω Equation (86)Figure 13a
Linearized reaction resistance in negative electrode: R bv , LIN , n Ω Equation (86)Figure 13a
Resistance of the SEI film in positive electrode: R SEI , p Ω Equation (90)0.00133
Resistance of the SEI film in negative electrode: R SEI , n Ω Equation (90)0.00556
Battery capacity: C cap A s Equation (48)5400
Relationship between the OCP and normalized SOC of solid particle in positive electrode: E e q , n o r m , p V Equation (57)Figure 8b
Relationship between the OCP and normalized SOC of solid particle in negative electrode: E e q , n o r m , n V Equation (57)Figure 8c
Table 6. The parameters of ECM2RC identified by MHPPC tests.
Test NameSOC Range (%)R0 (Ω)R1 (Ω)C1 (F)R2 (Ω)C2 (F)RMSE of ECM2RC (mV)RMSE of ECMIESP (mV)
MHPPC1[100, 90]0.0381 0.0102 2133 0.0025 54,471 1.1 0.7
MHPPC2[90, 80]0.0372 0.0097 2214 0.0028 29,773 1.0 0.7
MHPPC3[80, 70]0.0367 0.0079 1965 0.0061 22,776 3.8 0.8
MHPPC4[70, 60]0.0370 0.0071 833 0.0159 5148 6.1 0.8
MHPPC5[60, 50]0.0372 0.0136 1174 0.0010 297,555 6.9 0.7
MHPPC6[50, 40]0.0372 0.0110 2494 0.0022 378,628 1.2 0.8
MHPPC7[40, 30]0.0381 0.0112 2618 0.0049 181,263 2.1 0.8
MHPPC8[30, 20]0.0395 0.0166 1981 0.0098 86,366 4.2 0.8
MHPPC9[20, 10]0.0418 0.0176 1651 0.0070 37,613 5.3 0.7
MHPPC10[10, 0]0.0463 0.0171 2948 0.0334 26,891 60.1 1.2
Table 7. Voltage MAXEs of ECM2RC and ECMIESP models at different current pulses in HPPC test.
0.25C Pulse 0.5C Pulse1C Pulse2C Pulse3C Pulse4C Pulse5C Pulse
ECM2RC0.62 mV1.18 mV1.61 mV5.46 mV16.32 mV31.71 mV50.30 mV
ECMIESP0.21 mV0.41 mV0.86 mV1.94 mV3.00 mV4.04 mV4.89 mV
Table 8. RMSEs and MAXEs of the voltage calculated by ECM2RC and ECMIESP models during CCD test.
SOC Range (%) ECM2RCECMIESP
RMSE (mV)MAXE (mV)RMSE (mV)MAXE (mV)
High SOC segment[100, 80]1.72.63.15.0
Medium SOC segment[80, 10]15.530.66.916.7
Low SOC segment[10, 0]254.5831.05.410.8
Table 9. RMSEs and MAXEs of voltage calculated by ECM2RC and ECMIESP models during HWFET test.
SOC Range (%) ECM2RCECMIESP
RMSE (mV)MAXE (mV)RMSE (mV)MAXE (mV)
High SOC segment[100, 80]2.821.51.83.8
Medium SOC segment[80, 10]12.433.64.014.2
Low SOC segment[10, 0]73.4704.77.064.3
Table 10. MAXEs of SOC estimation based on ECM2RC and ECMIESP models during CCD and HWFET tests.
SOC Range (%) ECM2RCECMIESP
MAXE in CCDMAXE in HWFETMAXE in CCDMAXE in HWFET
High SOC segment[95, 80]0.4%0.6%0.8%0.6%
Medium SOC segment[80, 10]2.8%3.2%1.6%1.2%
Low SOC segment[10, 0]9.4%4.3%0.7%0.5%
Disclaimer/Publisher’s Note: The statements, opinions and data contained in all publications are solely those of the individual author(s) and contributor(s) and not of MDPI and/or the editor(s). MDPI and/or the editor(s) disclaim responsibility for any injury to people or property resulting from any ideas, methods, instructions or products referred to in the content.