Representing Carbon Dioxide Transport and Storage Network Investments within Power System Planning Models
Abstract
1. Introduction
2. Materials and Methods
2.1. ReEDS Model Overview
2.2. Incumbent CTS Representation in ReEDS
2.3. New CTS Representation in ReEDS
2.3.1. Overview and Regionality
2.3.2. Data
- Pipeline costs: cost estimates for CO2 pipelines (inclusive of booster pumps), and
- Injection and storage capacity and costs: site-specific injection and storage capacity limits and levelized costs of CO2 injection and long-term maintenance of a storage reservoir.
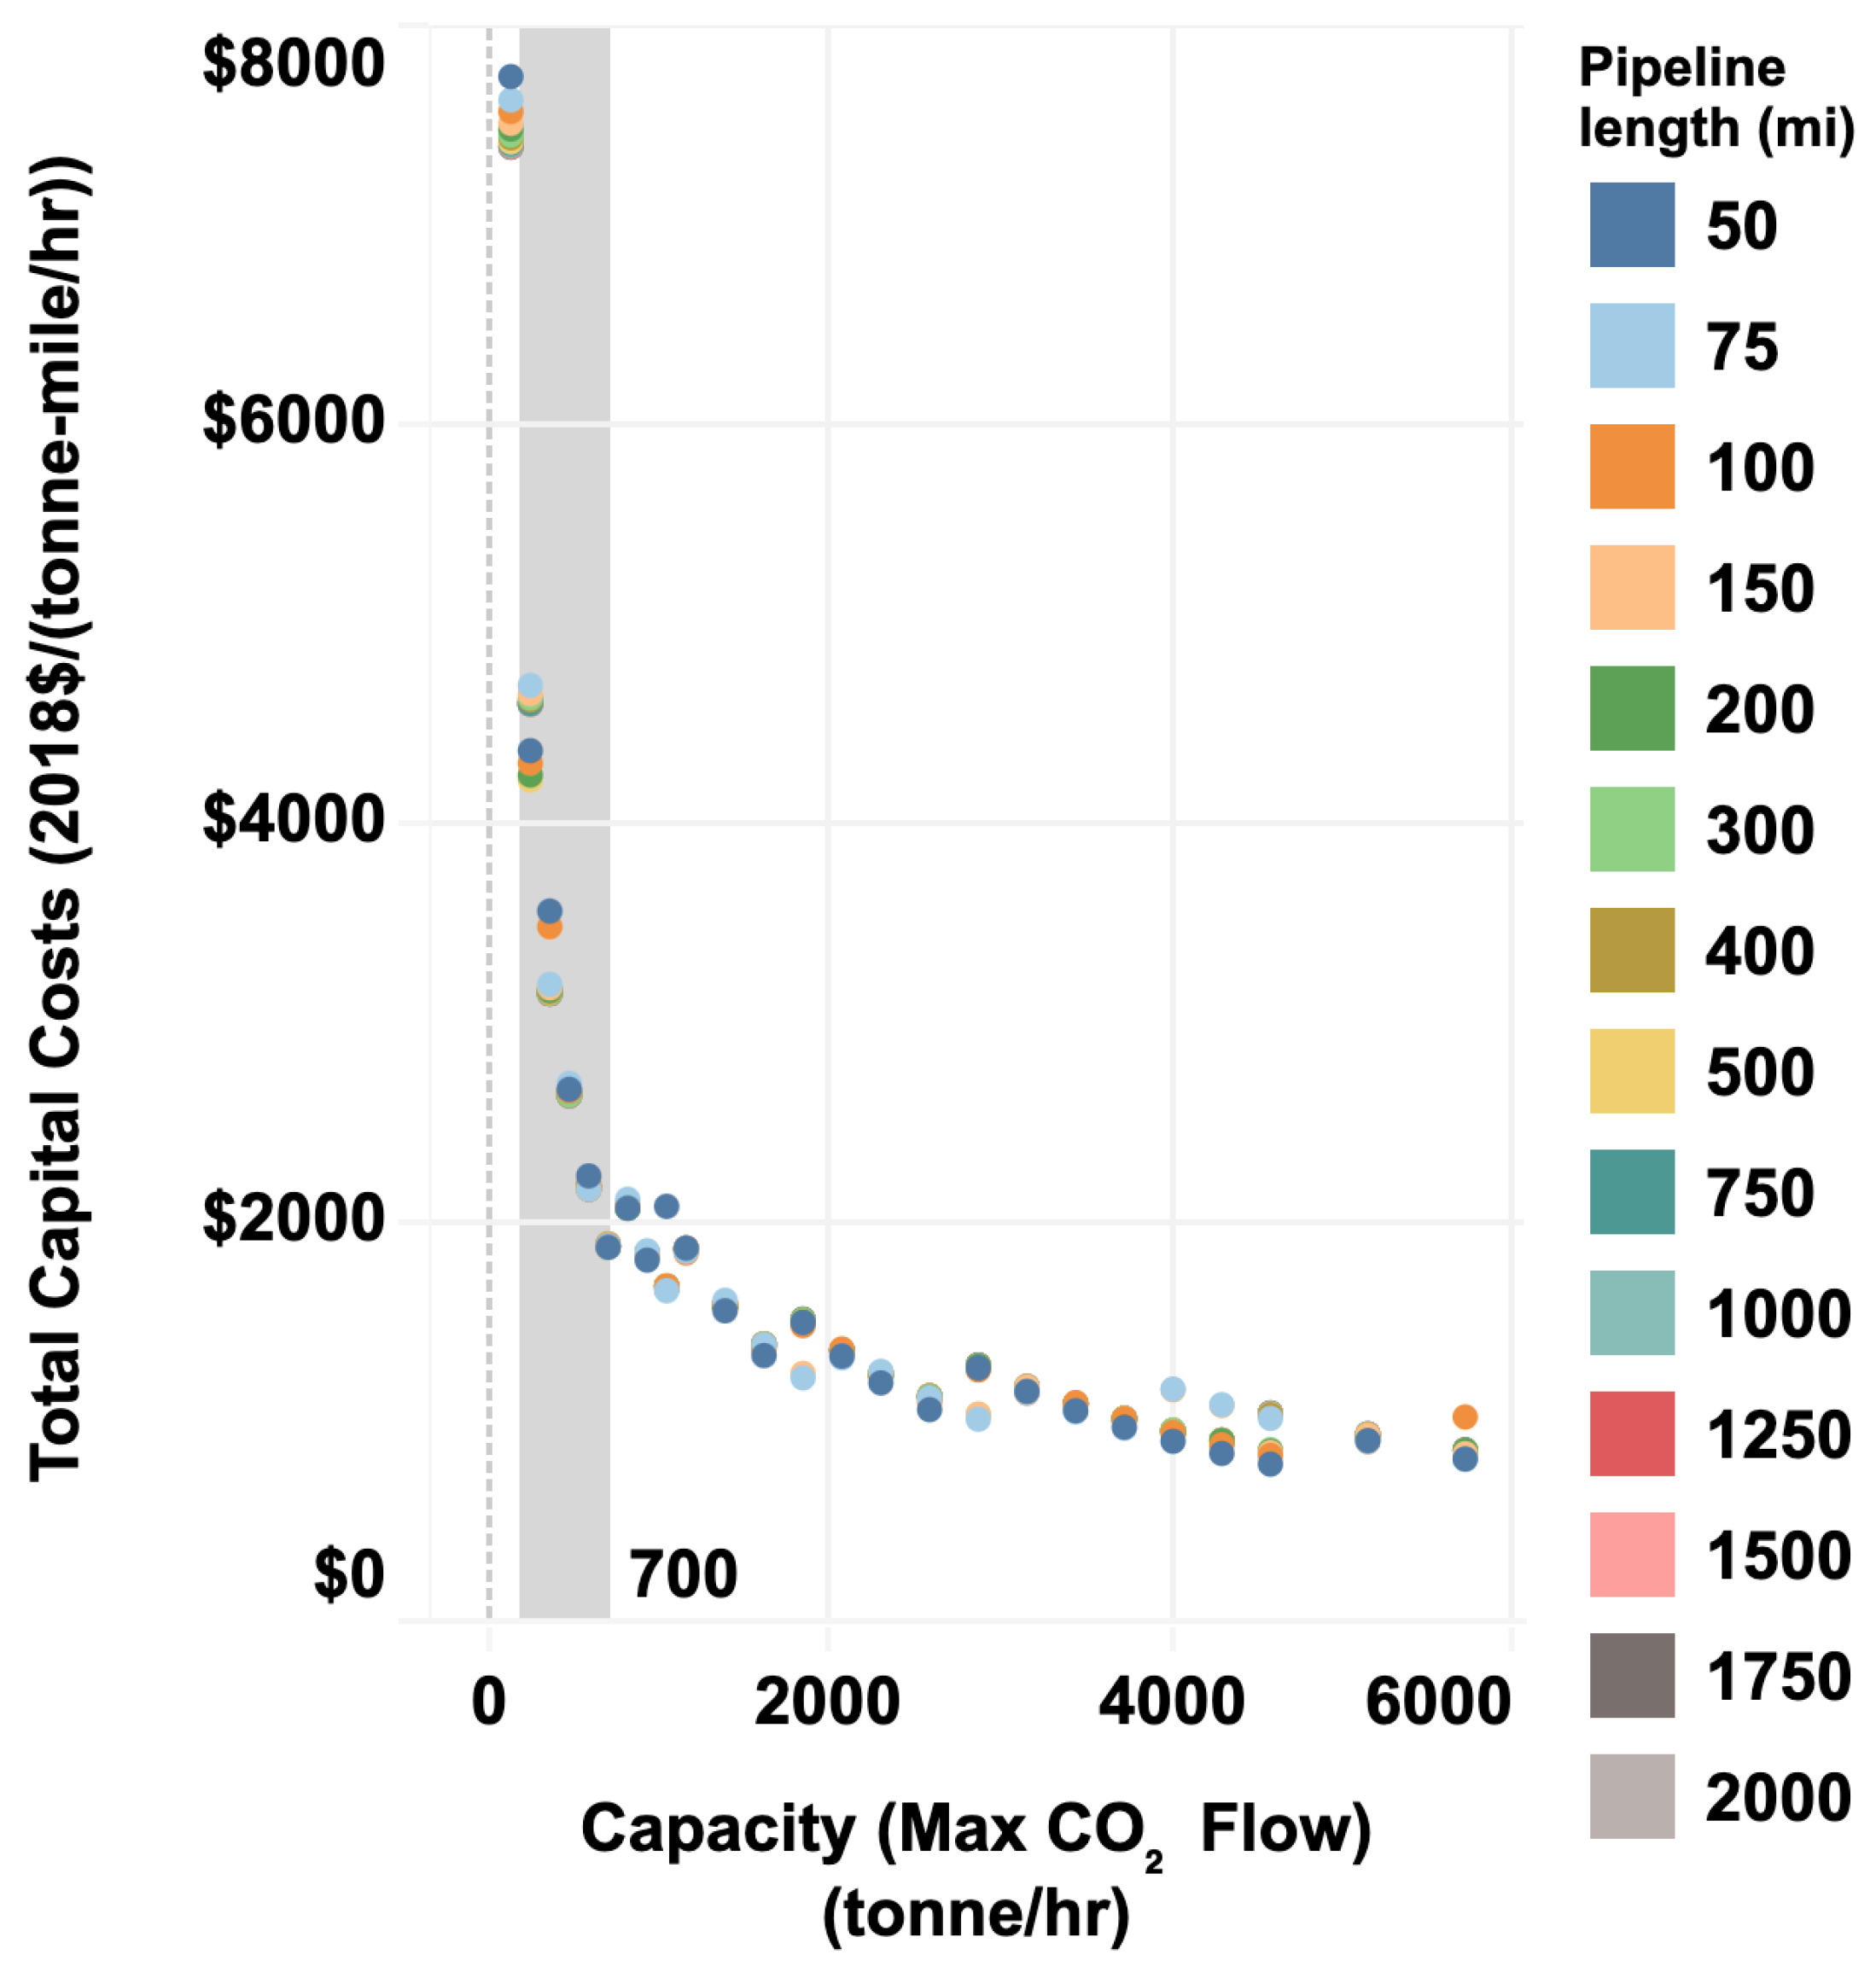
Pipeline Costs
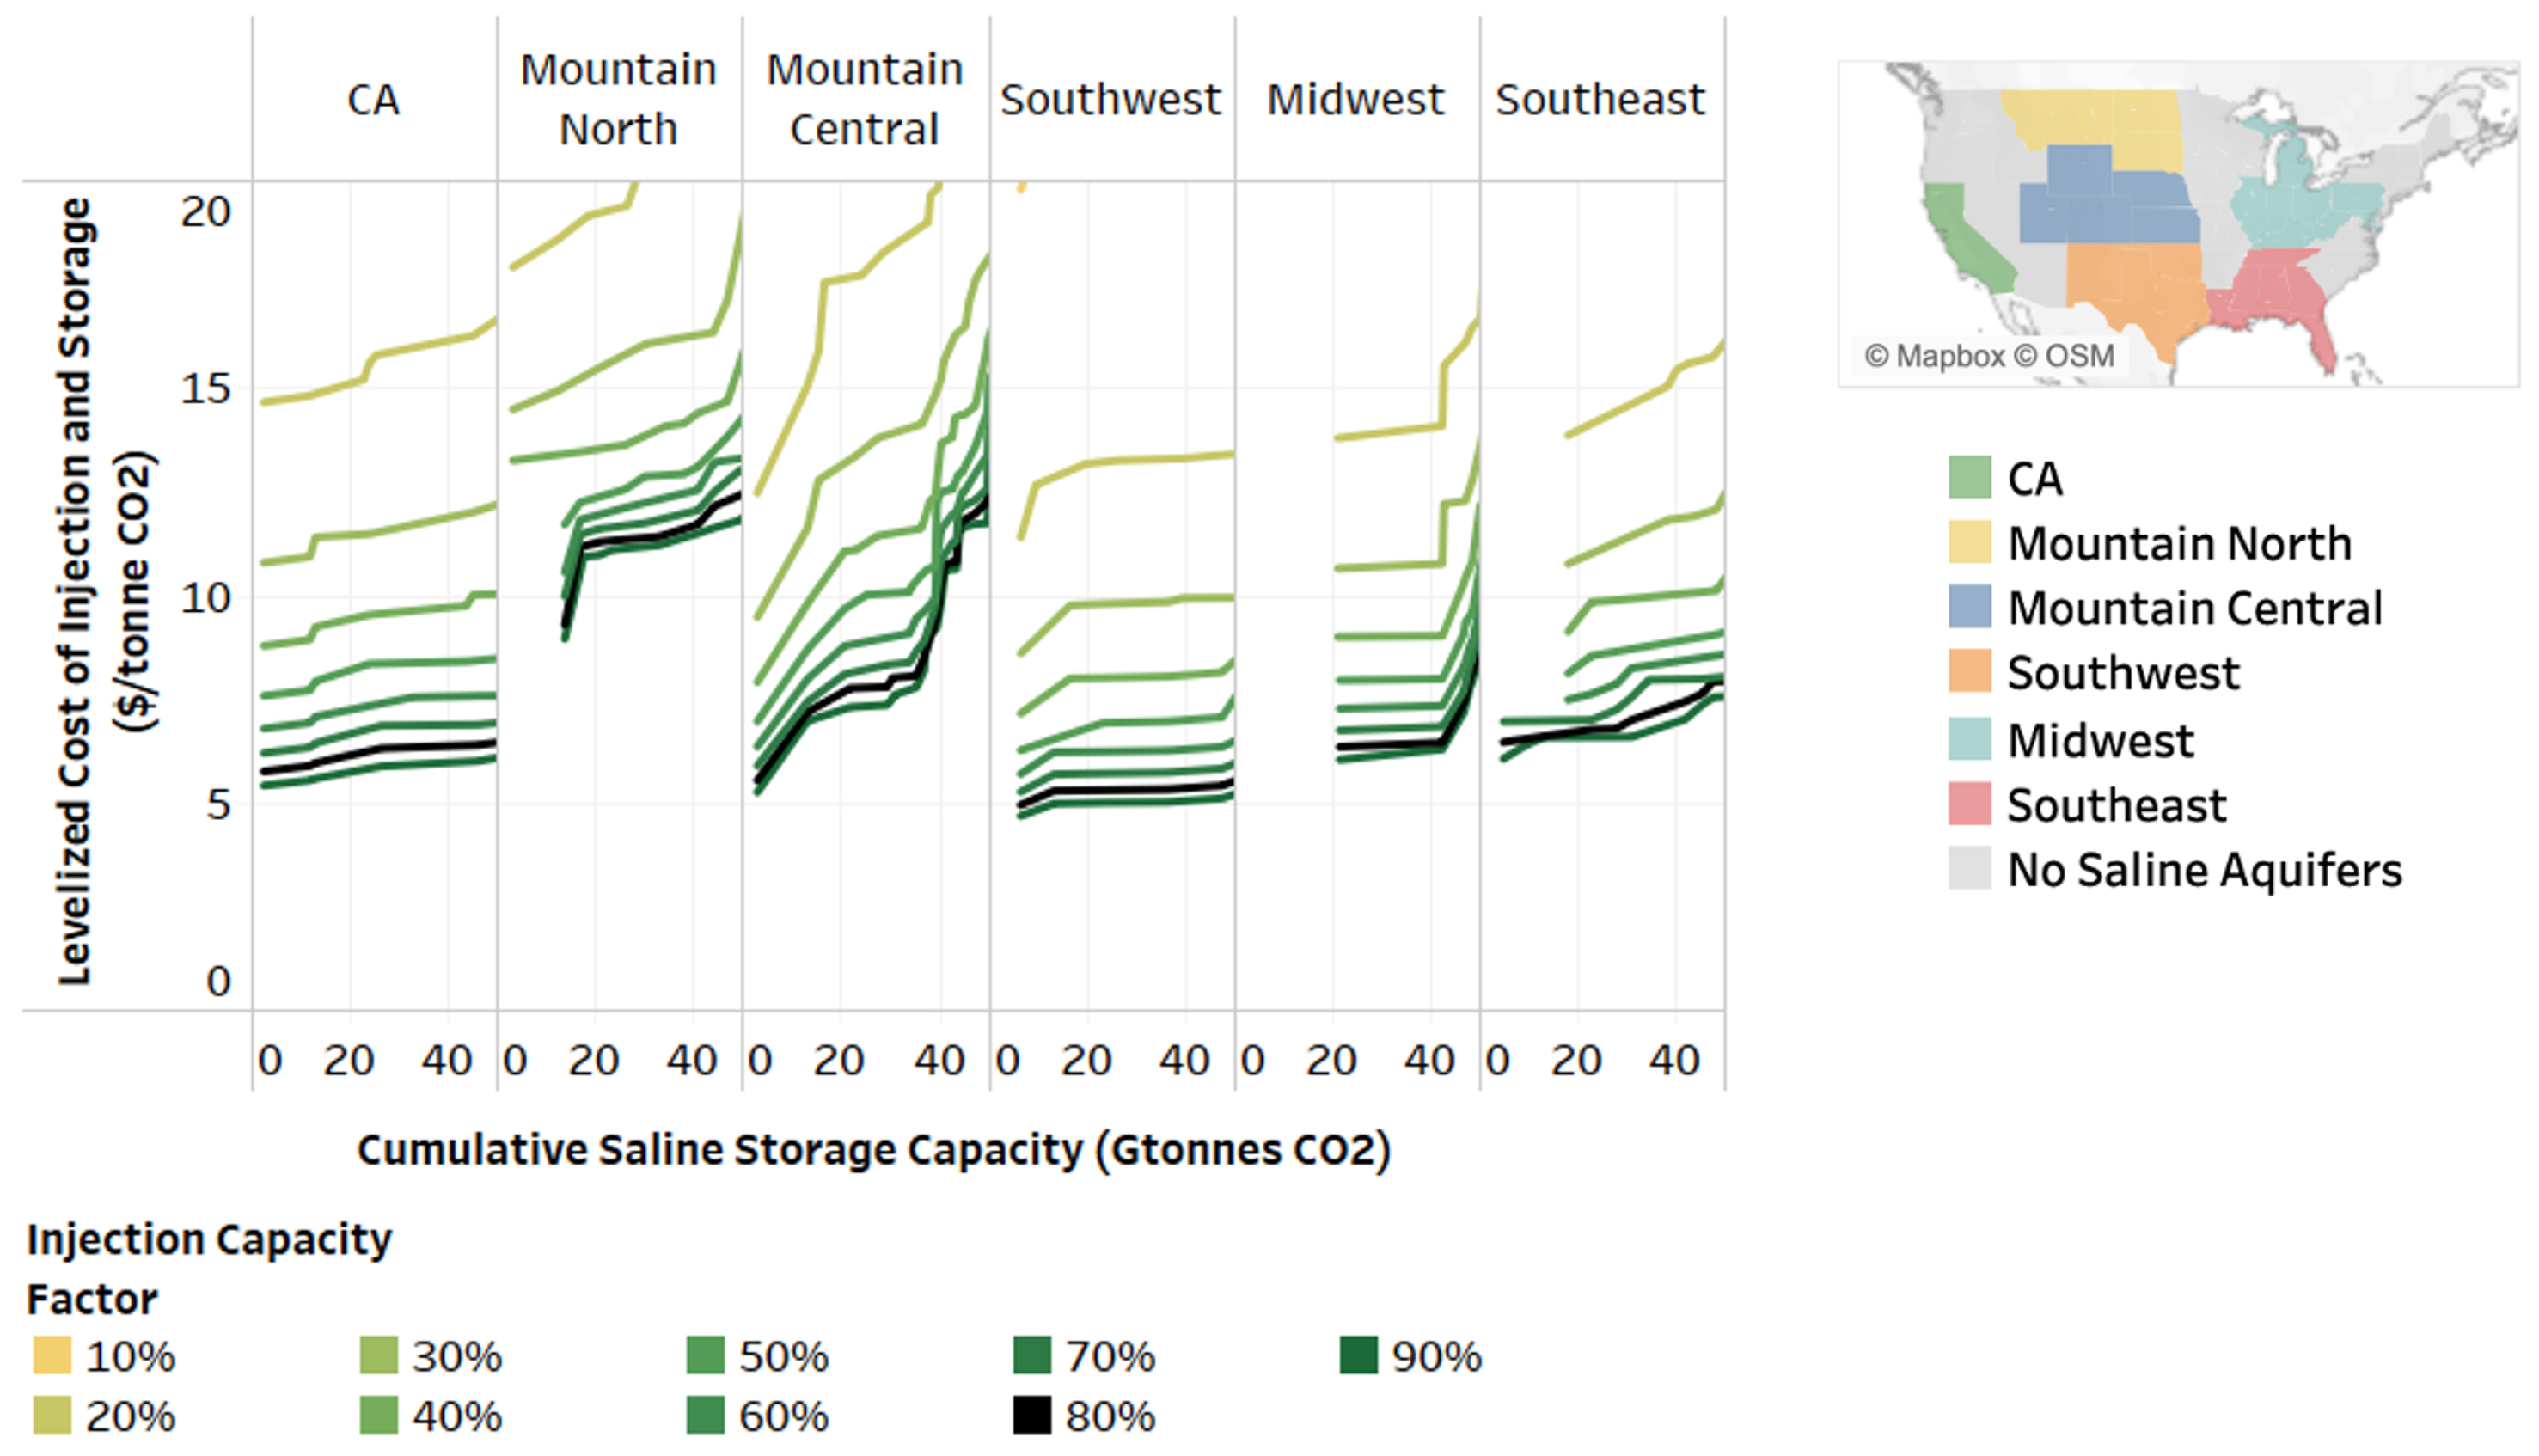
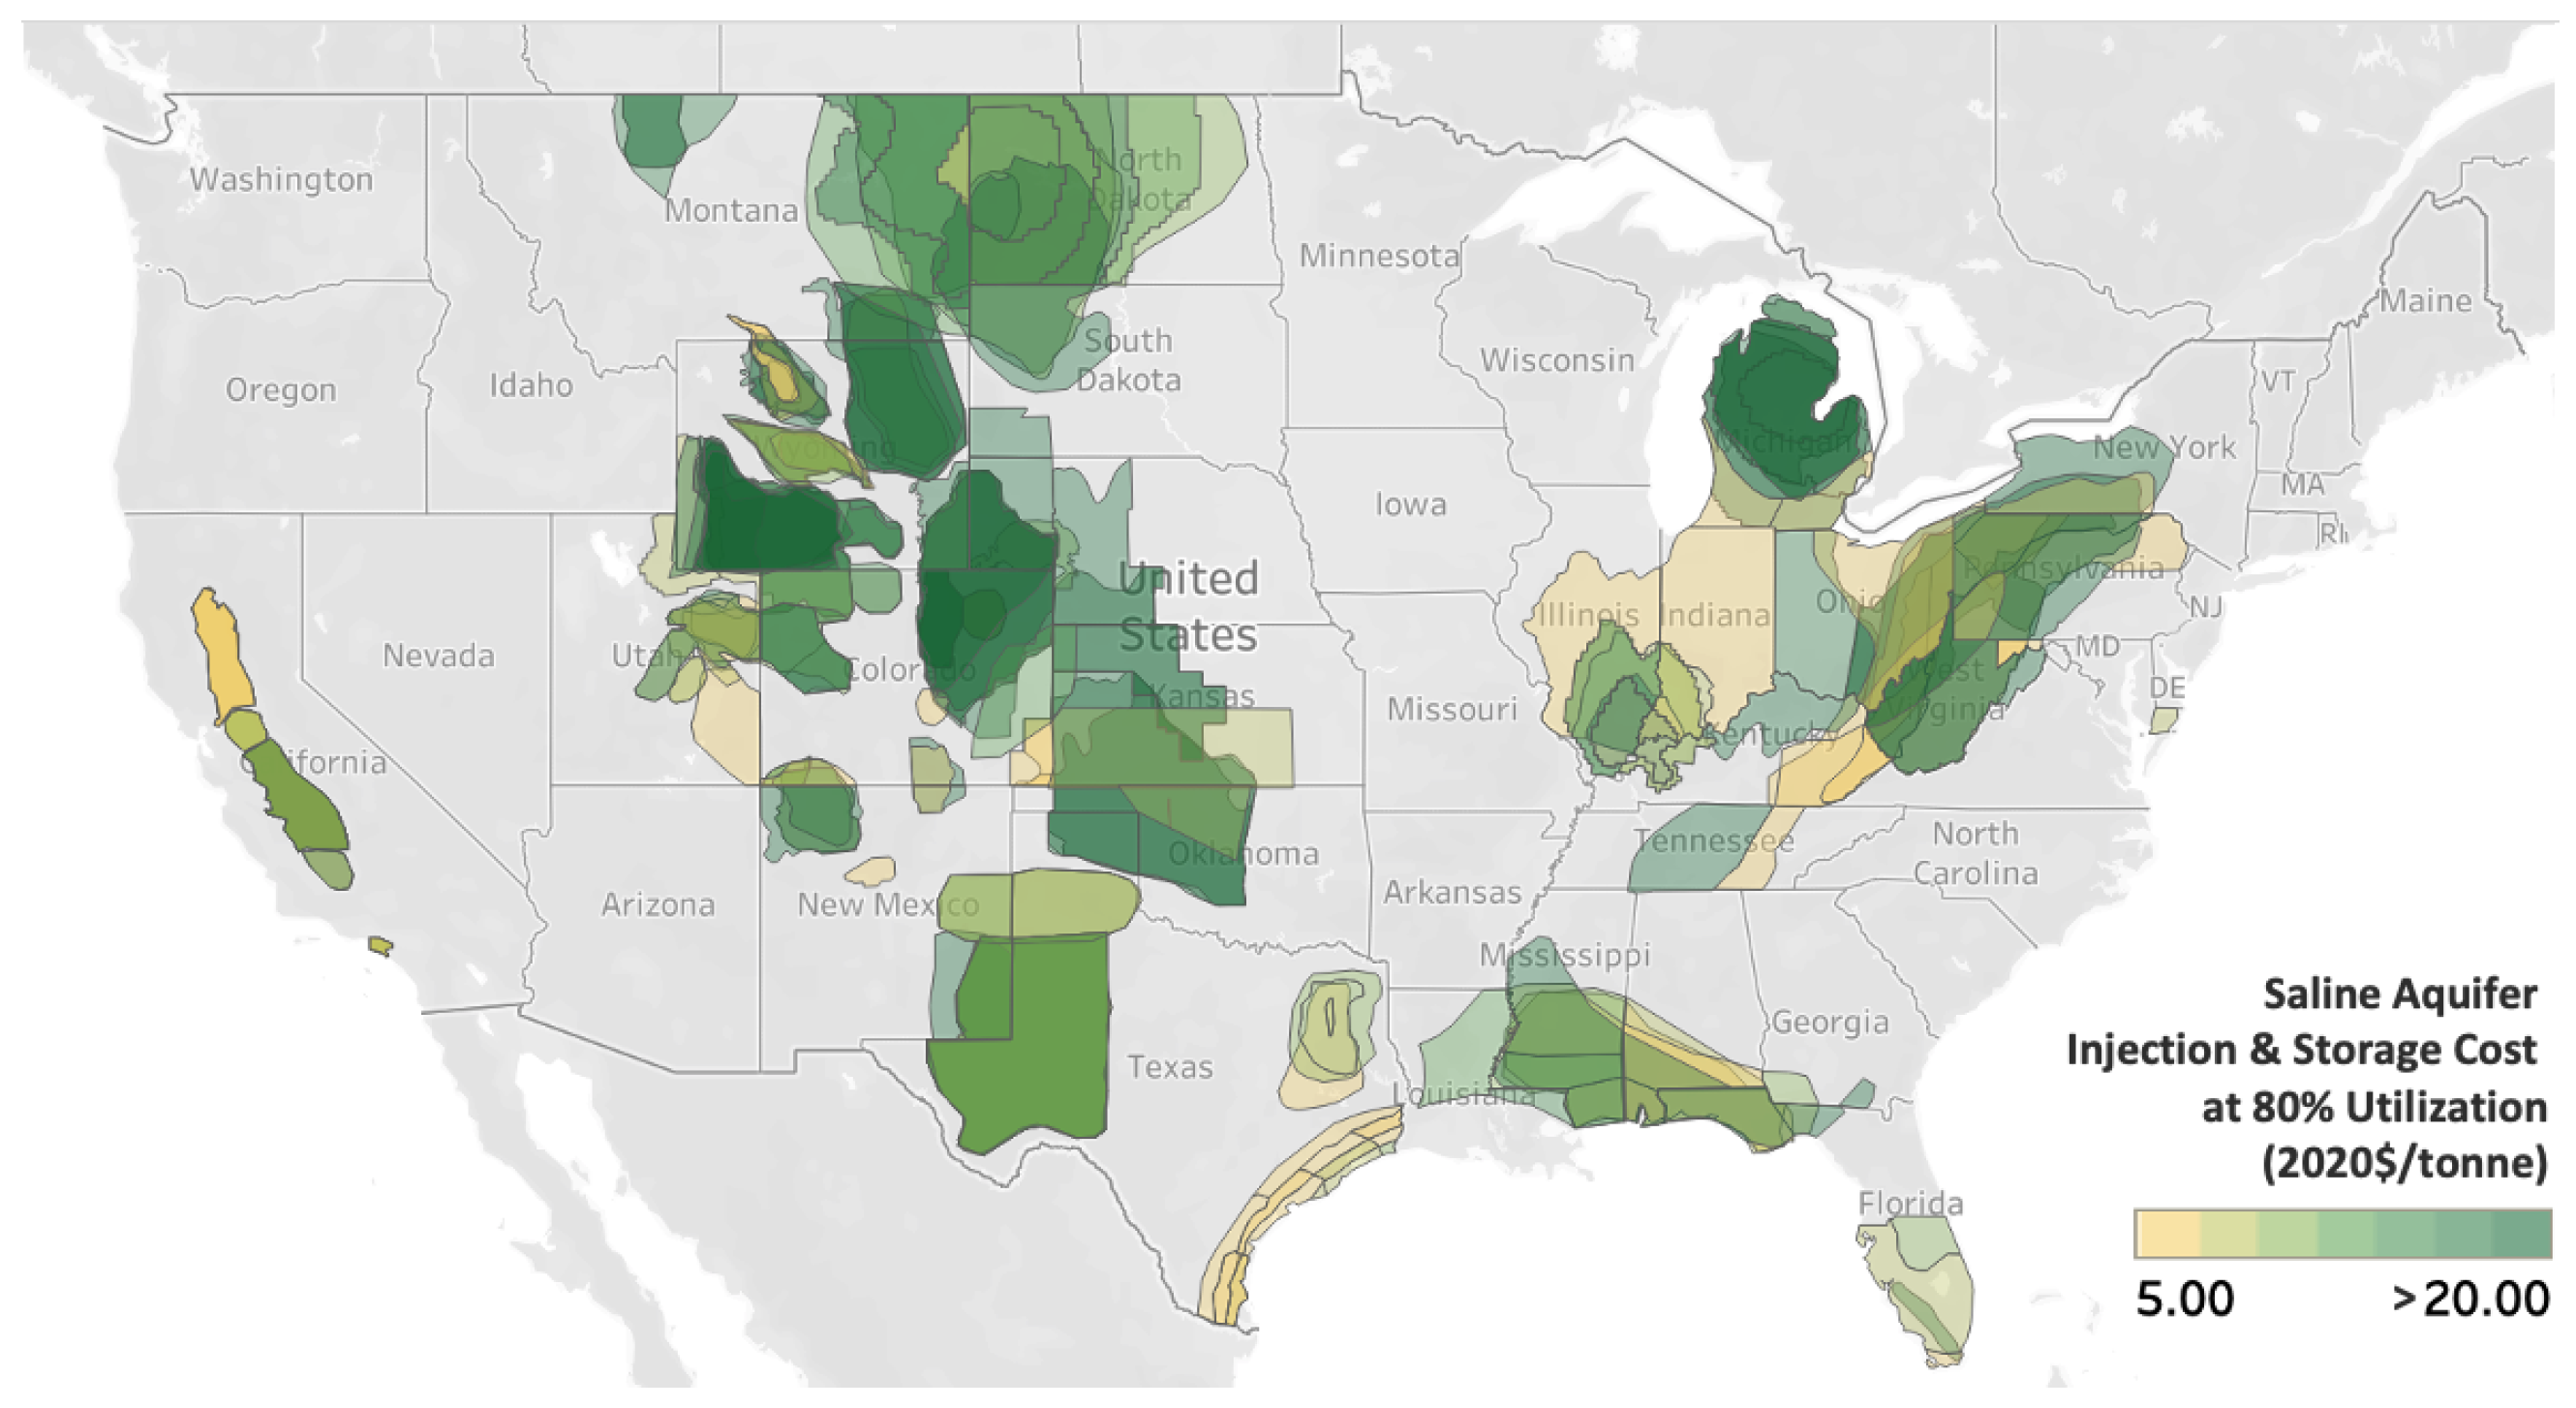
CO2 Injection and Storage Costs and Capacity
2.4. CTS Network Formulation
- :
- CO2 captured [tonnes/hour]
- :
- apparent power generation [MW]
- :
- hydrogen production [tonnes H2/hour]
- :
- CO2 captured by DAC [tonnes/hour]
- :
- trunk pipeline capacity [tonnes/hour]
- :
- trunk pipeline CO2 flow [tonnes/hour]
- :
- spur pipeline capacity [tonnes CO/hour]
- :
- CO2 stored by spur pipeline [tonnes/hour]
- i:
- technology
- r:
- region
- a:
- saline aquifer
- h:
- model period (can be configured to span one or multiple hours)
- t:
- modeled year.
- :
- discounted annualized capital cost of trunk pipeline [2020 $/((tonne/hour)-mi)]
- :
- discounted annualized capital cost of spur pipeline [2020 $/((tonne/hour)-mi)]
- :
- annual fixed O&M cost of trunk pipeline [2020 $/((tonne/hour)-mi-yr)]
- :
- annual fixed O&M cost of spur pipeline [2020 $/((tonne/hour)-mi-yr)]
- :
- cost of CO2 injection and storage in aquifer a [2020$/tonne]
- :
- trunk pipeline route distance between regions r and [mi]
- :
- spur pipeline route distance between regions r and aquifer a [mi]
- :
- time-period-to-hour weighting factor [hours/period]
- :
- model-year-to-year weighting factor [yr/model year]
- :
- CO2 capture rate of technology i [tonnes/MWh]
- p:
- CO2 intensity of hydrogen production via steam methane reforming with CCS (SMR-CCS) [tonnes/tonne H2]
- :
- physical limit on CO2 injection mass flow rate at aquifer a [tonnes/hour]
- :
- physical cumulative storage capacity at aquifer a [tonnes]
2.4.1. New Objective Function Terms
2.4.2. CO2 Capture Equation
2.4.3. Trunk and Spur Pipeline Capacity Limits
2.4.4. Network Flow Balance
2.4.5. Physical Limitations on CO2 Storage
2.5. Scenario Analysis
3. Results
3.1. Base Scenario Results-Capacity, Generation, and CO2 Capture
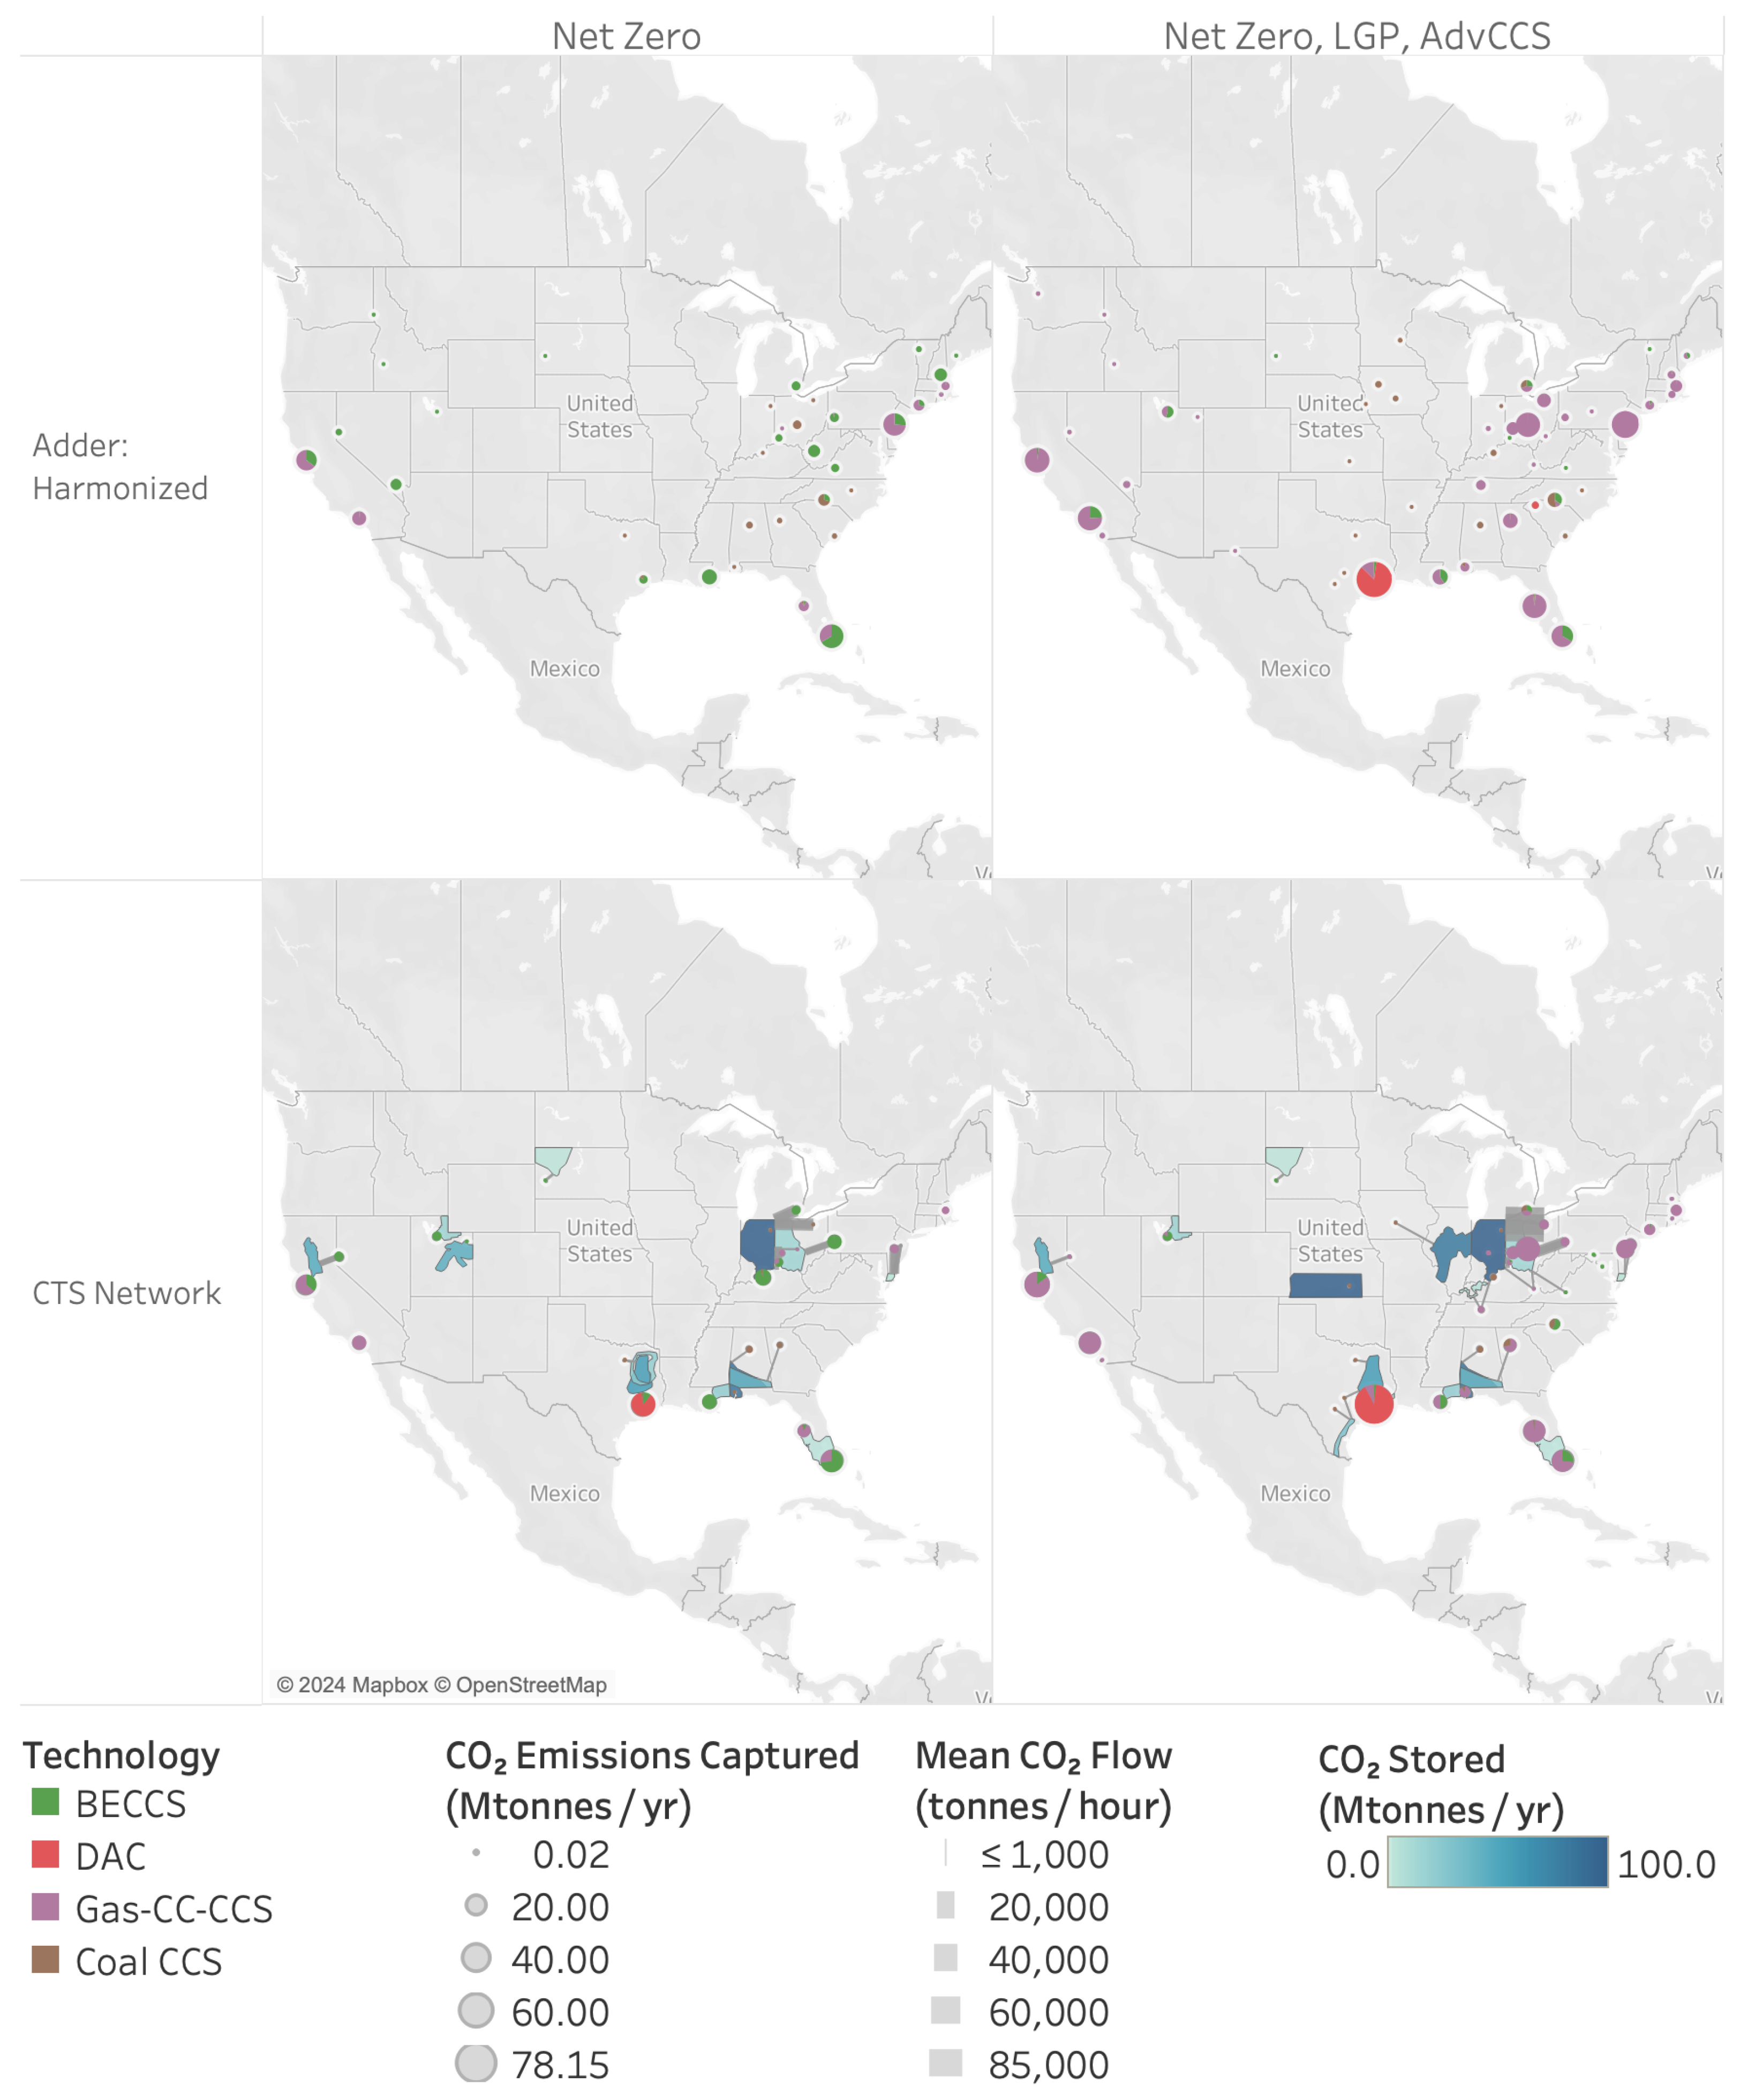
3.2. CTS Network Investments
3.3. Sensitivity of CTS Investments to Infrastructure Costs
4. Discussion
Caveats and Research Opportunities
Author Contributions
Funding
Data Availability Statement
Acknowledgments
Conflicts of Interest
Abbreviations
| Acronym | Translation |
| 45Q | Portion of the IRA specific to CCS incentives |
| AdvCCS | Indicator for reduced CCS costs |
| BECCS | Biomass burning generator with CCS |
| CCS | CO2 capture and storage |
| CDR | carbon dioxide removal |
| CEM | Capacity expansion model |
| CO2 | Carbon dioxide |
| CO2_S_COM | CO2 Saline storage cost model |
| CO2_T_COM | CO2 transport cost model |
| CTS | CO2 transportation, injection, and storage |
| DAC | Direct air capture, powered by electricity |
| EOR | Enhanced oil recovery |
| FECM | Fossil energy and carbon management |
| Gas-CC | Gas-fired combined cycle generator |
| Gas-CC-CCS | Gas-CC unit with CCS |
| Gas-CT | Gas-fired combustion turbine generator |
| IPM | Integrated planning model |
| IRA | Inflation Reduction Act |
| LCCTS | Levelized cost of CTS |
| LGP | Low gas price |
| NEMS | National Energy Modeling System |
| NETL | National Energy Technology Laboratory |
| NG DAC | Direct air capture, powered by natural gas |
| NRAP | National Risk Assessment Partnership |
| NREL | National Renewable Energy Laboratory |
| O&M | Operations and maintenance |
| OGS | Oil–gas–steam generator |
| RE-CC | Renewable-fuel powered combined cycle unit |
| ReEDS | Regional Energy Deployment System |
| SCPC | Supercritical pulverized coal |
| VRE | Variable renewable energy |
Appendix A. ReEDS Modeling Assumptions
References
- Sepulveda, N.A.; Jenkins, J.D.; Sisternes, F.J.d.; Lester, R.K. The Role of Firm Low-Carbon Electricity Resources in Deep Decarbonization of Power Generation. Joule 2018, 2, 2403–2420. [Google Scholar] [CrossRef]
- Jenkins, J.D.; Luke, M.; Thernstrom, S. Getting to Zero Carbon Emissions in the Electric Power Sector. Joule 2018, 2, 2498–2510. [Google Scholar] [CrossRef]
- Bistline, J.; Blanford, G.; Brown, M.; Burtraw, D.; Domeshek, M.; Farbes, J.; Fawcett, A.; Hamilton, A.; Jenkins, J.; Jones, R.; et al. Emissions and energy impacts of the Inflation Reduction Act. Sciences 2023, 380, 1324–1327. [Google Scholar] [CrossRef] [PubMed]
- Cole, W.J.; Greer, D.; Denholm, P.; Frazier, A.W.; Machen, S.; Mai, T.; Vincent, N.; Baldwin, S.F. Quantifying the challenge of reaching a 100% renewable energy power system for the United States. Joule 2021, 5, 1732–1748. [Google Scholar] [CrossRef]
- Denholm, P.; Arent, D.J.; Baldwin, S.F.; Bilello, D.E.; Brinkman, G.L.; Cochran, J.M.; Cole, W.J.; Frew, B.; Gevorgian, V.; Heeter, J.; et al. The challenges of achieving a 100% renewable electricity system in the United States. Joule 2021, 5, 1331–1352. [Google Scholar] [CrossRef]
- Denholm, P.; Brown, P.; Cole, W.; Mai, T.; Sergi, B.; Brown, M.; Jadun, P.; Ho, J.; Mayernik, J.; McMillan, C.; et al. Examining Supply-Side Options to Achieve 100% Clean Electricity by 2035; National Renewable Energy Laboratory (NREL): Golden, CO, USA, 2022. [Google Scholar] [CrossRef]
- Mowers, M.; Mignone, B.K.; Steinberg, D.C. Quantifying value and representing competitiveness of electricity system technologies in economic models. Appl. Energy 2022, 329, 120–132. [Google Scholar] [CrossRef]
- SDSN. Zero Carbon Action Plan; Technical report; Sustainable Development Solutions Network (SDSN): New York, NY, USA, 2020. [Google Scholar]
- Bistline, J.E.T.; Blanford, G.J. Impact of carbon dioxide removal technologies on deep decarbonization of the electric power sector. Nat. Commun. 2021, 12, 3732. [Google Scholar] [CrossRef] [PubMed]
- Paltsev, S.; Morris, J.; Kheshgi, H.; Herzog, H. Hard-to-Abate Sectors: The role of industrial carbon capture and storage (CCS) in emission mitigation. Appl. Energy 2021, 300, 117322. [Google Scholar] [CrossRef]
- National Academies of Sciences, Engineering, and Medicine. Accelerating Decarbonization of the U.S. Energy System; National Academies Press: Washington, DC, USA, 2021; p. 25932. [Google Scholar] [CrossRef]
- US Congress. H.R.5376—Inflation Reduction Act of 2022. 2022. Available online: https://www.congress.gov/bill/117th-congress/house-bill/5376/text (accessed on 1 May 2024).
- Middleton, R.S.; Kuby, M.J.; Wei, R.; Keating, G.N.; Pawar, R.J. A dynamic model for optimally phasing in CO2 capture and storage infrastructure. Environ. Model. Softw. 2012, 37, 193–205. [Google Scholar] [CrossRef]
- EIA. The National Energy Modeling System: An Overview; EIA: Washington, DC, USA, 2023.
- Young, D. US-REGEN Model Documentation; Technical Update 3002016601; Electric Power Research Institute: Washington, DC, USA, 2020. [Google Scholar]
- Sepulveda, N.; Jenkins, J.; Mallapragada, D.; Schwartz, A.; Patankar, N.; Xu, Q.; Morris, J.; Bonaldo, L.; Chakrabarti, S. GenX: A Configurable Power System Capacity Expansion Model for Studying Low-Carbon Energy Futures. Available online: https://github.com/GenXProject/GenX.jl (accessed on 1 May 2024).
- U.S. Environmental Protection Agency Clean Air Markets Division. Documentation for EPA’s Power Sector Modeling Platform v6 Using the Integrated Planning Model; Technical Report; U.S. Environmental Protection Agency Clean Air Markets Division: Washington, DC, USA, 2021.
- Ho, J.; Becker, J.; Brown, M.; Brown, P.; Chernyakhovskiy, I.; Cohen, S.; Cole, W.; Corcoran, S.; Eurek, K.; Frazier, W.; et al. Regional Energy Deployment System (ReEDS) Model Documentation (Version 2020); National Renewable Energy Laboratory: Golden, CO, USA, 2021. [Google Scholar] [CrossRef]
- Ogland-Hand, J.D.; Cohen, S.; Kammer, R.M.; Ellett, K.M.; Saar, M.O.; Bennett, J.A.; Middleton, R.S. The Importance of Modeling Carbon Dioxide Transportation and Geologic Storage in Energy System Planning Tools. Front. Energy Res. 2022, 10, 855105. [Google Scholar] [CrossRef]
- Grant, T. Quality Guidelines for Energy System Studies: Carbon Dioxide Transport and Storage Costs in NETL Studies; Technical Report DOE/NETL-2019/2044; U.S. Department of Energy Office of Scientific and Technical Information: Oak Ridge, TN, USA, 2019. [CrossRef]
- National Energy Technology Laboratory. FECM/NETL CO2 Transport Cost Model, Collection of Model and Associated Documents; Technical Report; NETL: Albany, OR, USA, 2022. [Google Scholar]
- Metz, B.; Davidson, O.; De Coninck, H.; Loos, M.; Meyer, L. IPCC Special Report on Carbon Dioxide Capture and Storage; Cambridge University Press: Cambridge, UK, 2005. [Google Scholar]
- National Energy Technology Laboratory. FE/NETL CO2 Saline Storage Cost Model, Collection of Model and Associated Documents; Technical Report; NETL: Albany, OR, USA, 2017. [Google Scholar]
- Bauer, J.; Rowan, C.; Barkhurst, A.; Digiulio, J.; Jones, K.; Sabbatino, M.; Rose, K.; Wingo, P. National Carbon Sequestration Database (NATCARB); NETL: Albany, OR, USA, 2018. [Google Scholar]
- Morgan, D.; Guinan, A.; Sheriff, A. FECM/NETL CO2 Transport Cost Model (2022): Model Overview; U.S. Department of Energy Office of Scientific and Technical Information: Oak Ridge, TN, USA, 2022. [CrossRef]
- Kim, J.H.; Park, J.B.; Park, J.K.; Joo, S.K. A market-based analysis on the generation expansion planning strategies. In Proceedings of the 13th International Conference on, Intelligent Systems Application to Power Systems, Arlington, VA, USA, 6–10 November 2005; p. 6. [Google Scholar] [CrossRef]
- Lara, C.L.; Mallapragada, D.S.; Papageorgiou, D.J.; Venkatesh, A.; Grossmann, I.E. Deterministic electric power infrastructure planning: Mixed-integer programming model and nested decomposition algorithm. Eur. J. Oper. Res. 2018, 271, 1037–1054. [Google Scholar] [CrossRef]
- Li, Q.; Han, Y.; Liu, X.; Ansari, U.; Cheng, Y.; Yan, C. Hydrate as a by-product in CO2 leakage during the long-term sub-seabed sequestration and its role in preventing further leakage. Environ. Sci. Pollut. Res. 2022, 29, 77737–77754. [Google Scholar] [CrossRef] [PubMed]
- Li, Q.; Wang, Y.; Wang, F.; Wu, J.; Usman Tahir, M.; Li, Q.; Yuan, L.; Liu, Z. Effect of thickener and reservoir parameters on the filtration property of CO2 fracturing fluid. Energy Sources Part Recover. Util. Environ. Eff. 2020, 42, 1705–1715. [Google Scholar] [CrossRef]
- National Renewable Energy Laboratory. 2023 Annual Technology Baseline; Technical Report; National Renewable Energy Laboratory: Golden, CO, USA, 2023. [Google Scholar]
- EIA. Annual Energy Outlook 2023; Technical Report; U.S. Energy Information Administration (EIA): Washington, DC, USA, 2021.
- Wallace, M.; Goudarzi, L.; Callahan, K.; Wallace, R. A Review of the CO2 Pipeline Infrastructure in the U.S.; NETL: Albany, OR, USA, 2015. [Google Scholar]
- Selosse, S.; Ricci, O. Carbon capture and storage: Lessons from a storage potential and localization analysis. Appl. Energy 2017, 188, 32–44. [Google Scholar] [CrossRef]
- EIA. Monthly Energy Review; Technical Report; U.S. Energy Information Administration: Washington, DC, USA, 2022.
- Edmonds, J.; Nichols, C.; Adamantiades, M.; Bistline, J.; Huster, J.; Iyer, G.; Johnson, N.; Patel, P.; Showalter, S.; Victor, N.; et al. Could congressionally mandated incentives lead to deployment of large-scale CO2 capture, facilities for enhanced oil recovery CO2 markets and geologic CO2 storage? Energy Policy 2020, 146, 111775. [Google Scholar] [CrossRef] [PubMed]
- Gadikota, G. Carbon mineralization pathways for carbon capture, storage and utilization. Commun. Chem. 2022, 4. [Google Scholar] [CrossRef] [PubMed]
- Vasylkivska, V.; Dilmore, R.; Lackey, G.; Zhang, Y.; King, S.; Bacon, D.; Chen, B.; Mansoor, K.; Harp, D. NRAP-open-IAM: A flexible open-source integrated-assessment-model for geologic carbon storage risk assessment and management. Environ. Model. Softw. 2021, 143, 105114. [Google Scholar] [CrossRef]
- Holz, F.; Scherwath, T.; Crespo del Granado, P.; Skar, C.; Olmos, L.; Ploussard, Q.; Ramos, A.; Herbst, A. A 2050 perspective on the role for carbon capture and storage in the European power system and industry sector. Energy Econ. 2021, 104, 105631. [Google Scholar] [CrossRef]


| Model | Sectoral Coverage | CO2 Storage Representation | CTS Infrastructure Representation |
|---|---|---|---|
| NEMS | Energy system | Explicit EOR and saline storage costs, capacities, and locations | Pipelines can be built from plant locations to transshipment hubs and onward to EOR fields and saline injection terminals, all explicitly resolved. Integer decisions for pipeline diameter, site development, and injection wells. |
| US-REGEN | Energy system | State-aggregated injection cost and storage capacity | Cost of 20-mile pipeline to resource is assumed. Inter-regional pipelines can be built once in-state storage is exhausted. |
| GenX | Power | None a | None a |
| IPM | Power | Regional injection and storage cost curves for saline aquifer storage, depleted oil and gas fields, and EOR. Supply is decremented by exogenously estimated carbon capture, utilization, and storage from industrial sources. | Pipelines can be built directly from regions building CCS to regions with EOR or storage capacity, with a 100-mile minimum length. |
| Scenario | Policy | Fossil/H2/CCS | Natural Gas Price | VRE |
|---|---|---|---|---|
| No New Policy | No new policy | Moderate | Reference | Moderate |
| Net Zero | Net zero by 2050 | Moderate | Reference | Moderate |
| Net Zero, LGP, AdvCCS | Net zero by 2050 | Advanced | High Oil and Gas Supply | Moderate |
| Technology | Retrofit Cost (2020 $/MW) | FOM Increase (2020 $/MW-yr) | VOM Increase (2020 $/MWh) | Heat Rate Increase (BTU/kWh) | ||||||||
|---|---|---|---|---|---|---|---|---|---|---|---|---|
| Wtd Avg a | Lowest 25% b | Std Dev | Wtd Avg | Lowest 25% | Std Dev | Wtd Avg | Lowest 25% | Std Dev | Wtd Avg | Lowest 25% | Std Dev | |
| Coal | 2610 | 1910 | 1410 | 18.2 | 17.4 | 1.6 | – – – – 4.75 c – – – – | 4176 | 2992 | 3051 | ||
| Gas-CC-CCS | 1878 | 1457 | 973 | – – – – N/A d – – – – | 7.82 | 6.39 | 2.95 | 1630 | 1341 | 1371 | ||
| Technology | Capture Rate (%) | Capital Cost (2020 $/kW) | Fixed O&M (2020 $/kW-yr) | Variable O&M (2020 $/MWh) | Heat Rate (MMBtu/MWh) | CO2 Emissions Rate (kg/MMBtu) | ||||||||
|---|---|---|---|---|---|---|---|---|---|---|---|---|---|---|
| 2025 | 2050 | 2050 | 2025 | 2050 | 2050 | 2025 | 2050 | 2050 | 2025 | 2050 | 2050 | |||
| Mod. | Adv. | Mod. | Adv. | Mod. | Adv. | Mod. | Adv. | |||||||
| SCPC a | N/A | 2619 | 2084 | 2084 | 72 | 69 | 69 | 7.9 | 7.4 | 7.4 | 8.5 | 7.8 | 7.8 | 87.1 |
| 90 | 4579 | 3214 | 2927 | 123 | 107 | 96 | 14.4 | 12.3 | 10.8 | 10.8 | 10.0 | 9.2 | 8.7 | |
| 99 | 4795 | 3366 | 3065 | 128 | 112 | 100 | 15.3 | 13.2 | 11.6 | 11.4 | 10.5 | 9.7 | 0.1 | |
| Cofire b | N/A | 2940 | 2407 | 2407 | 79 | 76 | 76 | 7.9 | 7.4 | 7.4 | 9.0 | 8.2 | 8.2 | 86.0 |
| Gas-CC c | N/A | 961 | 748 | 715 | 27 | 25 | 23 | 1.8 | 1.6 | 1.5 | 6.4 | 6.2 | 6.1 | 52.8 |
| 90 | 2519 | 1734 | 1369 | 66 | 51 | 40 | 5.8 | 4.8 | 3.9 | 7.2 | 6.9 | 6.6 | 5.3 | |
| 97 | 2603 | 1792 | 1414 | 68 | 52 | 42 | 6.1 | 5.0 | 4.1 | 7.3 | 7.0 | 6.7 | 0.2 | |
| Gas-CT d | N/A | 850 | 664 | 634 | 22 | 20 | 18 | 4.4 | 4.0 | 3.8 | 9.7 | 9.6 | 9.5 | 53.4 |
| RE-CC e | N/A | 974 | 758 | 724 | 27 | 24 | 22 | 1.7 | 1.6 | 1.5 | 6.2 | 6.1 | 6.0 | 0.0 |
| RE-CT f | N/A | 858 | 670 | 640 | 22 | 20 | 18 | 4.4 | 4.0 | 3.8 | 9.7 | 9.6 | 9.5 | 0.0 |
| BECCS g | 90 | 5768 | 3953 | 3481 | 163 | 145 | 133 | 14.9 | 12.8 | 11.1 | 11.9 | 10.9 | 10.0 | −60.0 |
| 99 | 6000 | 4112 | 3621 | 163 | 145 | 133 | 16.0 | 13.7 | 11.9 | 12.7 | 11.6 | 10.6 | −71.2 | |
| Technology | Capital Cost (Million 2020$ /net tonne/hour) | Fixed O&M (Million 2020$ /yr-net tonne/hour) | Variable O&M (2020 $/tonne CO2) a | Conversion Rate (tonnes CO2/MWh) a | ||||||||
|---|---|---|---|---|---|---|---|---|---|---|---|---|
| 2025 | 2050 | 2050 | 2025 | 2050 | 2050 | 2025 | 2050 | 2050 | 2025 | 2050 | 2050 | |
| Mod. | Adv. | Mod. | Adv. | Mod. | Adv. | Mod. | Adv. | |||||
| Electric DAC b | 11.3 | 8.49 | 5.66 | 0.54 | 0.53 | 0.51 | 47.3 | 33.6 | 32.9 | 0.227 | 0.233 | 0.240 |
| NG DAC c | 14.8 | 11.1 | 7.4 | 0.31 | 0.31 | 0.30 | 80.8 | 60.6 | 40.3 | 0.328 | 0.335 | 0.344 |
| From Technology (Uncontrolled) | To Technology | To Capture Rate (%) | Retrofit Cost (2020 $/kW) | ||
|---|---|---|---|---|---|
| 2025 | 2050 | 2050 | |||
| Mod. | Adv. | ||||
| Coal a | SCPC | 90 | 2679 | 1177 | 1292 |
| 99 | 3129 | 1375 | 1510 | ||
| Gas-CC | Gas-CC | 90 | 2021 | 810 | 1027 |
| 97 | 2114 | 847 | 1074 | ||
| RE-CC | N/A | 487 | 362 | 379 | |
| Gas-CT | RE-CT | N/A | 425 | 317 | 332 |
Disclaimer/Publisher’s Note: The statements, opinions and data contained in all publications are solely those of the individual author(s) and contributor(s) and not of MDPI and/or the editor(s). MDPI and/or the editor(s) disclaim responsibility for any injury to people or property resulting from any ideas, methods, instructions or products referred to in the content. |
© 2024 by the authors. Licensee MDPI, Basel, Switzerland. This article is an open access article distributed under the terms and conditions of the Creative Commons Attribution (CC BY) license (https://creativecommons.org/licenses/by/4.0/).
Share and Cite
Brown, M.; Irish, M.; Steinberg, D.; Moss, T.; Cherney, D.P.; Shultz, T.; Morgan, D.; Zoelle, A.; Schmitt, T. Representing Carbon Dioxide Transport and Storage Network Investments within Power System Planning Models. Energies 2024, 17, 3780. https://doi.org/10.3390/en17153780
Brown M, Irish M, Steinberg D, Moss T, Cherney DP, Shultz T, Morgan D, Zoelle A, Schmitt T. Representing Carbon Dioxide Transport and Storage Network Investments within Power System Planning Models. Energies. 2024; 17(15):3780. https://doi.org/10.3390/en17153780
Chicago/Turabian StyleBrown, Maxwell, Matthew Irish, Daniel Steinberg, Tamar Moss, Daniel P. Cherney, Travis Shultz, David Morgan, Alexander Zoelle, and Thomas Schmitt. 2024. "Representing Carbon Dioxide Transport and Storage Network Investments within Power System Planning Models" Energies 17, no. 15: 3780. https://doi.org/10.3390/en17153780
APA StyleBrown, M., Irish, M., Steinberg, D., Moss, T., Cherney, D. P., Shultz, T., Morgan, D., Zoelle, A., & Schmitt, T. (2024). Representing Carbon Dioxide Transport and Storage Network Investments within Power System Planning Models. Energies, 17(15), 3780. https://doi.org/10.3390/en17153780


