Abstract
Cooling towers, by producing chilled water and by integration with radiant and displacement cooling systems, offer a possible alternative method for space conditioning of office buildings in temperate climates. This present study examines the operational feasibility of a cooling tower in conjunction with a radiant and displacement ventilation cooling system for office conditioning in four temperate climates. The climates are: cool and semi-humid (Birmingham, UK), cool and dry (Helsinki, FI), warm and humid (Paris, FR) and warm and dry (Prague, CZ). The system is capable of producing chilled water between 14 and 20 °C, with low approach tower temperatures (1–3 K). A mathematical model of the cooling tower system was developed and integrated with an office building energy simulation model. Using the integrated simulation model, assessment was carried out based on ASHRAE design day specifications, as well as a complete cooling seasonal analysis. Moreover, the performance of the system is benchmarked against a variable-air-volume cooling system. Energy savings for the system when benchmarked against a variable-air-volume air conditioning system, where the chiller COP (coefficient of performance) varies from 2.75 to 6.5, were 62% to 37% in Paris, 56% to 30% in Prague, 52% to 28% in Helsinki and 45% to 13% in Birmingham, respectively.
1. Introduction
Buildings are significant consumers of end-use energy worldwide. The International Energy Agency (IEA) reported in 2023 that more than 127 exajoules (1018 J), representing 30% of total global final energy usage, is consumed in the building sector [1,2,3]. In 2021, energy use in buildings increased to approximately 135 exajoules, which is 4% higher than energy demand in the building sector compared to 2020 [4]. Moreover, the associated energy end-use for the building sector corresponds to the emission of more than 10 gigatons of greenhouse gases (GHG), which is 5% greater than in 2020 [4]. Energy analysis data show that although heating energy consumption has decreased considerably as a result of improvements in building construction standards, associated cooling energy demand continues to grow because of increased internal loads due to the higher usage of electrical equipment and greater comfort demands during summer periods [1,5,6]. According to an IEA report, 16% of final electricity consumption in the building sector can be attributed to the space cooling of buildings. In 2021, space cooling demand experienced the largest increase amongst all building end use categories with a 6.5% growth in comparison to 2020 [1]. Current predictions estimate that the end-use energy consumption for building space cooling, as well as the number of air conditioning systems, will increase from 6.865 exajoules with 2.3 billion air conditioning units in 2021 to approximately 7.413 exajoules with 3.1 billion units by 2030 [4]. Consequently the space cooling of buildings is, not only from an energy consumption perspective, but also from a GHG emission perspective, an important end-use sector and consequently it requires more innovation with respect to cooling system technologies [4].
Cooling systems, organized on the basis of energy-intensity criteria, can be categorized into three broad classes as follows: passive or natural cooling (cooling loads ≤ 30–40 W·m−2), low-energy mechanical cooling (cooling loads ≤ 40–50 W·m−2) and full mechanical air conditioning (AC) cooling systems (cooling loads ≥ 50 W·m−2) [7]. Low-energy mechanical cooling systems include direct evaporative cooling (e.g., moisture pads with an air handling unit), radiant (cooling tower (CT) with a radiant cooling system (RC) or borehole heat exchanger with RC) and ventilation cooling systems [8,9]. If cooling loads are greater than the maximum cooling capacity for passive cooling (i.e., 30–40 W·m−2), then low-energy mechanical cooling could be an alternative and possibly a more efficient solution compared to full AC systems.
The selection of HVAC systems depends on a number of parameters, such as the energy demand of the system, building thermal behavior, human thermal comfort and weather conditions. As stated previously, low-energy active mechanical cooling systems offer a possible alternative method to mechanical refrigeration, especially for air conditioner (AC) cooling for commercial and institutional buildings located in moderate temperate climate conditions and where the total building gains are greater than 40 W∙m−2.
RC and displacement ventilation (DV) systems, where chilled water can be provided more efficiently than by using mechanical refrigeration AC systems, can be considered a low-mechanical-energy cooling system [9,10]. To date, some researchers have focused on the implementation of CTs as the only provider of cooling water for radiant cooling systems or displacement cooling systems [11,12,13,14,15,16,17,18]. For the aforementioned cooling systems, the CT produces a low water temperature in the range of 14–18 °C which is used for RC to offset building sensible cooling loads, and also for DV to offset building latent cooling loads.
Based on the heat exchanger surface and the cooling process of the water with the ambient air, the CT design can be specified into two main categories: open (direct) and closed (indirect) CTs. Although the design optimization of closed, wet CTs as a provider of chilled water for RCs has been investigated by some researchers [11,12,13,15], there have been limited investigations of open, wet CTs which focused on specific climate conditions with low internal loads (less than 30 W∙m−2) [14,17,19].
Costelloe and Finn designed and built a full-scale evaporative cooling system based on an indirect, open CT which incorporated a primary and secondary circuit (see Figure 1) [19]. The design utilizes an open, forced-draught, direct-contact, counter-flow system with cross-sectional dimensions of 0.9 m × 1.2 m and a height of 3.4 m [20]. The tower packing fill consisted of three sections (each of dimensions 0.9 m × 0.9 m × 0.4 m), where the fill was a plastic matrix with a surface density of 200 m2·m−3. Each section consisted of 64.8 m2 of packing surface. The tower airflow ranged from 0.8 to 2.8 m3·s−1, with a fan power demand ranging from 0.4 to 4.0 kW. The primary pump flow range was from 0.8 to 2.4 L·s−1, with an approximate power demand of between 1.9 and 2.5 kW. The tower was capable of operating over a wide range of water-to-air flow rate ratios (L/G), from 0.25 to 3.0 [20]. The key differences between the Costelloe CT and conventional CTs are as follows: (i) a low operating temperature range, from less than 24 °C to within 1 °C of the wet bulb temperature, while most conventional CTs chill water with an entry temperature in excess of 30 °C; (ii) a low approach to the ambient wet bulb temperature (to within 1 K), whereas most regular CT designs do not envisage such a small approach; (iii) a high packing surface density (200 m2·m−3); (iv) the capability of a low L/G ratio of <1.0, due to relatively high air flow rates; and (v) a relatively long residence time [21]. For this CT, it has been shown that for temperate climates, it is capable of producing cooling water at low primary-approach conditions (1–3 K), at the higher temperatures utilized by RC systems (14–16 °C) [19]. Costelloe notes that, for water supplied by an indirect RC system by means of an open, evaporative CT at temperatures of 14 °C or 16 °C, annual availability levels of 72% and 88%, respectively, are possible for Dublin, Ireland, as a northern European city, when the difference between the radiant panel supply temperature (secondary approach) and wet bulb temperature is 3 K [19,20]. It has been similarly shown for Milan, Italy, as a southern European city, that availability of 40% and 50%, for water at 14 °C and 16 °C, respectively, is also possible [19]. Furthermore, it has been indicated that the COPs of the CT, subject to ambient conditions and the percentage load, varied between 6 and 21, which are greater than the average COPs of standard air mechanical refrigeration chillers [20,22]. The typical coefficient of performance of installed systems was approximately 3.0 or lower in small chillers, and the best existing equipment could obtain a COP of 7.0 in large, water-cooled centrifugal machines [5,22]. In Costelloe and Finn [21,22], assessments were carried out based on experimental tests of the open, wet CT; nevertheless, there continues to be a lack of research concerned with the performance analysis of implementation of the novel CT system connected to DV and RC.
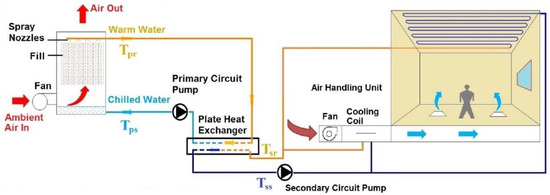
Figure 1.
Schematic of the connected aforementioned CT to DV and RC systems.
The performance of open, wet CTs in conjunction with chilled ceiling systems, using a building simulation tool (ConsoClim) [23] in three different locations in France; i.e., Trappes (close to Paris), Nice (shoreline, Mediterranean climate) and Carpentras (inland, Mediterranean climate), has been reported [14]. In this simulation study, a small office building (15 m2) was connected to the counter-flow CT. The operative temperature of the office building was presented for two solar heat gains, two internal heat gains (10 and 30 W·m−2), three cities, two orientations (west and east) and two thermal building inertia values. In their research, 80% of the ceiling area was utilized as a radiant ceiling. The simulation results show that, for Trappes, in the majority of cases, an operative temperature in the range of 25–28 °C was achievable when the maximum cooling loads were less than 80 W·m−2. For the other two cities, typically for low internal heat gains (10 W·m−2), it was possible to reach a comfortable operative temperature. The simulation results were carried out with three constant radiant panel heat transfer rates (30, 40 and 50 W·m−2), according to the performance of the surface emitter, where the temperature difference between room air and the chilled water was constant, at 6 K. In this simulation, the CT and DV fan energy consumption rates were considered constant, at 45 and 15 W, respectively [14].
Ma et al. report on a simulation analysis of an open wet CT connected to thermally activated building systems (TABS) which have embedded pipes in concrete. In this analysis, an office building with a 2880 m2 floor area for seven different US locations (Fullerton, Sacramento, Springfield, Valentine, Wilmington, Atlanta and Albuquerque) with the highest internal heat gains of 16.7 W·m−2 and the lowest level of approach temperature of 2.8 K was investigated. The results show that the CT could not provide the cooling condition for 5 days in Valentine, and 36 days in Atlanta, based on 122 days for the summer cooling period [16,17].
Nasrabadi and Finn [18] investigated the performance of a CT, which was designed by Costelloe [19] and was integrated with a displacement ventilation system and radiant cooling system (i.e., a radiant ceiling or a radiant floor) for diverse temperate climate conditions. The simulation results show that, for office occupancy periods over the corresponding cooling seasons and where a radiant floor was utilized, appropriate thermal comfort situations were provided, varying between 83.7% (of total hours) for Helsinki, 76.2% for Birmingham, 81.4% for Prague and 84.5% for Paris. Moreover, it was shown that the satisfactory thermal comfort prevailed for the integrated cooling system, varying between 67% for Helsinki, 77.6% for Birmingham, 77.6% for Prague and 80.5% for Paris where the radiant ceiling was utilized [18].
This current research is motivated by the broader research question of the constraints of an integrated open forced draught counter CT with RC and DV cooling systems for air conditioning of commercial buildings in temperate climates. According to the European weather classification which is presented in detail elsewhere, [18] utilizes the locations of Birmingham, Helsinki, Paris and Prague as representative of cool and semi-humid, cool and dry, warm and humid and warm and dry climates, respectively. In the proposed system, a CT is used to provide chilled water in the absence of a mechanical refrigeration chiller. It has been reported that CTs can provide low water temperatures between 14 and 18 °C in temperate climates, where associated COPs have been demonstrated to lie in the range from 6 to 16 [15,20,24,25,26]. Moreover, the proposed system offers an alternative method for building cooling systems in comparison to conventional mechanical cooling systems which use refrigeration chillers. Therefore, in this present paper, so as to assess the proposed concept and identify the operational limitations based on climate and building constraints, the performance of the innovative CT for producing chilled water for RC and DV in different mild weather conditions is examined and compared to a baseline cooling system. The contributions of this work include the following: (i) the development of an integrated cooling tower mathematical model with a building energy model of a radiative/displacement type cooling system for a small office building, and (ii) the assessment of the aforementioned system for four different temperate climate locations.
2. Methodology
In order to assess the effectiveness of low temperature approach direct CTs for providing high-temperature cold water for the conditioning of building spaces, two separate models, a CT model and a building energy model, were developed. The overall CT and archetype building is depicted in Figure 1. It includes a CT, which was designed and built by Costelloe and Finn [21], a RC system for space sensible cooling and a DV system for space latent cooling. The RC devices are either radiant ceiling or radiant floor devices. The building is an archetype and along with the RC and DV cooling systems is described in further detail in the following sections.
2.1. Building Model
A number of options were available for simulation of the building energy system outlined in Figure 1, including, inter alia, EnergyPlus, TRNSYS and ESPr [27,28,29]. Based on operational reasons and accessibility issues, EnergyPlus was utilized as the building energy simulation tool in this current research. EnergyPlus has the capability to simulate sub-system models such as a building envelope model, an RC model and a DV model. A comprehensive investigation was carried out by the US Department of Energy (DOE) for validation of EnergyPlus simulation results with experimental data [30]. The outcomes demonstrate that the average absolute deviation between measured data and simulation results is approximately 2.7% [30]. In this simulation tool, a thermal balance approach is applied to calculate and analyze the dynamic heat loads via opaque surfaces, total dynamic building cooling and heating loads of buildings, etc. [31]. Comprehensive analytical calculations are provided in the EnergyPlus technical reference documentation [32]. In some research, to confirm the software results, the total heat transfer rate from all heat sources is compared with the air sensible heat calculation and the results show that there is negligible difference between the two methods [18,33].
The current proposal, as outlined in this present paper, is directed to new commercial buildings subject to temperate climatic conditions, where the RC and DV systems are utilized. The proposed system serves as an alternate approach to conventional mechanical cooling systems. To examine the performance of a CT when connected to a commercial building, it is essential to create a model of the building. The US Department of Energy (DOE) has created a series of recognized commercial building benchmark models that represent the majority (70%) of the commercial buildings in the U.S. [34]. These reference buildings were provided by the DOE to serve as a common benchmark for the evaluation of various energy simulation software packages [34]. A small office building was chosen for integration with the CT system as the semi-industrial tower designed by Costelloe has a cooling capacity of 24 kW [20], which from a design perspective is capable of offsetting the cooling load of the proposed office building. Figure 2 depicts the small office building that is used in this work. The building contains five zones and the net total floor surface area is approximately 511 m2. In Figure 2b, the office layout is shown with different zone names. A detailed presentation of the building zone specification, window–wall ratio is available elsewhere [18]. The building construction is described in detail in Appendix A.
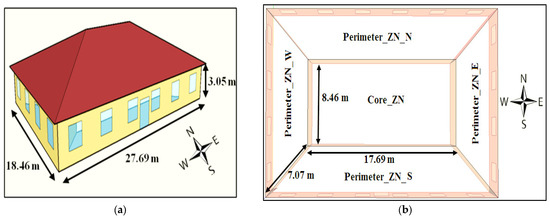
Figure 2.
Schematic representation of the small office building showing (a) an exterior view, and (b) an interior view with zone names.
2.1.1. External Heat Gains
Thermal loads associated with a building arising from ambient conditions (temperature, humidity, solar radiation and wind) are known as external loads. External cooling loads are determined by calculating the heat transfer rate through the building envelope and are influenced by the ratio between the window and floor surface area and the type of shading system which is used in the building [5]. Weather files are used by EnergyPlus to estimate the external loads on the building [35]. A full year of hourly data representative of a typical year according to the International Weather for Energy Calculations (IWEC) weather files approach were utilized in this research [36]. The IWEC data are a collection of weather observations that are captured at least four times daily for at least 12 years, and in many cases, up to 25 years [37].
As the reference test building model did not have any window solar shading devices and the design cooling capacity of the CT used in the current research is limited to 24 kW, solar shading devices are included in the building model in order to minimize the effect of solar radiation as an external load source. Amongst fixed external shading types available in EnergyPlus, Surrounding Shading was selected based on the annual energy required (heating, cooling and lighting energy needs) for thermal comfort conditioning of an office building [38]. In order to calculate the depth of the surrounding shading, the vertical shadow angle (VSA) was measured for each location at midday for a summer design day. As shown in Figure 3a, the depth of shading is estimated to be 1.26 m based on window height (1.52 m) and VSA angle. Figure 3b illustrates the office building utilized in this current research with the chosen window shading.
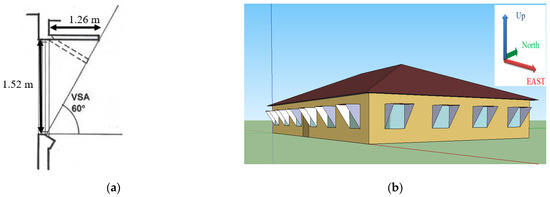
Figure 3.
Surrounding shading (a) shading specification (b) office building with surrounding shadings.
2.1.2. Internal Heat Gains
As well as the external loads, internal loads affect the heat balance of the building. Office equipment, occupants and lighting are the sources of these loads. In EnergyPlus, it is possible to schedule these loads for every hour for each zone. In the current simulation, it is assumed for the office occupancy periods (8.00 am till 5.00 pm) that all internal loads are applicable. The total estimated gains for office equipment, occupants and lighting in this investigation are 66 W·m−2, according to an extensive analysis provided elsewhere [18].
2.1.3. Radiant Cooling (RC) Model
Radiant floor and radiant ceiling (RC) systems are used as a sensible cooling system in this research. Although radiant floor systems can potentially cover the complete floor, arising from lighting and safety equipment constraints, the whole ceiling cannot be used for RC. The ratios of available radiant ceiling area per ceiling area in different investigations typically vary from 50 to 80% [2,14,39,40,41,42]. Kosenen et al. note that the maximum ratio for the radiant ceiling is approximately 80% of ceiling area [42]. Consequently 70% is used in this study for the radiant ceiling system area relative to the total ceiling area.
In the radiant panel model, the inside tube diameter and spacing was assumed to be 14 mm and 150 mm, respectively, according to the standard design of radiant panels for both the radiant ceiling and radiant floor system [43]. Considering tube spacing and zone surface area (ceiling or floor), the required hydronic tubing length for each zone is calculated. The control is accomplished by operative temperature of each zone. In EnergyPlus, the circulating chilled water in the RC system is controlled by the zone cooling set-point temperature. In this model, the cooling control temperature is accomplished by the operative temperature of each zone. In the RC system, the operative temperature is given as the average of mean zone air temperature and mean zone radiant temperature, as in Equation (1) [35]. Consequently, for each zone, if the operative temperature is higher than the cooling set-point temperature, the chilled water circulates in the zone radiant panel.
Toperative = 0.5 × T(air zone, mean) + 0.5 × T(mean radiant temperature, zone)
As was shown in Figure 1, the secondary circuit pump circulates the chilled water for the RC system. Since the operation of the RC system is related to the operative temperature, this pump is modelled as a variable speed pump. The secondary water design flow rate was set to 1.6 kg∙s−1 which is according to the Costelloe design for a secondary path and representative mass flow rates that are implemented for RC systems [24,44]. In this study, the maximum mass flow rate for the RC system of each zone was 0.25 kg∙s−1 and the maximum mass flow rate of the cooling coil of the DV system was 0.35 kg∙s−1. In EnergyPlus, the pump was modeled based on the ASHRAE HVAC toolkit [32], which represents current practice in pump technology. Power consumption is calculated in EnergyPlus according to water flow rate and pump head. The pump head is estimated based on the pressure drop of water in the RC system [43,45].
2.1.4. Condensation Control Type
Condensation can occur on the cooled surface if radiant cooling systems are used, since the surface temperature may drop below the dew-point temperature of the space. In EnergyPlus, two control types are considered for control of this condition, including Off and SimpleOff. If the Off controller was chosen, when condensation is predicted, EnergyPlus sends a warning message, and the program will continue to execute without any further action; moisture will not be removed from the zone air and there will be no surface temperature adjustment due to condensation. If the SimpleOff opportunity is chosen to prevent condensation, the program will shut off the radiant system when condensation is predicted to occur. The SimpleOff strategy is used by EnergyPlus when this parameter is not specified. In this current study, the SimpleOff controller was selected to avoid condensation on cooled surfaces.
2.1.5. Ventilation and Infiltration
In order to provide adequate ventilation for the occupants, a displacement ventilation (DV) system is used in the building model. As in the integrated cooling system, the RC system is assumed to be the main space cooling system, DV is used to provide the fresh air ventilation requirement and as an auxiliary cooling system. Consequently, during occupied hours, ventilation is estimated as 0.255 m3·s−1, based on the minimum ventilation rate of ASHRAE Standard 62.1 [46]. During unoccupied times, ventilation is set to zero, assuming that DV does not operate when the building is empty. As infiltration is mainly affected by the building design, the default value of the reference building model does not change. Infiltration is assumed to be 0.36 ACH, which is in the acceptable range (0.3–0.45) on the basis of the appropriate CIBSE standard [47].
2.2. Cooling Tower Model
For the integrated system model, the mathematical model of the CT is an essential and important component. The CT mathematical model is not only a CT model but is also a component of an integrated mathematical model of a building space conditioning system that incorporates a specially designed CT for this specific application. Consequently, the CT mathematical model, in order to integrate to a building simulation application, should display acceptable accuracy but with limited complexity.
The aforementioned CT system, described by Costelloe [21], is a design prototype system that has been integrated with the RC and DV components and operates subject to different ambient boundary conditions—compared to conventional CTs—as outlined in Section 1.
To date, there has been a lack of evaluation that considers the connection of an open direct contact CT with a DV and RC cooling system for conditioning building spaces [14,17]. Since there is lack of research concerned with the improvement of the aforementioned CT model that could be compatible with building energy simulation software, this current research involved developing a mathematical model of the tower.
The comprehensive scientific model of the CT is presented elsewhere [48]. It is shown that in the present CT scientific model, the CT coefficient is calculated as a function of water and air flow rates, based on the prior experimental work of Costelloe and Finn, and can be expressed as in Equation (2) [21]:
where mw and ma are mass flow rate of water and air, respectively, in the CT. The other relations which are presented by Bernier et al. for wet CT coefficients can be expressed in Equations (3) and (4) [48] as follows:
Me = 1.3 × (mw/ma)^(−0.77)
KaV/L = 1.42 × (mw/ma)^(−0.43)
KaV/L = 1.3 × (mw/ma)^(−0.6)
The detailed mathematical model for the calculation of parameters such as heat transfer and water outlet temperature is described elsewhere [48]. The CT model validation against experimental data shows that the maximum discrepancy in estimating water outlet temperature is less than 2.5% [48]. Moreover, the mathematical results show that the CT coefficient provided by Costelloe give more accurate results compared to other correlations, especially when the mass flow rate of water is lower than the mass flow of air (mw/ma < 0.7) [48].
The capability of the CT to provide high-temperature chilled water under different mild weather and operational conditions can be evaluated by utilizing the mathematical model [49]. It is shown that the tower is effective for circumstances where the humidity ratio ≤ 12 g∙kg−1 and where the ambient temperature is less than 28 °C [49].
2.3. Integrated Model
In order to examine the suggested cooling system, the CT model needed to be connected to the building model. By integrating the CT model into the building energy simulation model, the cooling system can be assessed in a dynamic and real time manner for diverse weather conditions. The CT system model is implemented in MATLAB and integrated with EnergyPlus using the Building Controls Virtual Test Bed (BCVTB). In order to transfer data to the BCVTB, some adjustments had to be undertaken on both the cooling system and building models. The detailed information is outlined elsewhere [18].
2.4. Benchmark Cooling System
Since variable-air-volume (VAV) systems are known to be generally more efficient and the most commonly installed HVAC system in comparison to other types of HVAC systems [50,51], a VAV system was utilized as a benchmark to the proposed cooling system developed in this research. As shown in Figure 4, a VAV system normally consists of three main subsystems: a cooling plant, a heating plant and an air handling system. The cooling plant often involves a CT, a chiller and cooling water pumps which provide chilled water for the VAV system. A boiler is often used for the provision of heating during the winter period. As the standard HVAC system is used for both the cooling and heating season, the boiler provides hot water for heating to provide reheat in cooling mode and to warm air in heating mode. The air handling unit which supplies fresh air for occupants includes a cooling coil, a heating coil and a fan. The details of all components are described in further detail elsewhere [52].
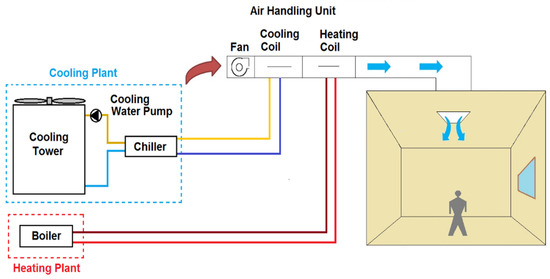
Figure 4.
Schematic diagram of components in VAV air conditioning system.
3. System Performance Assessment
This section outlines system level results based on the connection of the CT model (MATLAB) with a building energy simulation model (EnergyPlus) of the office building. This allows the integrated cooling system (the CT with RC and DV) performance to be evaluated in different temperate climates for an ASHRAE design day specification, as well as for a summer seasonal analysis. The seasonal period includes all working days from 8.00 am until 5.00 pm from 1 May until 30 September. The analysis is based on ten minute simulation steps over the cooling season for the four aforementioned locations. The results are benchmarked with the results of variable-air-volume cooling system as a baseline cooling system for the different temperate climates with regard to thermal comfort and energy utilization and assessment. These comparisons provide an insight into understanding if the proposed cooling system could be considered as an alternative possible cooling system to mechanical vapor compression systems.
Radiant cooling panels can generally be categorized according to ceiling and floor radiant systems. In the current study, the RC system was controlled by the zone cooling set-point temperature, which means that, whenever the operative temperature was greater than the cooling set-point, chilled water was circulated through the RC panels. A comprehensive sensitivity analysis of a radiant floor and a radiant ceiling at two different operative set-point temperatures was undertaken for Paris and Helsinki during July to select the suitable set-point temperature for RC panels; for further analysis the results are presented in detail elsewhere [18]. The results indicated that according to energy consumption and thermal comfort outlook, an appropriate set-point temperature for a radiant ceiling and floor would be 20 °C and 22 °C, respectively [18].
3.1. Design Day Analysis
Proficiency assessment of the integrated cooling system was performed for the four European cities, as four representatives of temperate climate types, on a design day basis, using 10 min simulation intervals. The coefficient of performance (COP) of the CT can be written as follows:
where and are the power consumption of the tower fan and primary pump and , as given by Equation (6).
where is the water flow rate in the primary circuit and as it is shown in Figure 1, and are, respectively, the return and supply water temperatures in the primary circuit. Considering the overall integrated cooling system, Equation (5) can be extended as follows:
where and are the power consumption of the DV fan and secondary pump, respectively, and , according to Equation (8), is the heat transfer rate related to water in the secondary circuit of the integrated cooling system.
where is the water flow rate in the secondary circuit and as it is presented in Figure 1, and and are the return and supply water temperatures, respectively.
According to ASHRAE 1% annual design data [31], the performance of the connected cooling system subject to the highest design situations is analyzed for each city in the following sub-sections. In the CT which is investigated in this present study, for a tower water flux of 1.7 kg∙s−1∙m−2, the packing surface was fully wet, and further increases in water flow rate resulted in an increase in the water surface film thickness, with no advantages to the cooling tower heat transfer regime [24]. Consequently, it was discovered that the best performance of the tower occurred at a tower water flux of 1.7 kg∙s−1∙m−2, which is equal to the tower water flow rate of 1.4 kg∙s−1 [24]. The secondary water flow rate was found to be 1.6 kg∙s−1 which is set according to the Costelloe design [24]. A summary of the boundary conditions which were applied for the four office building locations is given in Table 1. The integrated cooling system dependent variables included the tower outlet water temperature, the secondary supply water temperature, the cooling system cooling capacity, the PMV index and the tower and cooling system coefficient of performance.

Table 1.
Boundary conditions—summary.
3.1.1. Helsinki
An analysis for Helsinki, as a representative of a cool and dry climate, is carried out in this section. Figure 5 shows weather data for a 24 h design day analysis with a primary and secondary water supply and a return temperature. As a way to examine the integrated system performance, the weather data presented in Figure 5 were used in both the building model and the mathematical model of the CT for each simulated interval. Considering Figure 5, it can be observed that the primary water supply temperatures (Tps) for both the radiant floor and ceiling systems were very similar, and they closely track the wet bulb temperature; thus, the primary approach temperature was nearly constant. Considering Figure 6, it can be seen that between 0.00 h and 8.00 h, the operative temperatures were less than the set-point cooling temperatures, and, consequently, during these periods the primary and secondary pumps were switched off and the water flow rates were zero. Moreover, it is assumed that there is no associated cooling load for the cooling system during this period. According to Figure 7, the heat transfer rates for both radiant panels increased significantly from 8.00 h to 14.00 h, due to the presence of an internal load, and after 14.00 h, they rose moderately. It can be seen that, whenever the operative temperatures were higher than the set-point temperatures, the integrated cooling system operated, and as soon as the operative temperatures reached the set-point cooling temperatures, the cooling system would switch off, resulting in no cooling tower heat rejection. Furthermore, significant behavioral variations are observed upon circulation pump start-up, most likely attributable to system transients. It should be noted that the controllers in each zone work independently from each other and thus would affect water flow rate in the secondary circuit. For this reason, it can be seen when the operative temperatures in some zones are higher than the set-point temperature, whereas the operative temperatures in other zones are less than the set-point temperature; thus, the maximum water flow rate in the secondary circuit is less than 1.6 kg∙s−1.
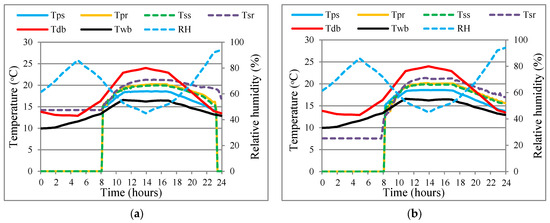
Figure 5.
Primary and secondary information for Helsinki design day study for (a) a radiant floor and (b) a radiant ceiling.
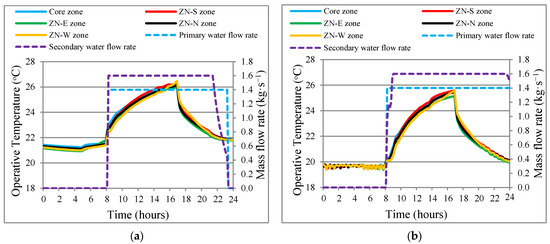
Figure 6.
Operative temperature in different building zones with primary and secondary water flows for Helsinki design day study: (a) a radiant floor and (b) a radiant ceiling.
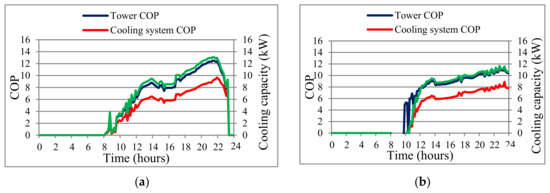
Figure 7.
Tower COP, cooling system COP and cooling capacity of the connected CT with RC and DV: Helsinki design day study in (a) a radiant floor and (b) a radiant ceiling.
3.1.2. Birmingham
A sensitivity assessment for Birmingham, as a representative of a cool and damp (semi-humid) climate, is presented in this section. In Figure 8, it can be observed that, for both RC panels, the primary and secondary chilled water temperatures tracked the wet bulb temperature closely. Considering Figure 9a, it can be observed that the operative temperatures in all zones during the period 3.00 to 8.00 h were less than 22 °C, which was the set-point cooling temperature. As a result, the water pumps were switched off during this time. Figure 9b shows that, during the period 3.00 to 8.00 h, the secondary water flow rate decreased since the operative temperatures approached the set-point cooling temperature. As a result of the internal load, after 8.00 h, the operative temperature increased significantly, and the secondary pump operated at the maximum water flow rate (1.6 kg·s−1). Figure 10 presents the cooling heat capacity with the tower and the cooling system for the two types of radiant panels. As shown in Figure 10a, the heat transfer rate fell significantly during the period 0.00 to 3.00 h. After this period, the cooling system did not operate until 8.00 h, when the internal loads were applied in the building. On the contrary, as presented in Figure 10b, the cooling capacity of the integrated system decreased gradually from 15 kW to 6 kW during the period 0.00 to 8.00 h. It can be observed that, after implementation of internal loads, the cooling capacity rose from 8 kW to approximately 12 kW until 17.00 h. Although, as a result of the decrease in operative temperatures, the heat transfer rate declined after 17.00 h, it increased due to better cooling performance during the night.
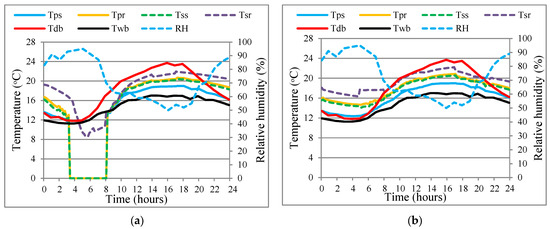
Figure 8.
Primary and secondary information for connected cooling systems for a Birmingham design day for (a) a radiant floor and (b) a radiant ceiling.
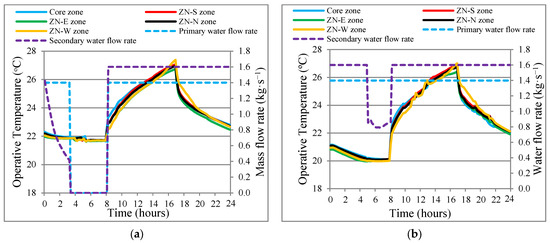
Figure 9.
Operative temperature in different building zones with primary and secondary water flow for the Birmingham design day study for (a) a radiant floor and (b) a radiant ceiling.
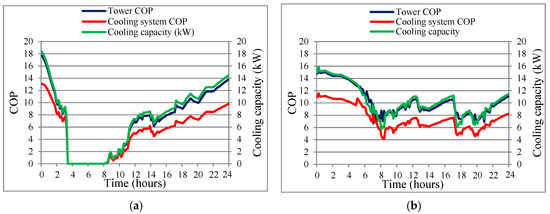
Figure 10.
Tower COP, cooling system COP and cooling capacity of the connected CT with RC and DV for the Birmingham design day study for (a) a radiant floor and (b) a radiant ceiling.
3.1.3. Prague
A sensitivity assessment for Prague, as illustrative of a warm and dry climate, is carried out in this section. Considering Figure 11, it can be observed that primary and secondary supply water temperatures exhibited similar trends for both radiant floor and ceiling conditions during periods when the system was operational. Considering Figure 12, it can be observed that operative temperatures for all zones for the radiant floor and radiant ceiling during the period 2.00–8.00 h and 4.00–8.00 h, respectively, were less than the defined cooling set-point temperatures. Therefore, as shown in Figure 12, the primary and secondary water flow rates were zero during these periods. Since the secondary pump is a variable water flow rate unit, whenever the operative temperature reached the set-point temperature, the water flow decreased, as illustrated in Figure 12. Referring to Figure 13, it is shown that the cooling capacity of the cooling system increased gradually during working hours, while this increase during the 16.00 to 18.00 h period is more obvious due to the decline in the ambient dry bulb temperature. As shown in Figure 13, after 18.00 h, the heat transfer rate of the cooling system decreased as a result of the absence of internal loads and also the decline in operative temperatures. It can also be observed that the COP of the cooling system followed the same trend presented for the cooling system capacity.
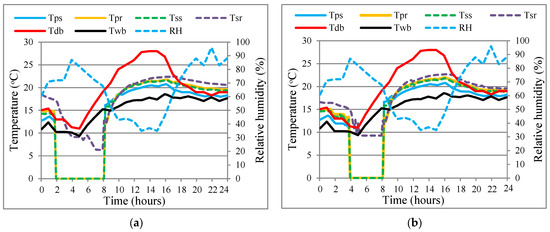
Figure 11.
Primary and secondary information for the connected cooling system for the Prague design day study for (a) a radiant floor and (b) a radiant ceiling.
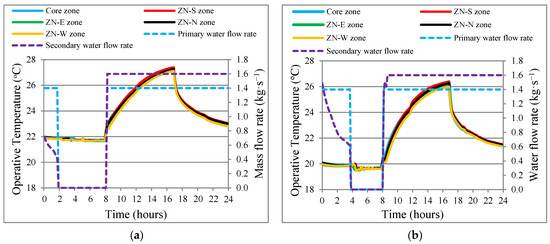
Figure 12.
Operative temperature in different building zones with primary and secondary water flow for the Prague design day study for (a) a radiant floor and (b) a radiant ceiling.
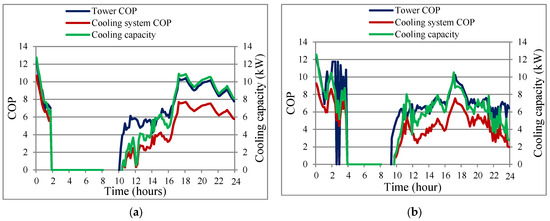
Figure 13.
Tower COP, cooling system COP and cooling capacity of the connected CT with RC and DV for the Prague design day study for (a) a radiant floor and (b) a radiant ceiling.
3.1.4. Paris
A sensitivity assessment for Paris, as an illustrative location of a warm and more humid climate, for a summer design day analysis is considered in this section. Considering Figure 14, the primary and secondary supply water temperatures tracked the wet bulb temperature closely. It can be observed that the minimum and maximum primary supply water temperature (Tps) values over the 24 h period were 17 and 21.3 °C, respectively. Considering Figure 15, it is presented that, for all zones, the operative temperatures varied considerably over the working hours, due to the presence of internal loads. It can be observed that the operative temperature for all zones tracked similar trends for most of the cooling period. It can be observed that, due to solar effects, the operative temperatures of the ZN-E zone (east zone) and ZN-W zone (west zone) were greater than other operative temperatures during the 6.00–10.00 h and 16.00–20.00 h periods, respectively. Generally, it is shown that the operative temperature for the radiant ceiling was approximately 2 °C less than the radiant floor. Examining Figure 16, it is presented that the radiant floor panel transfer exhibited greater heat transfer (cooling) capabilities in comparison to the radiant ceiling panel. Moreover, the maximum heat transfer rate for the radiant floor and ceiling were approximately 15 and 12 kW, respectively. It can also be observed that, as a result of the high ambient relative humidity and low temperature discrepancy between the operative and set-point temperatures, the heat transfer rate decreased during the period between 4.00 and 8.00 h (see Figure 15). Considering Figure 16, due to the higher heat transfer rate in the radiant floor panel compared to the radiant ceiling, the performance of the CT and the cooling system for the radiant floor system was greater than that for the radiant ceiling. It is shown that the maximum COPs of the integrated system in the radiant floor and ceiling were 15 and 9, respectively.
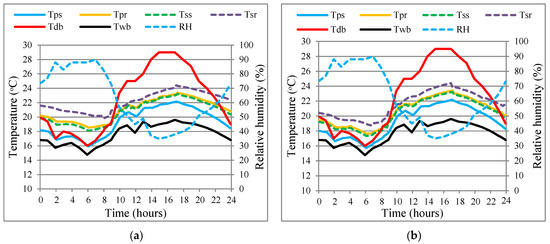
Figure 14.
Primary and secondary information of connected cooling system analysis for the Paris design day for (a) a radiant floor and (b) a radiant ceiling.
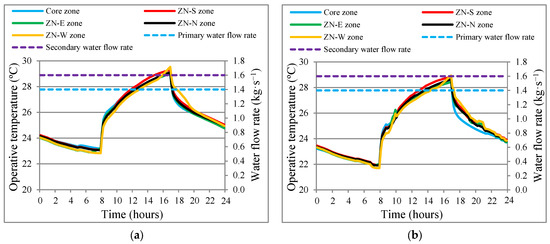
Figure 15.
Operative temperature in different building zones with primary and secondary water flow for the Paris design day study for (a) a radiant floor and (b) a radiant ceiling.
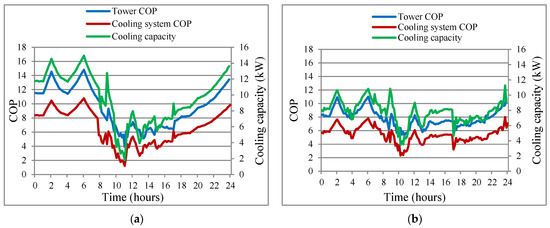
Figure 16.
Tower COP, cooling system COP and cooling capacity of the connected CT with RC and DV for the Paris design day study for (a) a radiant floor and (b) a radiant ceiling.
Considering the cooling capacity and coefficient of performance of the connected cooling system, according to a 24 h summer design period, a radiant floor presents better performance compared to a radiant ceiling, yet it is shown that, for all cities, these parameters during working hours (8.00 to 17.00 h) were greater in a radiant ceiling compared to the radiant floor type. Therefore, deployment of a radiant ceiling can maintain lower operative temperatures compared to a radiant floor. On the other hand, since a part of the load has been shifted to the evening and night in the utilization of a radiant floor cooling panel, the cooling capacity of the tower, and consequently the cooling capacity of the connected system, increased during this period. Since the performance of the integrated cooling system was examined only for summer design days, the lack of assessment on other summer days necessitated a seasonal analysis of the connected cooling system in different mild climates, which is described in the following section.
3.2. Seasonal and Thermal Comfort Analysis
Using weather data for a full summer season, the integrated cooling system was examined, in view of energy utilization and thermal comfort criteria. The boundary conditions summarized in Table 1 were utilized for the assessment, which is based on analysis at 10 min intervals over the period 1 May to 30 September. Consequently, 21,888 data points were used for the preparation of each graph.
Thermal comfort is frequently estimated using the PMV index based on the Fanger comfort model [18,52]. The PMV index is influenced by several parameters such as air temperature, mean radiant temperature, relative humidity, air speed, metabolic rate and clothing insulation [31]. In determining the PMV, EnergyPlus estimates the mean radiant temperature on the basis of one of three methods: the Zone-Averaged (ZA) method, Surface-Weighted (SW) method and Angle-Factor (AF) method [53]. Although the mean radiant temperature can be estimated by the ZA method as a zone-weighted average temperature based on the center of the zone, the mean radiant temperature can also be calculated by SW method on the basis of the closest surface temperature to the person. In the AF method, the angle factor between a person and each surface is considered [53].
In the current work, the analysis was carried out for the building core zone where no significant surface temperature asymmetries were present. Accordingly, there is unlikely to be significant discrepancies between the ZA and AF methods in the estimation of the mean radiant temperature [53]. On this basis, the ZA method was utilized for the calculation of the zone mean radiant temperature.
Thermal Comfort Results
Thermal comfort examinations for four different mild weather conditions are illustrated in the present section. Due to the large quantity of data utilized, the results are presented in carpet-plot graphs.
Considering Figure 17, using the cooling system for the first two weeks of May, over-cooling is evident for Paris, since, during working days from 8.00 to 12.00 h, the PMV index was less than −1.0. It can be seen that, during occupancy periods, generally, the PMV index was greater where a radiant floor was used, compared to using a radiant ceiling panel. In addition, as shown in Figure 17a, for only five days in July and three days in August during 12.00 to 17.00 h, the PMV index was greater than 1.0. In Figure 17b, it can be observed that for three days in July and one day in August, the PMV index was greater than 1.0. On the contrary, the PMV index of the radiant ceiling at 8.00 to 9.00 h was less than −1.0, and this is deemed to be outside acceptable thermal comfort conditions.
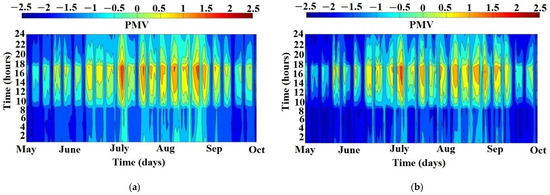
Figure 17.
Seasonal PMV assessment in Paris for (a) a radiant floor and (b) a radiant ceiling.
Referring to Figure 18, it is shown that, although in Prague, where a radiant ceiling was effective for two days in July during 14.00 to 17.00 h, for conditions where the PMV was greater than 1.0 and where the radiant floor was used, the numbers of days in which the PMV index was greater than 1.0 increased, especially in July and August, during the 12.00–17.00 h period. In comparison, from Figure 18a,b, it can be seen that the radiant ceiling was more successful in the provision of satisfactory thermal comfort during warmer days in July and August compared to the radiant floor. It can also be observed that the radiant ceiling over-cools during the period 8.00 to 10.00 h in May and September.
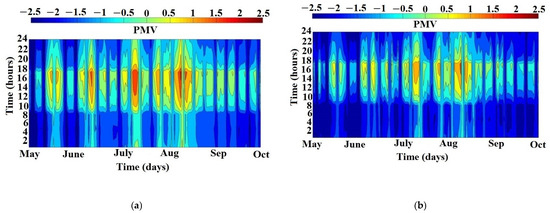
Figure 18.
Seasonal PMV assessment in Prague for (a) a radiant floor and (b) a radiant ceiling.
Figure 19 presents a seasonal thermal comfort assessment for Helsinki, as a representative of a cool and dry climate. For some days in May and September during the occupant periods, the PMV was less than −1.0, especially where a radiant ceiling was used. Since the set-point temperature in a radiant ceiling (20 °C) is less than that of a radiant floor (22 °C), during cooler days in May and September, the radiant ceiling resulted in over-cooling. Comparing the two different kinds of radiant panels, for Helsinki, the radiant floor can provide more comfortable periods compared to a radiant ceiling, mainly during May and September. As shown in Helsinki, the maximum PMV index where the radiant floor was used was less than 0.7.
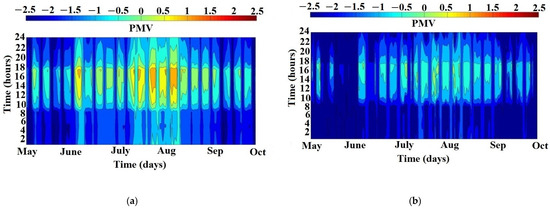
Figure 19.
Seasonal PMV assessment in Helsinki for (a) a radiant floor and (b) a radiant ceiling.
Figure 20 shows the thermal comfort assessment in Birmingham. Both radiant cooling panels provided negative PMV values during May and September, especially in the morning, between 8.00 and 12.00 h, due to low ambient air temperatures. Ambient dry bulb temperatures in May and September, for most of the time, were less than 20 °C. As shown in Figure 20, although there was not a huge difference between the two radiant panels in the provision of thermal comfort, the radiant ceiling provides better thermal comfort in July and August, in comparison to a radiant floor. As the zone mean operative temperatures in May and the first week of June were less than 22 °C, where the CT integrated with the radiant floor and DV, the CT and the pumps were not operational during this period, whereas the DV fan was required to be operational.
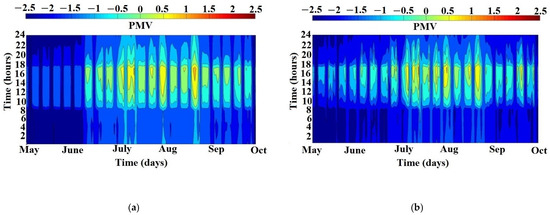
Figure 20.
Seasonal PMV assessment in Birmingham for (a) a radiant floor and (b) a radiant ceiling.
Considering a thermal comfort perspective, although the radiant ceiling, during warmer periods, operated better than the radiant floor in Paris and Prague, generally, the radiant floor provided better thermal comfort conditions compared to the radiant ceiling for the cooler locations (Birmingham and Helsinki), especially in the mornings. Moreover, it can be observed that the suggested cooling system in both types of radiant cooling panels can provide acceptable thermal comfort for the majority of occupancy hours.
3.3. Energy Utilization Results
The overall energy utilization of the connected cooling system is examined in this section. The overall energy utilization is estimated based on the energy consumption including the primary and secondary pumps, and the CT and DV fans for the period 1 May–30 September for the four city case studies. In the current investigation, the set-point operative temperatures for the radiant ceiling and floor were 20 and 22 °C, respectively, as outlined in Section 3. The outcomes are summarized in Table 2, and are presented in Figure 21. For each case city study, the energy consumption of the radiant floor is lower than a radiant ceiling, because of the lower set-point temperature. As can be observed, the overall energy utilization of the radiant floor in Birmingham was significantly less than in the other cases, since the operative temperatures in different zones during May and the first week of June were lower than 22 °C and greater than 20 °C. Consequently, the CT and primary and secondary pumps did not run during the above-mentioned periods, and only the DV fan was utilized throughout the occupancy periods in Birmingham, where the radiant floor was used. On the contrary, in Paris, where a radiant ceiling was utilized, as the operative temperatures in different zones were greater than the cooling set-point temperature, the cooling system operated for whole working days, mainly in July. It is evident in Table 2 and Figure 21 that the greatest energy consumption per floor area pertained to Paris with 5.9 kWh·m−2, where the radiant ceiling was utilized, and the lowest energy consumption per floor area was evident for Birmingham with 3.5 kWh·m−2, where the radiant floor was utilized. Recently measured energy consumption shows that the annual cooling energy consumption for moderate European climates is typically between 30 and 60 kWh·m−2 with annual best practice consumption levels in office buildings of 35 kWh·m−2 [5]. According to a Building Research Establishment (BRE) report for existing office buildings in the UK, the annual cooling energy consumption is in the range of 31 to 41 kWh·m−2, although for new offices this energy consumption could decrease to 9 kWh·m−2 [54].

Table 2.
Energy utilization of the connected cooling system in diverse climate categorizations.
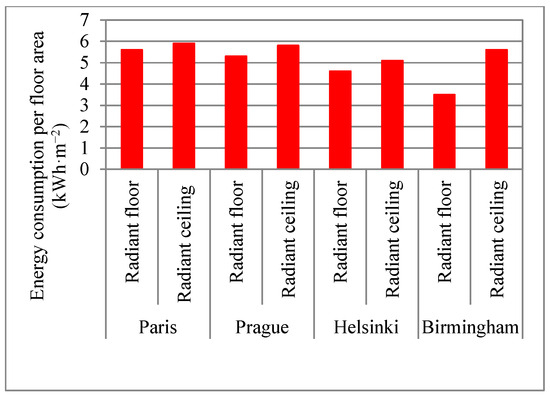
Figure 21.
Total energy consumption per floor area of the cooling system for the four considered cities.
In view of the whole-season assessment, it can be observed that, although the performance of the radiant floor was mostly better than the radiant ceiling, except during certain days where the PMV values were exceeded during periods in July and August, radiant panels can provide comfortable thermal comfort situations for the majority of occupancy periods. It can be seen that, although the total energy consumption of the two different types of radiant panels are close, the energy consumption of a radiant ceiling is higher than that of a radiant floor, because of its lower set-point temperature.
3.4. System Performance
The system performance factor (SPF) can be defined in the most general way, for this research, as the ratio of cooling delivered to the building by the cooling system to the electrical input over the cooling season, as in Equation (9). The power consumption can be considered for the CT alone (SPF1) or the connected cooling system (SPF2). The use of different SPFs allows the performance analysis of different parts of a cooling system. While the power consumption of the SPF1 includes the energy utilization of the CT fan and the primary pump (Equation (10)), the SPF2 involves the energy utilization of all equipment used in the cooling system (Equation (11)). The SPF assessments for the integrated cooling system with the two types of radiant panels in four temperate climate types are summarized and presented in Table 3 and Figure 22. For each city, the SPFs for the radiant floor were greater than those for the radiant ceiling. It can be seen that, for all simulations, the maximum and minimum values of the SPF in the same category are for Helsinki and Paris, respectively.

Table 3.
SPF analysis of the connected cooling system for the four mild climate categories.
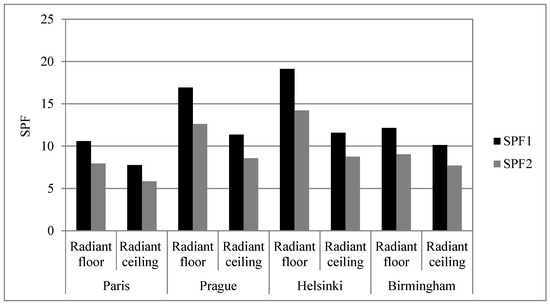
Figure 22.
SPF analysis of the connected cooling system in the four mild climate categories.
Although as evident in Table 2, for the radiant ceiling cooling system where the total energy utilization for Paris and Prague were each approximately 3000 kWh, it can be seen in Figure 22 that SPF1 (11.37) and SPF2 (8.58) in Prague were greater than the respective values (7.77 and 5.85) for Paris. The reason for this is because the cooling tower can reject more heat in Prague, as a representative city for a warm and dry climate, in comparison to Paris, as a representative of warm and humid conditions. It can be observed that the highest performance factors (19 for SPF1, and 14 for SPF2) can be attributed to Helsinki, where a radiant floor was utilized with a CT and DV.
4. Baseline Cooling System Analysis
As described in Section 2.4, a variable-air-volume (VAV) system is considered as a baseline mechanical refrigeration cooling system as shown in Figure 4. This system is comprised of a cooling plant, a heating plant and an air handling system. In this system, a vapor-compression chiller provides chilled water for the cooling coil of the VAV. Further details of the baseline cooling system and chiller model are described elsewhere [52]. The COPs of vapor-compression chillers range from 2.5 to 7.9, and vary in capacity from small air-cooled systems (6 kW) to large centrifugal chillers (35 MW) [10]. ASHRAE reports that the COPs of water-cooled, electrically operated, centrifugal chillers range from 5.0, with a cooling capacity of 528 kW, to 6.1, with a cooling capacity of 1055 kW [55]. Although the COP and cooling capacity of the selected chiller were 2.75 and 25 kW, in order to demonstrate knowledge and insight into conventional mechanical refrigeration systems, the COP of the chiller was considered with different COP values from 2.75 to 6.5. The minimum cooling set-point temperature for an office building in Japan was set to 28°C, in order to decrease the energy consumption of air conditioning systems [56]. Other countries, such as the UK, follow a similar policy by increasing the cooling set-point temperature for office buildings from the previously recommended 22 ± 2°C to 24 ± 2°C [57]. Consequently, 24°C is considered the cooling set-point temperature of the baseline cooling system. The performance of the baseline cooling system has been assessed in the following subsections: thermal comfort analysis, energy consumption and system performance assessments.
4.1. Thermal Comfort Analysis
The thermal comfort of the baseline cooling system was assessed for the core zone for the four cities, as shown in Figure 23. It can be observed that the PMV for the baseline cooling system mostly varied between ±0.5 for the different climate types. In addition, while the PMV index of the baseline cooling system throughout the hottest months of the year (i.e., June, July and August) at the beginning of occupancy periods, especially between 8 and 9 am, was less than zero; for the remaining hours, the PMV index was between 0 and 0.5.
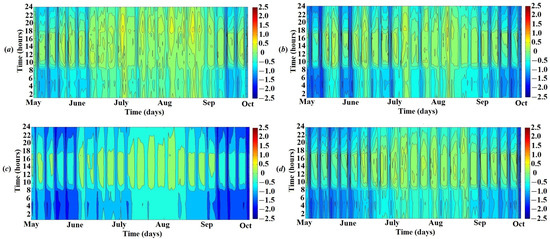
Figure 23.
Seasonal PMV analysis for VAV baseline system for (a) Paris, (b) Prague, (c) Helsinki and (d) Birmingham.
4.2. Energy Consumption
In order to analyze the energy consumption of the two radiant cooling systems with the baseline cooling system, the energy consumption of these systems were measured for the period 1 May to 30 September. As the energy consumption of the baseline cooling system was highly dependent on the coefficient performance of the chiller, the total energy consumption of the baseline was estimated assuming different chiller COPs, as presented in Table 4 and Figure 24. Figure 1 shows the total energy consumption for the proposed cooling system and includes the energy consumption of the CT primary and secondary pumps, the CT fan and the DV fan. On the contrary, it can be observed from Figure 4 that the total energy consumption of the baseline cooling system includes the energy consumption of the compressor, the boiler, the CT fan, the air handling unit fan and the internal circulation pumps. Since, for similar boundary conditions, the average COPs of commercial chillers are generally in the range of 2.5 to 6.5, an assessment was carried out in this range [10,24]. The aforementioned chiller COP was defined for chiller reference conditions, where the building chilled supply and return water temperatures were 6.7 and 16.7 °C, respectively. Consequently, during the working periods of the baseline system, the chiller COP varied with the ambient boundary conditions. Examining Table 4, at each specific chiller COP, the maximum and minimum energy consumption of the baseline cooling system pertained to Paris and Helsinki, respectively. Considering Figure 24, it can be seen that, based on the chiller COP and climate type, the cooling energy consumption per square meter of the baseline cooling system varied from 6.4 kWh·m−2 in Helsinki with a chiller COP of 6.5 to approximately 15 kWh·m−2 in Paris, with a chiller COP of 2.75. It has been reported that the benchmarked annual cooling energy use per square meter of VAV air conditioning with air-cooled water chillers for a newly designed air-conditioned office building is approximately 37.6 to 103.9 kWh·m−2 [58].

Table 4.
Base line energy consumption during summer in different cities, with different COPs.
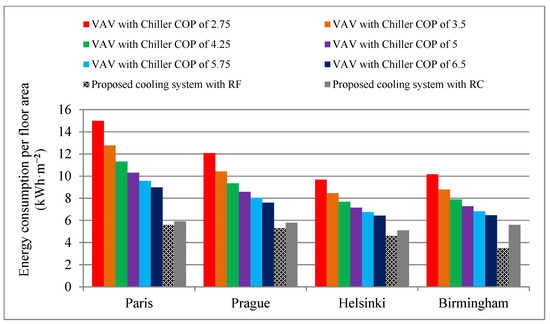
Figure 24.
Energy consumption per floor area of baseline cooling system and proposed cooling system for the four city case studies.
4.3. System Performance Analysis
The system performance factors for baseline cooling systems were estimated for the different temperate climates. The power consumption in Equation (9), in these cases, can be organized according to two categories (SPF1 and SPF2). In SPF1, as expressed in Equation (12), the power consumed by the compressor, CT fan and CT pump were considered in order to compare the performance of the cooling source provider in the baseline system with the integrated (DV and RP) cooling system. On the other hand, in SPF2, using Equation (13), the energy consumption of all components were summed to give the power consumption.
The outcomes of the system performance analysis were summarized in Table 5, and the SPFs were compared for the baseline system against the integrated cooling system (see Figure 25). It can be seen in Table 5, for the same chiller COP, that the greatest SPF occurred in Paris, ranging from 2.15 to 5.82 according to the chiller COP and SPF type. This was because the cooling demand based on a set-point of 24 °C was greater in Paris, compared to other cities, where the greatest energy consumption also occurred. There is also a considerable difference between the cooling source provider performance (SPF1) of the integrated system and the baseline cooling system, especially where the radiant floor was used.

Table 5.
SPF analysis for baseline cooling system for different chiller COPs.
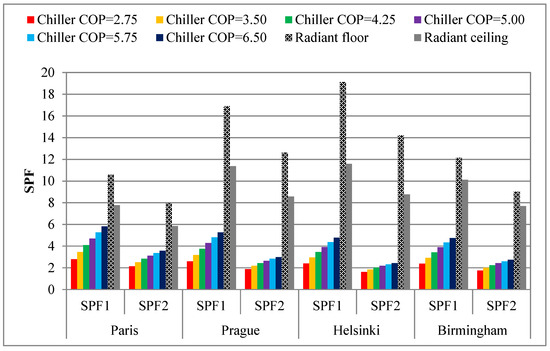
Figure 25.
SPF1–SPF2 for baseline and integrated systems.
It can be concluded that, while the baseline cooling system can meet the thermal comfort requirements completely for different climates during occupancy hours (the PMV index mostly varied between ±0.5), the total energy consumption of this system is greater than the CT tower system, even when using a chiller with a high COP. The system performance analysis shows that the performance of the cooling tower cooling system in all the temperate climates was significantly better than the baseline cooling system.
5. Conclusions
The performance of the integrated CT/RC cooling system was investigated according to key operating constraints, including tower water outlet temperature, radiant panel supply temperature, cooling capacity and COP. The assessment was implemented for four European cities—Helsinki, Birmingham, Prague and Paris—according to a 24 h daily summer design period under the ASHRAE 1% peak design circumstances, and also a seasonal assessment over the period 1 May till 30 September.
Thermal comfort was assessed during summer design day conditions and summer season conditions where the CT was integrated into the DV and two types of RC panels. The results were compared with a baseline cooling system. It was determined that, while the baseline cooling system can provide thermal comfort requirements for different climates with PMVs in the range of −0.5 to 0.5, the variation in the PMV value for radiant cooling panels was wider during the aforementioned period. While the thermal comfort requirements are not covered for some periods, it was shown that the integrated CT/RC cooling system can provide suitable thermal comfort (−1 < PMV < 1) circumstances, fluctuating between 83.7% in Helsinki, 77.6% in Birmingham, 81.4% in Prague and 84.5% in Paris, according to occupant hours of a cooling season. Positive undesirable (PMV ≥ 1) comfort situations for Helsinki, Birmingham, Prague and Paris were obtained for 5.1%, 0.5%, 13.0% and 11.2% of occupant hours, respectively. It can be observed that, during working hours, for both radiant cooling systems, the PMV index gradually increased from a negative value to a positive value. It can be observed that, in the radiant floor cooling panel, in comparison to the radiant ceiling, the PMV index was generally greater. This offers better thermal conditions at the beginning of occupant hours and worse conditions at the end of occupant hours for a radiant floor, compared to radiant ceiling panels.
Considering the total electricity consumption and system performance, it was obtained that the energy conservation of the proposed system when benchmarked against the baseline variable-air-volume air conditioning system, where the chiller COP varies from 2.75 to 6.5, ranged from 62% to 37% in Paris, 56 to 30% in Prague, 52 to 28% in Helsinki and 45 to 13% in Birmingham, respectively. It is shown that there is a considerable discrepancy between the integrated cooling system and the baseline system, even when considering a high COP for the chiller, especially in warm and humid conditions. The SPF of the CT (SPF1) as a cooling source provider for the integrated cooling system can be approximately 2–4 times (two times for Paris, and four times for Helsinki) greater than the cooling source provider for a baseline cooling system, particularly where a radiant floor is used. It can be concluded that the suggested cooling system can provide satisfactory thermal comfort in the majority of occupancy periods (up to 80%) in an office building located in mild climate categories with lower energy consumption in comparison to a VAV cooling system.
Limitations of the overall assessment of the proposed system arise from two sources: the cooling tower mathematical model and the integrated system model. The key limitations of the cooling tower mathematical model are that (i) the model is based on a specific cooling tower design, (ii) the model is constrained to particular tower operating limits, and (iii) the cooling tower has been analyzed in a particular climate type, i.e., a temperate climate. Thus the scalability of the model to different tower designs, extended operating conditions, different climates or a larger cooling tower system has not been systematically demonstrated. Considering the integrated cooling tower and building energy model, the limitations are (i) the assessment has been executed in the context of a specific building and its associated boundary conditions, (ii) the use of a single thermal comfort model, and (iii) experimental validation for the integrated system has not been carried out.
Finally, the proposed integrated system in unlikely to be applicable (i) in building zones with high internal cooling loads (>66 W/m2), (ii) in locations other than temperate climate types, subject to further research, and (iii) in buildings where radiant cooling systems are not feasible due to ceiling or floor installation constraints.
Author Contributions
Conceptualization, M.N. and D.F.; methodology, M.N.; software, M.N.; validation, M.N.; writing—original draft preparation, M.N.; writing—review and editing, D.F.; visualization, M.N.; supervision, D.F.; project administration, D.F.; funding acquisition, D.F. All authors have read and agreed to the published version of the manuscript.
Funding
University College Dublin, University of Birjand and the Iranian Ministry of Science, Research and Technology.
Data Availability Statement
Please contact the corresponding author.
Conflicts of Interest
The authors declare no conflict of interest.
Nomenclature
| Symbols | |
| a | surface area per unit volume |
| COP | coefficient of performance |
| cp | specific heat at constant pressure (J kg−1 K−1) |
| K | mass transfer coefficient (kg m−2 s−1) |
| L | water mass flow rate (kg s−1) |
| mass flow rate, (kg s−1) | |
| Me | Merkel number |
| P | power consumption (W) |
| heat transfer rate (W) | |
| T | temperature (°C or K) |
| V | volume of tower (m3) |
| Subscripts | |
| p | primary |
| pr | primary return |
| ps | primary supply |
| s | secondary |
| sr | secondary return |
| ss | secondary supply |
Appendix A. Building Fabric Specification
The building construction includes the following components: floor, roof and external walls. Each consists of several layers as detailed in Table A1, Table A2 and Table A3. Data for these tables are with reference to UK Building Regulations [59] and Korolija [60]. The overall U-values of the floor, roof and external walls are: 0.25, 0.17 and 0.32 W·m−2·K−1, respectively. Internal walls were constructed within the EnergyPlus model to provide different zones, using the construction specifications shown in Table A4. Data for Table A4 were obtained from EnergyPlus and ASHRAE [31,32]. Double-glazed windows with an overall U-value of 1.92 W·m−2·K−1 were assumed. Window properties are summarized in Table A5 based on the data from Korolija [60].

Table A1.
Ground floor materials (layers from inside to outside).
Table A1.
Ground floor materials (layers from inside to outside).
| Layer | Thickness | Density | Heat Capacity | Conductivity |
|---|---|---|---|---|
| Flooring screed | 0.050 | 900 | 1000 | 0.25 |
| Expanded polystyrene | 0.120 | 1200 | 1000 | 0.41 |
| Cast concrete | 0.100 | 2100 | 840 | 1.40 |
| Brick slips | 0.025 | 2000 | 1000 | 1.35 |
| Clay underfloor | 0.750 | 2400 | 1000 | 1.93 |

Table A2.
Roof construction elements (layers from inside to outside).
Table A2.
Roof construction elements (layers from inside to outside).
| Layer | Thickness | Density | Heat Capacity | Conductivity |
|---|---|---|---|---|
| Concrete—dense | 0.15 | 1800 | 1000 | 1.13 |
| Flooring screed | 0.04 | 900 | 1000 | 0.25 |
| Mineral wool—dense | 0.2 | 900 | 1000 | 0.21 |
| Asphalt | 0.019 | 1700 | 840 | 0.77 |
| Stone chippings | 0.025 | 2100 | 1000 | 0.70 |

Table A3.
External wall construction elements (layers from inside to outside).
Table A3.
External wall construction elements (layers from inside to outside).
| Layer | Thickness | Density | Heat Capacity | Conductivity |
|---|---|---|---|---|
| Plasterboard | 0.013 | 2000 | 1000 | 2.00 |
| Concrete | 0.1 | 15 | 1300 | 0.04 |
| Mineral wool quilt | 0.1 | 50 | 1030 | 0.036 |
| Brick outer leaf | 0.105 | 1700 | 1000 | 0.77 |

Table A4.
Internal wall construction elements.
Table A4.
Internal wall construction elements.
| Layer | Thickness | Density | Heat Capacity | Conductivity |
|---|---|---|---|---|
| Gypsum board | 0.026 | 800 | 830 | 0.16 |

Table A5.
Glazing pane properties.
Table A5.
Glazing pane properties.
| Glazing Pane | Low-E Clear (4 mm) | Reflective (4 mm) |
|---|---|---|
| Solar transmittance at normal incidence | 0.62 | 0.429 |
| Outer glass solar reflectance at normal incidence | 0.075 | 0.308 |
| Inner glass solar reflectance at normal incidence | 0.075 | 0.379 |
| Visible transmittance at normal incidence | 0.847 | 0.334 |
| Outer glass visible reflectance at normal incidence | 0.081 | 0.453 |
| Inner glass visible reflectance at normal incidence | 0.081 | 0.505 |
| Infrared transmittance at normal incidence | 0 | 0 |
| Outer glass infrared hemispherical emissivity | 0.84 | 0.84 |
| Inner glass infrared hemispherical emissivity | 0.1 | 0.82 |
| ) | 1 | 1 |
References
- Energy Information Administration (EIA). International Energy Outlook 2013 with Projection to 2040; U.S. Energy Information Administration, Office of Energy Analysis, U.S. Department of Energy: Washington, DC, USA, 2013. [Google Scholar]
- Engelmann, P.; Kalz, D.; Salvalai, G. Cooling concepts for non-residential buildings: A comparison of cooling concepts in different climate zones. Energy Build. 2014, 82, 447–456. [Google Scholar] [CrossRef]
- IPCC. Intergovernmental Panel on Climate Change (IPCC), Working Group III, Mitigation of Climate Change. Chapter 9. Buildings. 2014. Available online: www.ipcc.ch (accessed on 1 January 2014).
- International Energy Agency (IEA). World Energy Outlook 2023, Licence: Creative Commons Attribution CC BY-NC-SA 3.0 IGO; International Energy Agency: Paris, France, 2023. [Google Scholar]
- Eicker, U. Low Energy Cooling for Sustainable Buildings; John Wiley & Sons Ltd: Chichester, UK, 2009; ISBN 978-0-470-69744-3. [Google Scholar]
- Hojjati, B.; Wade, S.H. U.S. household energy consumption and intensity trends: A decomposition approach. Energy Policy 2012, 48, 304–314. [Google Scholar] [CrossRef]
- Islington. Low Energy Cooling: Good Practice Guide 5; Islington: London, UK, 2012. Available online: www.islington.gov.uk (accessed on 1 January 2024).
- Salvalai, G.; Pfafferott, J.; Sesana, M.M. Assessing energy and thermal comfort of different low-energy cooling concepts for non-residential buildings. Energy Convers. Manag. 2013, 76, 332–341. [Google Scholar] [CrossRef]
- Ezzeldin, S.; Rees, S.J. The potential for office buildings with mixed-mode ventilation and low energy cooling systems in arid climates. Energy Build. 2013, 65, 368–381. [Google Scholar] [CrossRef]
- Harvey, L.D.D. A Handbook on Low Energy Buildings and District-Energy Systems—Fundamentals, Techniques and Examples; Earthscan Pub.: London, UK, 2006; ISBN 1844072436. [Google Scholar]
- Gan, G.; Riffat, S. Numerical simulation of closed wet cooling towers for chilled ceiling systems. Appl. Therm. Eng. 1999, 19, 1279–1296. [Google Scholar] [CrossRef]
- Facão, J.; Oliveira, A.C. Thermal behaviour of closed wet cooling towers for use with chilled ceilings. Appl. Therm. Eng. 2000, 20, 1225–1236. [Google Scholar] [CrossRef]
- Gan, G.; Riffat, S.; Shao, L.; Doherty, P. Application of CFD to closed-wet cooling towers. Appl. Therm. Eng. 2001, 21, 79–92. [Google Scholar] [CrossRef]
- Bolher, A.; Fleury, E.; Millet, J.R.; Marchio, D.; Stabat, P. Guidance and tools for chilled ceilings combined with a wet cooling tower. In Proceedings of the EPIC AIVC Conference, Lyon, France, 23–26 October 2002; pp. 413–418. [Google Scholar]
- Bergsten, B. Evaporative Cooling Tower and Chilled Beams. Design Aspects for Cooling in Office Buildings in Northern Europe. Ph.D. Thesis, Chalmers University of Technology, Göteborg, Sweden, 2009. [Google Scholar]
- Ma, P.; Wang, L.-S.; Guo, N. Modeling of TABS-based thermally manageable buildings in Simulink. Appl. Energy 2013, 104, 791–800. [Google Scholar] [CrossRef]
- Ma, P.; Wang, L.-S.; Guo, N. Modeling of hydronic radiant cooling of a thermally homeostatic building using a parametric cooling tower. Appl. Energy 2014, 127, 172–181. [Google Scholar] [CrossRef]
- Nasrabadi, M.; Finn, D.P. Analysis of a low-temperature small approach open cooling tower integrated with radiant cooling and displacement ventilation for space conditioning in temperate climates. Adv. Build. Energy Res. 2022, 16, 754–779. [Google Scholar] [CrossRef]
- Costelloe, B.; Finn, D. Indirect evaporative cooling potential in air–water systems in temperate climates. Energy Build. 2003, 35, 573–591. [Google Scholar] [CrossRef]
- Costelloe, B. Effectiveness of Water-side Indirect Evaporative Cooling in Maritime Temperate Climates—Experimental and Analytical Investigation. Ph.D. Thesis, University College Dublin, Dublin, Ireland, 2005. [Google Scholar]
- Costelloe, B.; Finn, D. Heat transfer correlations for low approach evaporative cooling systems in buildings. Appl. Therm. Eng. 2009, 29, 105–115. [Google Scholar] [CrossRef]
- Costelloe, B.; Finn, D. Experimental energy performance of open cooling towers used under low and variable approach conditions for indirect evaporative cooling in buildings. Build. Serv. Eng. Res. Technol. 2003, 24, 163–177. [Google Scholar] [CrossRef]
- Alessandrini, J.M.; Bolher, A.; Fleury, E.; Millet, J.R. CONSOCLIM a Software Package to Calculate Energy Consumption of Air Conditioned Buildings, First Comparisons with In Situ Measurements. 2002. Available online: www.aivc.org (accessed on 1 January 2002).
- Costelloe, B.; Finn, D. Thermal effectiveness characteristics of low approach indirect evaporative cooling systems in buildings. Energy Build. 2007, 39, 1235–1243. [Google Scholar] [CrossRef]
- Riffat, S.B.; Zhao, X.; Doherty, P.S. Review of research into and application of chilled ceilings and displacement ventilation systems in Europe. Int. J. Energy Res. 2004, 28, 257–286. [Google Scholar] [CrossRef]
- Hasan, A.; Sirén, K. Theoretical and computational analysis of closed wet cooling towers and its applications in cooling of buildings. Energy Build. 2002, 34, 477–486. [Google Scholar] [CrossRef]
- Crawley, D.B.; Lawrie, L.K.; Winkelmann, F.C.; Buhl, W.; Huang, Y.; Pedersen, C.O.; Strand, R.K.; Liesen, R.J.; Fisher, D.E.; Witte, M.J.; et al. EnergyPlus: Creating a new-generation building energy simulation program. Energy Build. 2001, 33, 319–331. [Google Scholar] [CrossRef]
- TRNSYS. A Transient System Simulation Program, version 17.01.0016; Solar Energy Laboratory, University of Wisconsin-Madison: Madison, WI, USA, 2012. [Google Scholar]
- Clarke, J.; Hensen, J. An approach to the simulation of coupled heat and mass flows in buildings. Indoor Air 1991, 1, 283–296. [Google Scholar] [CrossRef]
- Haves, P.; Ravache, B.; Yazdanian, M. Accuracy of HVAC Load Predictions: Validation of EnergyPlus and DOE-2 Using FLEXLAB Measurements; Energy Technologies Area: Berkeley, CA, USA, 2020. [Google Scholar]
- ASHRAE. ASHRAE Handbook: Fundamentals, SI ed.; American Society of Heating, Refrigerating and Air-Conditioning Engineers, Inc.: Atlanta, GA, USA, 2017. [Google Scholar]
- EnergyPlus Engineering Reference. EnergyPlus Documentation; LBL: Berkeley, CA, USA, 2013. [Google Scholar]
- Nasrabadi, M. Performance analysis of a radiant cooling system connected to a cooling tower in comparison to a fan-coil system in different climatic conditions of Iran. J. Renew. New Energy 2023, 10, 64–76. [Google Scholar]
- ENERGY.GOV, Office of Energy Efficency and Renewable Energy. 2014. Available online: www.energy.gov/eere/buildings/commercial-reference-buildings (accessed on 1 January 2014).
- EnergyPlus Input/Output Reference. EnergyPlus Documentation; LBL: Berkeley, CA, USA, 2013. [Google Scholar]
- ASHRAE. International Weather for Energy Calculation (IWEC Weather Files) Users Manual and CD-ROM; ASHRAE: Atlanta, GA, USA, 2001. [Google Scholar]
- International Weather for Energy Calculations (IWEC Weather Files), version 2.0; American Society of Heating, Refrigerating and Air-Conditioning Engineers, Inc.: Atlanta, GA, USA, 2012.
- Mandalaki, M.; Zervas, K.; Tsoutsos, T.; Vazakas, A. Assessment of fixed shading devices with integrated PV for efficient energy use. Sol. Energy 2012, 86, 2561–2575. [Google Scholar] [CrossRef]
- Imanari, T.; Omori, T.; Bogaki, K. Thermal comfort and energy consumption of the radiant ceiling panel system. Energy Build. 1999, 30, 167–175. [Google Scholar] [CrossRef]
- Miriel, J.; Serres, L.; Trombe, A. Radiant ceiling panel heating–cooling systems: Experimental and simulated study of the performances, thermal comfort and energy consumptions. Appl. Therm. Eng. 2002, 22, 1861–1873. [Google Scholar] [CrossRef]
- Bolashikov, Z.D.; Mustakallio, P.; Kolencikova, S.; Kostov, K.; Melikov, A.K.; Kosonen, R. Thermal comfort in simulated office environment with four convective and radiant cooling systems. In Proceedings of the 11th REHVA World Congress and the 8th International Conference on Indoor Air Quality, Ventilation and Energy Conservation in Buildings, Prague, Czech Republic, 16–19 June 2013. [Google Scholar]
- Kosonen, R.; MustaKallio, P.; BolashiKov, Z.; Kostov, K.; Kolencikova, S.; Melikov, A.K. Thermal comfort with radiant and convective cooling systems. REHVA J. 2014, 6, 47–51. [Google Scholar]
- Doebber, I. Radiant slab cooling for retail. ASHRAE J. 2010, 52, 28. [Google Scholar]
- Moore, T. Simulation of Radiant Cooling Performance with Evaporative Cooling Sources; Summary Report; Center for Built Environment (CBE), University of California: Berkeley, CA, USA, 2008. [Google Scholar]
- Starr, R.J. Radiantec Tubing Layout, General Supplement 440, Pioneering Radiant Technology, Copyright 2003. Online Resource. Available online: https://www.radiantec.com/installation-manuals/instructions-for-doing-your-own-tubing-layout/ (accessed on 1 January 2003).
- ASHRAE. ANSI/ASHRAE Standard 62.1; Ventilation for Acceptable Indoor Air Quality. ASHRAE: Atlanta, GA, USA, 2019.
- CIBSE. CIBSE Guide A—Environmental Design, 7th ed.; CIBSE: London, UK, 2006; ISBN 9781903287668. [Google Scholar]
- Nasrabadi, M.; Finn, D.P. Mathematical modeling of a low temperature low approach direct cooling tower for the provision of high temperature chilled water for conditioning of building spaces. Appl. Therm. Eng. 2014, 64, 273–282. [Google Scholar] [CrossRef]
- Nasrabadi, M.; Finn, D.P. Performance analysis of a low approach low temperature direct cooling tower for high-temperature building cooling systems. Energy Build. 2014, 84, 674–689. [Google Scholar] [CrossRef]
- Yang, K.; Ting, M. An innovative analysis and experimental investigation on energy savings of a VAV system in hot and humid climates. J. Affect. Disord. 2000, 35, 27–31. [Google Scholar] [CrossRef]
- Adnot, J.; Greslou, O.; Riviere, P.; Spadaro, J.; Hitchen, R.; Pout, C.; Kema, R.; van Elburg, M.; van Holsteijn, R. Sustainable Industrial Policy Building on the Eco-Design Directive-Energy-Using Product Group Analysis/2; Contract No. ENTR/B1/35-2009/LOT6/SI2.549494; BRE: Hertfordshire, UK, 2012. [Google Scholar]
- Nasrabadi, M. Investigation of Office Space Conditioning Using an Open Cooling Tower with Radiant Cooling and Displacement Ventilation in Temperate Climates. Ph.D. Dissertation, School of Mechanical, Materials Engineering, University College Dublin, Dublin, Ireland, 2015. [Google Scholar]
- Alfano, F.R.D.; Pepe, D.; Riccio, G.; Vio, M.; Palella, B.I. On the effects of the mean radiant temperature evaluation in the assessment of thermal comfort by dynamic energy simulation tools. J. Affect. Disord. 2023, 236, 110254. [Google Scholar] [CrossRef]
- Abela, A.; Hamilton, L.; Hitchin, R.; Pout, C.; Lewry, A. Study on energy use by air-conditioning. In Building Research Establishment (BRE) Client Report for the Department of Energy & Climate Change; BRE: Hertfordshire, UK, 2016; p. 39. [Google Scholar]
- ASHRAE. ASHRAE Standard. Standard 90.1-2007; Energy Standard for Buildings Except Low Rise Residential Buildings. American Society of Heating, Refrigerating and Air-Conditioning Engineers: Atlanta, GA, USA, 2007.
- Tan, C.K.; Ogawa, A.; Matsuma, T. Innovative Climate Change Communication: Team Minus 6%; GEIC Working Paper Series 2008-001; Global Environment Information Centre, United Nations University: Shibuya City, Japan, 2008. [Google Scholar]
- Lakeridou, M.; Ucci, M.; Marmot, A.; Ridley, I. The potential of increasing cooling set-points in air-conditioned offices in the UK. Appl. Energy 2012, 94, 338–348. [Google Scholar] [CrossRef]
- Yu, X.; Yan, D.; Sun, K.; Hong, T.; Zhu, D. Comparative study of the cooling energy performance of variable refrigerant flow systems and variable air volume systems in office buildings. Appl. Energy 2016, 183, 725–736. [Google Scholar] [CrossRef]
- Document, L. Conservation of Fuel and Power: Approved Document L. Department for Levelling Up, Housing and Communities and Ministry of Housing, Communities & Local Government (2018 to 2021). 2024. Available online: https://www.gov.uk/government/publications/conservation-of-fuel-and-power-approved-document-l (accessed on 1 January 2024).
- Korolija, I. Heating, Ventilating and Air-Conditioning System Energy Demand Coupling with Building Loads for Office Buildings. Ph.D. Thesis, De Montford University, Leicester, UK, 2011. [Google Scholar]
Disclaimer/Publisher’s Note: The statements, opinions and data contained in all publications are solely those of the individual author(s) and contributor(s) and not of MDPI and/or the editor(s). MDPI and/or the editor(s) disclaim responsibility for any injury to people or property resulting from any ideas, methods, instructions or products referred to in the content. |
© 2024 by the authors. Licensee MDPI, Basel, Switzerland. This article is an open access article distributed under the terms and conditions of the Creative Commons Attribution (CC BY) license (https://creativecommons.org/licenses/by/4.0/).