Abstract
Direct air capture (DAC) systems that capture carbon dioxide (CO2) directly from the atmosphere are garnering considerable attention for their potential role as negative emission technologies in achieving net-zero CO2 emission goals. Common DAC technologies are based either on liquid–solvent (L-DAC) or solid–sorbent (S-DAC) to capture CO2. A comprehensive multi-factor comparative economic analysis of the deployment of L-DAC and S-DAC facilities across various United States (U.S.) cities is presented in this paper. The analysis considers the influence of various factors on the favorability of DAC deployment, including local climatic conditions such as temperature, humidity, and CO2 concentrations; the availability of energy sources to power the DAC system; and costs for the transport and storage of the captured CO2 along with the consideration of the regional market and policy drivers. The deployment analysis in over 70 continental U.S. cities shows that L-DAC and S-DAC complement each other spatially, as their performance and operational costs vary in different climates. L-DAC is more suited to the hot, humid Southeast, while S-DAC is preferrable in the colder, drier Rocky Mountain region. Strategic deployment based on regional conditions and economics is essential for promoting the commercial adoptability of DAC, which is a critical technology to meet the CO2 reduction targets.
1. Introduction
According to global climate modeling scenarios by the United Nations Intergovernmental Panel on Climate Change (IPCC) and the International Energy Agency (IEA), net-zero emissions must be reached by midcentury (2050) to keep the average global temperature rise to 1.5–2 °C above preindustrial levels by 2100 [1,2,3]. In addition, studies also indicate that, by 2050, the annual removal of ~10 Gt of carbon dioxide (CO2), a major GHG, directly from the atmosphere will be required to supplement the mitigation of GHG emissions at source to achieve the temperature rise goals [4,5,6].
Negative emission technologies (NETs) is the term commonly used to refer to this genre of atmospheric carbon dioxide removal (CDR) systems. Amongst engineered NETs, direct air capture (DAC), which extracts CO2 from the atmosphere, is a recognized process that can be leveraged to reach the goal of net-zero emissions by 2050 [7]. The CO2 captured using DAC systems is ultimately stored in geologic reservoirs or converted to products [3,4]. Compared to other NETs (e.g., reforestation), DAC has a relatively small land requirement and a potentially shorter operational lead time to start capturing CO2. Further, DAC can be sited strategically to realize the maximum impacts on decarbonization.
Common DAC technologies today either utilize a liquid–solvent (L-DAC) or a solid–sorbent (S-DAC) to capture CO2. A variety of local factors affect the economics of both types of DAC systems, including but not limited to climate conditions, availability of a suitable power source, and regional policies and regulations. While many studies contribute valuable insights into specific aspects of DAC, e.g., [4,5,6,8,9,10,11,12], a comprehensive, holistic, and comparative evaluation that includes multiple factors influencing both prevalent DAC technologies (solvent and sorbent) has not yet been conducted. Moreover, the impact of local conditions beyond climate variability, such as transport and storage (T&S) costs and the carbon intensity of the power source, on the final effectiveness of DAC has not been described in detail. Specifically, this paper contributes to the DAC literature in the following ways:
First contribution: Sub-national analysis—Decarbonization studies generally address DAC deployments at national or multi-national scales without sub-national and regional considerations [4,5,6,8,9,10]. The current DAC literature is limited in that the technology is explained as if its adoption is equally possible and effective anywhere in the world, which may not be the case. For instance, a grid with power-supply carbon intensity as low as 100 kgCO2/MWh would reduce the net capture of a 100-percent electricity-powered, 100,000 tCO2/yr capacity DAC plant to about 60,000 tCO2/yr (a reduction of 40 percent of the net capture rate). As of 2022, only a handful of states had a power-supply intensity lower than 100 kgCO2/MWh [13]. DAC investigations have typically focused on assessing factors that impact the performance or operational cost of one DAC type (e.g., L-DAC) [8,9,11,12]. Keith et al. presented a seminal study with detailed engineering and cost breakdowns for a 1 MtCO2/yr capacity L-DAC plant (also referred to as the Carbon Engineering or CE case) [14]. They found that the levelized cost of CO2 capture ranged from USD 94 to USD 232/tCO2 depending on financial assumptions, energy costs, and the specific choice of inputs and outputs [14]. An et al. modeled the L-DAC CE process and found that climatic conditions, specifically temperature and humidity, have a profound impact on carbon capture rates and the system’s overall energy demand [8]. Sendi et al. analyzed the effect of climate on S-DAC performance and provided a country-level economic assessment using the current best-in-class S-DAC technology [9]. The National Energy Technology Laboratory (NETL) analyzed the techno-economics of L-DAC and S-DAC systems similar to the respective processes considered by Keith et al. and Sendi et al. and provided a detailed cost-of-capture methodology [11,12]. Together, these papers assess the cost and performance of DAC technologies, but none address the economics of DAC siting at a regional level. The only study that presents a regional perspective is a qualitative nationwide assessment of L-DAC siting provided in the Carbon Solutions LLC study [15] on key siting considerations spanning six categories—geologic carbon storage, heat sources with carbon capture, atmospheric conditions, regional resources for low-carbon heat, waste heat recovery, and low-carbon electricity. However, this analysis does not provide a comparative analysis of the DAC technologies based on their siting locations. The analysis presented in this paper extends the results from the literature to evaluate cost and performance for specific geographic regions of the United States for both DAC technologies.
Second contribution: Consideration of CO2 T&S—The second main contribution of this paper is the inclusion of regional costs for the T&S of the captured CO2, unlike studies in the literature that either do not account for the T&S costs or use a generic value. In addition to the cost of the capture and performance of the different DAC technologies being two of the most important variables that determine siting favorability, the T&S cost impacts the total cost of CO2 removal and is an important consideration in siting DAC systems. DAC projects could potentially be co-located with storage—injecting the carbon removed at the capture plant site—eliminating transportation costs, which may be economically preferable depending on the geologic formation. However, this may be sub-optimal based on other factors such as climatic conditions and local policies, and, accordingly, T&S costs are included to provide for a more holistic analysis of DAC siting.
Third contribution: Contextualization of techno-economic variables and other non-techno-economic variables—This paper presents a comprehensive analysis beyond the costs of capture and storage and considers the impact of other regional variables, such as state-level policies and decarbonization goals, in advancing the deployment of DAC. The present study builds on the qualitative study by Carbon Solutions LLC [15] with the development of a weighted composite score to determine the attractiveness of siting DAC based on several factors, including the CO2 removal cost and regional market and policy drivers, which are used to rank the locations.
Fourth contribution: Discussion of the DAC market and who pays for it—There is a need for a strong financing mechanism to not only fund initial investment but build a revenue stream to support lifetime operations of DAC plants, which is still in the nascent stages of development with high capital and operating expenditures. While voluntary markets fund most DAC projects today, the literature suggests that stringent regulations on CO2 emissions would be required to scale DAC to giga-tonne (Gt) levels. Meckling and Biber proposed an “incentive + mandate” policy-sequencing mechanism in which mandates to deploy DAC would be initiated by global “leader” markets, and “follower” markets would see eventual political pressure to mandate carbon removal [10]. Furthermore, driving DAC deployment using oil and gas firms with a global footprint would enable faster international technology transfer. A very recent case study of determinants supporting CE’s decision to opt for a large-scale DAC demonstration also saw regulatory stringency as the primary and most effective determinant [16]. It circumvents the issue of carbon price volatility, and, as a result, funding can be mobilized easily.
This paper analyzes the annual cost of CO2 removal utilizing DAC technologies across 71 continental U.S. cities, leading to a comprehensive multi-factor comparative economic analysis of deployment of DAC facilities across selected cities in the United States. The analysis evaluates the performance and costs of both types of DAC under various factors: diverse climate conditions, energy sources, regional carbon intensity of the grid, upstream natural gas sourcing emissions, and detailed carbon T&S considerations, all under a range of financial parameters. Beyond the techno-economic analysis that this work presents, it also considers the influence of market dynamics and regulatory policies on the strategic deployment of DAC. A weighted composite favorability index combining techno-economic performance with market and policy drivers was developed to provide a quantitative metric to evaluate the potential for siting DAC.
2. Methods
The methods used to estimate the cost of CO2 removal, including the costs of capture and T&S, the net costs of CO2 removal, and the creation of an overall DAC favorability index, are detailed in this section. Three DAC technology cases were analyzed, largely based on the NETL DAC case studies [11,12], and are described in Table 1 with high-level schematics of the configurations for the different cases illustrated in Figure 1 and Figure 2. A natural gas combined cycle (NGCC) plant is assumed to provide the energy requirements for the L-DAC-based Case 1 and S-DAC-based Case 2a, while the S-DAC case in Case 2b is powered using power from the grid. In Case 1, the NGCC plant is integrated with the L-DAC’s KOH solvent carbon capture process. Conversely, in Case 2a, the NGCC plant operates independently from the sorbent-based DAC and employs a Shell Cansolv-based solvent capture system. For further details, refer to Figure 1 and Figure 2, as well as references [11,12]. Regardless of the cases, the captured CO2 is compressed and transported to a geological saline reservoir for storage.

Table 1.
DAC technology cases included in this analysis.
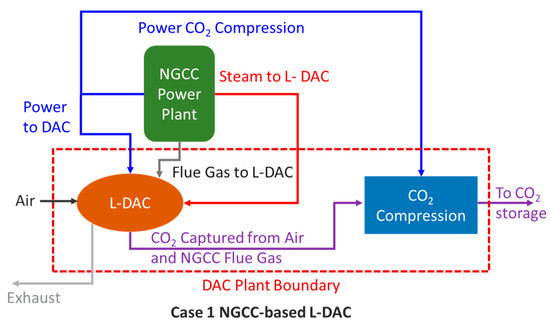
Figure 1.
Plant configuration for Case 1: NGCC-based L-DAC.

Figure 2.
Plant configurations for S-DAC Case 2a and Case 2b.
2.1. Cost of CO2 Removal (COCR)
The COCR, which includes the cost of capture and the T&S cost, was estimated based on the NETL studies [11,12] along with the sensitivity analyses from An et al. and Sendi et al. [8,9]. Technology assumptions include uniform annual capture technology performance and total annual CO2 captured throughout an assumed plant lifetime of 30 years.
The COCR for an ith DAC technology case, with i = 1, 2a, 2b, corresponding to the three technology cases presented in Table 1, and sited in a kth city (k = 1, 2…, 71) is shown in Equation (1).
where = cost of CO2 emissions removal for a DAC technology i, in city k, in USD/tonne; = cost of all captured CO2 emissions transported and stored for a DAC technology i, in city k, in USD/tonne. This variable is explained in more detail later in this section; = cost of all captured CO2 emissions for a DAC technology i, in city k, in USD/tonne, expressed as
where
= total overnight cost of DAC technology i; = annual fixed and variable operational and maintenance (O&M) expenses of DAC technology i and city k, expressed as
where = fixed O&M costs, including operating labor, maintenance labor, administrative and support labor, and property taxes and insurance for DAC technology i, in USD/yr; = variable O&M costs, including natural gas, water, and technology-based costs (solvent/sorbent liquid/material, and other related costs), in USD/yr; = annual amount of CO2 captured, equal to the total CO2 that is sent to T&S, in tonnes per year, expressed as
where = total annual gross emissions captured from air, by technology i and city k, as a function of average weather variables, temperature, and humidity in location k, and is assumed to be constant through 30 years of operation (see Section 3 for more details); = total annual emissions captured from the NGCC plant operation for technology i, assumed to be constant through 30 years of operation (for Case 1, the CO2 captured from the L-DAC calciner is also included).
2.1.1. Net CO2 Removed
In addition to annual captured emissions, upstream emissions from the energy sources used for the operation of the DAC facilities are considered. For Case 1 and Case 2a, natural gas is assumed to be the energy source for the DAC facility, and upstream natural gas emissions are estimated by region using work performed by NETL [17]. For Case 2b, where the grid electric power is used, upstream emissions of the electric power system are included using data from EIA (see Section 3 for more details). Net CO2 removed could be used as the denominator of Equation (1) under an analysis that accounted for upstream emissions. The net CO2 removed is expressed as shown in Equation (2):
where = emissions removed by the DAC facility after accounting for natural gas or power upstream emissions, in tonnes; = emissions not captured from flue gas during plant operation, in tonnes; = emissions from the natural gas supply chain and/or emissions from the electricity source, in tonnes. Nuclear, geothermal, hydro, wind, solar, and bioenergy with carbon capture and storage (BECCS) are the renewable/low-carbon energy sources assessed in addition to grid electricity.
2.1.2. T&S Costs
CO2 is assumed to be transported by a pipeline for injection into a deep saline formation (This analysis does not account for any costs associated with the potential use of CO2, including enhanced oil recovery). T&S costs depend on factors such as the relative location of a DAC project and its CO2 storage project, CO2 transport pipeline capacity, CO2 storage geology, and CO2 storage project capacity.
Carbon T&S costs were estimated for each case and location using a T&S screening spreadsheet tool (T&S Tool) that was developed based on NETL’s publicly available CO2 transport and saline storage cost models [18,19]. Equation (3) shows this calculation:
where = overall cost for transporting and storing the total annual emissions captured in the DAC facility of technology i and located in city k, in USD/tonne; = annual cost of transporting annual emissions captured by a DAC location k and a storage reservoir r, in USD/yr. The cost of transport depends on the distance between the DAC location k and the reservoir r. The centroid for each of the 319 reservoirs considered here served as the injection point as shown in Appendix A, Figure A1; = annual cost of storing emissions in a storage reservoir, r, in USD/yr. Storage costs are estimated independent of transport and capture costs, using a constant mass flow rate (MFR) to be stored of 1.4 Mt-CO2/yr in this analysis (the assumed MFR includes CO2 captured and sent to storage from both the DAC (~1 Mt) and the NGCC (~0.4 Mt) plants).
2.2. DAC Favorability Index
The different dimensions that could potentially affect DAC siting are considered in developing a composite DAC favorability index. While the net cost of CO2 removal is used directly to develop a techno-economic score, regional policies and carbon market mechanisms were investigated to provide perspectives on representative metrics.
A variety of market mechanisms were reviewed and are summarized in Table 2. Section 45Q under the Inflation Reduction Act of 2022 provides a financial incentive to qualified facilities, including power generation, industrial, and DAC facilities, located anywhere in the United States based on the amount of CO2 captured, which can either be securely stored underground (e.g., in saline storage) or used to produce another product (e.g., to produce oil via enhanced oil recovery) [20]. Other salient market mechanisms include the Low Carbon Fuel Standard (LCFS), voluntary carbon offset markets, and compliance markets. A majority of these market mechanisms generally apply at a national level and do not offer a differential advantage at the city or state level. The compliance markets could potentially support DAC regionally but have not matured enough for inclusion at the time of the writing of this manuscript.

Table 2.
Available carbon market mechanisms for DAC deployment in the U.S.
Besides carbon market mechanisms, state-level decarbonization goals are a signal of policy favorability for adoption of decarbonization technologies. The literature is rich in explaining the evidence of the role of environmental and energy policy in clean technology adoption [28,29], and decarbonization targets are an initial step toward state-level policy development. The assumption for using decarbonization goals as a proxy for policy favorability is that states that have set a voluntary or mandatory decarbonization target are more likely to develop new policies and instruments that favor decarbonization technologies such as DAC. For example, some of the 23 U.S. states that have a 100 percent decarbonization target [30] have specific requirements for electric utilities to achieve carbon neutrality, or for the state to achieve negative emissions, and some include CO2 storage (for example, Michigan’s 100% target by 2040 established in Senate Bill 271 (2023) requires all utilities to have a portfolio of 60% renewable energy by 2035, 80% “clean energy”—which includes carbon capture and storage—by 2035, and 100% by 2040), which is key for DAC deployment. At the state level, there is a significant correlation between the number of decarbonization policies (listed by [31] by March 2024) and the level of decarbonization commitment across the 50 U.S. states plus the District of Columbia (the Pearson correlation results in R(51) = 0.42 with p < 0.01, i.e., significant at a 99% confidence level) [32] (see Appendix B, Table A4). Thus, the level of decarbonization commitments is used as a proxy for DAC policy favorability in this study for three reasons: first, due to the evidence of a correlation between the decarbonization goals and number of decarbonization policies at the state level; second, because states that are committed to stringent decarbonization goals have language that favors CO2 storage—a key DAC component; and third, due to the absence of DAC-specific state-level policies that could be used to account for current state-level favorability.
The other factor investigated to assess DAC favorability concerns the states’ openness for technology adoption and newer technologies, particularly with respect to decarbonization technologies. States with higher market shares of mature decarbonization technologies could be more ready to adopt newer technologies such as DAC. The assumption is that states that have a lower adoption of wind and solar technologies would be less interested in favoring more expensive decarbonization technologies such as DAC. In other words, states that have a lower share of variable renewable energy (VRE) could be more interested in continuing the adoption of cheaper, more mature technologies for carbon reductions before favoring less mature, more expensive decarbonization technologies such as DAC. On the other hand, states that already have a more significant participation in wind and solar may also be more prepared to adopt newer decarbonization technologies. Early adopters usually have a higher tolerance for risk and could be more willing to invest in the supportive infrastructure, human resources, or supply chains required for DAC deployments, and the VRE maturity level could be a proxy for DAC market readiness.
A correlation analysis between decarbonization commitments and wind and solar market share confirms that these two variables are not correlated and could be used as independent proxies for policy and market favorability factors, respectively. The Pearson correlation results in R(51) = −0.03 with p > 0.1, i.e., correlation not different from zero. Based on the prior discussions, the three dimensions included in developing the composite DAC favorability index in this study are listed in Table 3.

Table 3.
Three scores included in the Favorability index.
The overall multi-dimensional favorability index for DAC deployment is built at the city level and is represented in Equation (4) as:
where S1 represents the techno-economic score for a city k. The techno-economic score is calculated as 1 minus the percentile of the net cost of CO2 removal (USD/tonne) for each city based within the cost range for the cities considered. The score ranges from 0 to 1, with 0 indicating (within the cities considered here) the highest cost or least attractiveness and 1 indicating the lowest cost or highest attractiveness for DAC deployment; S2 represents the decarbonization score for the state of the city k and ranges from 0 to 1, reflecting the percentage of a state’s commitment to decarbonization, with 0 indicating no commitment and 1 implying a commitment to 100 percent decarbonization. No additional scoring is set for the timeline of decarbonization (i.e., states with a 2035 or 2050 net-zero goal would equally score 1). This score is DAC-technology-agnostic and is the same for the three DAC cases; S3 represents the wind and solar adoption score of the state of the city k based on the share of wind and solar in the generation market. Scores range from 0 for no share to 1 for a 100 percent share of the wind/solar generation market. This score is also independent of the DAC technology and is the same for the three DAC cases; Weights W1, W2, and W3 represent the relative importance of each score and sum to 1.
This multi-dimensional index highlights cities where one technology may be significantly favored over another. Ultimately, the results from this index emphasize the complementary potential of these DAC technologies across various techno-economic, policy, and market factors.
3. Data
The datasets and methodologies used in this analysis fall into four distinct categories: techno-economic, which includes performance data; city-level data; regional-level data; and national-level data. A brief explanation of each dataset follows.
3.1. Techno-Economic Data
Table 4 outlines the characteristics of the three DAC case configurations considered here, along with the input parameters used for generating the resulting maps. Cost estimation methodologies for all cases are derived from NETL’s solvent and sorbent case studies.

Table 4.
Technology-based engineering, performance, and cost data used in the analysis.
- Capacity and Cost: L-DAC (Case 1) has a significantly larger capture capacity (~10×) and higher associated total operating cost (TOC) compared to sorbent-based DAC before scaling (Cases 2a and 2b).
- Technology Stage: All three configurations represent sample designs. As both technologies undergo further research, development, and demonstration, optimal configurations and cost reductions are likely.
- Sorbent Generalization: The sorbent characteristics used (Cases 2a and 2b) reflect an average of reported material performance across the literature and do not represent a specific material or approach [12].
3.2. DAC Performance
The baseline DAC performance was adjusted for different climate conditions based on the data tables provided by An et al. for Case 1 [8] and Sendi et al. for Case 2 [9]. Variations in CO2 capture rate, productivity, and energy consumption are shown in Figure 3 and Figure 4 for L-DAC and Figure 5 and Figure 6 for S-DAC. Two-dimensional spline interpolation was applied to both datasets to increase precision and allow for comparison between two cities with marginally different climates. Capture rates were determined using the respective technology’s interpolated lookup table. The percentage difference between the capture rate at the adjusted conditions and the baseline was then used to calculate the annual amount of CO2 removed.
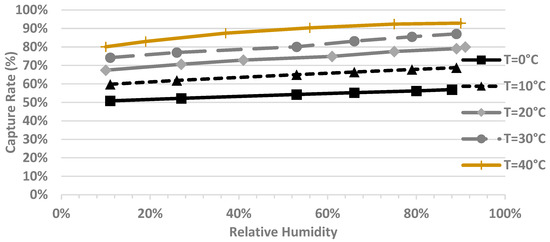
Figure 3.
Capture rate represented as a function of temperature (°C) and relative humidity (%) for L-DAC Case 1. Data source: An et al. [8].
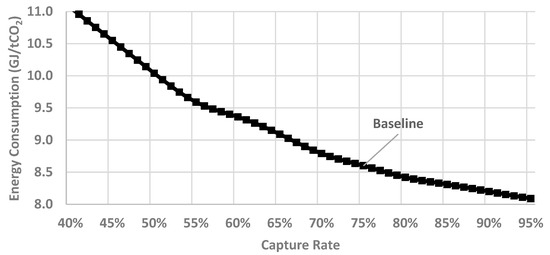
Figure 4.
Energy consumption represented as a function of the system’s capture rate for L-DAC Case 1. Data source: An et al. [8].
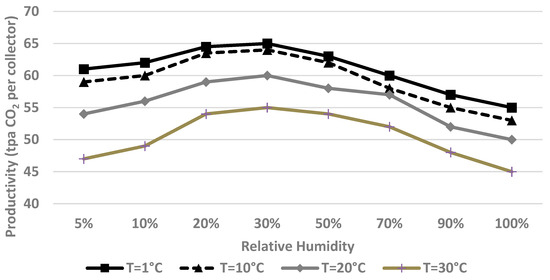
Figure 5.
Productivity as a function of temperature and relative humidity for S-DAC Case 2. Data source: Sendi et al. [9].
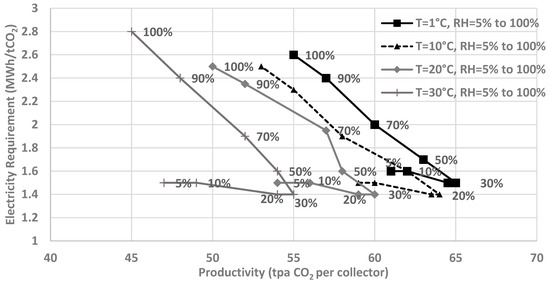
Figure 6.
Electricity requirement as a function of productivity under RH = 5–100% (labels correspond to RH value) for S-DAC Case 2. Data source: Sendi et al. [9].
Figure 3 shows the capture rate of L-DAC rising with increasing temperature and relative humidity, suggesting L-DAC performs best in warmer and more humid climates. As depicted in the figure, temperature has a more significant impact on L-DAC performance than humidity, due to the exponential relationship between temperature and chemical reaction rates, which facilitates the formation of CO2–solvent complexes [8].
Figure 4 highlights the effect of L-DAC’s capture rate on the facility’s energy requirements. As expected, as the plant’s capture rate increases (capturing more CO2), the energy consumption per tonne of CO2 decreases. The figure also indicates the baseline used in this analysis: a 75% capture rate with an energy consumption of 8.6 GJ/tCO2.
Figure 5 highlights S-DAC performance, shown in terms of productivity—the tonnes of CO2 collected annually per collector—as S-DAC is modular, with collectors that can be stacked. Baseline conditions of 15 degrees Celsius and 50% relative humidity was used in this analysis, which corresponded to a productivity value of 58 tpa-CO2 per collector. This was translated to a baseline DAC capture rate of 60%, which varied based on the percentage difference in productivity from the baselines for the selected cities.
Figure 6 highlights the impact that S-DAC’s capture rate has on its energy requirements. Unlike L-DAC, S-DAC is shown to have an “optimal” combination of lower temperatures and relative humidity (~30%) that maximizes the collector productivity. As the temperatures decrease and humidity falls to 30%, the productivity increases, but beyond this point, the performance declines. According to Sendi et al., humidity impacts CO2 uptake more than temperature, as high humidity levels increase competition for adsorption sites due to the high affinity of these sites for water molecules, which reduces the sorbent’s CO2 capture capacity [9].
3.3. Study Spatial Scope
The suitability of siting DAC technologies was explored for 71 cities in the continental United States, which consisted of major metropolitan areas representing each state, typically the state capital, and other cities based on the state’s size and population density. Note that, due to DAC’s land requirement, it is assumed that the facility would be located in close proximity to the city rather than the city center, as it represents a proxy for its location and climate. Additional cities were included to fill any large regional voids. Odessa, Texas, was specifically selected due to its being the location for the CE Stratos L-DAC Plant (currently under construction) [33].
3.3.1. Local Temperature and Humidity Variations
The annual average temperature and humidity for the 2022 calendar year, shown in Figure 7, were calculated based on the monthly average data from the National Oceanic and Atmospheric Administration and were used in evaluating the DAC performance in each city [34]. Figure 7 shows (as expected) that the southern U.S. cities have notably higher temperatures than the northern cities, while the humidity is highest in the Southeast and Pacific Northwest and lowest in the inland Mountain West. A subset of 43 cities is shown in the visualization for the sake of clarity.
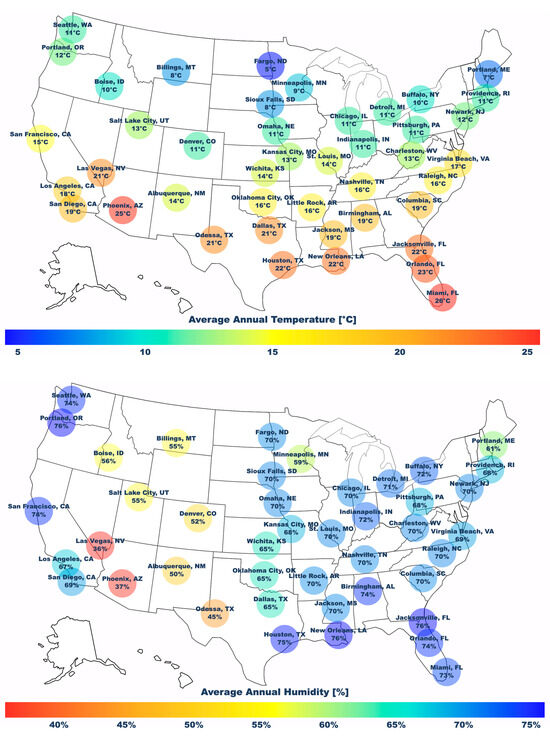
Figure 7.
Annual temperature and humidity by city using 2022 monthly averages.
3.3.2. Emissions from Regional DAC Power and Energy Sourcing
The net carbon removed was based on the regional data for emissions from natural gas (NG) sourcing in Case 1 and Case 2a and on the state-level carbon intensity of power supply in 2022 (kgCO2/MWh) for Case 2b.
Littlefield et al.’s analysis highlights significant regional variations in the upstream emission intensity (gCO2/MJ) of NG sourcing from all stages excluding distribution, but including production, gathering and boosting, processing, transmission, storage, and pipeline [17]. Data were reported in the Littlefield et al. study at the regional level and, thus, applied uniformly to all cities within each region in this analysis (see Appendix A, Table A2). The values corresponding to the 2.5 percent confidence interval, ranging from 4.6 gCO2/MJ in the Northeast to 7.2 gCO2/MJ in the Pacific, were chosen in this study assuming that the lowest emitting supply basins would likely be chosen for sourcing NG to fuel DAC to maximize the net CO2 removal efficiency. The NG cost was assumed to be constant across all the basins; a cost–benefit analysis based on sourcing natural gas from different basins is not included in the present study. The selected values are attributed to each city based on their corresponding regions.
State-level carbon intensity of the power supply in 2022 is used as a proxy for city-level carbon intensity of the power supply. As shown in Table 5, this intensity ranged between 0.5 and 883 kgCO2/MWh in the 48 contiguous U.S. states, with Vermont and West Virginia showing the lowest and highest intensities, respectively [13].

Table 5.
Summary statistics for power sector carbon intensity of data in the 48 contiguous states.
3.3.3. Regional Decarbonization Commitments
Decarbonization commitment is an assessment based on state-specific targets, which differ in both the decarbonization levels as well as the year for achieving the targeted emission levels. Figure 8 shows enforced or voluntary decarbonization commitment at a future year for different states. It is based on the percentage of renewable energy, decarbonization of the power sector or the energy sector, and percentage reduction in GHG emissions targeted [31] (see Appendix B, Table A3). Of the 50 states plus the District of Columbia, 23 states are committed to 100 percent decarbonization while 11 states do not have a decarbonization target.
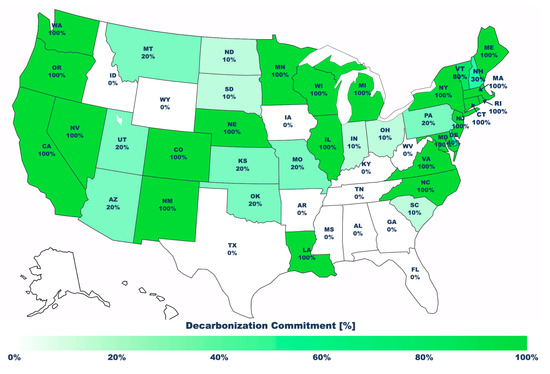
Figure 8.
Decarbonization commitment (enforced or voluntary) at the state level in a future year. Data source: Anderson et al. [32].
3.3.4. Regional Adoption of Wind and Solar Technologies
The state-level adoption of wind and solar technologies is presented in Figure 9 [32] (see Appendix B, Table A3). Interestingly, the two states with the highest wind and solar shares in the generation market—Iowa and South Dakota—rank near the lowest in decarbonization commitment. On the other hand, there are states that rank low both in decarbonization commitment and VRE market share, including Kentucky and Tennessee, and states that rank high in both variables, such as New Mexico and Colorado.
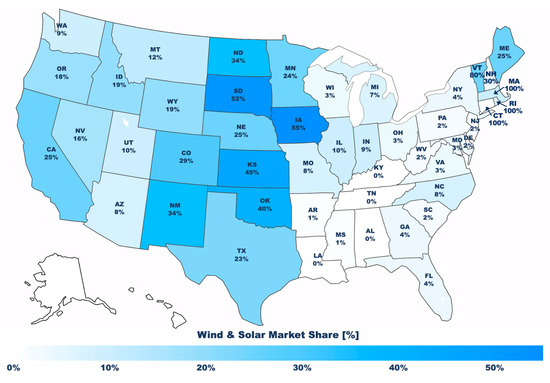
Figure 9.
State-level adoption of wind and solar technologies presented as the market share of wind and solar in the generation market.
4. Results
The results for variations in DAC performance are presented, followed by the costs of carbon removal and the DAC favorability indices.
4.1. DAC Performance
The variation of gross DAC CO2 capture based on a baseline DAC unit that can capture a million metric tonnes of CO2 per year is shown in Figure 10, which reflects the variability of temperature and humidity across the nation (see Figure 3 for more details).
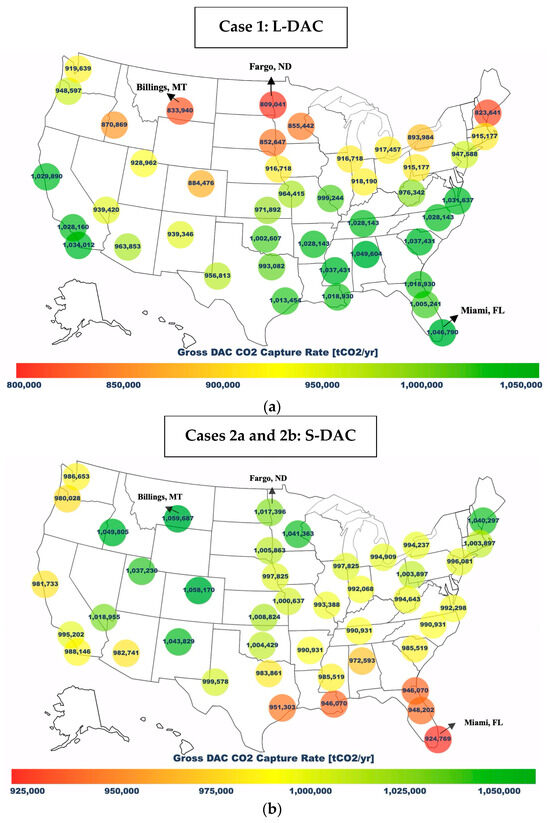
Figure 10.
Comparative annual estimated gross DAC CO2 capture rates (tCO2/yr) for the three cases considered: (a) Case 1: L-DAC; (b) Case 2a: S-DAC—NGCC and Case 2b: S-DAC—Grid-Powered (Case 2a and Case 2b have the same gross CO2 capture rates (t-CO2/yr) and are represented in one single map. Their capacities are scaled up from the NETL DAC case studies baselines to match Case 1’s design capacity for comparison [12]).
For Case 1, Figure 10a, a difference of ~20 percent in L-DAC performance was found among the cities, with Miami, Florida, and Fargo, North Dakota, registering the highest and the lowest gross DAC CO2 capture values, respectively. The most effective locations for L-DAC siting, based on gross CO2 capture rates, are found in the southeastern United States, such as Miami, Florida, as well as coastal areas of California. These are regions characterized by relatively warmer and more humid climates. As previously outlined by An et al. (see Figure 3), humidity is shown to play a larger role than temperature in L-DAC performance [8]. For example, Figure 10a shows that L-DAC does not perform as well in Arizona and New Mexico compared to Florida, despite having higher average yearly temperatures. This is attributed to the lower humidity levels in the desert regions of Arizona and New Mexico, which reduce L-DAC’s ability to form CO2–solvent complexes in the absence of sufficient water.
For Case 2, the lowest performing location, Miami, Florida, was 15 percent lower than Billings, Montana, which showed the highest gross DAC CO2 capture for S-DAC Cases 2a and 2b, shown in Figure 10b. In contrast to solvent-based systems, which are more effective in hot and humid climates, sorbent-based systems show higher capture efficiency in cooler and relatively drier climates, such as cities in the Rocky Mountain region and certain northern cities. Similar to L-DAC, and as detailed by Sendi et al. [9], humidity impacts S-DAC’s performance more than temperature. This is highlighted in Figure 10b, where cities in the predominantly dry Rocky Mountain region outperform those characterized by very cold temperatures without extreme dryness, such as Fargo, ND.
4.2. Net CO2 Removal
The effectiveness of DAC in acting as a NET depends on multiple variables in addition to DAC technology performance, including direct emissions from the energy source powering the facility (if applicable) and any upstream emissions, among others. Figure 11 shows the regional variations of the net CO2 removed for all the cases. A positive value signifies net carbon removal (a and b) while a value of ≤0 indicates no benefit or, even worse, a net CO2 addition (c). The net tonnage of CO2 removed was generally lower than the gross CO2 captured by 20–30 percent for L-DAC Case 1 and S-DAC Case 2a. Comparing Figure 11a,b with Figure 10a,b, the inclusion of a regional variation of upstream emissions from NG changes the relative attractiveness of cities for Case 1 and Case 2a.
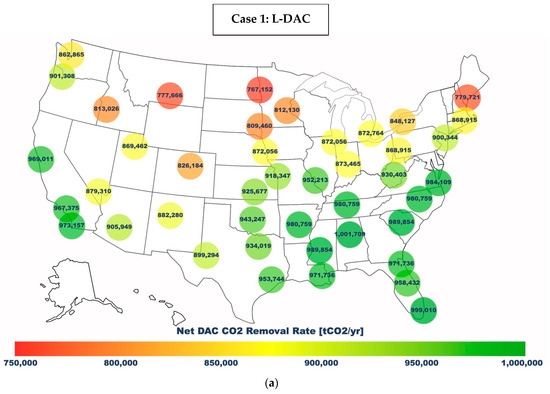
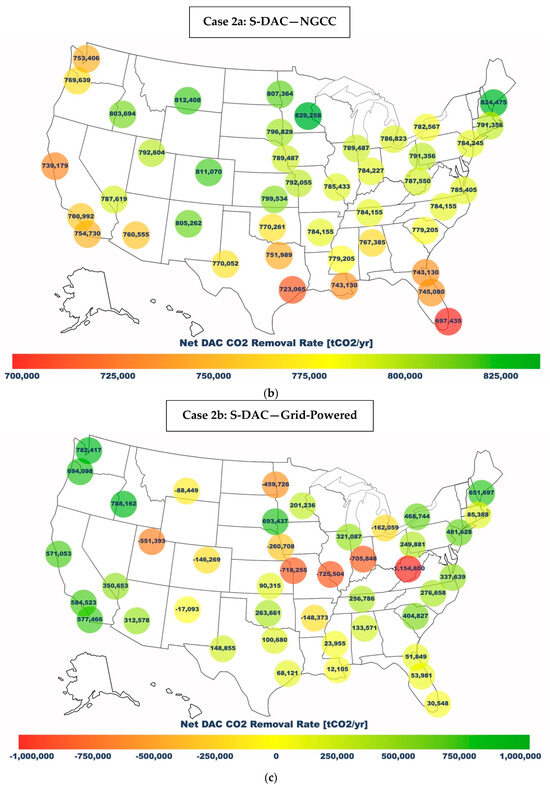
Figure 11.
Comparative annual estimated net DAC CO2 removal rates (tCO2/yr) for the three cases considered: (a) Case 1: L-DAC; (b) Case 2a: S-DAC—NGCC; (c) Case 2b: S-DAC—Grid-Powered.
For Case 2b, however, the carbon intensity of the grid can significantly reduce the net CO2 removed. Figure 11c shows that using the present electric grid as a DAC power source is unattractive from a carbon removal perspective in a significant number of cities and highlights the importance of using low-carbon power sources for DAC. With a carbon-intensive source, more CO2 could be released into the atmosphere to power DAC than the facility would be able to capture.
4.3. CO2 T&S Costs
Figure 12 shows the first-year break-even costs for storing CO2 captured by DAC in various saline storage formations throughout the United States. It assumes a constant nominal mass flow rate (MFR) of 1.4 million tonnes per annum (Mtpa) of CO2, which was used to represent the approximate midpoint of regional storage costs for all cities considered. Note, 1.3 Mtpa was the lowest amount of CO2 estimated to be sent to storage (in the study city of Fargo, ND), and 1.55 Mtpa was the highest (in the study city of Miami, FL).
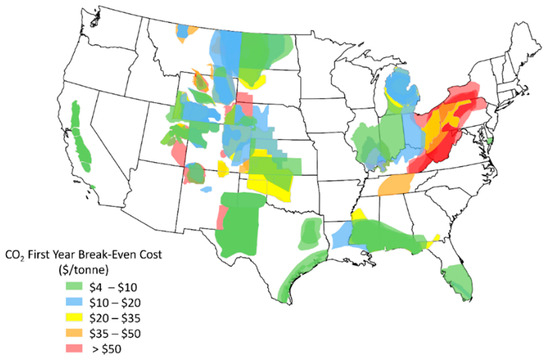
Figure 12.
First year break-even cost of storage for saline storage formations for a nominal flow of 1.4 Mtpa of CO2. Currency is USD.
The T&S costs across different cities for the three cases are shown in Figure 13, with combined costs ranging from USD 10 to USD 50 per tonne of CO2 (assuming a constant MFR of 1.4 Mtpa). The variation highlighted in the figure is due to differences in the DAC plants’ proximity to suitable storage basins and the cost of storing CO2 in those basins. Thus, locations found to have the lowest T&S costs were located closest to the basins featuring the lowest storage expenses. Specifically, siting DAC in Indiana, California, and Texas would incur the lowest associated T&S cost while sites in Washington, Arizona, and various northeastern states face much higher T&S costs, reflecting their greater distance from low-cost storage basins.
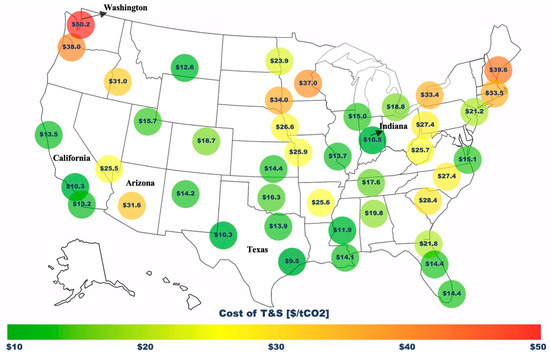
Figure 13.
Cost of carbon T&S (USD/tCO2) for an assumed MFR of 1.4 Mtpa.
4.4. Cost of CO2 Removal (COCR)
The COCRs across the various cities, based on Equation (1), are shown in Figure 14a–c for Cases 1, 2a, and 2b, respectively. The COCR for Case 1 with L-DAC ranges from USD 246 to USD 330 per tonne of CO2 across the United States, which varies by ~±15 percent relative to the NETL study cost of USD 286 per tonne of CO2 for fixed locations and climatic conditions [11]. The southeastern United States and coastal California cities appear to be the most cost-effective regions for L-DAC. While locations with climates favoring higher DAC performance generally exhibit lower COCR, consideration of T&S costs, which is included in the costs of the CO2 capture metric, significantly alters the favorability of certain cities. For example, the COCR for an L-DAC plant in San Francisco, California, is the lowest at USD 246/tonne CO2 among all the cities considered due to its proximity to a cost-effective storage formation, despite its sub-average performance relative to other cities solely from a climate perspective.
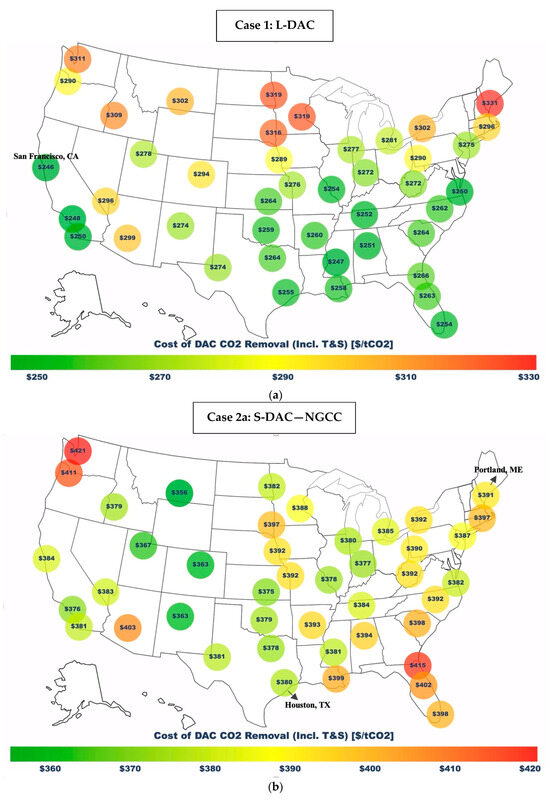
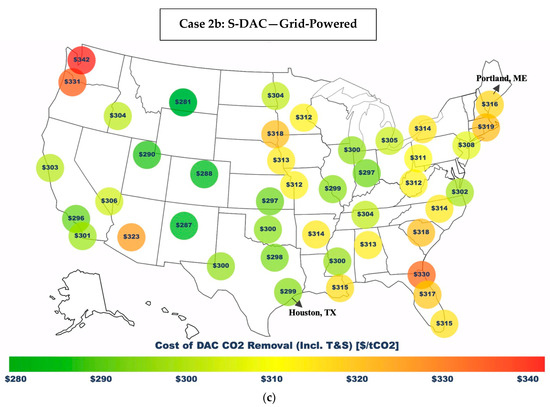
Figure 14.
Comparative estimated cost of DAC CO2 removal (USD/tCO2) for the three cases considered. (a) Case 1: L-DAC; (b) Case 2a: S-DAC—NGCC; (c) Case 2b: S-DAC—Grid-Powered.
The COCRs for the S-DAC cases shown Figure 14b,c range from approximately USD 500 to USD 700 per tonne of CO2 for Case 2a and USD 600 to USD 740 per tonne of CO2 for Case 2b, differing from the static estimates in the NETL study by ~±15 percent [12]. Similar to Case 1, favorable climate conditions generally correlate with lower sorbent-based DAC capture costs, with exceptions. Due to their relatively higher T&S costs, Portland, Maine-based S-DAC plants, despite exhibiting high performance due to favorable climate conditions, result in a COCR value that is near the higher end of the spectrum. Conversely, Houston, Texas, despite its warm, humid climate with low suitability for S-DAC, achieves a lower COCR than other cities with similar climates. This is due to its advantageous location directly above a low-cost storage basin, as depicted in Figure 14b,c.
Sensitivity Analysis: CO2 Concentration
Although the performance of the three DAC technologies presented assumes operation at a fixed ambient CO2 concentration, the literature has shown significant variability in ambient CO2 concentration between highly populated urban areas and less populated rural areas during some periods [35,36,37].
Initial sensitivity analysis suggests that placing DAC in locations with higher ambient CO2 concentration relative to the baseline site is tantamount to a performance increase and, consequently, decreases the COCR. The white line depicted in Figure 15 represents a threshold curve along which the COCR stays constant (at the baseline level) at different combinations of DAC performance relative to the baseline site and the ambient CO2 concentration. For example, a DAC system that operates at approximately 85 percent of the baseline capture rate can achieve the same baseline site COCR if placed in a location with a CO2 concentration of 500 ppm (such as an urban area). At a given ambient CO2 concentration, any DAC system performance relative to the baseline site that is above the threshold curve results in a lower COCR value than the baseline site values.
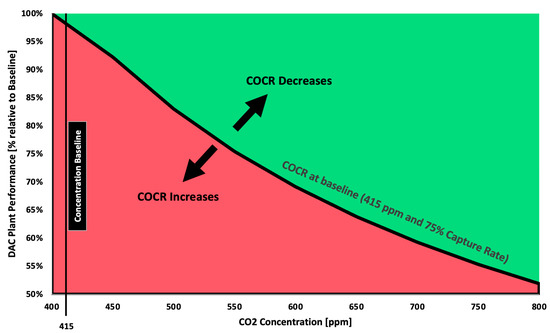
Figure 15.
Impact of concentration on COCR.
This preliminary analysis highlights the need for a proper sensitivity analysis to be conducted before a conclusion can be made regarding how CO2 concentration affects DAC performance.
4.5. DAC Favorability Index
The techno-economic score, S1, used in the computation of the DAC favorability index in Equation (4) is directly proportional to the COCR results. Figure 16 shows the other components of the favorability index—the score for policy, S2, and the market score, S3—based on data presented in Figure 8 and Figure 9.
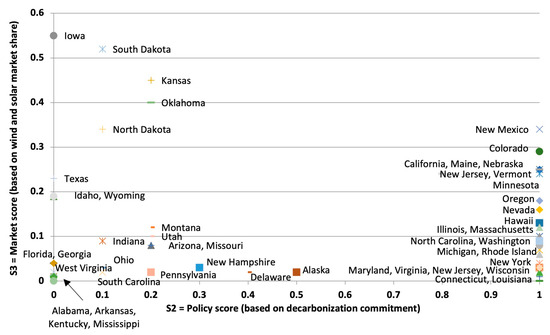
Figure 16.
Policy and market score for 50 states and the District of Columbia used to develop the DAC favorability index.
Case 2b fared poorly on its effectiveness to remove a net-positive amount of CO2 from the atmosphere (see Figure 11) and was accordingly precluded from the favorability index calculations. The composite favorability index, shown in Figure 17a,b, for L-DAC Case 1 and Case 2a, respectively, shows that the state-level policy commitments to decarbonization and the state’s willingness to adopt newer technologies can significantly influence the feasibility and overall success of DAC deployment. Based on this, a comparative assessment of favorability of L-DAC and S-DAC technologies is shown in Figure 18. The Rocky Mountain and several northern and midwestern locations are significantly more favorable to S-DAC system deployments, while the Southeast and Pacific regions are more suited to L-DAC plants. DAC deployment in cities such as Omaha, Nebraska; Houston, Texas; and Providence, Rhode Island, are agnostic to the technology type.
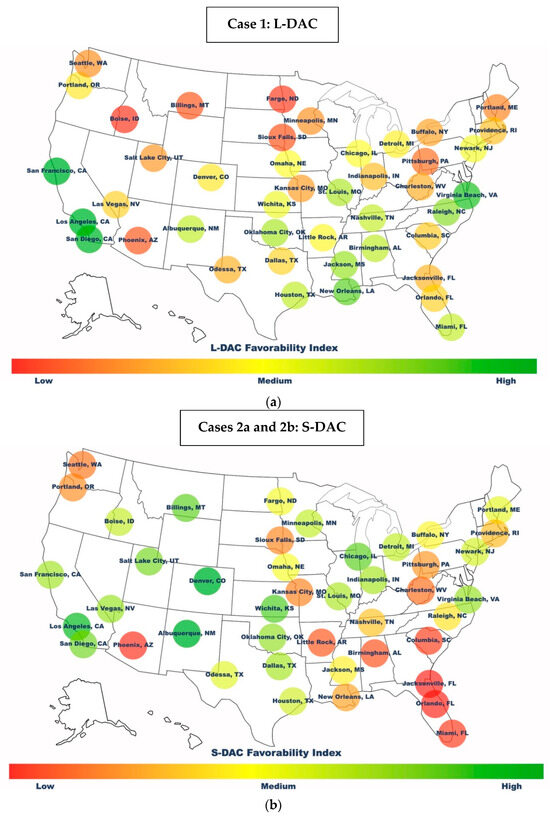
Figure 17.
Composite favorability index for (a) L-DAC Case 1 and (b) S-DAC Cases 2a and 2b.
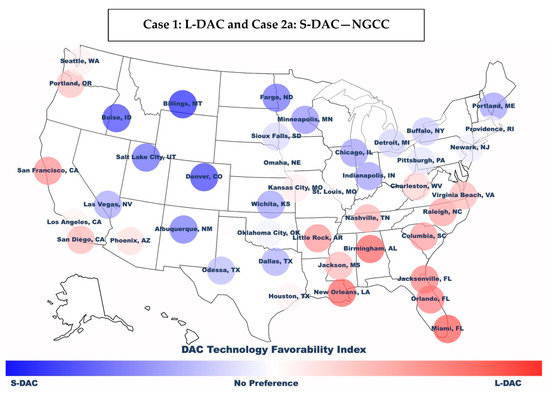
Figure 18.
Comparative assessment of overall favorability by technology type (L-DAC and S-DAC) with a NGCC power source. This comparative assessment includes Case 1 and Case 2a, as both use NGCC as the power source. Case 2b is excluded due to the difficulty in directly comparing NGCC-related emissions with grid-related emissions.
5. Discussion
Current data suggest that the global market value for DAC in 2030 may reach more than USD 1.7 billion from the 2023 revenues of USD 62 million [38]. The three companies with the most developed DAC technologies currently include Climeworks, Carbon Engineering, and Global Thermostat [5], and, despite many new companies entering the field, all currently develop their facilities using one of two materials: either a solvent or a sorbent-based capture system. As of January 2024, IEA reports 27 DAC plants deployed around the world, capturing a total of about 10,000 tCO2 per year (or almost 0.01 MtCO2/year) [39], which amounts to just under 0.00010 percent of the CO2 that must be removed annually to meet the net-zero emissions goal by 2050. However, Carbon Engineering is currently developing a solvent-based DAC plant with the capacity to capture up to 1 MtCO2/year (1,000,000 tonnes per year) in the southwestern United States, which is expected to be operational in late 2024 [5]. Over 130 industrial-scale projects are also underway worldwide, with most being in the planning phase [39]. Several new plants are under development driven in large part by the Department of Energy’s efforts following the enactment of the Bipartisan Infrastructure Law, including the Regional Direct Air Capture Hubs program. Examples of the DAC projects being planned in the United States are listed in Appendix A, Table A1, and include the DAC technology provider, plant location, DAC technology, and capture capacity [40].
Optimal DAC siting to ensure maximum impact with preferred economics is extremely relevant to the ongoing energy transition period, especially given the scale of the projected investment in carbon removal technologies to support global decarbonization. The present study, which represents an initial foray into DAC siting optimization, already shows that there can be significant regional variations in the performance and cost of DAC technologies and their effectiveness as NETs. Average temperature and humidity were used to evaluate DAC performance under different conditions; however, diurnal and seasonal climatic variations could introduce additional complexities to DAC design and siting. Another aspect that could contribute to DAC siting decisions is the potential variation in CO2 concentration between rural and urban areas, which could affect the performance of both L-DAC and S-DAC technologies. A preliminary analysis showed that performance reductions of almost 50 percent in locations where CO2 concentrations could exceed 800 ppm could be tolerated without an increase in COCR. Siting DACs in locations with higher CO2 concentrations not only has the potential for improved operational efficiencies but also potential energy justice benefits; further study could determine the impact of CO2 reduction on air quality; however, data on the impact of CO2 at higher concentrations on the performance L-DAC and S-DAC are needed for further investigation.
The use of existing NGCC plants to power DAC could be beneficial to the overall COCR and serve as a potential repurposing of assets that would have otherwise been retired and as an aid in the continued support of local economies affected by decarbonization. Further, the use of alternative low-carbon technology power sources such as renewables and nuclear was not explored in this study. These introduce still other regional dimensions into DAC siting considerations including solar and wind corridors, availability of energy storage, and proximity to a nuclear power generator.
The study highlighted that the favorability of siting DAC is also dependent on the regional policy and market vagaries of the region. The analysis based on the scoring methodology described in this paper clearly shows that there are distinct U.S. regions that could favor S-DAC or L-DAC plants. While national policies and incentives can affect the overall economics of a DAC plant, market mechanisms such as regional compliance markets and voluntary carbon offset markets can significantly affect DAC siting considerations. Only a qualitative discussion of these market mechanisms was provided in the current study; further studies are intended to include these aspects as they mature, and other non-technological factors would provide guidance to the stakeholders and policymakers in promulgating effective policies in addition to making informed research and development investments.
6. Conclusions
This paper analyzed the annual cost of CO2 removal utilizing DAC technologies across 71 continental U.S. cities and presented a comprehensive multi-factor comparative economic analysis of the deployment of DAC facilities across selected cities in the United States. The analysis evaluated the performance and costs of both types of DAC under various factors: diverse climate conditions, energy sources, regional carbon intensity of the grid, upstream natural gas sourcing emissions, and detailed carbon T&S considerations. Beyond the techno-economic analysis, the influence of market dynamics and regulatory policies on the strategic deployment of DAC was also explored. A weighted composite favorability index combining techno-economic performance with market and policy drivers was developed to provide a quantitative metric to evaluate the potential for siting DAC.
The results clearly show regional variation in the cost of CO2 removal across U.S. cities and that considering only technical performance in DAC siting could result in economically sub-optimal choices. CO2 T&S cost, with its ability to modulate the regional variations in CO2 removal cost depending on proximity to a storage formation, was found to be a pivotal consideration in DAC siting. The negative implications of using the current carbon-intensive electricity grid underscored the importance of using low-carbon sources to ensure that DAC is effective as a carbon removal technology. The study highlighted that regional policies and market fluctuations are critical factors as well, and the study clearly shows that there are distinct U.S. regions that could favor one DAC technology over another.
Optimal DAC siting to ensure maximum impact with preferred economics is extremely relevant to the ongoing energy transition, especially given the scale of the projected investment in carbon removal technologies to support global decarbonization. This study represents a first step in providing stakeholders and industrial developers with guidance on DAC siting implications. Further studies are required to elucidate the role of factors such as varying CO2 concentrations, usage of the entire range of existing assets—both dispatchable as well as intermittent renewables—to power DAC, evolving carbon market mechanisms, and energy justice considerations on DAC siting.
Author Contributions
Conceptualization, J.B., I.P.C. and A.K.S.I.; methodology, J.B. and I.P.C.; software, J.B.; validation, J.B. and I.P.C.; formal analysis, J.B. and I.P.C.; investigation, J.B, I.P.C. and S.S.; resources, J.B.; data curation, J.B. and S.S.; writing—original draft preparation, J.B., I.P.C., S.S., C.Z. and A.K.S.I.; writing—review and editing, J.B., I.P.C., S.S., C.Z. and A.K.S.I.; visualization, J.B., I.P.C. and C.Z.; supervision, I.P.C.; project administration, I.P.C. and A.K.S.I. All authors have read and agreed to the published version of the manuscript.
Funding
This research was funded by the Department of Energy (SA/23CFE000075).
Data Availability Statement
The data presented in this study may be available on request from the corresponding author. The data are not publicly available due to privacy.
Acknowledgments
We acknowledge the support and guidance provided by C. Nichols and T. Fout from NETL and DOE.
Conflicts of Interest
The authors declare no conflicts of interest. The funders had no role in the design of the study; in the collection, analyses, or interpretation of data; in the writing of the manuscript; or in the decision to publish the results.
Disclaimer
This project was funded by the Department of Energy, the National Energy Technology Laboratory, an agency of the United States Government, through a support contract. Neither the United States Government nor any agency thereof, nor any of their employees, nor the support contractor, nor any of their employees, makes any warranty, express or implied, or assumes any legal liability or responsibility for the accuracy, completeness, or usefulness of any information, apparatus, product, or process disclosed, or represents that its use would not infringe privately owned rights. Reference herein to any specific commercial product, process, or service by trade name, trademark, manufacturer, or otherwise does not necessarily constitute or imply its endorsement, recommendation, or favoring by the United States Government or any agency thereof. The views and opinions of authors expressed herein do not necessarily state or reflect those of the United States Government or any agency thereof.
Appendix A

Table A1.
Examples of planned U.S. DAC projects.
Table A1.
Examples of planned U.S. DAC projects.
| Project Name | DAC Provider | Location | Technology | Capacity (Tonnes/Year) | Entities | Status |
|---|---|---|---|---|---|---|
| Heirloom Carbon Technologies | Heirloom Carbon Technologies | Tracy, CA | Solvent and sorbent | 1000 | Heirloom, CarbonCure Technologies, Breakthrough Energy Ventures | Operating  [41] [41] |
| Farley DAC Project | AirCapture LLC | Columbia, AL | Sorbent | 5000 | Battelle, Southern Company | Planning  [40] [40] |
| University of Illinois | Climeworks | Brawley, CA | Sorbent | 5000 | University of Illinois | Planning  [40] [40] |
| Constellation | Carbon Engineering | Byron, IL | Solvent | 5000 | Constellation, Carbon Engineering | Planning  [40] [40] |
| University of Illinois | CarbonCapture | Gary, IN | Sorbent | 5000 | University of Illinois, CarbonCapture Inc., CarbonCure | Planning  [40] [40] |
| Nutrien’s Kennewick Fertilizer | AirCapture LLC | Kennewick, WA | Sorbent | 5000 | AirCapture LLC, Nutrien | Planning  [40] [40] |
| Project Monarch | Capture6 | Palmdale, CA | Solvent (saltwater) | Pilot | Capture6, Palmdale Water District | Planning  [42] [42] |
| Southwest Regional Direct Air Capture Hub | CarbonCapture | Phoenix, AZ | Sorbent | 1 million | Arizona State Univ., Black & Veatch, Carbon Collect, CarbonCapture, Carbon Solutions, Proton Green, Univ. of New Mexico, Univ. of Utah, Tallgrass, Arizona Geological Survey | Planning  [43] [43] |
| CalHub | Climeworks | Kern County, CA | Sorbent | 1 million | EPRI, California Resources Corporation, Climeworks, Avnos, SoCalGas, Kern Com College District, NREL LLNL, Univ. of Michigan, Cal. State Univ., Bakersfield | Planning  [42] [42] |
| Southeast DAC Hub | AirCapture LLC | Peachtree Corners, GA | Sorbent | 1 million | Southern States Energy Board, Alabama Power Company | Planning  [42] [42] |
| Project Cypress | Climeworks, Heirloom | Calcasieu Parish, LA | Sorbent | 1 million | Battelle, Climeworks Corporation, Heirloom Carbon Technologies | Planning  [44] [44] |
| Prairie Compass DAC Hub | Climeworks | Grand Forks, ND | Sorbent | 1 million | University of North Dakota Energy & Environmental Research Center | Planning  [42] [42] |
| South Texas DAC Hub | Carbon Engineering | King Ranch, Kleberg County, TX | Solvent | 1 million | 1PointFive | Planning  [44] [44] |
| Wyoming Regional Direct Air Capture Hub Project Bison | CarbonCapture | Sweetwater County, WY | Sorbent | 200,000 | Carbon Capture Inc., Frontier Carbon Solutions, Twelve, Univ. of Wyoming, Fluor, Carbon Direct, INTERA, EPRI, Carbon-Based Consulting, Icarus, Novus Energy Advisors | Planning  [42] [42] |
| Stratos DAC Project | Carbon Engineering | Permian Basin, TX | Solvent | 500,000 | Oxy/1PointFive, BlackRock | Under construction [33] |

Table A2.
Upstream natural-gas-emission intensity summary by delivery region (gCO2/MJ).
Table A2.
Upstream natural-gas-emission intensity summary by delivery region (gCO2/MJ).
| Region of Consumption | 2.5% Confidence Interval | Average Case | 97.5% Confidence Interval |
|---|---|---|---|
| Pacific (PA) | 7.2 | 12.2 | 18.9 |
| Rocky Mountain (RM) | 5.2 | 8.6 | 13.2 |
| Southwest (SW) | 6.9 | 11.7 | 17.8 |
| Southeast (SE) | 6.4 | 9.8 | 14.1 |
| Midwest (MW) | 6.8 | 10.9 | 16.1 |
| Northeast (NE) | 4.6 | 6.7 | 9.4 |
| U.S. Average | 7.2 | 10.8 | 15.4 |
Data source: Littlefield et al. [17].
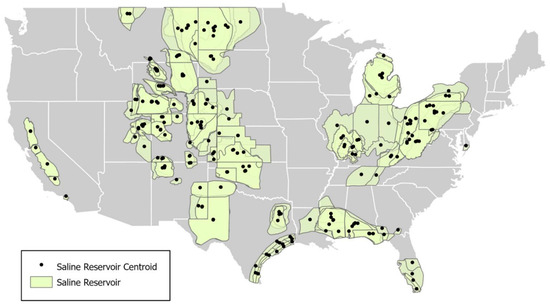
Figure A1.
Map of 319 saline reservoirs in FE/NETL CO2 Saline Storage Cost Model (2017) geologic database. Source: NETL [18,19].
Transport costs, on a per-tonne basis, change significantly based on the amount of CO2 being transported due to the sizing of the transportation infrastructure and economies of scale. Similarly, CO2 storage also benefits from economies of scale, and costs vary depending upon the amount of CO2 being stored. The T&S Tool results are shown in Figure A2. A red line links the DAC with what the T&S Tool estimated to be the most economic storage location (if the line is not visible, the source and the sink are located together).
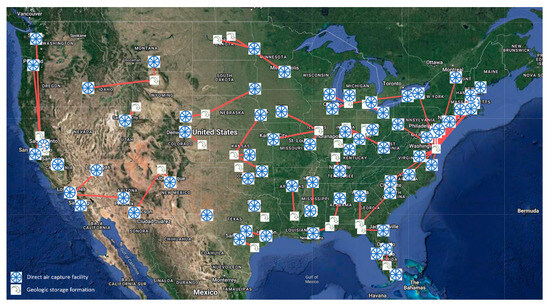
Figure A2.
Hypothetical T&S infrastructure for potential DAC facilities across the U.S. (71 cities). Map created using [45].
Appendix B. Correlation Analysis for Proxy Variables in Feasibility Index
There is a significant correlation between the number of decarbonization policies (listed by [31] by March 2024) and the level of decarbonization commitment (data from [32]) across the 50 U.S. states, plus the District of Columbia. The data used and correlation coefficient are shown in Table A3.

Table A3.
Decarbonization commitment and number of decarbonization-related policies and incentives by state.
Table A3.
Decarbonization commitment and number of decarbonization-related policies and incentives by state.
| State | V1 = Decarbonization Commitment by a Future Year [32] | V2 = Number of Decarbonization-Related Policies and Incentives by State [31] |
|---|---|---|
| California | 100% | 154 |
| Colorado | 100% | 98 |
| Connecticut | 100% | 50 |
| Hawaii | 100% | 31 |
| Illinois | 100% | 65 |
| Louisiana | 100% | 22 |
| Maine | 100% | 27 |
| Maryland | 100% | 74 |
| Massachusetts | 100% | 80 |
| Michigan | 100% | 48 |
| Minnesota | 100% | 132 |
| Nebraska | 100% | 19 |
| Nevada | 100% | 28 |
| New Jersey | 100% | 50 |
| New Mexico | 100% | 40 |
| New York | 100% | 95 |
| North Carolina | 100% | 68 |
| Oregon | 100% | 100 |
| Rhode Island | 100% | 29 |
| Virginia | 100% | 45 |
| Washington State | 100% | 81 |
| Washington, DC | 100% | 51 |
| Wisconsin | 100% | 49 |
| Vermont | 80% | 72 |
| Alaska | 50% | 17 |
| Delaware | 40% | 31 |
| New Hampshire | 25% | 43 |
| Kansas | 20% | 12 |
| Utah | 20% | 27 |
| Pennsylvania | 18% | 61 |
| Arizona | 15% | 51 |
| Missouri | 15% | 60 |
| Montana | 15% | 25 |
| Oklahoma | 15% | 31 |
| Indiana | 10% | 60 |
| North Dakota | 10% | 14 |
| South Dakota | 10% | 19 |
| Texas | 10% | 114 |
| Ohio | 9% | 39 |
| South Carolina | 2% | 39 |
| Alabama | 0% | 19 |
| Arkansas | 0% | 29 |
| Florida | 0% | 72 |
| Georgia | 0% | 35 |
| Idaho | 0% | 32 |
| Iowa | 0% | 46 |
| Kentucky | 0% | 25 |
| Mississippi | 0% | 21 |
| Tennessee | 0% | 15 |
| West Virginia | 0% | 8 |
| Wyoming | 0% | 19 |

Table A4.
The Pearson correlation analysis of V1 and V2.
Table A4.
The Pearson correlation analysis of V1 and V2.
| Value | |
|---|---|
| Pearson’s R | 0.42 |
| Number of pairs | 51 |
| Degrees of freedom | 49 |
| T-value (2-tailed) | 3.204467 |
| Determination of significance (p-value) | 0.002381 |
References
- IPCC. Climate Change: A Threat to Human Wellbeing and Health of the Planet. Taking Action Now Can Secure Our Future. Available online: https://www.ipcc.ch/2022/02/28/pr-wgii-ar6/ (accessed on 5 February 2024).
- IPCC. Chapter 4: Sea Level Rise and Implications for Low-Lying Islands, Coasts and Communities—Special Report on the Ocean and Cryosphere in a Changing Climate. Available online: https://www.ipcc.ch/srocc/chapter/chapter-4-sea-level-rise-and-implications-for-low-lying-islands-coasts-and-communities/ (accessed on 5 February 2024).
- Hilaire, J.; Minx, J.C.; Callaghan, M.W.; Edmonds, J.; Luderer, G.; Nemet, G.F.; Rogelj, J.; del Mar Zamora, M. Negative emissions and international climate goals—Learning from and about mitigation scenarios. Clim. Chang. 2019, 157, 189–219. [Google Scholar] [CrossRef]
- Realmonte, G.; Drouet, L.; Gambhir, A.; Glynn, J.; Hawkes, A.; Köberle, A.C.; Tavoni, M. An inter-model assessment of the role of direct air capture in deep mitigation pathways. Nat. Commun. 2019, 10, 3277. [Google Scholar] [CrossRef] [PubMed]
- U.S. Climate Policy Resource Center: Direct Air Capture. World Resour. Inst. Available online: https://www.wri.org/us-climate-policy-implementation/sectors/direct-air-capture (accessed on 5 February 2024).
- McQueen, N.; Gomes, K.V.; McCormick, C.; Blumanthal, K.; Pisciotta, M.; Wilcox, J. A review of direct air capture (DAC): Scaling up commercial technologies and innovating for the future. Prog. Energy 2021, 3, 032001. [Google Scholar] [CrossRef]
- Carbon Removal. World Resour. Inst. 2023. Available online: https://www.wri.org/initiatives/carbon-removal (accessed on 5 February 2024).
- An, K.; Farooqui, A.; McCoy, S.T. The impact of climate on solvent-based direct air capture systems. Appl. Energy 2022, 325, 119895. [Google Scholar] [CrossRef]
- Sendi, M.; Bui, M.; Mac Dowell, N.; Fennell, P. Geospatial analysis of regional climate impacts to accelerate cost-efficient direct air capture deployment. One Earth 2022, 5, 1153–1164. [Google Scholar] [CrossRef]
- Meckling, J.; Biber, E. A policy roadmap for negative emissions using direct air capture. Nat. Commun. 2021, 12, 2051. [Google Scholar] [CrossRef] [PubMed]
- National Energy Technology Laboratory. Direct Air Capture Case Studies: Solvent System. Energy Anal. 2022. Available online: https://netl.doe.gov/energy-analysis/details?id=36385f18-3eaa-4f96-9983-6e2b607f6987 (accessed on 11 January 2024).
- National Energy Technology Laboratory. Direct Air Capture Case Studies: Sorbent System. Energy Anal. 2022. Available online: https://www.netl.doe.gov/energy-analysis/details?id=d5860604-fbc7-44bb-a756-76db47d8b85a (accessed on 11 January 2024).
- Carnegie Mellon University’s Scott Institute for Energy Innovation. US Power Sector CO2 Emissions Intensity. CMU Power Sect. Carbon. Index. 2023. Available online: https://emissionsindex.org (accessed on 25 January 2024).
- Keith, D.W.; Holmes, G.; St. Angelo, D.; Heidel, K. A Process for Capturing CO2 from the Atmosphere. Joule 2018, 2, 1573–1594. [Google Scholar] [CrossRef]
- Abramson, E.; McFarlane, D.; Jordan, A.; Rodriguez, D.; Ogland-Hand, J.; Holwerda, N. An Atlas of Direct Air Capture: Opportunities for Negative Emissions in the United States; Carbon Solutions: Chicago, IL, USA, 2023. [Google Scholar]
- Song, Y.; Oh, C. Market-pull, technology-push, and regulatory stringency determinants: All in need in firms’ decisions for large-scale demonstration of direct air capture technologies. Energy Res. Soc. Sci. 2023, 106, 103339. [Google Scholar] [CrossRef]
- Littlefield, J.; Rai, S.; Skone, T.J. Life Cycle GHG Perspective on U.S. Natural Gas Delivery Pathways. Environ. Sci. Technol. 2022, 56, 16033–16042. [Google Scholar] [CrossRef] [PubMed]
- Morgan, D.; Guinan, A.; Sheriff, A. FECM/NETL CO2 Transport Cost Model Version 4 (2023); National Energy Technology Laboratory (NETL): Pittsburgh, PA, USA, 2023.
- Morgan, D.; Grant, T. FE/NETL CO2 Saline Storage Cost Model (2017); National Energy Technology Laboratory (NETL): Pittsburgh, PA, USA, 2017.
- U.S. Department of Health and Human Services. Inflation Reduction Act of 2022; U.S. Department of Health and Human Services: Washington, DC, USA, 2022.
- California Air Resources Board. Monthly LCFS Credit Transfer Activity Report for December 2023; California Air Resources Board: Riverside, CA, USA, 2023.
- California Legislative Analyst’s Office. California’s Cap-and-Trade Program: Frequently Asked Questions. Available online: https://lao.ca.gov/Publications/Report/4811 (accessed on 11 January 2024).
- California Air Resources Board. Auction Information. Available online: https://ww2.arb.ca.gov/our-work/programs/cap-and-trade-program/auction-information (accessed on 11 January 2024).
- The Regional Greenhouse Gas Initiative. RGGI, Inc. Available online: https://www.rggi.org/ (accessed on 11 January 2024).
- RGGI CO2 Allowance Tracking System. Transaction Price Report. Available online: https://rggi-coats.org/eats/rggi/index.cfm?fuseaction=reportsv2.price_rpt&clearfuseattribs=true (accessed on 11 January 2024).
- State of Washington Department of Ecology. APCR Auction #2 Summary Report—November 2023. Ecology Publications & Forms. Available online: https://apps.ecology.wa.gov/publications/SummaryPages/2302101.html (accessed on 16 January 2024).
- State of Washington Department of Ecology. Cap and Invest Auctions and Market. Available online: https://ecology.wa.gov/air-climate/climate-commitment-act/cap-and-invest/auctions-and-market (accessed on 16 January 2024).
- Woerter, M.; Stucki, T.; Arvanitis, S.; Rammer, C.; Peneder, M. The adoption of green energy technologies: The role of policies in Austria, Germany, and Switzerland. Int. J. Green. Energy 2017, 14, 1192–1208. [Google Scholar] [CrossRef] [PubMed]
- Kemp, R.; Volpi, M. The diffusion of clean technologies: A review with suggestions for future diffusion analysis. J. Clean. Prod. 2008, 16, S14–S21. [Google Scholar] [CrossRef]
- Clean Energy States Alliance. Table of 100% Clean Energy States. Available online: https://www.cesa.org/projects/100-clean-energy-collaborative/guide/table-of-100-clean-energy-states/ (accessed on 6 March 2024).
- DSIRE. Database of State Incentives for Renewables & Efficiency®. DSIRE. Available online: https://www.dsireusa.org/ (accessed on 13 March 2024).
- Anderson, J.; Yin, I.; Watson, M.; Potter, E.; Kotenko, D. S&P Global Commodity Insights: Energy Security in the Spotlight; S&P Global: New York, NY, USA, 2022. [Google Scholar]
- 1PointFive Holds Groundbreaking for World’s Largest Direct Air Capture (DAC) Plant. 1PointFive. Available online: https://www.1pointfive.com/1pointfive-holds-groundbreaking (accessed on 5 March 2024).
- U.S. Climate Normals|National Centers for Environmental Information (NCEI). Available online: https://www.ncei.noaa.gov/products/land-based-station/us-climate-normals (accessed on 5 February 2024).
- George, K.; Ziska, L.H.; Bunce, J.A.; Quebedeaux, B. Elevated atmospheric CO2 concentration and temperature across an urban–rural transect. Atmos. Environ. 2007, 41, 7654–7665. [Google Scholar] [CrossRef]
- CO2 Science, Origin of the Urban CO2 Dome of Paris, France. Available online: http://www.co2science.org/articles/V7/N1/C3.php (accessed on 5 February 2024).
- CO2 Science, The Urban CO2 Dome of Rome. Available online: http://www.co2science.org/articles/V8/N31/C2.php (accessed on 12 March 2024).
- Direct Air Capture Industry 2024. Available online: https://www.marketsandmarkets.com/PressReleases/direct-air-capture.asp (accessed on 1 March 2024).
- IEA. Direct Air Capture—Energy System. Available online: https://www.iea.org/energy-system/carbon-capture-utilisation-and-storage/direct-air-capture (accessed on 5 February 2024).
- Department of Energy. Biden-Harris Administration Announces $3.7 Billion to Kick-Start America’s Carbon Dioxide Removal Industry; Department of Energy: Washington, DC, USA, 2022.
- Department of Energy. A Transformative Low-Cost Approach for Direct Air Mineralization of CO2 via Repeated Cycles of Ambient Weathering of Metal Oxides Resource Efficiency Efficiency; Department of Energy: Washington, DC, USA, 2022.
- Department of Energy. DOE Announces $1 Million Toward Carbon Dioxide Removal Technology Innovation; Department of Energy: Washington, DC, USA, 2023.
- Office of Fossil Energy and Carbon Management. Project Selections for FOA 2735: Regional Direct Air Capture Hubs—Topic Area 1 (Feasibility) and Topic Area 2 (Design); Office of Fossil Energy and Carbon Management: Washington, DC, USA, 2023.
- Department of Energy. Regional Direct Air Capture Hubs Selections for Award Negotiations Office of Clean Energy Demonstrations; Department of Energy: Washington, DC, USA, 2024.
- Google’s My Maps Feature. Google My Maps. Available online: https://www.google.com/maps (accessed on 15 March 2024).
Disclaimer/Publisher’s Note: The statements, opinions and data contained in all publications are solely those of the individual author(s) and contributor(s) and not of MDPI and/or the editor(s). MDPI and/or the editor(s) disclaim responsibility for any injury to people or property resulting from any ideas, methods, instructions or products referred to in the content. |
© 2024 by the authors. Licensee MDPI, Basel, Switzerland. This article is an open access article distributed under the terms and conditions of the Creative Commons Attribution (CC BY) license (https://creativecommons.org/licenses/by/4.0/).