Abstract
Carbon dioxide (CO2) hydrates have garnered significant interest as a promising technology for CO2 capture and storage due to its high storage capacity and moderate operating conditions. The kinetics of CO2 hydrate formation is a critical factor in determining the feasibility of hydrate-based CO2 capture and storage technologies. This study systematically investigates the promotional effects of the amino acid L-tryptophan (L-trp) on CO2 hydrate formation kinetics and morphology under stirred and unstirred conditions. In the stirred system, experiments were conducted in a high-pressure 100 mL reactor with 0.05, 0.10, and 0.30 wt% L-trp solution. CO2 gas uptake kinetics and morphological evolution were monitored using a high-resolution digital camera. Results showed that L-trp promoted CO2 hydrate formation kinetics without delay, with rapid CO2 consumption upon nucleation. Morphological evolution revealed rapid hydrate formation, wall-climbing growth, and dendritic morphology filling the bulk solution. Under unstirred conditions, experiments were performed in a larger 1 L reactor with 0.1 wt% and 0.5 wt% L-trp solutions to assess the influence of additive concentration on hydrate formation thermodynamics and kinetics. Results demonstrated that L-trp influenced both thermodynamics and kinetics of CO2 hydrate formation. Thermodynamically, 0.1 wt% L-trp resulted in the highest hydrate formation, indicating an optimal concentration for thermodynamic promotion. Kinetically, increasing L-trp concentration from 0.1 wt% to 0.5 wt% reduced formation time, demonstrating a proportional relationship between L-trp concentration and formation kinetics. These findings provide insights into the role of L-trp in promoting CO2 hydrate formation and the interplay between additive concentration, thermodynamics, and kinetics. The results can inform the development of effective hydrate-based technologies for CO2 sequestration, highlighting the potential of amino acids as promoters in gas hydrate.
1. Introduction
The capture and storage of CO2 has emerged as a crucial strategy in mitigating the effects of rising atmospheric CO2 levels and addressing global climate change [1]. Among the various CO2 capture and storage technologies being explored, hydrate-based CO2 sequestration (HBCS) has garnered significant attention due to its unique advantages, including high storage capacity, moderate operating conditions, and enhanced safety, compared with conventional methods [2,3,4]. HBCS, particularly in subsea sediments, offers several advantages for long-term CO2 storage [5]. Firstly, CO2 hydrates are thermodynamically stable under suitable pressure and temperature conditions, which are prevalent in deep subsea sediments [6]. This stability ensures the long-term immobilization and storage of CO2 in a solid hydrate form, reducing the risk of leakage or migration. In addition to the physical trapping of CO2 in hydrate form, subsea sediments can provide opportunities for geochemical trapping mechanisms. These include the dissolution of CO2 in pore waters [7,8], mineral carbonation reactions, and the formation of other stable carbonate minerals [9,10,11]. Moreover, CO2 sequestration in hydrate systems holds great technical potential, utilizing thin layers of natural gas hydrate reservoirs as natural sealing caprocks for CO2 storage. In this regard, the injected CO2 can be trapped within the target storage formation, preventing leakage, and subsequently evolve over time into hydrate and dissolved phases [12].
CO2 hydrates are crystalline compounds formed by the encapsulation of CO2 molecules within hydrogen-bonded water cages under specific temperature and pressure conditions [13]. A single cubic meter of hydrate can store approximately 164 cubic meters of CO2 gas at standard temperature and pressure conditions. However, the kinetics of CO2 hydrate formation is often hindered by the inherent stability of the water structure, leading to sluggish nucleation and growth rates, which pose a significant challenge for practical applications [14]. Several promotion methods are used to enhance gas–liquid mass transfer, such as the initial stirring condition [15,16] and the addition of porous media [17,18].
In this context, the use of promoters, or kinetic additives, has emerged as a promising approach to accelerate the hydrate formation process [19,20].
Depending on their operating mechanism, chemical promoting additives are classified in Thermodynamic Hydrate Promoters (THPs) and Kinetic Hydrate Promoters (KPHs). THPs make the formation and stability of hydrates feasible at higher temperatures and/or lower pressures than those describing the phase boundary equilibrium conditions of the various hydrate species. Differently, KHPs are capable of reducing the induction period and enhancing the growth rate of hydrates. The most widespread promoters are tetrahydrofuran and sodium dodecyl sulfate, which respectively act on the process thermodynamics and kinetics [21,22]. Some additives, as tetrahydrofuran, cyclobutanone, and cyclohexanone, promote the formation process by leading to the formation of sII hydrates, thus creating a crystalline structure having higher gas density and milder forming conditions than sI [23,24]. Other species, as TBA-Halides, lead to the formation of semiclathrates and are widely used in cold storage and gas separation processes [25,26].
Depending on the specific species involved in the process, chemical promoters find advantaging application in all the hydrate-based processes. However, these substances are often poisoning the environment, corrosive, and expensive mainly due to availability problems. For that reason, the research on environmentally sustainable promoters is continuously expanding. Halogen-free semiclathrates were produced and tested in terms of biocompatibility [27]; bio-based chemicals, derived from potato starch and glycolipid-type surfactants and others, were explored to enhance the production of hydrates [28].
In this sense, amino acids represent a promising opportunity for eco-friendly and costless hydrate promotion. Amino acids consist of the building blocks of proteins and contain carboxylic acid (-COOH), amine group (-NH2), and a variable in length side chain, which, depending on the specific amino acid, can be hydrophobic or hydrophilic [29]. Amino acids can act both as promoters and inhibitors for gas hydrates. In particular, the side chain is the most relevant element to determine the role of the specific amino acid on the process [30]. Amino acids are completely biodegradable and less expensive than conventional promoters; moreover, they have no impact in terms of corrosivity, thus being very competitive for applications related to the gas transportation sector [31].
Amino acids can act both as promoters and inhibitors during the production of hydrates. Arginine, histidine, hexylamine, and norvaline were proved to be good kinetic promoters for gas hydrates [14,32,33]. Conversely, proline, valine, alanine, and glycine were described as thermodynamic inhibitors for the process [34,35].
Among the various promoters investigated, amino acids have gained considerable interest due to their ability to disrupt the hydrogen bonding network of water molecules, thereby facilitating the nucleation and growth of hydrates [14,36,37]. Hydrophobic amino acids, such as L-met and L-tryptophan, have been studied for their potential to enhance the formation kinetics of CO2 hydrates [38,39]. While the promoting effect of these additives is already provided, the entity and modality of such a promotion need to be further experimentally investigated to be definitively characterized.
The present study investigates the role of L-tryptophan on the formation of CO2 hydrates. For the scope, CO2 hydrates were formed in aqueous solutions having a different concentration of the additive. The experiments were carried out in different lab-scale apparatuses, differing from each other with respect to volume, size, and constituent materials. Moreover, the experiments were carried out in both stirred and unstirred conditions to distinguish the promoting effect due to L-tryptophan from the kinetic promotion associated with the agitation system.
2. Materials and Methods
Carbon dioxide hydrates were formed at stirred and unstirred conditions, and, for each condition, specific L-tpr concentrations were selected. In detail, in case of stirring, hydrates were formed instead.
2.1. Study 1: CO2 Hydrate Kinetics and Morphological Observation under Stirring Condition
2.1.1. Materials
CO2 (99.8 mol%) was purchased from Shenzhen Huatepeng Special Gas Co. Ltd. (Shenzhen, China). L-tryptophan (L-trp, ≥99.0%) was purchased from Shanghai Aladdin Bio-Chem Technology Co. Ltd. (Shanghai, China). Ultrapure deionized water was prepared in the laboratory.
2.1.2. Apparatus
Figure 1 provides an overview of the experimental setup used to conduct the kinetic experiments in this study. The setup consists of a high-pressure CO2 hydrate reactor made of quartz glass with a total volume of 100.0 mL. A needle valve is located at the top of the reactor for CO2 gas injection. Real-time pressure and temperature data are recorded using SENEX pressure sensors and a Pt-100 type thermocouple (by Senex, Guangzhou, China).
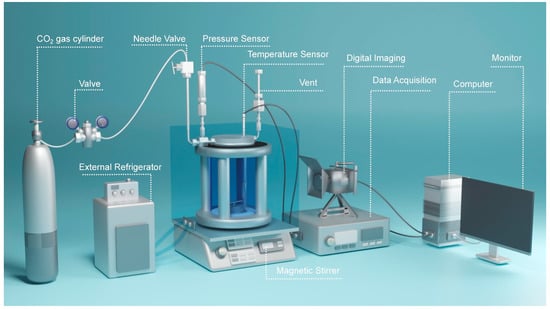
Figure 1.
Schematic diagram of the experimental setup and the high-pressure reactor with full visualization.
To maintain precise temperature control during the experiments, the reactor is immersed in a transparent acrylic water bath connected to a circulating cooler with a temperature range of 263.2–373.2 K.
Continuous data acquisition is used to monitor pressure and temperature changes throughout the experiments. A high-resolution digital camera (model MZL-DJ630) is used to capture images of the morphology of the CO2 hydrate. A magnetic stirrer is used at the bottom of the reactor with variable stirring speeds of 600 rpm. More details can be found in our previous study [40,41].
2.1.3. Procedure
Firstly, the reactor is cleaned and dried. The stirrer and L-trp solution are loaded inside. Then, the reactor is put into the water bath and cooled to T = 293.2 K. CO2 gas is injected to 4.5 MPa after purging the reactor three times. After a CO2 hydrate dissolution period for 6 h, the reactor is cooled to 273.2 K at a rate of 0.05 K/min. The magnetic stirrer is turned at a speed of 600 rpm. Two repeated experiments are conducted for each set of conditions investigated in this study. P and T signals are recorded at 5 s intervals throughout the procedure. The real-time morphological evolution of CO2 hydrate is recorded every 10 s. A detailed description of the procedure can be found in our previous publications [41].
The induction time (tind) is the period between the time when measured P-T first crossed the CO2 hydrate phase equilibrium (teq) and the time when the first CO2 hydrate crystal was observed (tn). The calculation of CO2 gas uptake during CO2 hydrate formation should consider the solubility of CO2 in aqueous solution. The normalized CO2 gas uptake in the hydrate phase is calculated to better evaluate the gas storage capacity of CO2 hydrate and the kinetics of CO2 hydrate formation [42]. Figure 2 shows typical P-T trajectory and P and T evolution curves during CO2 hydrate formation and dissolution at CL-trp = 0.05 wt%. CO2 hydrate formation is under the continuous stirring condition, as described in our previous study.
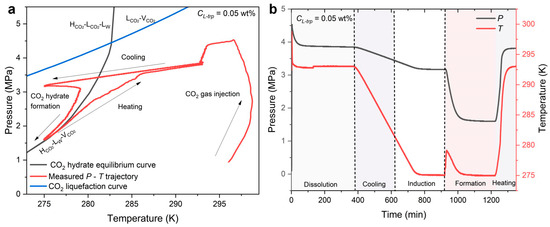
Figure 2.
(a) Measured P-T trajectory in relation to the CO2 hydrate phase equilibrium curve and the CO2 liquefaction curve. (b) P, T evolution during the experimental process.
2.2. Study 2: CO2 Hydrate Kinetics and Morphological Observation in the Static System
2.2.1. Apparatus
The experiments were carried out in a lab-scale apparatus, consisting of a 3166SS cylindrical reactor (by Metalserbatoi, Perugia, Italy), having an internal volume equal to one liter, the related sensors and pipes to connect the system to the gas cylinders, and a cooling room for the regulation of temperature. The experimental apparatus is visible in Figure 3, together with a schematization of it.
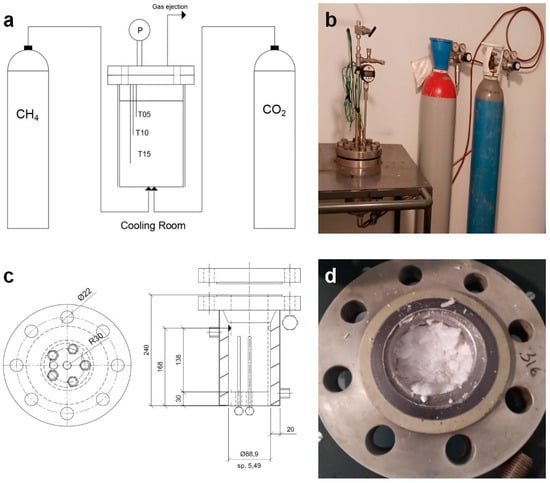
Figure 3.
(a) Measures and technical details of the 316SS lab-scale reactor used for the production of hydrates, (b) picture of the experimental system, (c) schematization (at left) and pictures (at right) of the experimental apparatus, and (d) picture of the reactor.
The upper section of the reactor is closed with a flange, which can be easily opened to inspect the internal volume and to withdraw samples of hydrates. To ensure the tightness of the system, between the two plates of this flange, a mono-use spiro-metallic gasket (model DN8U PN 10/40 316-FG C8 OR, by Tecnotubi, Terni, Italy) was inserted. CO2 was injected from the bottom. As visible in Figure 3a, the reactor can be contemporary connected with two cylinders. Such a possibility is particularly useful when the process is carried out with gaseous mixtures or during replacement tests. Here, only CO2 was used, and both the channels were connected to the same cylinder. The gas cylinders were inserted within the cooling room, together with the reactor, to avoid the occurrence of internal temperature gradients during the gas injection phase.
The internal pressure and temperature were constantly monitored, and the related sensors were installed in correspondence of the flange. Temperature was detected with three Type K thermocouples, having class accuracy one. The thermocouples were positioned at different depths or 5, 10, and 15 cm far from the upper flange (see Figure 3a) to verify the constancy of temperature over time. In the absence of internal gradients, the sensors measure the same temperature, and a sole value is consequently used for the discussion of results. A digital manometer, model MAN-SD (by Kobold, Milano, Italy), having accuracy equal to ± 0.5% of full scale, was employed for pressure. Finally, the flange also hosts a safety valve (model E10 LS/150by Nuova General Instruments, Campasso, Italy) and a gas ejection channel, which can be used for the rapid ejection of the gaseous phase and the withdrawal of gaseous samples during experiments [43]. Measures and technical details of the reactor are provided in Figure 3b.
As visible in Figure 3c, the reactor is equipped with an integrated coil, which can be used when high and fast subcooling is required. All the sensors are finally connected to a data acquisition system (by National Instrument, Austin, TX, USA) and managed in LabView (2024 Q3).
More details, about the present experimental apparatus and the instrumentation installed on it, are available elsewhere in the literature [44,45]. The materials used are the same as those described in our previous study.
2.2.2. Procedure
CO2 was injected within the reactor at temperatures elevated enough to completely avoid the production of hydrates during this step. The injection channels were then closed, and the reactor started working in batch conditions. During the formation phase, the internal temperature was gradually lowered. Its decreasing trend can be inferred from Figure 4.
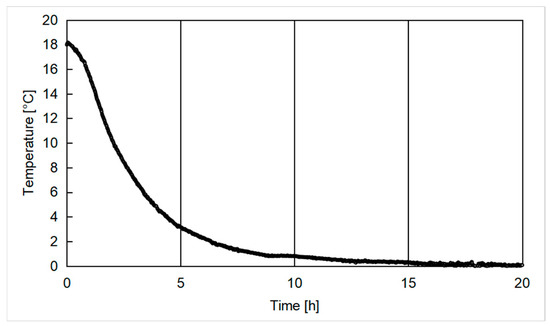
Figure 4.
Gradient of temperature observed in the reactor during the hydrate formation process.
3. Results and Discussion
As declared in the previous section, the L-trp concentrations selected for tests carried out at stirred and unstirred conditions were different among each other. It can be explained by the different behaviors of thermodynamic and kinetic hydrate additives. Thermodynamic hydrate additives, both promoters and inhibitors, often require relatively high concentrations to be effective, while kinetic hydrate additives work at lower concentrations [46,47]. For that reason, two different ranges of L-trp concentrations were selected, aiming at defining a single interval capable to ensure both kinetic and thermodynamic promotion to the system.
3.1. CO2 Hydrate Formation Kinetics in L-Trp Solution
CO2 Gas Uptake Profiles in 0.05 wt% L-Trp Solution
Figure 5 shows the typical CO2 gas uptake profile when CO2 hydrate formed in 0.05 wt% L-trp solution. Once CO2 hydrate nucleation occurred, rapid CO2 consumption was observed without deflection time. In this study, final CO2 gas uptake reached 46.2 mmol/mol, with t90 (the time of achieving 90% of CO2 gas uptake in CO2 hydrate) of 73.5 min. NRt90 (the normalized rate of CO2 hydrate formation from tn to t90) was up to 33.9 mmol/mol/h. Results showed that L-trp exhibited promotion effect on CO2 hydrate kinetics without delay in the stirring system. As reported in previous studies, L-trp promoted methane hydrate [48,49]. L-trp has also been verified to promote CO2 hydrate formation in brine water in a recent study, showing a significant two-stage promotion pattern under the stirring conditions [50]. However, in our study, only one temperature peak was observed during CO2 hydrate formation (see Figure 2b). It was deduced that the promotion effect of L-trp on hydrate formation is related to the flow regime. In previous studies, CO2 hydrate was formed in reactors with different aspect ratios, with different sizes of stirrers, which affected the growth pattern of CO2 hydrate [51,52,53].
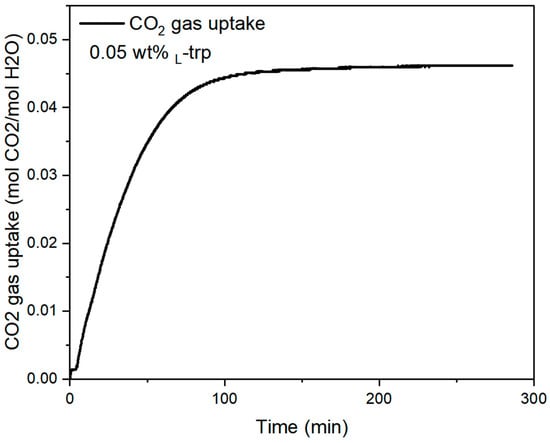
Figure 5.
Typical CO2 gas uptake profile in the case of 0.05 wt% L-trp.
3.2. CO2 Hydrate Formation Morphology in L-Trp Solution
This transparent reactor allows comprehensive monitoring of the morphological evolution in the three-phase gas–liquid–solid system during the course of the reaction. Its total volume is approximate. Figure 6 shows the CO2 hydrate morphological evolution during the formation process. It is worth noting that rapid CO2 hydrate formation is observed with the significant hydrate layer at tn in L-trp solution (see Figure 6b). The transparent aqueous solution changes to be turbid due to CO2 hydrate particle formation. In this regard, it is difficult to confirm that the hydrate formation starts from the gas–liquid surface or the solution. Compared with CO2 hydrate in the presence of other amino acids, such as L-leu, the formation rate promoted by L-trp is higher [42].
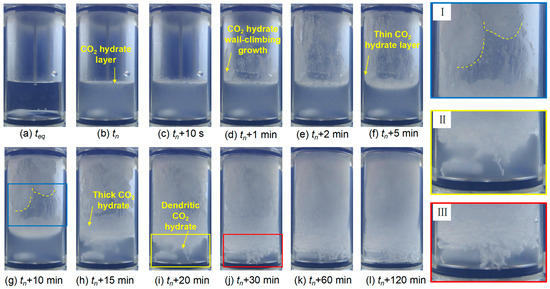
Figure 6.
Morphological evolution of CO2 hydrate formation at CL-trp = 0.10 wt%.
Subsequently, CO2 hydrate wall-climbing growth begins with the thin layer on the wall in the upper gas phase region within 5 min (see Figure 6d–f). Then, the plaque-like thickening of the CO2 hydrate layer forms along the wall due to the promotion of L-trp (see Figure 6g). This propagation of growth toward the center is related to the low temperature of the reactor wall and to the promotional effect of L-trp [54]. The deflection time is negligible due to the continuous stirring [49]. A large amount of snow-like CO2 hydrate formation is visible on the wall within 20 min (see Figure 6i). Similar to CO2 hydrate growth in the presence of 0.3 wt% L-leu [42], hydrate growth in downward direction is observed. In this system, hydrate shows dendritic morphology and fills almost the bulk solution (see Figure 6k), which is in line with the hydrate growth pattern promoted by hydrophobic amino acid [48,55].
Figure 7 illustrates the CO2 hydrate formation in 0.30 wt% L-trp solution. CO2 hydrate nucleation occurs in the aqueous solution and gas–liquid interface as shown in Figure 7b. Following the nucleation event, a porous layer of solid hydrate swiftly covers the gas–liquid interface within 10 s (see Figure 7c). Subsequently, thick hydrate grows along the wall as seen in Figure 7e–i, which is different from the growth pattern in 0.10 wt% L-trp. A petal-like hydrate rim can be observed in tn + 5 min, which is similar to the CO2 hydrate growth pattern in the presence of L-leu over 1.00 wt%. With time elapsed, there is also some hydrate growth propagation downward in the direction of the aqueous phase (see Figure 7i). Finally, CO2 hydrate grows in both directions and almost fills the entire reactor (see Figure 7l). This typical growth behavior is in line with the hydrate promoted by amino acid in different concentrations [40,42].
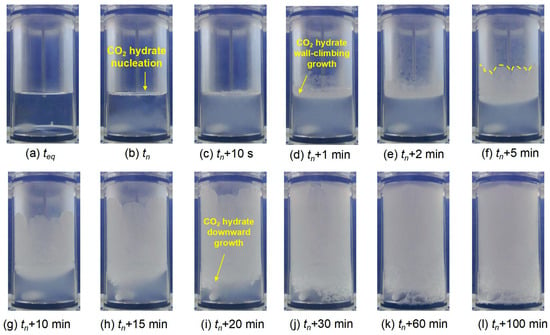
Figure 7.
Morphological evolution of CO2 hydrate formation at CL-trp = 0.30 wt%.
The main difference of CO2 hydrate formation at different concentrations of L-trp is the growth pattern of the hydrate layer. At 0.10 wt% L-trp, a thin hydrate layer forms on the reactor wall (see Figure 6c–f). Subsequently, the layer gradually thickens over time as more hydrate accumulates (see Figure 6g–h). However, rather than forming a thin layer that gradually thickens, relatively thick hydrate layers grow directly along the wall (see Figure 7d–i) at 0.30 wt% L-trp. This difference may be attributed to the higher L-trp concentration and the increasing mass transfer resistance due to the adsorption property of amino acid on promoting CO2 hydrate growth [42].
3.3. CO2 Hydrate Formation at 0.1/0.5 wt% L-Trp in Unstirred Conditions
This section describes the formation and dissociation of carbon dioxide hydrates within a mid-scale unstirred reactor. The apparatus, together with the experimental procedure, is described in Section 2.2.
The experiments were carried out at unstirred conditions for two main reasons. Firstly, the replacement of methane into natural hydrate reservoirs, as the carbon dioxide storage in the form of hydrates into deep oceans or, in general, more suitable sites, occurs in the absence of stirring. Secondly, based on the results previously described and also on the current literature, L-trp mainly results as a kinetic promoter. Similarly, the stirring process mainly acts on the process kinetics, while its role on the thermodynamics is contained. Therefore, one effect might hinder or synergistically promote the other. In order to exclude such a possibility, the tests were repeated in the absence of stirring and into a reactor having a greater size, thus lowering also the surface/volume ratio and its related effect on the process.
In the previous experimental sections, it was observed that the addition of 0.05 wt% of L-trp did not produce meaningful improvements. Therefore, the tests discussed in this paragraph were carried out at higher concentrations or 0.10 wt% and 0.50 wt% L-trp.
For each concentration selected, five tests were carried out in order to ensure the repeatability of results. The following two diagrams (Figure 8) describe the dependency between pressure and temperature of one experiment for each group. In particular, Figure 8a describes Test 4, carried out with an aqueous mixture containing 0.1 wt% L-trp, while Figure 8b is related to Test 8, made at an additive concentration equal to 0.5 wt%.
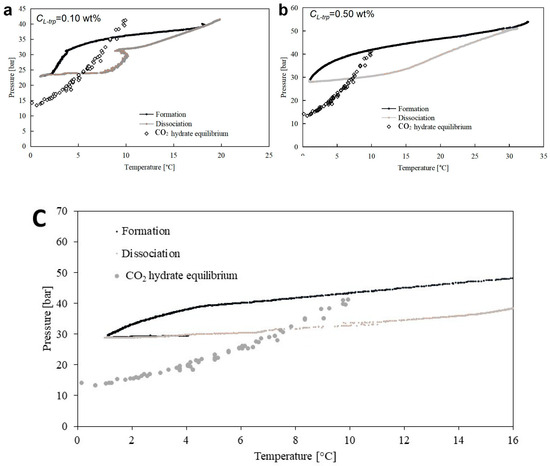
Figure 8.
(a) Description of Test 4, carried out in the presence of 0.1 wt% L-trp, on a P-T diagram. (b) Description of Test 8, carried out in the presence of 0.5 wt% L-trp, on a P-T diagram. (c) Thermodynamic evolution of CO2 hydrate formation and dissociation in the absence of L-trp.
The trend observed in these experiments is well comparable with that observed in the presence of stirring (see the previous section). The similarity is more marked at 0.1 wt% L-trp. In these tests, the formation of hydrates started as soon as the system entered in the stability zone for CO2 hydrates, as clearly visible in Figure 8a, where the pressure increased its lowering trend immediately after it overcame the CO2 phase equilibrium line. However, the formation of hydrates initially remained few and pronounced, and the overall decrease in pressure was limited. That condition persisted until the system reached a certain P-T condition (which will be described in the following paragraphs); then the production of hydrates became abundant, and the pressure drastically dropped. Despite the lowering of temperature, as soon as the formation of hydrates was completed, the internal pressure marked a still different trend and continued to drop only as a function of its dependency from temperature. Figure 8b shows an example of an experiment carried out at 0.5 wt% L-trp. Similarly to that observed in Figure 8a, out from the hydrate stability zone (or to the right of the equilibrium curve), the lowering of pressure was continued and caused only by the internal change in temperature. When the system moved on the left side, or within the formation and stability zone for carbon dioxide hydrates, the pressure accelerated its decrease. Moreover, its gradient varied gradually and reached a certain parallelism with the phase equilibrium line, proving that the process proceeded in accordance with its theoretical trend, even if at conditions shifted to the stability zone. However, the formation process ended at pressures higher than those registered in tests carried out at 0.1 wt% L-trp, thus denoting a lower production of hydrates.
Moreover, the following elements have to be highlighted:
- (i)
- As declared in the experimental procedure, the dissociation of hydrates was performed by gradually increasing the internal temperature. The initial increase in temperature did not cause any variation in pressure. It means that the system did not reach the equilibrium, while it remained widely within the stability zone (otherwise, even a little increase in temperature would have caused the variation in pressure). That consists of the main difference with tests showed in the previous section. Here, hydrates were produced in the absence of stirring and without using any porous medium in order to differentiate the results and to remove any further element of promotion from the system. As a consequence, hydrates mainly formed in correspondence of the gas–liquid interface. Therefore, the reaction occurred, as expected, but stopped in advance.
- (ii)
- The formation curves were widely different from the phase equilibrium line. The maximum distance between the two curves always occurred at the end of the formation phase, according to the literature, and so what was observed in previous studies carried out with the same apparatus [56].
- (iii)
- At 0.1 wt%, the increase in pressure during the dissociation phase showed a sudden change, accompanied by a local and time-limited decrease in temperature, which proved the fast dissociation of water cages in correspondence of it (with the process being endothermic). Moreover, this phenomenon occurred at the same pressures, measured during the formation phase, and corresponding to when the internal pressure changed its trend due to the more massive production of hydrates. Such a peculiarity is well visible in Figure 8a and, more in general, was verified in each experiment belonging to this group (0.1 wt% L-trp). Therefore, it can be considered characteristic for the process and can be associated to the heat and mass transfer properties of the system. Moreover, it may allow us to define the phase boundary conditions of the system in the presence of 0.1 wt% L-trp.
- (iv)
- During the last portion of the dissociation phase, the experimental curves significantly deviated from the phase equilibrium curve, independently from the additive concentration. It can be considered as the tendency of hydrate structures to preserve themselves, even if the thermodynamic conditions are no more feasible for the permanence of hydrates [57].
The diagram showed in Figure 9a describes the evolution of pressure and temperature over time for Test 4, made at 0.5 wt%.

Figure 9.
(a) Pressure (in black) and temperature (in grey) evolution over time, observed in Test 8, carried out in the presence of 0.5 wt% L-trp. (b) Lowest pressure reached during hydrate formation and corresponding time values. Circular and square dots were used to indicate tests carried out at 0.1 wt% and 0.5 wt% L-trp, respectively.
Only one diagram was reported, since the values of interest, related to the time dependency of temperature and pressure for each test, are resumed in the following Figure 9b. The proportionality between the two thermodynamic variables remained along the whole experiment, but it frequently changed in intensity as a function of the hydrate formation, dissociation, or none of them. Based on the present plot, for each test, the lowest pressure was measured, together with the time required to reach it, corresponding to the formation time.
The pairs of values obtained in this way were then plotted and represented with different colors, as a function of the initial L-trp concentration. The results achieved are visible in Figure 9b, while the corresponding values are resumed in the following Table 1.

Table 1.
Values shown in Figure 4. In detail: Pmin is the lowest pressure reached within the system and tmin is the corresponding time value.
The diagram well highlighted the difference existing between the two groups of experiments: in the presence of 0.1 wt% L-trp, lower pressures were reached, denoting higher production of hydrates, but longer formation times were required. In tests from 1 to 5, made with 0.1 wt% L-trp, the final pressure varied from 22.93 to 24.79 bar, while in tests 6–10, made with 0.5 wt% L-trp, it ranged from 27.36 to 28.88 bar. Therefore, under the thermodynamic point of view, the lower concentration tested in this section represents the most effective option. Considering also the results discussed in the previous paragraphs, it emerges that the thermodynamic benefits brought by L-trp depend on its concentration, but such dependency is not proportional and shows a maximum in correspondence of 0.1 wt%.
With regard kinetics, the higher the concentration of L-trp was, the lower the formation time became. The formation time passed from 22.56–26.02 h (at 0.1 wt%) to 16.88–20.18 h (at 0.5 wt%).
As a conclusion, the addition of L-trp was found to act both on the thermodynamics and the kinetics of CO2 hydrate formation. The first showed a maximum in correspondence of 0.1 wt%, while the second was proportional to the concentration.
In detail, L-trp acted as a weak thermodynamic promoter and an effective kinetic promoter. The highest thermodynamic promotion was observed at an additive concentration equal to 0.1 wt%, corresponding to the lowest pressures reached in the system: 22.82–24.79 bar vs. 27.36–28.88 bar obtained at 0.5 wt%. Moreover, at the lower concentration, the P-T trend better approximates the ideal phase equilibrium line (as visible in Figure 8); conversely, the tests carried out at 0.5 wt% showed greater deviation from the ideal trend.
The kinetic promotion was detected in both the systems (stirred and unstirred). At stirred conditions, the massive production of hydrates became clearly visible at tn + 5 min for L-trp concentration equal to 0.3 wt%, while it required more time (tn + 15 min) at 0.1 wt%. At unstirred conditions, the time required to complete the hydrate production phase increased with the lowering of L-trp concentration, as numerically stated in the previous sentences.
These results agree with literature, where numerous additives, also including some amino acids, were proved to show their best promoting or inhibiting performances at specific concentrations and also to intervene differently on the process kinetics and thermodynamics [58].
It is worth noting that the effectiveness of L-tryptophan in enhancing CO2 hydrate kinetics may also depend on other factors, such as temperature, pressure, and the presence of other additives and stirring condition of the system. Further research is ongoing to investigate the detailed mechanisms and optimize the use of L-tryptophan for various applications involving CO2 hydrates, such as gas storage, separation, and transportation.
4. Conclusions
In this study, we systematically investigate the role of amino acid L-tryptophan as a promoter for enhancing CO2 hydrate formation kinetics under both stirred and unstirred conditions, with a particular focus on the influence of its concentration.
In the stirred system, L-trp exhibited a promotion effect on CO2 hydrate kinetics without delay, with rapid CO2 consumption observed upon hydrate nucleation. The morphological evolution showed rapid hydrate formation, wall-climbing growth, and dendritic morphology filling the bulk solution.
Under unstirred conditions in a larger reactor, tests at 0.1 wt% and 0.5 wt% L-trp concentrations were performed. The addition of L-trp was found to influence both the thermodynamics and kinetics of CO2 hydrate formation. Thermodynamically, 0.1 wt% L-trp resulted in the highest hydrate formation, indicating an optimal concentration for thermodynamic promotion. Kinetically, increasing L-trp concentration from 0.1 wt% to 0.5 wt% reduced the formation time, demonstrating a proportional relationship between L-trp concentration and formation kinetics.
These findings provide valuable insights into the role of L-trp in promoting CO2 hydrate formation and the interplay between additive concentration, thermodynamics, and kinetics. The results can inform the development of effective hydrate-based technologies for CO2 capture and storage. Further research is recommended to explore the mechanisms underlying L-trp’s promotional effects and to optimize the use of amino acid additives in CO2 hydrate formation processes.
Author Contributions
Conceptualization, Y.L. and A.M.G.; methodology, Y.L., A.M.G., Y.R. and X.L.; formal analysis, Y.L. and A.M.G.; investigation, Y.L. and A.M.G.; resources, Y.L., A.M.G., Z.Y. and F.R.; data curation, Y.L., X.L. and A.M.G.; writing—original draft preparation, Y.L. and A.M.G.; writing—review and editing, Y.L. and A.M.G.; visualization, Y.L. and X.L.; supervision, Z.Y. and F.R.; project administration, Z.Y. and F.R.; funding acquisition, Z.Y. and F.R. All authors have read and agreed to the published version of the manuscript.
Funding
This research was funded by Shenzhen Science and Technology Program (Grant No. JCYJ20220530142810023, JCYJ20230807111600001).
Data Availability Statement
Data will be available on request.
Conflicts of Interest
The authors declare no conflicts of interest.
References
- de Coninck, H.; Benson, S.M. Carbon dioxide capture and storage: Issues and prospects. Annu. Rev. Environ. Resour. 2014, 39, 243–270. [Google Scholar] [CrossRef]
- Rehman, A.N.; Bavoh, C.B.; Pendyala, R.; Lal, B. Research Advances, Maturation, and Challenges of Hydrate-Based CO2 Sequestration in Porous Media. ACS Sustain. Chem. Eng. 2021, 9, 15075–15108. [Google Scholar] [CrossRef]
- Pandey, G.; Poothia, T.; Kumar, A. Hydrate based carbon capture and sequestration (HBCCS): An innovative approach towards decarbonization. Appl. Energy 2022, 326, 119900. [Google Scholar] [CrossRef]
- Wang, P.; Teng, Y.; Zhao, Y.; Zhu, J. Experimental Studies on Gas Hydrate-Based CO2 Storage: State-of-the-Art and Future Research Directions. Energy Technol. 2021, 9, 2100004. [Google Scholar] [CrossRef]
- Kumar, Y.; Sangwai, J.S. A perspective on the effect of physicochemical parameters, macroscopic environment, additives, and economics to harness the large-scale hydrate-based CO2 sequestration potential in oceans. ACS Sustain. Chem. Eng. 2023, 11, 10950–10979. [Google Scholar] [CrossRef]
- Zheng, J.; Chong, Z.R.; Qureshi, M.F.; Linga, P. Carbon dioxide sequestration via gas hydrates: A potential pathway toward decarbonization. Energy Fuels 2020, 34, 10529–10546. [Google Scholar] [CrossRef]
- Teng, Y.; Zhang, D. Long-term viability of carbon sequestration in deep-sea sediments. Sci. Adv. 2018, 4, eaao6588. [Google Scholar] [CrossRef]
- Hou, Y.; Xiao, C.; Fu, W.; Ge, Z.; Jia, Y. Dissolution-induced pore-matrix-fracture characteristics evolution due to supercritical CO2. Energy 2024, 1, 131820. [Google Scholar] [CrossRef]
- Snæbjörnsdóttir, S.Ó.; Sigfússon, B.; Marieni, C.; Goldberg, D.; Gislason, S.R.; Oelkers, E.H. Carbon dioxide storage through mineral carbonation. Nat. Rev. Earth Environ. 2020, 1, 90–102. [Google Scholar] [CrossRef]
- Su, Y.; Li, B.; Zhou, W.; Jie, W.; Li, Y.; Zhang, H.; Ni, H. CO2 sequestration by ammonia-enhanced phosphogypsum mineral carbonation: Development and optimization of reaction kinetic model. Chem. Eng. Sci. 2024, 292, 119967. [Google Scholar] [CrossRef]
- Lin, X.; Li, X.; Liu, H.; Boczkaj, G.; Cao, Y.; Wang, C. A review on carbon storage via mineral carbonation: Bibliometric analysis, research advances, challenges, and perspectives. Sep. Purif. Technol. 2024, 338, 126558. [Google Scholar] [CrossRef]
- Cao, X.; Wang, H.; Yang, K.; Wu, S.; Chen, Q.; Bian, J. Hydrate-based CO2 sequestration technology: Feasibilities, mechanisms, influencing factors, and applications. J. Pet. Sci. Eng. 2022, 219, 111121. [Google Scholar] [CrossRef]
- Sloan, E.D. Fundamental principles and applications of natural gas hydrates. Nature 2003, 426, 353–359. [Google Scholar] [CrossRef] [PubMed]
- Bavoh, C.B.; Lal, B.; Osei, H.; Sabil, K.M.; Mukhtar, H. A review on the role of amino acids in gas hydrate inhibition, CO2 capture and sequestration, and natural gas storage. J. Nat. Gas Sci. Eng. 2019, 64, 52–71. [Google Scholar] [CrossRef]
- Zhang, Y.; Chen, F.; He, Y.; Wang, F. Enhanced CO2 hydrate formation via biopromoter coupled with initial stirring activation. Fuel 2022, 330, 125713. [Google Scholar] [CrossRef]
- Hu, Q.; Wnag, X.; Wang, W.; Li, Y.; Liu, S. Growth and aggregation micromorphology of natural gas hydrate particles near gas-liquid interface under stirring conditions. Chin. J. Chem. Eng. 2021, 40, 65–77. [Google Scholar] [CrossRef]
- Bhattacharjee, G.; Kumar, A.; Sakpal, T.; Kumar, R. Carbon dioxide sequestration: Influence of porous media on hydrate formation kinetics. ACS Sustain. Chem. Eng. 2015, 3, 1205–1214. [Google Scholar] [CrossRef]
- Chirkova, Y.F.; Varfolomeev, M.A.; Mirzakimov, U.Z.; Gainullin, S.E.; Semenov, M.E.; Stoporev, A.S.; Pavelyev, R.S. Influence of kinetic promoters with different surface-active properties on methane and natural gas hydrate formation in porous media. Fuel 2024, 369, 131727. [Google Scholar] [CrossRef]
- Gambelli, A.M.; Li, Y.; Rossi, F. Influence of different proportion of CO2/N2 binary gas mixture on methane recovery through replacement processes in natural gas hydrates. Chem. Eng. Process. 2022, 175, 108932. [Google Scholar] [CrossRef]
- Liu, F.P.; Li, A.R.; Qing, S.L.; Luo, Z.D.; Ma, Y.L. Formation kinetics, mechanism of CO2 hydrate and its applications. Renew. Sustain. Energ. Rev. 2022, 159, 112221. [Google Scholar] [CrossRef]
- Veluswamy, H.P.; Wong, A.J.H.; Babu, P.; Kumar, R.; Kulprathipanja, S.; Rangsunvigit, P.; Linga, P. Rapid methane hydrate formation to develop a cost effective large scale energy storage system. Chem. Eng. J. 2016, 290, 161–173. [Google Scholar] [CrossRef]
- Li, Y.; Gambelli, A.M.; Rossi, F. Experimental Study on the Effect of SDS and Micron Copper Particles Mixture on Carbon Dioxide Hydrates Formation. Energies 2022, 15, 6540. [Google Scholar] [CrossRef]
- Li, M.; Chen, B.; Li, K.; Song, Y.; Yang, M. Stability and structure of multiply occupied sII CO2 clathrate hydrates: A possibility for carbon capturing. J. Mol. Liq. 2023, 380, 121746. [Google Scholar] [CrossRef]
- Juan, Y.-W.; Tang, M.; Chen, L.-J.; Lin, S.-T.; Chen, P.-C.; Chen, Y.-P. Measurements for the equilibrium conditions of methane hydrate in the presence of cyclopentanone or 4-hydroxy-4-methyl-2-pentanone additives. Fluid Phase Equilib. 2015, 386, 162–167. [Google Scholar] [CrossRef]
- Komarov, V.Y.; Rodionova, T.V.; Terekhova, I.S.; Kuratieva, N.V. The cubic superstructure-I of tetrabutylammonium fluoride (C4H9)4NF·29.7 H2O clathrate hydrate. J. Incl. Phenom. Macrocycl. Chem. 2007, 59, 11–15. [Google Scholar] [CrossRef]
- Sun, Z.-G.; Liu, C.-G.; Zhou, B.; Xu, L.-Z. Phase equilibrium and latent heat of tetra-n-butylammonium chloride semi-clathrate hydrate. J. Chem. Eng. Data 2011, 56, 3416–3418. [Google Scholar] [CrossRef]
- Muromachi, S.; Kida, M.; Takeya, S.; Yamamoto, Y.; Ohmura, R. Characterization of the ionic clathrate hydrate of tetra-n-butylammonium acrylate. Can. J. Chem. 2015, 93, 954–959. [Google Scholar] [CrossRef]
- Fakharian, H.; Ganji, H.; Far, A.N.; Kameli, M. Potato starch as methane hydrate promoter. Fuel 2012, 94, 356–360. [Google Scholar] [CrossRef]
- Bavoh, C.B.; Partoon, B.; Lal, B.; Keong, L.K. Engineering, Methane hydrate-liquid-vapour-equilibrium phase condition measurements in the presence of natural amino acids. J. Nat. Gas Sci. Eng. 2017, 37, 425–434. [Google Scholar]
- Madeira, P.P.; Bessa, A.; Álvares-Ribeiro, L.; Raquel Aires-Barros, M.; Rodrigues, A.E.; Uversky, V.N.; Zaslavsky, B.Y. Amino acid/water interactions study: A new amino acid scale. J. Biomol. Struct. Dyn. 2014, 32, 959–968. [Google Scholar]
- Badawy, W.A.; Ismail, K.M.; Fathi, A.M. Effect of Ni content on the corrosion behavior of Cu-Ni alloys in neutral chloride solutions. Electrochim. Acta 2005, 50, 3603–3608. [Google Scholar] [CrossRef]
- Giovannetti, R.; Gambelli, A.M.; Castellani, B.; Rossi, A.; Minicucci, M.; Zannotti, M.; Li, Y.; Rossi, F. May sediments affect the inhibiting properties of NaCl on CH4 and CO2 hydrates formation? An experimental report. J. Mol. Liq. 2022, 359, 119300. [Google Scholar] [CrossRef]
- Veluswamy, H.P.; Lee, P.Y.; Premasinghe, K.; Linga, P. Effect of biofriendly amino acids on the kinetics of methane hydrate formation and dissociation. Ind. Eng. Chem. Res. 2017, 56, 6145–6154. [Google Scholar] [CrossRef]
- Sa, J.H.; Lee, B.R.; Park, D.H.; Han, K.; Chun, H.D.; Lee, K.H. Amino acids as natural inhibitors for hydrate formation in CO2 sequestration. Environ. Sci. Technol. 2011, 45, 5885–5891. [Google Scholar] [CrossRef]
- Sa, J.H.; Kwak, G.H.; Han, K.; Ahn, D.; Cho, S.J.; Lee, J.D.; Lee, K.H. Inhibition of methane and natural gas hydrate formation by altering the structure of water with amino acids. Sci. Rep. 2016, 6, 31582. [Google Scholar] [CrossRef]
- Srivastava, S.; Kollemparembil, A.M.; Zettel, V.; Classen, T.; Gatternig, B.; Delgado, A.; Hitzmann, B. Experimental investigation of CO2 uptake in CO2 hydrates formation with amino acids as kinetic promoters and its dissociation at high temperature. Sci. Rep. 2022, 12, 8359. [Google Scholar] [CrossRef] [PubMed]
- Prasad, P.S.R.; Kiran, B.S. Synergistic effects of amino acids in clathrates hydrates: Gas capture and storage applications. Chem. Eng. J. Adv. 2020, 3, 100022. [Google Scholar] [CrossRef]
- Khandelwal, H.; Qureshi, M.F.; Zheng, J.; Venkataraman, P.; Barckholtz, T.A.; Mhadeshwar, A.B.; Linga, P. Effect of l-Tryptophan in Promoting the Kinetics of Carbon Dioxide Hydrate Formation. Energy Fuels 2020, 35, 649–658. [Google Scholar] [CrossRef]
- Cai, Y.; Chen, Y.; Li, Q.; Li, L.; Huang, H.; Wang, S.; Wang, W. CO2 Hydrate Formation Promoted by a Natural Amino Acid l-Methionine for Possible Application to CO2 Capture and Storage. Energy Technol. 2017, 5, 1195–1199. [Google Scholar] [CrossRef]
- Liu, X.; Ren, J.; Chen, D.; Yin, Z. Comparison of SDS and L-Methionine in promoting CO2 hydrate kinetics: Implication for hydrate-based CO2 storage. Chem. Eng. J. 2022, 438, 135504. [Google Scholar] [CrossRef]
- Liu, X.; Li, Y.; Chen, G.-J.; Chen, D.-Y.; Sun, B.; Yin, Z. Coupling amino acid with THF for the pynergistic promotion of CO2 hydrate micro kinetics: Implication for hydrate-based CO2 sequestration. ACS Sustain. Chem. Eng. 2023, 11, 6057–6069. [Google Scholar] [CrossRef]
- Li, Y.; Yin, Z.; Lu, H.; Xu, C.; Liu, X.; Huang, H.; Chen, D.; Linga, P. Evaluation of amino acid L-Leucine as a kinetic promoter for CO2 sequestration as hydrate: A kinetic and morphological study. J. Environ. Chem. Eng. 2023, 11, 111363. [Google Scholar] [CrossRef]
- Gambelli, A.M.; Rossi, F. Experimental characterization of the difference in induction period between CH4 and CO2 hydrates: Motivations and possible consequences on the replacement process. Gas Sci. Eng. 2022, 108, 104848. [Google Scholar] [CrossRef]
- Giovannetti, R.; Gambelli, A.M.; Rossi, A.; Castellani, B.; Minicucci, M.; Zannotti, M.; Nicolini, A.; Rossi, F. Thermodynamic assessment and microscale Raman spectroscopy of binary CO2/CH4 hydrates produced during replacement applications in natural reservoirs. J. Mol. Liq. 2022, 368, 120739. [Google Scholar] [CrossRef]
- Gambelli, A.M. Variations in terms of CO2 capture and CH4 recovery during replacement processes in gas hydrate reservoirs, associated to the “memory effect”. J. Clean. Prod. 2022, 360, 132154. [Google Scholar] [CrossRef]
- Tariq, M.; Rooney, D.; Othman, E.; Aparicio, S.; Atilham, M.; Khraishes, M. Gas hydrate inhibition: A review of the role of ionic liquids. Ind. Eng. Chem. Res. 2014, 53, 17855–17868. [Google Scholar] [CrossRef]
- Du, J.; Wang, X.; Liu, H.; Guo, P.; Wang, Z.; Fan, S. Experiments and prediction of phase equilibrium conditions for methane hydrate formation in the NaCl, CaCl2, MgCl2 electrolyte solutions. Fluid Phase Equilibr. 2019, 479, 1–8. [Google Scholar] [CrossRef]
- Veluswamy, H.P.; Hong, Q.W.; Linga, P. Morphology Study of Methane Hydrate Formation and Dissociation in the Presence of Amino Acid. Cryst. Growth Des. 2016, 16, 5932–5945. [Google Scholar] [CrossRef]
- Pagar, E.; Burla, S.K.; Kumar, V.; Veluswamy, H.P. Influence of amino acids on gas hydrate formation and dissociation kinetics using flue gas (CO2 + N2 mixture) in silica sand under saline/non saline conditions for CO2 sequestration. Appl. Energy 2024, 367, 123460. [Google Scholar] [CrossRef]
- Jeenmuang, K.; Pornaroontham, P.; Qureshi, M.F.; Linga, P.; Rangsunvigit, P. Micro kinetic analysis of the CO2 hydrate formation and dissociation with L-tryptophan in brine via high pressure in situ Raman spectroscopy for CO2 sequestration. Chem. Eng. J. 2024, 479, 147691. [Google Scholar] [CrossRef]
- Li, Y.; Gambelli, A.M.; Chen, J.; Yin, Z.; Rossi, F.; Tronconi, E.; Mei, S. Experimental study on the competition between carbon dioxide hydrate and ice below the freezing point. Chem. Eng. Sci. 2023, 268, 118426. [Google Scholar] [CrossRef]
- Cho, S.G.; Kim, K.; Sa, J.H. Promotion Effects of Hydrophobic Amino Acids on CO2 Hydrate Formation Kinetics under Isochoric/Isobaric and Stirred/Nonstirred Conditions. Energy Fuels 2023, 38, 526–535. [Google Scholar] [CrossRef]
- Dhamu, V.; Qureshi, M.F.; Abubakar, S.; Usadi, A.; Barckholtz, T.A.; Mhadeshwar, A.B.; Linga, P. Investigating high-pressure liquid CO2 hydrate formation, dissociation kinetics, and morphology in brine and freshwater static systems. Energy Fuels 2023, 37, 8406–8420. [Google Scholar] [CrossRef]
- Zhang, Y.; Zhao, J.; Bhattacharjee, G.; Xu, H.; Yang, M.; Kumar, R.; Linga, P. Synthesis of methane hydrate at ambient temperature with ultra-rapid formation and high gas storage capacity. Energy Environ. Sci. 2022, 15, 5362–5378. [Google Scholar] [CrossRef]
- Bhavya, T.; Sai Kiran, B.; Prasad, P.S.R. The Role of Stirring and Amino Acid Mixtures to Surpass the Sluggishness of CO2 Hydrates. Energy Fuels 2021, 35, 13937–13944. [Google Scholar] [CrossRef]
- Gambelli, A.M.; Rossi, F. Re-definition of the region suitable for CO2/CH4 replacement into hydrates as a function of the thermodynamic difference between CO2 hydrate formation and dissociation. Process Saf. Environ. Prot. 2023, 169, 132–141. [Google Scholar] [CrossRef]
- Rossi, F.; Li, Y.; Gambelli, A.M. Thermodynamic and Kinetic Description of the Main Effects Related to the Memory Effect during Carbon Dioxide Hydrates Formation in a Confined Environment. Sustainability 2021, 13, 13797. [Google Scholar] [CrossRef]
- Rossi, F.; Gambelli, A.M. Thermodynamic phase equilibrium of single-guest hydrate and formation data of hydrate in presence of chemical additives: A review. Fluid Phase Equilib. 2021, 536, 112958. [Google Scholar] [CrossRef]
Disclaimer/Publisher’s Note: The statements, opinions and data contained in all publications are solely those of the individual author(s) and contributor(s) and not of MDPI and/or the editor(s). MDPI and/or the editor(s) disclaim responsibility for any injury to people or property resulting from any ideas, methods, instructions or products referred to in the content. |
© 2024 by the authors. Licensee MDPI, Basel, Switzerland. This article is an open access article distributed under the terms and conditions of the Creative Commons Attribution (CC BY) license (https://creativecommons.org/licenses/by/4.0/).