Abstract
Colleges and universities are large consumers of energy, with a huge potential for building energy efficiency, and need to reduce energy consumption to build a low-carbon, energy-saving campus. Predicting the energy consumption of campus buildings can help to accurately manage the electricity consumption of buildings and reduce the energy consumption of buildings. However, the electricity consumption of a building’s operation is affected by many factors, and it is difficult to establish a model for analysis and prediction. Therefore, in this study, the training building of the BIM education center on campus was selected as the research object, and a digital twin O&M platform was established by integrating IoT, digital twin technology (DDT), smart meter monitoring devices, and indoor environment monitoring devices. The O&M management platform can monitor real-time changes in indoor power consumption data and environmental parameters, and organize data on multiple influencing factors and power consumption. Following training, validation, and testing, the machine learning models (back propagation neural network, support vector model, and multiple linear regression model) were assessed and compared for accuracy. Following the multiple linear regression and support vector models, the backpropagation neural network model exhibited the highest accuracy. Consistent with the actual power consumption detection results in the BIM education center, the backpropagation neural network model produced results. Consequently, the BP model created in this study demonstrated its dependability and ability to forecast campus building power usage, assisting the university in organizing its energy supply and creating a campus that prioritizes conservation.
1. Introduction
The number of colleges and universities in China is increasing year by year. University buildings have a huge potential for energy saving due to high staff density and high energy demand. Forecasting of electricity consumption in campus buildings is essential for efficient management of building energy systems and preparation for future electricity demand. Although the operating hours of our campus buildings are shortened during vacation periods when energy demand is high, the energy demand of campus buildings has a significant impact on the local socio-economy due to their size [1,2,3]. Accurately predicting the electricity consumption of campus buildings helps electricity providers plan their distribution in advance. This not only prevents wastage of power production, but also helps to avoid blackouts [4].
Digital twin technology has grown in significance as a means of controlling building energy use in recent years. Managers can now keep an eye on how much energy is being used by building amenities like HVAC systems, plug loads (which now make up 33% of the energy used in commercial buildings [5]), and lights thanks to this cutting-edge technology. They will be able to fully comprehend and optimize the patterns of energy usage within the building in this way. Digital twin technology is a potent technological support for energy efficiency initiatives since it can also mimic the operational conditions of systems and equipment and adjust their performance in real time to increase energy efficiency.
Real-time connections between actual entities and their virtual representations are made possible by digital twin technology’s extensive and sophisticated capabilities. Many functions, including as simulation, integration, testing, monitoring, and maintenance, can be realized with this technology. They track the condition of the equipment, forecast its future behavior, and even investigate other operating approaches using precise and comprehensive virtual models. It is well known that digital twin technology is used in building energy management and that it is important. By tracking the energy usage of building facilities, such as lighting systems, power consumption, and HVAC usage, in real time, this cutting-edge technology gives managers insights into a building’s energy consumption patterns and enables them to optimize and improve energy usage.
Researchers can utilize the platform’s pooled and acquired data to investigate efficiency and make energy projections. A building’s energy distribution may be planned, a building’s operations and energy systems can be automated, and energy-efficient building designs can be produced with the help of building energy forecasting, sometimes referred to as building energy estimation or prediction [6].
Building energy forecasting has advanced significantly thanks to scientific and technological advancements. Physical and data-driven models are two of the several methods that have been put forth and shown to work. Among these forecasting methods, data-driven models have drawn the greatest interest because of their high prediction accuracy and ease of modeling [7,8,9].
Machine learning is a branch of artificial intelligence that can be used to train models using existing data, which can then be used to solve specific problems and extract new information from big data [10,11]. In addition, the development of convenient programming languages and sophisticated algorithms has facilitated the applicability of machine learning. With the latest developments in computer technology, machine learning is being studied in the context of building energy for analyzing and predicting building energy consumption.
The digital twin platform collects historical and real-time data, which is then trained using machine learning methods to find out the factors affecting a building’s energy use. Different prediction methods were evaluated, and a regression model was created based on the results of the analysis to aid energy efficiency research on university campuses. The model provides a basis for energy efficiency decisions by predicting future energy use, thus reducing energy waste during a building’s operation. As a result, campus buildings can be developed in a way that maximizes energy use and encourages the adoption of green building strategies.
2. Digital Twins in Building Energy Management
2.1. Definition and Development of the Digital Twin
The inception of digital twin technology can be traced back to the 1960s, when NASA created “digital twins” in order to assess the Apollo missions’ shortcomings. To model and investigate the various situations that spacecrafts encounter, identical real spacecrafts were constructed. Eventually, in 1991, David Gelernter developed the concept of digital twin technology. The first time the software was used in production was when Michael Grieves presented the idea of digital twin software in 2002. The term “digital twin” was first introduced by NASA in 2010, and quickly gained traction in the aerospace industry [12]. The notion of digital twins was first presented in the Product Lifecycle Management (PLM) by NASA’s Greaves and Vickers in 2002 [13]. In general, a digital twin is a dynamic, self-correcting digital or virtual model that depicts the condition of a physical twin and genuine object. Real-time data exchange and realized historical data preservation are the processes that result in digital twins.
But for a very long time, the “digital twin” remained only an idea, without the necessary technological infrastructure to enable its implementation. Digital technologies are developing quickly with the introduction of Industry 4.0, propelling digital transformation throughout all industries. Additionally, the shift encourages the advancement and use of digital twin technology. In order to maximize production, design, maintenance, and monitoring to increase efficiency and sustainability, and to manage and optimize entities, processes, and systems to achieve efficiency gains, cost savings, and sustainability, digital twins are widely used in the manufacturing, construction, healthcare, urban planning, energy, and agricultural sectors, among other fields [14].
“A real-time depiction of a completely or partially finished and developed building or structure to represent the condition and attributes of the building or structure it reflects” is the definition of a digital twin for the construction industry. Consequently, it makes it possible for energy systems to be seamlessly synchronized and monitored through computerized and virtual world simulations that are based on information, data, and consumer behavior. The digital twin concept is the foundation for several products, including 3D modeling, digital prototyping, and system simulation [15].
2.2. Application of Digital Twin Technology
Information technology has advanced quickly since the turn of the twenty-first century, particularly with the introduction of a new generation of technologies such as cloud computing, big data analytics, artificial intelligence (AI), the Internet of Things (IoT), and so on. The pace of digitalization has greatly quickened [16]. As a result of this development, the use of digital twin technology has increased across several sectors. Integration of the virtual and real worlds has revolutionized several fields, making digitization a catalyst for innovation. Digital twins have found applications in a wide range of industries, including smart cities, healthcare, agriculture, transportation, aerospace, manufacturing, energy, and power. Digital twins can be used by manufacturing businesses to improve product quality, reduce production costs, expedite delivery, and predict production bottlenecks to accelerate the launching of new goods [17]. Planning and decision-making assistance can be obtained by an urban planner by simulating a city’s operations and infrastructure using digital twin technologies. Using computer simulation, digital twins can be utilized to evaluate several lighting schemes in different application circumstances and select the most suitable one. This kind of energy-sector analysis and simulation can be applied to energy [12].
With the use of digital twins, architects may connect their virtual and physical structures in real time. Apart from this theme, it facilitates the efficient evaluation of unforeseen or capricious facets of a structure. It also significantly improves building user engagement, lowers maintenance costs, streamlines construction workflows, and integrates different building information technologies into building operations [18]. Construction project implementation is greatly enhanced with digital twin technology, resulting in reduced completion times and costs. This will be beneficial to many emerging fields, such as the design and construction of smart buildings, where the application of this technology can lower building costs and construction times, improve productivity and collaboration, maximize the use of existing buildings, and improve sustainability and safety [19].
Furthermore, in the building sector, digital twin technology can assist in reaching previously unachievable objectives. Technology, for instance, can assist in creating more efficient maintenance plans by giving real-time information on the condition of machinery or systems. Preventive maintenance and increased facility management efficiency are two ways the construction sector might achieve this. Digital twin technology can assist in anticipating how well urban infrastructure will be used or give researchers and planners more information about urban development. Digital twin technology has a lot of promise, but there are still obstacles to be solved, such as managing costs, processing vast amounts of data, protecting privacy and security, and integrating the digital and physical worlds seamlessly. In the construction industry, a number of new difficulties and complications have surfaced, particularly with regard to data processing and collecting, real-time monitoring, data updating, data access, user interface design personalization, cybersecurity, and integration with intelligent solutions [20]. To address these issues, experts in connected industries are actively engaged in research and development. Many prominent figures in the industry have made significant investments in digital twin technology as a result of these activities. Simultaneously, the growing amount of publications and attention has provided a significant boost to the technology’s advancement [21].
The application of digital twin technology has grown significantly in recent years; this trend is directly associated with Industry 4.0’s rapid development. The creation of Industry 4.0 not only offers a multitude of application scenarios, but also the essential backing for technological advancement. Digital twin technology offers much more potential to address present issues and propel the sector forward as sector 4.0 develops.
2.3. Building Energy Management Automation
In order to control a building’s energy use, digital twin technology has grown in importance in recent years. The energy consumption of building amenities, such as lighting, plug loads—which currently account for 33% of all energy used in commercial buildings—and HVAC systems, can be tracked by managers thanks to this cutting-edge technology [5]. In this approach, they are able to completely understand and optimize the patterns of building energy usage. Surprisingly, 71% of the world’s energy consumption is accounted for by the business and office sectors, with lighting accounting for at least 18% of this total, or 20% [22].
Consequently, a number of factors, such as an office building’s location, equipment usage, operating hours, HVAC system, and lighting technology, affect how much energy it uses annually. Because of this, one of the most important areas for study on energy efficiency in green buildings is optimizing lighting systems’ energy efficiency while preserving lighting quality and luminosity [23].
Furthermore, by simulating systems’ and devices’ operational states, digital twin technology can optimize real-time system and device performance and increase energy efficiency. Because of this capability, the digital twin can provide strong technological assistance for energy-saving initiatives. Furthermore, digital twins’ predictive maintenance feature may foresee potential equipment issues and address them before they arise, preventing energy waste from equipment failure, and thereby lowering maintenance and repair expenses.
The integration of digital twin (DT) technology with an intelligent building management system has the potential to automate a building’s energy consumption, resulting in reduced carbon emissions and energy savings. In addition, by increasing energy efficiency and lowering maintenance costs, DT technology lowers running expenses and raises the economic efficiency of buildings. DT technology also ensures low-carbon production, mitigates the impact of economic activity on carbon emissions, tracks anomalous energy use, notifies users of high-emission behavior, and allows for the online testing of energy solutions. When taken as a whole, these advantages and uses demonstrate how important DT technology is to achieving environmental objectives and raising energy efficiency [24].
2.4. Digital Twin Platform System Framework
Based on a centralized hardware control system, it serves energy monitoring and electromechanical equipment management. The system can support various transmission methods, such as wired and wireless. The hardware system adopts low-voltage power line carrier transmission, which eliminates the need to build a communication network and makes construction difficult and project application costs low. The system concentrates the data collected from energy monitoring, human behavior, environment monitoring, controllers, and other modules, and transmits it to the server side for visualization and presentation to achieve intelligent building management. The framework diagram of the platform hardware system is shown in Figure 1.
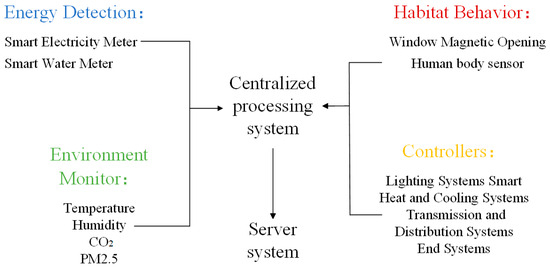
Figure 1.
Platform hardware system framework diagram.
The goal of the building’s digital twin system is to integrate intelligent building operation and maintenance, indoor thermal environment prediction, and DTT. Monitoring data on space temperature, air quality, occupant behavior, and other relevant factors can help buildings operate more efficiently by consuming less energy and maintaining user comfort.
3. Practical Engineering Application
3.1. Building Introduction
The BIM Education Center is a training building on campus that provides students with on-site classes. The structure is three stories tall, with a total floor space of 919.98 m2. There are various types of rooms, including student microcomputer rooms, staff offices, conference rooms, equipment rooms, and storage rooms. In recent years, the building has been remodeled and intelligent equipment has been installed, including the enclosure structure, lighting equipment, smart meters, an indoor environment monitoring system, and so on. In addition to storing historical data for researchers to examine, the operation and maintenance platform can show current indoor environmental conditions, staff activity, and the equipment’s power usage in each room.
3.2. Architecture of the Digital Twin O&M Platform
Digital twin technology describes the changes in physical objects in the real world and simulates the behaviors and impacts of physical objects in the real environment by constructing digital mirrors of physical objects to achieve condition monitoring, fault diagnosis, trend prediction and comprehensive optimization. In order to build digital mirrors and achieve the above goals, it is necessary for IOT, modeling, simulation and other basic support technologies to be integrated through a platform-based architecture to build a closed loop of information interaction from the physical world to the twin space. On the whole, a completed digital twin system should contain the following four entity levels:
First, the data collection and control entity, which mainly covers perception, control, identification, and other technologies, and undertakes the collection of upstream perception data and the execution of downstream control instructions between the twin and the physical object. Second, the core entity, relying on general support technology, realizes model construction and fusion, data integration, simulation and analysis, system expansion and other functions, and is the main carrier for generating twins and expanding applications. The third is the user entity, mainly focusing on visualization technology and virtual reality technology, undertaking the function of human–computer interaction. The fourth is the cross-domain entity, which undertakes the data interoperability and security functions between the levels of entities.
Enhanced data from equipment monitoring and the building environment will result from the application of the digital twin visual platform. Several wireless communication channels are used in the design and implementation of the heterogeneous sensor network. The detection method is reinforced to ensure that the information collected can be acquired for the digital twin management platform. Wireless sensor networks (WSNs), ZigBee intelligent acquisition terminals, and other components make up the entire system. WSNs provide accurate and up-to-date information for building maintenance and operation parties by summarizing sensor data for the network node [25]. Building monitoring has made extensive use of it due to its inexpensive cost, real-time performance, huge coverage rate, good discoverability for crises, and great practical usefulness.
The development of the virtual twin platform is based on the three-dimensional construction model. The building’s geometrical measurements, style, and construction will all be rendered in 3D Max. After that, download and import the in.fbx file into the Unity 3D engine. Concurrent loading of the texture file completes the static model mapping. In order to complete the dynamic virtual-real mapping and update the virtual twin model, Unity needs to collect space-time and state data via C# script files. By using scripting data, the sensor data accessing function is finished, and the temperature, personnel number, and location are shown in virtual space. Figure 2 displays the flow chart for the Unity 3D-built virtual twin platform.
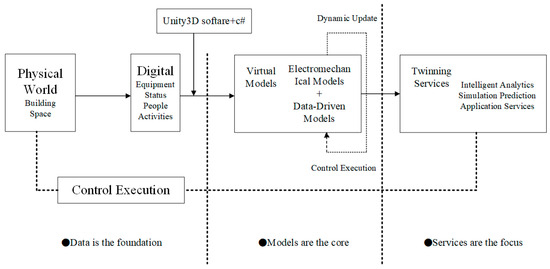
Figure 2.
Flow chart of building the digital twin platform.
Smart sensors are used to monitor the indoor and outdoor environmental factors of the building and the behavior of its residents. The data collected is integrated into the digital twin platform. The computer simulation software examines and assesses the built environment. The building will achieve intelligent control by using computer simulation technology to provide feedback on control information related to lighting, shading, windows, air conditioning, and other systems.
3.3. Platform Function Analysis
“Digital twin building” is a new technology that applies digital twin enabling technology to building science and technology. Simply put, it is the simulation process of utilizing a physical building model, using a variety of sensors to obtain a full range of data, and completing the mapping in the virtual space to reflect the corresponding physical building’s full life cycle process. Digital twin building has the following four major features: accurate mapping, virtual reality interaction, software definition, and intelligent intervention.
With the aid of digital twin technology, a building’s energy status can be analyzed and modeled to determine the variables that impact energy efficiency. Subsequently, suitable actions are implemented to decrease energy usage and enhance the building’s sustainability. Digital twin technology has the potential to minimize power usage and carbon emissions by optimizing a building’s air conditioning and lighting systems. Additionally, it can minimize energy consumption and adverse environmental effects by optimizing the materials and window designs of building facades and windows to increase building ventilation and insulation. In general, the digital twin offers building energy data and analytics to assist in decision-making and execution to raise energy efficiency and facilitate more energy-efficient operations.
The architectural details and areas of the BIM Education Center training building are created. The model is then put into the Unity 3D engine to create a real-time link between the virtual and real-world locations, allowing for continuous upgrades to the virtual twin platform. By developing a virtual platform for digital twin operation and maintenance, the internal and external environments of the building, equipment information statistics, alarm lists, data from weather stations, air quality, building energy consumption statistics, equipment status, and people number and location information statistics can all be displayed. Figure 3 displays the building’s digital twin virtual platform’s operation and maintenance interface.
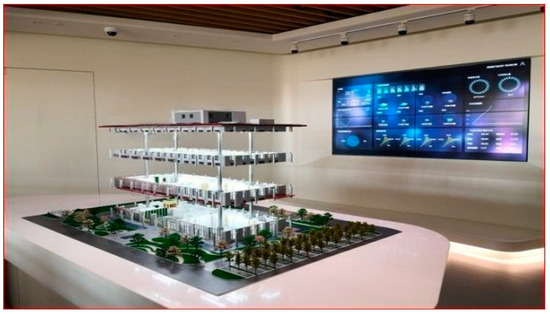
Figure 3.
BIM Education Center Digital Twin Platform.
Data are sent via a network of end devices via the building’s digital twin operation and maintenance platform. The computer server, display platform, and terminal monitoring equipment are all connected via a Cat. 5 twisted-pair cable, WIFI, ZigBee, and the RS485 serial connection standard protocol. The server side performs the data analysis and model comparison, and the terminal equipment’s energy consumption is intelligently regulated to meet the building’s energy-saving target. The virtual platform for developing digital twins has the ability to show real-time data from all devices and provide equipment feedback based on control logic. The following is a description of the functions.
3.3.1. Indoor Environment Monitoring System
The microcomputer room, office, and conference room are equipped with parameter sensors to monitor various environmental data, such as temperature, humidity, carbon dioxide, PM2.5, and illumination. These sensors are used for indoor sensor detection. The environmental sensor node consists of a CPU, multisensor module, ZigBee module, and peripheral circuit. The data are transferred to the remote server via the TCP protocol and the network envelope, where they are kept while they are pending additional processing. Consequently, the digital twin virtual platform provides data help for air conditioning load prediction and enables real-time scanning of the interior environment parameter data.
The indoor environmental parameter monitoring system of the digital twin platform is shown in Figure 4. The environmental monitoring equipment installed indoors is shown in Figure 4a, the monitored environmental parameters are transmitted to the Digital Twin O&M Platform, and the integrated data are analyzed and organized to obtain a clear environmental data display interface, as shown in Figure 4b.

Figure 4.
Environmental monitoring system. (a) Indoor environmental parameters monitored by the platform. (b) Indoor environmental monitoring equipment. 温度: Temperature; 湿度: Humidity.
3.3.2. Lighting Intelligent Management System
The illumination system is further enhanced by the construction of a digital twin platform. Each room in the education center that has personnel activities has lighting controllers and intelligent panels installed. These can be manually operated to adjust the brightness or to turn on and off the controlled circuit loads. They can also be remotely operated in real time through the digital twin operation and maintenance platform, where they can be programmed to work in their work mode and to turn on and off the lights automatically in order to achieve the purpose of intelligent control.
The lighting management system of the digital twin platform is shown in Figure 5. The indoor lighting fixtures are simultaneously connected to the lighting controller, as shown in Figure 5a, and the intelligent control panel, as shown in Figure 5b, which can realize remote control and intelligent control of lighting.

Figure 5.
Indoor lighting control system. (a) Lighting controller. (b) Intelligent control panel.
3.3.3. HVAC Intelligent Management System
According to the parameter information provided by the indoor environmental sensors, combined with the activity status of the personnel, through the remote control of the digital twin platform, the air conditioning equipment can be accurately controlled in terms of the on-state, temperature, humidity, mode settings, wind speed, etc., and can display the parameters of the various operating modules on the platform, reducing the burden on the staff and realizing intelligent control.
Figure 6 depicts the digital twin platform’s intelligent control system for air conditioning. The intelligent control panel installed in the air conditioning equipment is shown in Figure 6a, which transmits the operation data to the operation and maintenance platform to be analyzed and processed, and is then displayed as shown in Figure 6b,c.
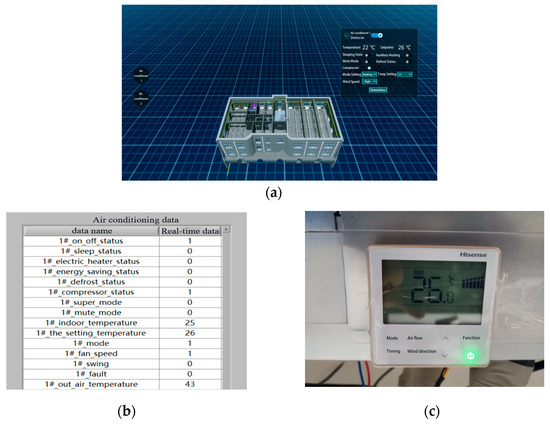
Figure 6.
Intelligent control system for the air conditioner. (a) Remote control of the air conditioner operation status by the platform. (b) The platform displays the operation parameters of the air conditioner. (c) Intelligent control panel of the air conditioner.
3.3.4. Building Energy Consumption Monitoring and Management
In addition to statistically analyzing the total power consumption of each moment to produce a data trend graph and the percentage of energy consumption for each module, the building energy management page could display the total power consumption of each floor as well as the power consumption of the air conditioning system, lighting, sockets, and other appliances. With the use of smart meter data and database storage, it is possible to view, in real time, the power consumption of each branch circuit as well as previous energy consumption data. This provides a theoretical basis for additional data analysis and research.
Figure 7 displays the digital twin platform’s energy usage monitoring system. The energy consumption statistics of each floor are shown in Figure 7a, and Figure 7b displays the energy consumption statistics for each time as well as the building’s overall energy usage, which collects and arranges the real-time energy consumption data and displays them clearly in the operation and maintenance platform, so as to provide researchers with in-depth analysis of and applications for the data.

Figure 7.
Building Energy Consumption Monitoring System. (a) Query the floor’s itemized power consumption page. (b) Energy consumption statistics analysis page.
4. Analysis and Prediction of Factors Affecting Energy Consumption
4.1. Previous Data Collected by the O&M Platform
Using the storage function of the digital twin operation and maintenance platform to statistically analyze the past data, we obtained the month-by-month power consumption data of the BIM Education Center in 2023 for each category. As shown in Figure 8, we can see that the power consumption during the students’ vacation is obviously lower than the power consumption after the students return to school, and the power consumption in June, November, and December is obviously higher than the other times due to the concentration of the microcomputer room usage time. While lighting accounts for a very small portion of total power consumption, it is still important to pay attention to other power consumption that has a small but not very critical impact. At the same time, equipment accounts for a very large portion of total power consumption, making it one of the major factors affecting overall power consumption.
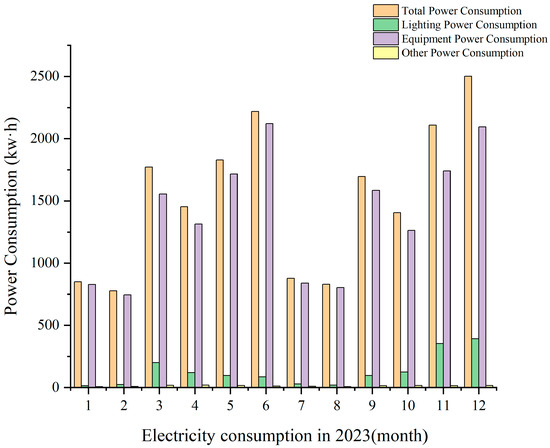
Figure 8.
Month-by-month power consumption of the BIM Education Center in 2023.
The electricity consumption of each branch is shown in Table 1, where equipment and lighting fixtures use a very large amount of time, occupying a large proportion of the time, while the other branches use relatively little time. At the same time, the usage rate of equipment and lighting is also very high, almost reaching full capacity during school hours. These actual scenarios of electricity consumption need to be studied and analyzed with the help of data.

Table 1.
Electricity consumption by branch circuit.
4.2. Methodology
4.2.1. Pearson Correlation Analysis
To evaluate the relationship between the influencing factors and electricity consumption, the Pearson correlation coefficient was computed. Equation (1) can be used to compute this [26]:
where is the Pearson correlation coefficient, x is the the unique influencing element, and µ1 is electricity consumption.
To create the correlation heat map, data on the building’s power usage and numerous influencing factors were subjected to a Pearson correlation analysis, as shown in Figure 9. With a correlation coefficient of 0.67, the concentration of CO2 had the highest correlation with electricity consumption; the utilization rate of equipment had the second-highest correlation with electricity consumption, at 0.33. These results indicate that the utilization rate of equipment has a greater impact on electricity consumption. With correlation values of 0.25 and 0.2, respectively, the utilization rate of lighting fixtures and humidity and power consumption are more closely correlated; power consumption is also somewhat impacted by these factors. With correlation coefficients of 0.098 and 0.1, respectively, temperature and PM2.5 levels had less of an effect on electricity consumption and had a lesser association with it.
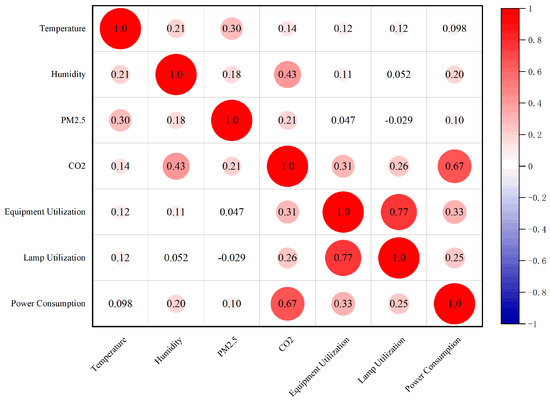
Figure 9.
Heat map for Pearson correlation analysis of influencing factors.
Therefore, based on the comparison of the correlation coefficients of the influencing factors on electricity consumption, the four most relevant influencing factors—CO2 concentration, equipment utilization, lighting utilization, and humidity—were selected for subsequent development of the model in this study.
4.2.2. Multiple Linear Regression
Equation (2) illustrates how the mathematical technique known as multiple linear regression (MLR) evaluates the linear or nonlinear relationship between a number of variables by selecting multiple independent variables and one dependent variable to examine their interrelationships [27]:
where β0 is the regression coefficient, β1, ……, βk are the coefficients of regression, µ2 is the electricity consumption (kW·h), and x1, ……, xk are the influencing factors.
The real-time data of power consumption and influencing factors were collected and organized into a dataset for model development. The collated dataset was analyzed and processed using MATLAB R2023b, with β as the regression coefficient and μ2 as the expected power consumption, to derive a complete empirical formula to develop the multiple linear regression model. The influencing factors were treated as independent variables, and power consumption was treated as the dependent variable.
4.2.3. Support Vector Machine
SVM employs a linear classifier that maximizes the designated intervals inside the feature space in order to set itself apart from perceptual computers. Furthermore, SVM classifiers are nonlinear because they employ kernel strategies. SVM uses interval maximization as its learning strategy, which is characterized as the problem of solving convex quadratic programming similar to the process of decreasing a regularized hinge loss function. Convex quadratic programming can be solved using the optimization process known as the SVM learning algorithm [28].
Matlab R2023b was utilized to develop an SVM. The field test dataset was divided into the training set and test set, which accounted for 80% and 20% of the data, respectively. The test set was used to predict the model after it had been trained using the training set.
4.2.4. BP Neural Network
Surrogating the original physics-based model, BP is a typical feedforward network that records large amounts of input and output data and creates new mathematical correlations. The forward propagation of signals and the backward propagation of mistakes are characteristics of BP. A BP model is composed of three distinct layers: an input layer, a hidden layer, and an output layer. An activation function that disperses errors and signals connects each neuron in the subsequent layer to each neuron in the preceding layer.
The weights of the preceding neuron layers are altered by reversing the input errors from the output layer [29].
The BP was developed and trained using the Matlab “nntool” package. And Equation (3) illustrates the use of a sigmoid function as the activation function.
where the expected value is denoted by X.
The Levenberg algorithm, which combines gradient descent and Gauss–Newton methods, was used to optimize the weights. For testing and training, twenty percent and eighty percent of the datasets, respectively, were reserved. The mean square error (RMSE) and coefficient of determination (R2) were used to evaluate the three models in this investigation [30].
4.3. Model Development
Equation (4) illustrates how the MLR’s empirical formula was used to estimate the study area’s power consumption using the SVM, BP, and MLRs after the influencing factors had been determined.
where µ3 is electricity consumption (kW·h), x1 is humidity (%), x2 is CO2 (PPM), x3 is equipment utilization (%), and x4 is lamp utilization (%).
The dataset will be analyzed using three models: the MLR, SVM, and BP neural network. The following points are the outcomes.
The data of multiple influencing factors were organized and input into the three models for testing, and the fitting effect of comparing the predicted values with the actual values as well as the percentage error curves are shown in Figure 10.
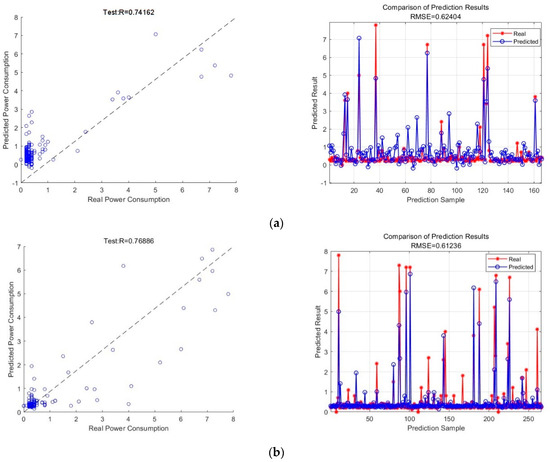
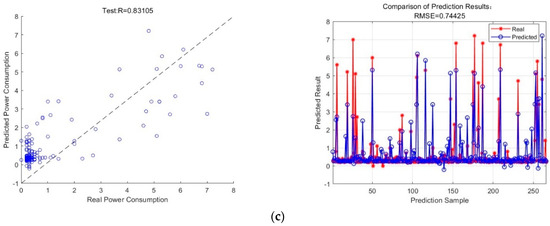
Figure 10.
Plots showing the anticipated outcomes for several models. (a) MLR; (b) SVM; (c) BP model. The circles are scatter plots, which are plots of the distribution of data points on the plane of a Cartesian coordinate system in a regression analysis. The scatterplot indicates the general trend of the dependent variable with respect to the independent variable, from which a suitable function can be chosen to fit the data points.
(1) Figure 10a shows the prediction results of the multiple linear regression model. The left panel is the variance value of the predicted value and the actual value of the test set of the MLR, R2, and the right panel is the contrast value of the prediction result of the test set of the MLR, RMSE.
(2) Figure 10b shows the prediction results of the Support Vector Machine model. The left panel is the variance value of the prediction value of the test set of the SVM with respect to the actual value, R2, and the right panel is the contrast value of the prediction result of the test set of the SVM, RMSE.
(3) Figure 10c shows the prediction results of the BP neural network model. The left figure is the variance value of the prediction value of the test set of the BP neural network model and the actual value R2, and the right figure is the contrast value of the prediction result of the test set of the BP neural network model, RMSE.
The three are compared with each other for analysis. According to the scatter plot and error curve and the corresponding values, we can judge which model has a higher prediction accuracy and which model is more favorable for allowing us to predict the model data, which provides the basis for our research theory.
Table 2 displays the values of the three models’ prediction outcomes. The R2 value of the BP model is higher than that of the other two models, suggesting that it has the least variance between the actual and predicted values. The BP model also exhibits very good prediction accuracy with a lower RMSE value. As a result, the monitored data were analyzed, and conclusions were drawn using the BP model.

Table 2.
The three approaches’ respective error and parameter statistics.
To verify the effectiveness of the BP model, data on humidity, CO2 concentration, equipment use, and lighting fixture usage were examined and included in the model. A graph showing the variance in electricity usage and each of the individual contributing elements was generated based on the output data. The relationship between the distinct influencing elements and power usage is depicted in these graphs. The associated power consumption exhibits a steady rising trend as the value of the individual influencing variables rises; this trend, shown by the curve’s trend, represents the real effect of the individual influencing elements on the power consumption.
After comparing several prediction models, the BIM education center’s power consumption is predicted using the BP model, which has the highest accuracy. All four influencing factors have a linear relationship with power consumption, as shown in Figure 11. Among them, humidity below 25% has a small effect on power consumption, between 25% and 35%, the change in power consumption is insignificant, and above 35%, it has a large effect on the change in power consumption, as shown in Figure 11a. While the trend in power consumption changes slowly between 300 PPM and 900 PPM of CO2 concentration, the trend in changes above 900 PPM is more obvious, and the relationship between CO2 concentration and power consumption is close, as shown in Figure 11b.
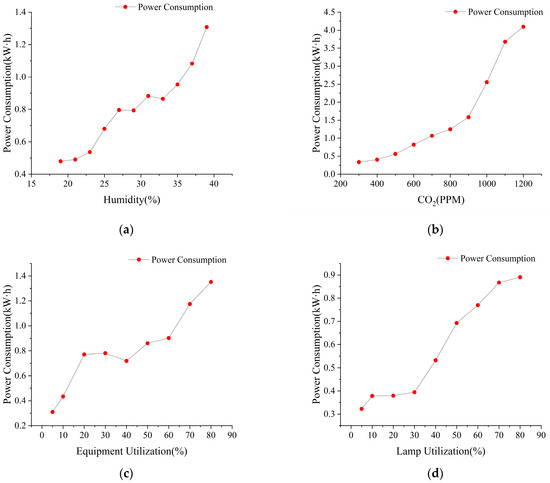
Figure 11.
One effect factor, as well as the electricity usage, is predicted by the BP model. (a) The relationship between electricity consumption and humidity. (b) The relationship between electricity consumption and CO2. (c) The relationship between power consumption and equipment utilization. (d) The relationship between electricity consumption and the utilization of lighting fixtures.
Meanwhile, the predicted value of power consumption changes gradually with the increase in the influence value, and the trend in the predicted value changes significantly within a certain value interval. For example, when the equipment utilization rate is between 20% and 60%, the change in power consumption is small and tends to be stable, and when the equipment utilization rate reaches more than 60%, the trend in power consumption will increase obviously, as shown in Figure 11c, while when the lighting utilization rate is within 30%, the change in power consumption is insignificant, and when the lighting utilization rate reaches 30% or later, the value of power consumption will increase rapidly, and the trend in increase is obvious, as shown in Figure 11d. Secondly, a single influencing factor will be interfered by other influencing factors, and analyzing and studying power consumption requires a large amount of sample data so that the results of the study can be more in line with scientific laws.
4.4. Analysis and Discussion
The factors that have a stronger impact on the power consumption are found after the BP model is used to estimate the power consumption, and the power consumption is then appropriately examined in light of the BIM center’s actual use. Upon examining the power consumption data of the BIM Center training building over the previous two years, we discovered that the lighting and equipment in the computer room consume a significant amount of the building’s power consumption during class. In addition, the entire day, the air conditioning system operates at maximum efficiency to control the room’s temperature, humidity, and fresh air intake.
After a long period of observation, the researchers found that all the computer equipment in the microcomputer room was on during the class period, but some of the computer equipment was not being used by the students. Whether during the day or at night, the lighting equipment in the microcomputer room was running at full capacity, and the air-conditioning equipment was always manually turned on at full capacity, which made it unable to accurately adjust the power output in real-time according to the environmental parameters. This undoubtedly causes a great waste of energy, so we needed to take the following appropriate measures to reduce these phenomena.
(1) The digital twin operation and maintenance platform of the BIM center can monitor the parameters in the room in real time, and at the same time, it should be combined with the personnel positioning sensors and photoelectric sensors, and the internal intelligent control system should be installed to turn off idle computer equipment in time, so as to avoid the energy consumption caused by unused computer equipment without any reason.
(2) According to the visible situation of light during the day, the power of the lighting equipment is adjusted again in real time, avoiding most of the time lighting fixtures maximum power operation, and thus effectively reducing energy consumption.
(3) The microcomputer room is installed with an equipment environment parameter monitoring device. It can monitor indoor air data, temperature, humidity, etc., when combined with the digital twin platform and intelligent control system, and the output power of the air conditioning equipment is adjusted in real time when environmental parameters change due to changes in indoor personnel. This maximizes the requirements of environmental comfort for indoor staff, but also minimizes the power consumption required by the building in order to achieve the goal of building energy efficiency.
(4) The O&M platform sets the red line of power consumption for the month, and the O&M platform issues a warning when the power consumption is about to reach the set target, reminding the management personnel that there is a problem with the power consumption of the building, finding out the reasons for the obvious changes in power consumption, and making appropriate adjustments.
(5) Based on the data collected by the digital twin operation and maintenance platform, combined with artificial intelligence AI analysis and machine learning predictions, a set of perfect energy-saving optimization strategies were made to help the management personnel accurately make corresponding adjustments to the power consumption equipment. At the same time, this was combined with the intelligent control system to effectively control the electricity equipment in each room, so that the use of electricity meets the work demand at the same time to maximize usage.
After finding out the key influencing factors through the prediction analysis of the BP neural network model, the training building of the BIM Education Center in the first half of this year made some adjustments from the above aspects and formed a set of effective management modes. After adjusting the equipment operation scheme of the training building, the month-by-month power consumption of the training building of the BIM Education Center in the first half of this year was tracked and compared with that of the first half of 2023, as shown in Figure 12.
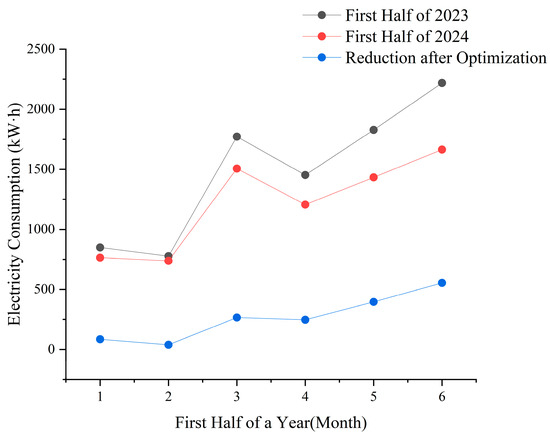
Figure 12.
Comparison of power consumption in the first half of 2024 with that of 2023 after optimizing the building equipment operation scheme.
After optimizing the equipment operation scheme in the training building of the BIM Education Center, the power consumption in the first half of 2024 compared to 2023 has decreased significantly. In January and February, the school was in the holiday phase, only the equipment group in the data center was running, and all other equipment was off, so the change in power consumption was not obvious. In March–May, the microcomputer room was heavily used due to students attending classes, and after the use of the new energy efficiency management program, the power consumption dropped by about 20% compared to last year. In June, the temperature in the classroom was very high, and it was necessary to turn on the air conditioner during class time to maintain a good indoor environment. Using the new energy-saving plan to manage the air conditioning equipment, the power consumption was reduced by 25% compared to last year, which is a good energy-saving effect, and the optimized management plan has been further verified.
Predicting building energy consumption data through the BP neural network to optimize the operation of building equipment has been verified to play a very good role. At the same time, with the gradual increase in the types of equipment in the building, the operation mode also changed, which required us to continuously analyze the important influencing factors and develop a better model to guide the managers towards further optimizing the equipment operation scheme to achieve a maximum energy-saving effect.
5. Conclusions
The use of digital twin technology in building operations and maintenance management is growing. While it can perform basic control activities like equipment switching and display energy consumption statistics from real-time building operations, it is not capable of doing sophisticated management tasks. Owing to the complexity and unpredictability of the building’s actual electricity consumption, it is essential to realize a quick assessment of the energy consumption data in order to enhance the digital twin operation and maintenance management platform. Following this, a quick monitoring strategy must be created in order to increase the building’s operational efficiency and decrease its energy consumption.
It is commonly known that digital twin technology is important and can be applied to a building’s energy management. By tracking the energy use of a building’s facilities, such as its lighting systems, power consumption, and HVAC usage, in real time, this cutting-edge technology gives managers insights into a building’s energy consumption patterns, and enables energy-use optimization and improvement. In the meantime, research on the future directions of combining DT and machine learning technology concludes that a building’s energy analytics can enhance management procedures, maximize energy efficiency, and increase the precision of energy predictions. Furthermore, a large amount of recent literature has focused on this hybrid technology, which has promise for easing the switch to greener energy sources and, eventually, achieving sustainable development objectives. Future building energy simulation research and development will be heavily reliant on ongoing model validation and refinement, better data quality, more interdisciplinary cooperation, and more interpretable models.
In this paper, after analyzing the influencing factors of power consumption in the BIM education center, a perfect BP neural network model is established to predict the future power consumption and optimize the management mode to achieve the purpose of saving energy. At the same time, at any time the types of equipment continue to increase, manual management will become more and more cumbersome, so it is necessary to combine them with the intelligent control system to manage the operating status of the equipment to help reduce the workload of the management staff. How to guide the intelligent control system with the results of the model’s predictions and analysis to realize the intelligent control of the BIM education center in the real sense and to build an energy-saving campus building will be the subject of our future research.
Author Contributions
Conceptualization, F.H., F.D., S.J. and K.Z.; methodology, F.H. and F.D.; validation, F.H. and F.D.; data curation, F.D., S.J. and K.Z.; writing—original draft preparation, F.H. and F.D.; writing—review and editing, F.H., F.D., S.J. and K.Z. All authors have read and agreed to the published version of the manuscript.
Funding
This research is supported by Jilin Science and Technology Development Program Project. Project name: Key Technology Development and Application of Building Operation and Maintenance Management Platform Based on BIM Technology, No. 20210203112SF.
Data Availability Statement
The data presented in this study are available on request.
Conflicts of Interest
The authors declare no conflicts of interest.
References
- Chung, M.H.; Rhee, E.K. Potential opportunities for energy conservation in existing buildings on university campus: A field survey in Korea. Energy Build. 2014, 78, 176–182. [Google Scholar] [CrossRef]
- Alshuwaikhat, H.M.; Abubakar, I. An integrated approach to achieving campus sustainability: Assessment of the current campus environmental management practices. J. Clean. Prod. 2008, 16, 1777–1785. [Google Scholar] [CrossRef]
- Koester, R.J.; Eflin, J.; Vann, J. Greening of the campus: A whole-systems approach. J. Clean. Prod. 2006, 14, 769–779. [Google Scholar] [CrossRef]
- Liu, C.-L.; Tseng, C.-J.; Huang, T.-H.; Yang, J.-S.; Huang, K.-B. A multi-task learning model for building electrical load prediction. Energy Build. 2023, 278, 112601. [Google Scholar] [CrossRef]
- Tekler, Z.D.; Low, R.; Zhou, Y.; Yuen, C.; Blessing, L.; Spanos, C. Near-real-time plug load identification using low-frequency power data in office spaces: Experiments and applications. Appl. Energy 2020, 275, 115391. [Google Scholar] [CrossRef]
- Wang, Z.; Xia, L.; Yuan, H.; Srinivasan, R.S.; Song, X. Principles, research status, and prospects of feature engineering for data-driven building energy prediction: A comprehensive review. J. Build. Eng. 2022, 58, 105028. [Google Scholar] [CrossRef]
- Wang, Z.; Srinivasan, R.S. A review of artificial intelligence based building energy use prediction: Contrasting the capabilities of single and ensemble prediction models. Renew. Sustain. Energy Rev. 2017, 75, 796–808. [Google Scholar] [CrossRef]
- Bourdeau, M.; Zhai, X.Q.; Nefzaoui, E.; Guo, X.; Chatellier, P. Modeling and forecasting building energy consumption: A review of data-driven techniques. Sustain. Cities Soc. 2019, 48, 101533. [Google Scholar] [CrossRef]
- Seyedzadeh, S.; Rahimian, F.P.; Rastogi, P.; Glesk, I. Tuning machine learning models for prediction of building energy loads. Sustain. Cities Soc. 2019, 47, 101484. [Google Scholar] [CrossRef]
- Rattan, P.; Penrice, D.D.; Simonetto, D.A. Artificial intelligence and machine learning: What you always wanted to know but were afraid to ask. Gastro Hep Adv. 2022, 1, 70–78. [Google Scholar] [CrossRef]
- Soori, M.; Arezoo, B.; Dastres, R. Artificial intelligence, machine learning and deep learning in advanced robotics, a review. Cogn. Robot. 2023, 3, 54–70. [Google Scholar] [CrossRef]
- Liu, M.; Fang, S.; Dong, H.; Xu, C. Review of digital twin about concepts, technologies, and industrial applications. J. Manuf. Syst. 2021, 58, 346–361. [Google Scholar] [CrossRef]
- Glaessgen, E.; Stargel, D. The digital twin paradigm for future NASA and US Air Force vehicles. In Proceedings of the 53rd AIAA/ASME/ASCE/AHS/ASC Structures, Structural Dynamics and Materials Conference 20th AIAA/ASME/AHS Adaptive Structures Conference 14th AIAA, Honolulu, HI, USA, 23–26 April 2012; p. 1818. [Google Scholar]
- Tao, F.; Xiao, B.; Qi, Q.; Cheng, J.; Ji, P. Digital twin modeling. J. Manuf. Syst. 2022, 64, 372–389. [Google Scholar] [CrossRef]
- Opoku, D.-G.J.; Perera, S.; Osei-Kyei, R.; Rashidi, M. Digital twin application in the construction industry: A literature review. J. Build. Eng. 2021, 40, 102726. [Google Scholar] [CrossRef]
- Qi, Q.; Tao, F.; Hu, T.; Anwer, N.; Liu, A.; Wei, Y.; Wang, L.; Nee, A.Y. Enabling technologies and tools for digital twin. J. Manuf. Syst. 2021, 58, 3–21. [Google Scholar] [CrossRef]
- Wang, W.; Guo, H.; Li, X.; Tang, S.; Xia, J.; Lv, Z. Deep learning for assessment of environmental satisfaction using BIM big data in energy efficient building digital twins. Sustain. Energy Technol. Assess. 2021, 50, 101897. [Google Scholar] [CrossRef]
- Singh, M.; Fuenmayor, E.; Hinchy, E.P.; Qiao, Y.; Murray, N.; Devine, D. Digital twin: Origin to future. Appl. Syst. Innov. 2021, 4, 36. [Google Scholar] [CrossRef]
- Arowoiya, V.A.; Moehler, R.C.; Fang, Y. Digital twin technology for thermal comfort and energy efficiency in buildings: A state-of-the-art and future directions. Energy Built Environ. 2024, 5, 641–656. [Google Scholar] [CrossRef]
- Halmetoja, E. The role of digital twins and their application for the built environment. In Industry 4.0 for the Built Environment: Methodologies, Technologies and Skills; Springer: Cham, Switzerland, 2022; pp. 415–442. [Google Scholar]
- Fuller, A.; Fan, Z.; Day, C.; Barlow, C. Digital twin: Enabling technologies, challenges and open research. IEEE Access 2020, 8, 108952–108971. [Google Scholar] [CrossRef]
- Begić, H.; Galić, M. A Systematic Review of Construction 4.0 in the Context of the BIM 4.0 Premise. Buildings 2021, 11, 337. [Google Scholar] [CrossRef]
- Ahmed, E.; Farag, M.; Darwish, A.; Hassanien, A.E. Digital Twin Technology for Energy Management Systems to Tackle Climate Change Challenges. In The Power of Data: Driving Climate Change with Data Science and Artificial Intelligence Innovations; Springer: Cham, Switzerland, 2023; pp. 137–156. [Google Scholar]
- Wang, Y.; Kang, X.; Chen, Z. A survey of digital twin techniques in smart manufacturing and management of energy applications. Green Energy Intell. Transp. 2022, 1, 100014. [Google Scholar] [CrossRef]
- Li, C.; Lu, P.; Zhu, W.; Zhu, H.; Zhang, X. Intelligent Monitoring Platform and Application for Building Energy Using Information Based on Digital Twin. Energies 2023, 16, 6839. [Google Scholar] [CrossRef]
- Biswas, P.; Samanta, T. A method for fault detection in wireless sensor network based on pearson’s correlation coefficient and support vector machine classification. Wirel. Pers. Commun. 2022, 123, 2649–2664. [Google Scholar] [CrossRef]
- Navid, M.; Niloy, N. Multiple linear regressions for predicting rainfall for Bangladesh. Communications 2018, 6, 1–4. [Google Scholar] [CrossRef]
- Villegas, M.A.; Pedregal, D.J.; Trapero, J.R. A support vector machine for model selection in demand forecasting applications. Comput. Ind. Eng. 2018, 121, 1–7. [Google Scholar] [CrossRef]
- Zhang, B.; Chen, M.; Ma, Z.; Zhang, Z.; Yue, S.; Xiao, D.; Zhu, Z.; Wen, Y.; Lü, G. An online participatory system for SWMM-based flood modeling and simulation. Environ. Sci. Pollut. Res. 2022, 29, 7322–7343. [Google Scholar] [CrossRef]
- Serikov, T.; Zhetpisbayeva, A.; Mirzakulova, S.; Zhetpisbayev, K.; Ibrayeva, Z.; Tolegenova, A.; Soboleva, L.; Zhumazhanov, B. Application of the NARX neural network for predicting a one-dimensional time series. East.-Eur. J. Enterp. Technol. 2021, 5, 113. [Google Scholar] [CrossRef]
Disclaimer/Publisher’s Note: The statements, opinions and data contained in all publications are solely those of the individual author(s) and contributor(s) and not of MDPI and/or the editor(s). MDPI and/or the editor(s) disclaim responsibility for any injury to people or property resulting from any ideas, methods, instructions or products referred to in the content. |
© 2024 by the authors. Licensee MDPI, Basel, Switzerland. This article is an open access article distributed under the terms and conditions of the Creative Commons Attribution (CC BY) license (https://creativecommons.org/licenses/by/4.0/).