Article

Comprehensive Experimental Study of Biomass Conversion Behavior: From Particle Phenomena to Reactor Scale

1
MEtRICs Research Centre, University of Minho, 4800-058 Guimarães, Portugal
2
ALGORITMI Research Centre/LASI, University of Minho, 4800-058 Guimarães, Portugal
3
Faculty of Engineering Science and Technology, Universidade Nacional Timor Lorosa’e, Rua Formosa 10, Díli 314, Timor-Leste
*
Author to whom correspondence should be addressed.
Energies 2024, 17(15), 3650; https://doi.org/10.3390/en17153650
Submission received: 19 April 2024 / Revised: 20 July 2024 / Accepted: 23 July 2024 / Published: 24 July 2024
(This article belongs to the Section A4: Bio-Energy)

Abstract

:
During biomass combustion in a grate-fired boiler, each particle undergoes a sequence of different reactions, and the phenomena differ from the conversion of a single, thermally thin, particle. Hence, this paper aims to deepen the understanding of biomass conversion processes and provides valuable insights for advancing biomass-based energy systems. Firstly, the weight loss characteristics of the larger particles of eucalyptus, pine, acacia, and olive samples were investigated at different isothermal temperatures in a purpose-built reactor that simulates the devolatilization process in a controllable manner. As opposed to the thermogravimetric analysis using thermally thin particles, it was concluded that all fuels show that the combustion of large particles does not exhibit separate consecutive conversion stages, due to internal diffusion resistance. Furthermore, it was verified that the devolatilization rate depends mainly on the reactor temperature, and, consequently, the mass-loss profile is independent of the biomass type. In addition to these experiments, the composition of the gases over the devolatilization period was analyzed for the main fuel used in power plants, eucalyptus. Once again, a strong correlation to the reactor temperature was observed, with CO2 and CO always being the main devolatilization products. The temperature dependence of both compounds presented an increase from 8 to 13% between 600 and 800 °C for CO, while the CO2 yield only slightly increased from 11 to 12%. These observations were essential to identify the transport phenomena effect and the gaseous products released during the biomass combustion.

1. Introduction

In the pursuit of sustainable and renewable energy sources, biomass has emerged as a promising resource. However, efficient biomass conversion into proper energy forms, as a by-product for pellets as a fuel to produce electric power [1], requires a profound understanding of its behavior across multiple scales, from particles to reactor systems. Biomass, derived from organic matter such as agricultural residues, forest residues, and dedicated energy crops, has gained increasing attention as a sustainable and renewable energy source. Its conversion into valuable bioenergy and biofuels offers a promising solution to meet the growing energy demands while reducing greenhouse gas emissions. To unlock the full potential of biomass as a renewable resource, a comprehensive understanding of its conversion behavior is crucial. This requires a detailed investigation that encompasses the entire spectrum, from particle-level phenomena to reactor-scale operations [2].
To understand transport phenomena at a particle level, thermogravimetric analysis (TGA) is the most useful method. This is a thermo-analytical method widely implemented to investigate and compare thermal degradation events and kinetics during the conversion of solid materials, such as coal and biomass [3]. The mass reduction is measured, under controlled conditions, while the thermal process is taking place, as the temperature increases. It is known that the composition, structure, and properties of biomass particles significantly influence the conversion process. Consequently, a comprehensive experimental exploration of particle behavior elucidates critical insights into the kinetics of the reaction. This knowledge is indispensable for designing effective particle heating strategies, optimizing reactions, and enhancing overall conversion efficiency. A good example of the TGA potential in the study of biomass conversion was presented by Lelis et al. [4]. Their study explored the impact of various conditions (heating rate, particle size, flow rate, and atmosphere) on the thermal behavior and kinetics of pine wood particles. The authors verified a more noticeable effect of the heating rate when compared to the effect of the air flow rate on biomass conversion and its kinetics. Furthermore, the atmosphere effect on the thermal decomposition behavior was evident, and the presence of O2 changes the mass-loss curve mainly at high temperatures.
While understanding particle phenomena is fundamental, the true impact of biomass conversion is observed at the reactor scale. An inclusive experimental study spanning this scope allows us to evaluate how particle-level dynamics translate into macroscopic reactor performance. This type of evaluation is possible using macro-TGA since it is similar to TGA but uses larger particles and weights. Within this subject, Samuelsson et al. [5] investigated mass-loss rates for wood chips under isothermal pyrolysis conditions, comparing their findings with low-heating-rate powder data, highlighting valuable insights into the pyrolysis behavior of biomass. Gauthier et al. [6] presented novel experimental developments for studying the pyrolysis of centimeter-scale wood particles, offering new insights into the pyrolysis process at a larger scale and contributing to a deeper understanding of wood biomass conversion. Bruch et al. [7] developed a comprehensive model for wood combustion under fixed bed conditions, providing a valuable tool for predicting and optimizing combustion processes and offering practical implications for biomass energy utilization. The numerical approach used macro-kinetic data to provide deeper insights into the processes within a packed bed during the combustion of solid fuel. The results showed a good fit to experimental and theoretical results. Becidan et al. [8] conducted an experimental study on the pyrolysis of thermally thick biomass residue samples, analyzing intra-sample temperature distribution and the scaling effect of sample weight, which highlighted important factors influencing biomass pyrolysis behavior.
These studies were developed considering an inert atmosphere and by performing experiments in an oxidative atmosphere. The research was essential in providing additional insights into biomass conversion processes, which is especially relevant for industrial applications where combustion and gasification occur in the presence of oxygen. In this field, in the literature, there are some relevant studies. For instance, Hu et al. [9] investigated gaseous production kinetics and solid structure analysis during the isothermal conversion of biomass pellets under different atmospheres. The study provided insights into biomass conversion processes and their dependence on environmental conditions. The results revealed that CO2 formation was largely promoted when using the O2 atmosphere. Baumgarten et al. [10] studied the kinetics of wood devolatilization during start-up, offering valuable insights into the thermal decomposition of wood and its implications for combustion processes. The author also highlighted the importance of the availability and valid kinetic data for combustion models, and this was the motivation of the work. Nikku et al. [11] characterized the reactivity of municipal and industrial solid wastes and biomass using a vertical tube reactor and by also developing a TGA. This work aimed to obtain information to contribute to the understanding of combustion behavior and its potential applications in energy conversion. One relevant observation was the reduction in the char reactivity when the oxygen concentration was reduced, while the volatile reactivity was reduced for some materials and increased for others. Weissinger [12] conducted in situ Fourier-transform infrared spectroscopic investigations of species from biomass fuels in a laboratory-scale combustor, elucidating the release of nitrogenous species and the major carbon species (CO, CO2, and CH4) during biomass combustion. The author observed that the propagation velocity of the reaction front was the main parameter and the most suitable to describe the overall conversion of nitrogen. Furthermore, NH3 was the major nitrogenous species released, while significantly lower levels of NO and almost negligible amounts of HCN were measured. Orang and Tran [13] explored the effect of feedstock moisture content on biomass boiler operation, providing insights into the influence of moisture levels on combustion efficiency and emissions. Brunner et al. [14] conducted advanced biomass fuel characterization based on tests with a specially designed lab-scale reactor, offering valuable data for optimizing biomass utilization and energy conversion processes.
Hence, considering this background, the comprehensive experimental study of biomass conversion behavior, spanning from particle phenomena to reactor scale, encapsulates the essence of knowledge needed to unlock the full potential of biomass as a renewable energy source. Thus, the main objective of this work is to present a comprehensive experimental study focusing on biomass conversion behavior, covering both particle-level phenomena and laboratory-scale operations. Through a systematic and in-depth examination, this study aims to contribute to the fundamental understanding of biomass conversion kinetics, reaction pathways, and gaseous emissions. Although some investigations have been published in this area, we observed a need for studies in biomass combustion involving thermal conversion analysis, kinetics, and gaseous emissions. Until now, few works have succeeded in analyzing these three issues from micro to macro scales. In that sense, this work addresses the biomass conversion process in a simplified manner, but it represents the operation of industrial grate-fired boilers and properly characterizes the biomass decomposition and release of volatiles.

2. Experimental Methodology

To fairly compare the combustion behaviors of various types of solid biomass samples, experiments need to be carried out under the same conditions. For this purpose, a purpose-built macro thermogravimetric reactor and a thermogravimetric analyzer were used. Section 2.1, Section 2.2 and Section 2.3 present detailed information about the samples, features, and operation procedures of the experiments.

2.1. Biomass Feedstock

The woodchips necessary for the experiments were prepared from large eucalyptus, acacia, pine, and olive trunks using a knife chipper. Pine, here referred to as Pinus pinaster, along with eucalyptus (Eucalyptus globulus), is the main Portuguese forest species. AcaciaAcacia dealbata—is an invasive species, and an interesting alternative fuel since wildfires and climatic changes have contributed to reducing the pine and eucalyptus forest area [15]. Olive is also an interesting alternative feedstock due to the high olive production in Portugal. Consequently, olive tree pruning should be a very interesting alternative for power generation.
Thus, considering these four different biomass fuels and the use of a knife chipper machine, larger particles were obtained, with dimensions similar to the ones used in biomass power plants, ranging from a few millimeters up to hundreds of millimeters. The particles were initially spread out in a room for air-drying to reduce moisture content. Subsequently, they underwent sieving to assess particle-size distribution using horizontal screening according to standard EN 15149-1:2010 Part 2, utilizing sieves with square hole apertures of 3.15, 8, 16, and 50 mm. The most representative particle-size class fell between 8 and 16 mm, consistent with analysis from a biomass power plant [1]. Particles within this size range were then collected and utilized for the experimental program. Following air-drying for approximately one month, the moisture content of the particles ranged between 10 and 15% (dry basis).
In addition to the particle-size determination, the woodchips were assessed in terms of their dimension and bulk density. Being of irregular shape, the equivalent diameter of a spherical particle was determined for the most representative particle-size range (8 to 16 mm), as 16.78 mm. In its turn, the bulk density ranges from 185 to 253 kg/m3.
The raw materials previously milled were also used to perform the TGA experiments. After the milling process, the samples were sieved in a vibratory sieve shaker to collect only particles with a size between 0.125 and 0.250 mm.
Regarding the elemental and proximate composition of the particles, this was also evaluated considering the standards for solid fuel characterization (CEN/TS 15414:2006 and CEN/TS 15104:2005, respectively), and the results are presented in Table 1. The heating value of the different fuels was also determined using LECO CS-200 equipment, and the data were added to Table 1. It is important to highlight that fuel properties are dependent on the collection sites and storage methods.

2.2. Apparatus: Macro- and Micro-Thermogravimetric Equipment

As mentioned before, two different types of equipment were considered to develop the experiments. One of them is the micro-thermogravimetric analyzer, which consists of common thermogravimetric equipment from the TA Instruments brand, model SDT 2960. The other equipment, the macro-TGA, consists of a purpose-built reactor for a scale relevant to industrial applications, developed to study the combustion of large particles and determine the mass loss and gas compounds released during the devolatilization. The reactor can replicate the behavior of a fuel portion moving along the grate from an industrial biomass boiler and, thereby, passing through the different reaction zones (drying, devolatilization, and char combustion). The reactor is 200 mm in diameter and 350 mm in height; the walls are made of refractory material to reduce heat losses and contain a 2 kW electrical heater. In the upper part of the reactor, there is a rotating lid with a rip of 10 mm to allow the support of the sample holder, which is connected to a scale. Hence, the mass loss during the experiment is measured over time. The macro-TGA reactor has been used in other studies such as in [16]; however, in the present study, instead of a portable gas analyzer to measure the main gas compounds, a sample bag to collect the flue gas was used for subsequent analysis in a micro-gas chromatograph (GC). Figure 1 schematically represents the experimental macro-thermogravimetric test facility used in this work.

2.3. Experimental Procedure

The TGA experiments were performed in an oxidative atmosphere with a non-isothermal heating with an in situ drying heating program defined for the thermal decomposition analysis. Non-isothermal experiments are generally adopted for the determination of kinetic parameters as they are considered more reliable and less time-consuming than isothermal analysis [17]. After the drying stage, low heating rates were defined to avoid transport effects, ensure that the reaction was only temperature dependent, and, consequently, the experiments were performed in a pure kinetic regime. Table 2 summarizes the operating conditions defined to perform the thermogravimetric experiments.
Regarding the macro-TGA, isothermal experiments were developed and, before the experimental campaign, calibration and verification procedures were carried out. First, separate blank tests were performed to evaluate the internal heat transfer and to obtain the background of the weight signal before the experiments. Three thermocouples (K type) were introduced in the reactor to record the internal temperature at different positions and to assess temperature gradients in the center of the reactor. This was important to understand which temperature should be defined in the temperature controller in order to obtain the corresponding desired value for each experiment. The runs to evaluate the weight signal were also important since there were disturbances detected due to the interference of the steel wire that connected the basket and scale. After some modifications in the lid and on both connections of the wire, basket, and scale, the gradient of the weight was minimal. Hence, the weight of the basket was appropriately tared, the basket became stable, and deviations below 8 mg were found during long experiments. Consequently, with this set of blank experiments, it was proved that the small-scale reactor had acceptable stability and reproducibility. Additionally, a set of experiments were concerned with the samples. The initial conditions are important and should be maintained in each experiment. Neglecting possible variations in the chemical composition of the same batch of particles, the moisture content and the dimension of the particles were considered parameters of particular interest, and their influence should be controlled or quantified. Experiments with random particles and particles from the 16 to 50 mm batch after the sieving process were burnt, and the mass-loss variation presented slight differences. Since the woodchips present an irregular structure, particles with fixed dimensions were produced to investigate the dimension that influences the mass-loss behavior. From the experiments performed, it was possible to observe that thickness is the key dimension. Although the woodchips present different lengths and/or widths, the thickness is approximately the same, and this is the reason for the similar profiles of mass loss. Regarding the moisture content, the strategy was to control and obtain similar values for all particles after the experiments. As the moisture content of the particles used in power plants is generally higher, the maximum value that can be replicated in the laboratory, 20% of moisture, was defined as the setpoint. In this way, the influence of moisture on the mass-loss behavior was avoided. Experiments considering the influence of the air flow rate were also considered, but, due to the limitations of the apparatus to collect the flue gases, the air flow rate needs to be as low as possible to ensure that only volatiles are captured.
Hence, the air flow rate was set at 0.1 L/min, the initial weight at 20 g, the maximum possible weight to produce the higher flue gas amount, and the reactor temperature varied between 400 and 800 °C (the temperature range present in a typical biomass grate-fired boiler). All experiments were run in triplicate, under identical conditions, and the average values were computed and reported as well as the standard deviation. During the experiments with the eucalyptus particles, the gases, which included end-product gases such as H2, CH4, CO, and CO2, released during the devolatilization period were collected in a sample bag. In order to be able to collect the sample during the entire devolatilization period, the flow rate of the sampling pump was adjusted to fill the bag within the time frame of the experiment. Then, the composition of the samples was analyzed in a micro-GC where three samples were removed from the bag and inserted into the equipment to detect the concentration of the different compounds.

3. Results and Discussion

3.1. Combustion Characteristics: Macro-TGA

3.1.1. Influence of the Temperature

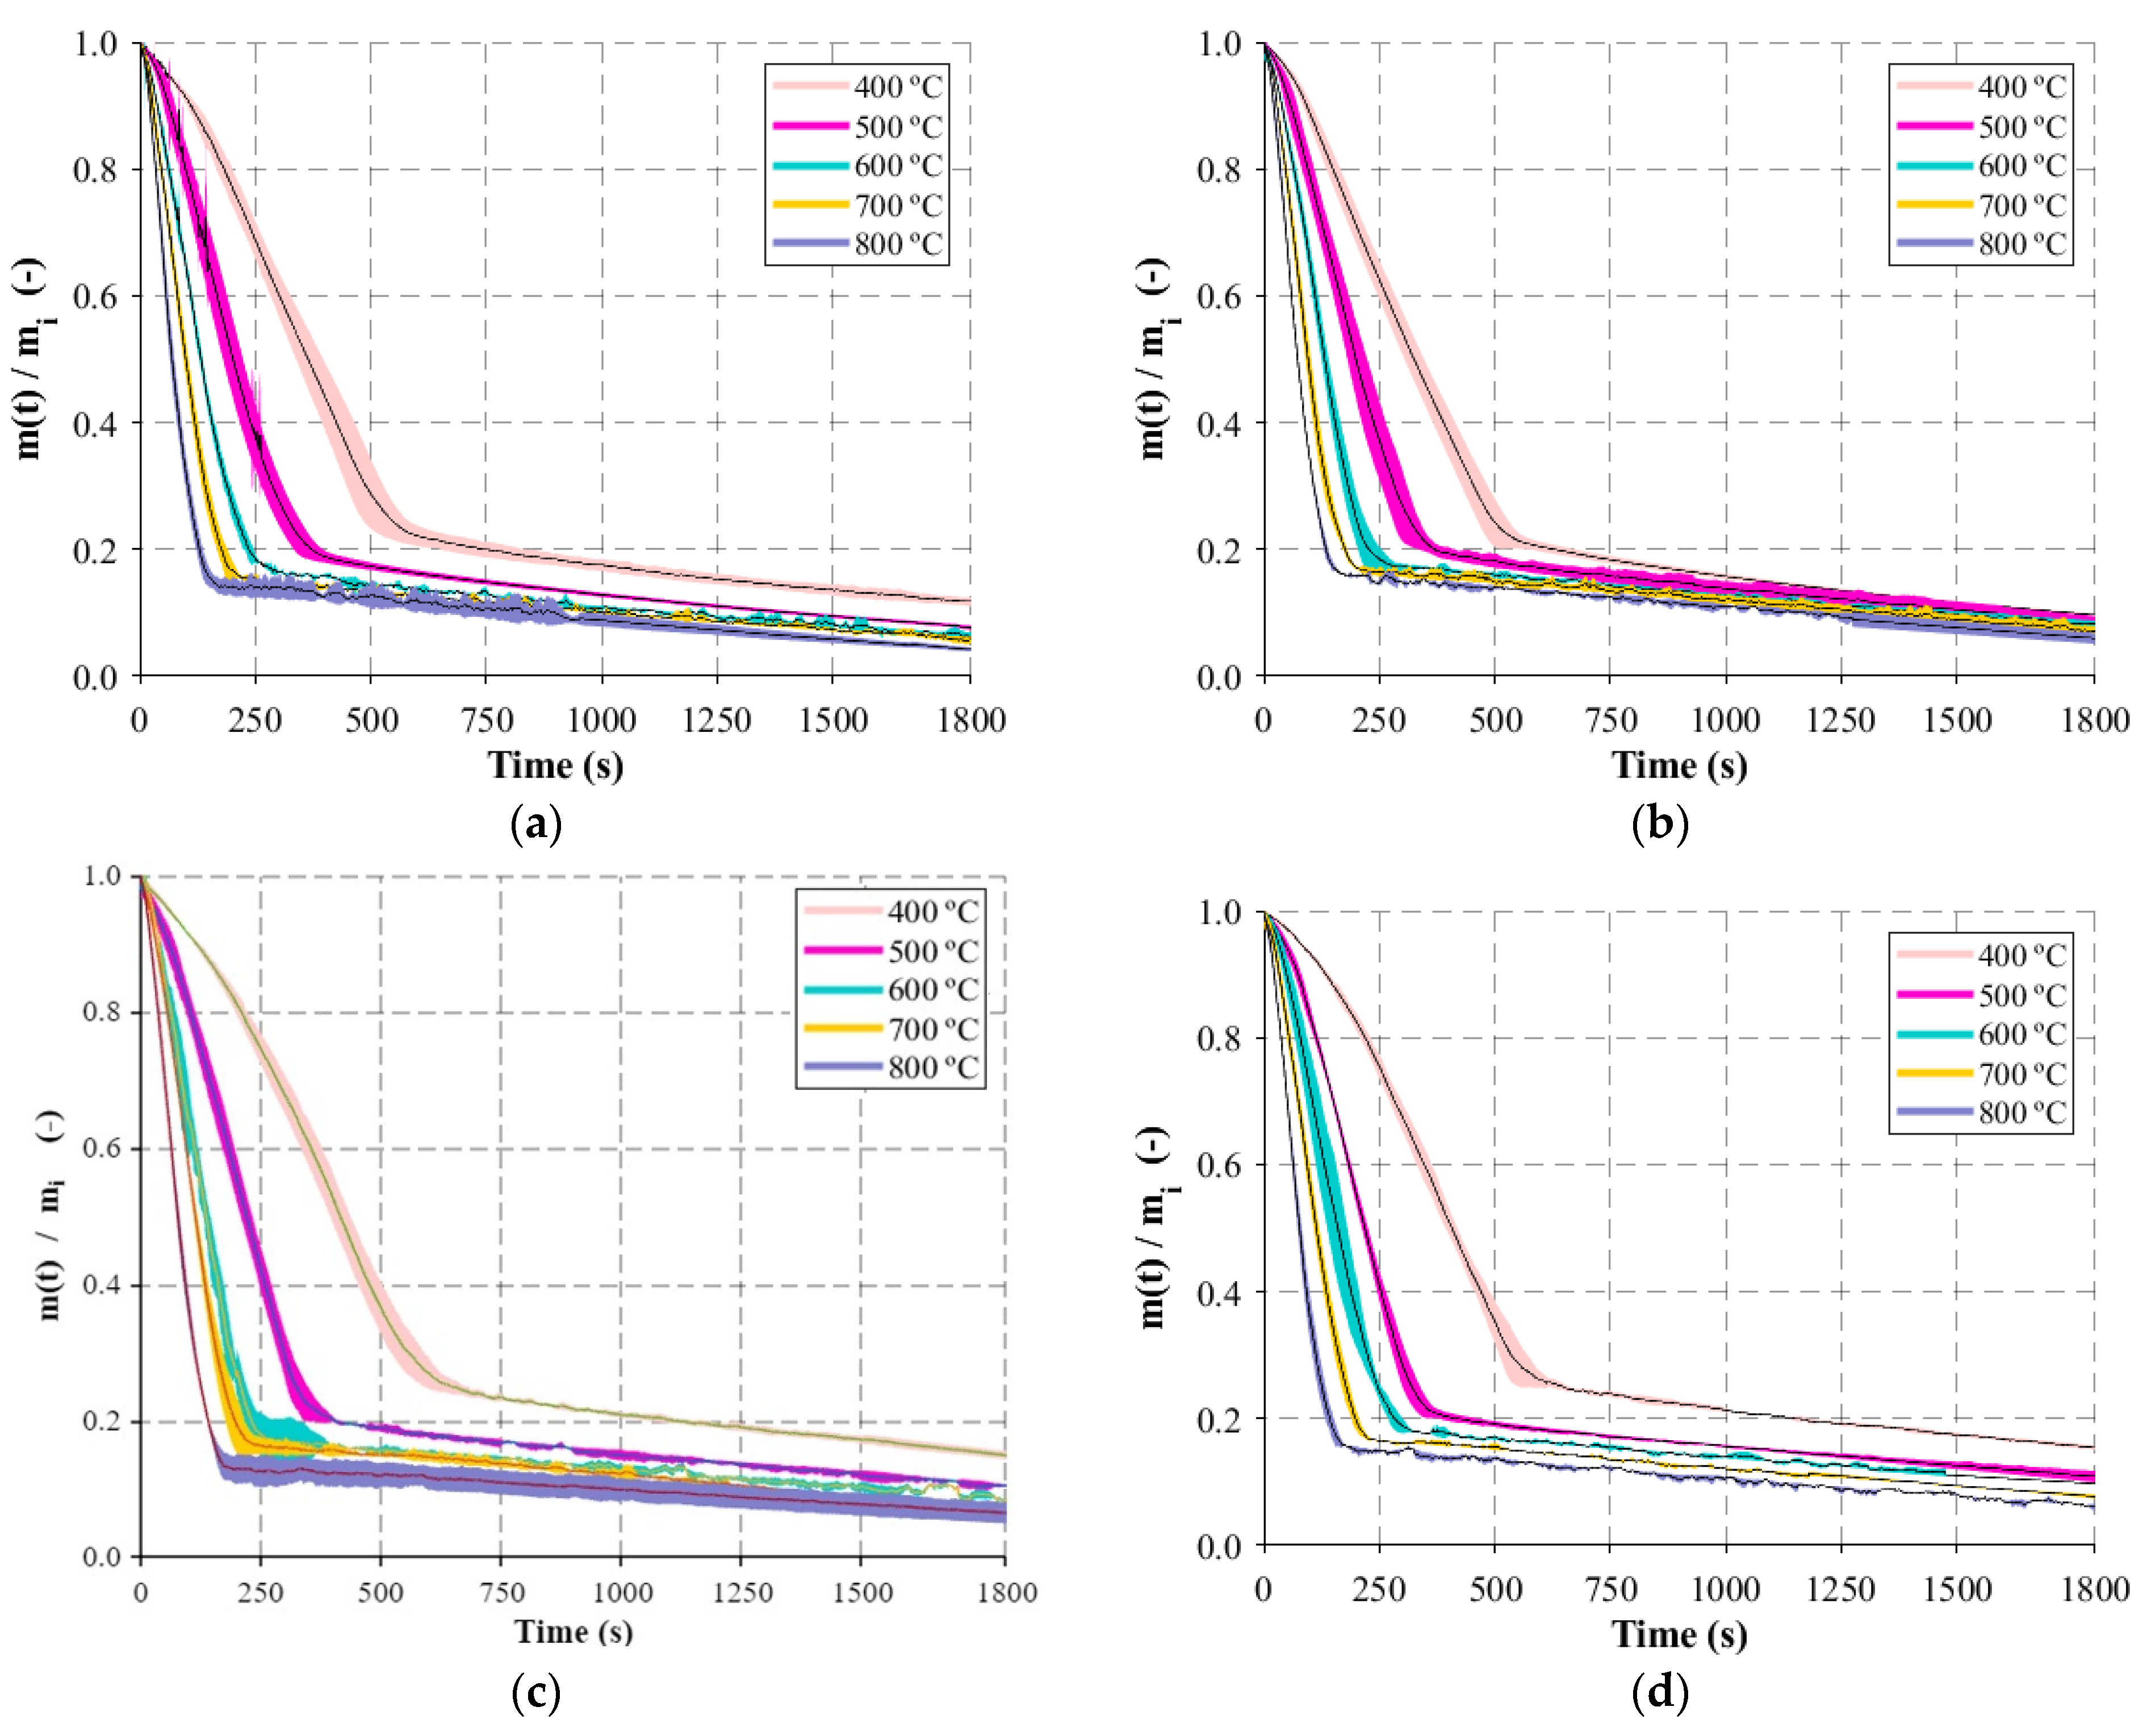
As temperature is one of the most important parameters in the thermal conversion of solid biomass fuels, a wide range of temperatures covering low-to-high temperatures was defined for the experiments. Figure 2 presents the normalized sample mass variations for the different reactor temperatures and fuels, where their average value is plotted over time along with the standard deviation as a shaded area. The experiments were run for a long period, 30 min, to ensure the full conversion of biomass.
The mass-loss behavior can be separated into two different stages, each one showing a linear variation. The first stage of the mass-loss profiles presents a uniform slope until a certain point followed by a second stage at a lower slope. The first stage is attributed to the overlapping of drying and devolatilization reactions as they are thermal processes that occur at low temperatures and high rates, while the last stage, which is extended over a long time, is identified with char oxidation. Hence, the combustion behavior is significantly different from the conversion profiles obtained from TGA, and the direct comparison between both profiles clearly shows that in the combustion process of larger particles, it is not possible to identify separate consecutive conversion stages. Section 3.2 details this comparison.
The first stage is highly influenced by the reactor temperature, and it may vary from 650 to 150 s, from low-to-high temperatures. However, the last stage was not influenced by the temperature, suggesting the presence of another predominant phenomenon and conversion mechanism in most of the biomass conversion time. In the literature, for the char combustion phenomenon, it is generally agreed that the conversion reaction is limited by kinetics and diffusion, the latter being normally the limiting factor of the reaction rate [18,19]. Therefore, the results suggest that this conversion step is dependent on the diffusion of oxygen and not dependent on the environment temperature. Hence, the mass-loss profile of larger particles combines the kinetic phenomenon and transport processes. Thus, during the combustion of larger particles, part of the sample may be in the devolatilization or char stage, as well as others, and can be unreacted.
Furthermore, another important aspect to mention, in line with the independence of the char conversion with temperature, is that as the reactor temperature increases, the mass-loss profiles are closest. Although the values of the normalized mass are lower for higher temperatures, there was a previous influence of the temperature in the first stage, which caused higher mass-loss values to be obtained. However, it is important to note that at low temperatures, in particular for 400 and 500 °C, considering the region where there is the transition of the slope of the mass-loss profile, approximately 74 to 80% of the initial weight was converted. These values are close to the sum of the moisture content (20%) and the volatile matter of different fuels (65 to 70%), which suggests that a small amount of volatile matter was not released in the first stage.

3.1.2. Influence of the Type of Fuel

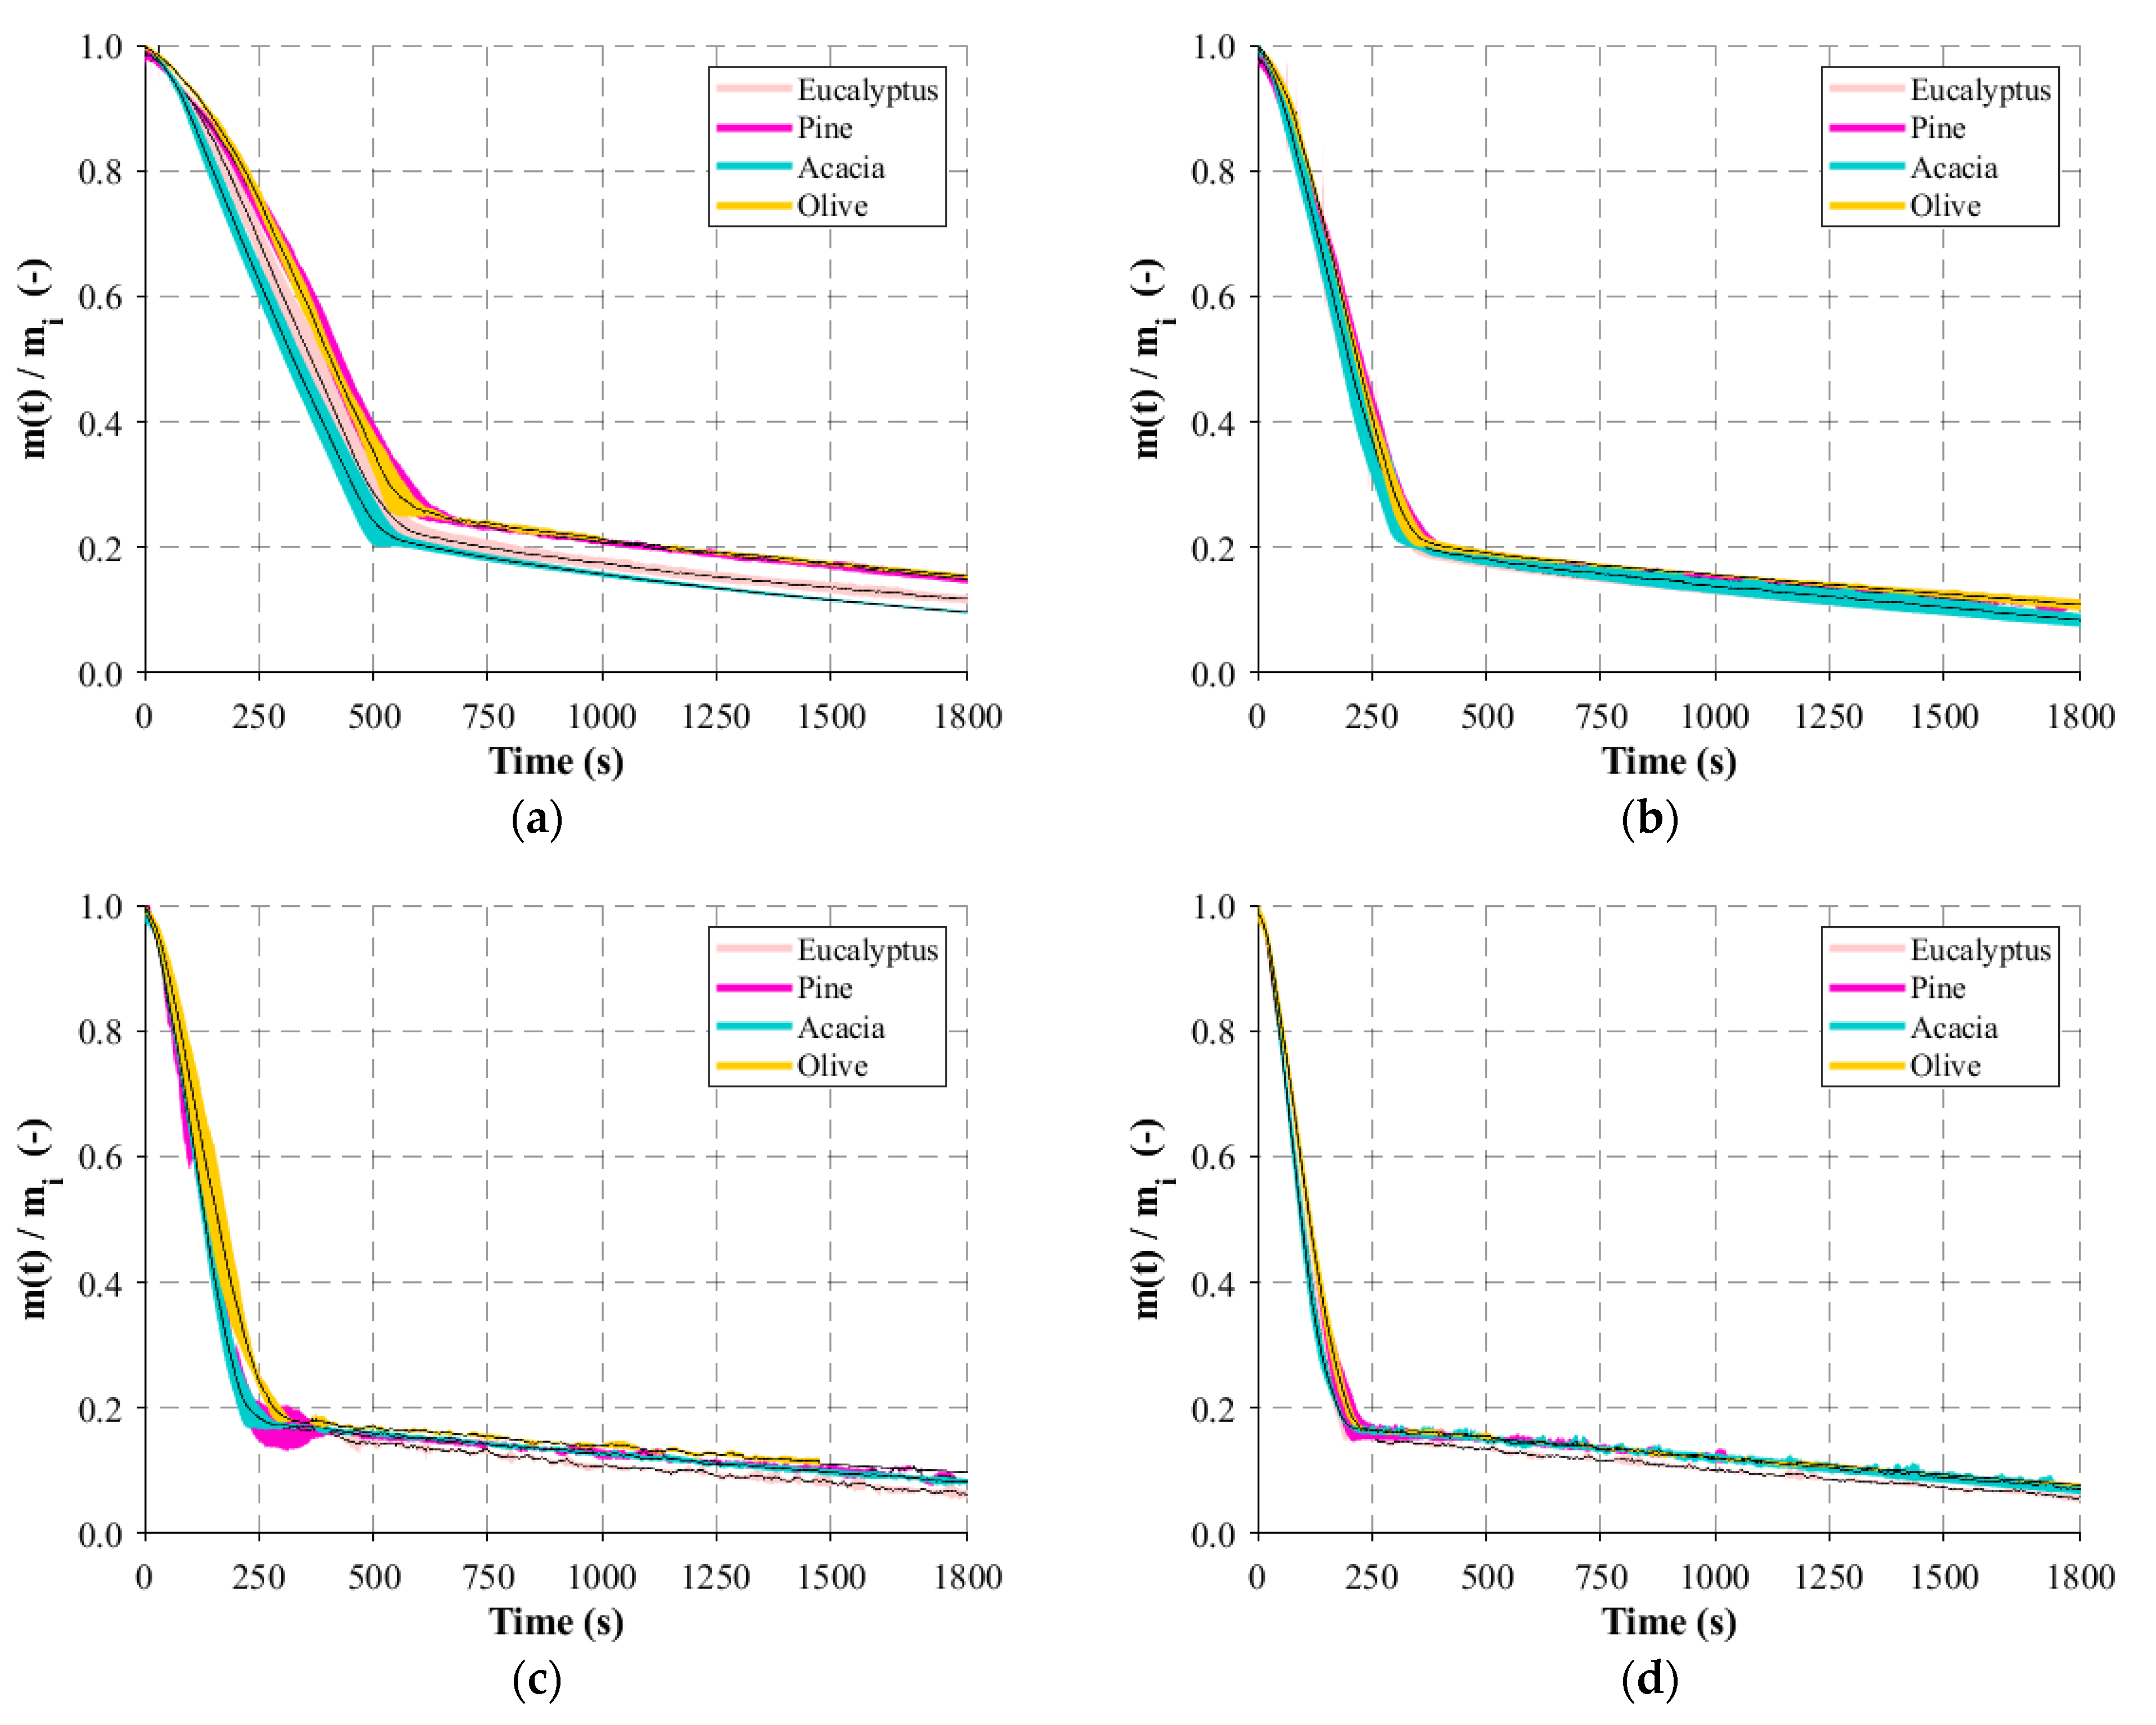
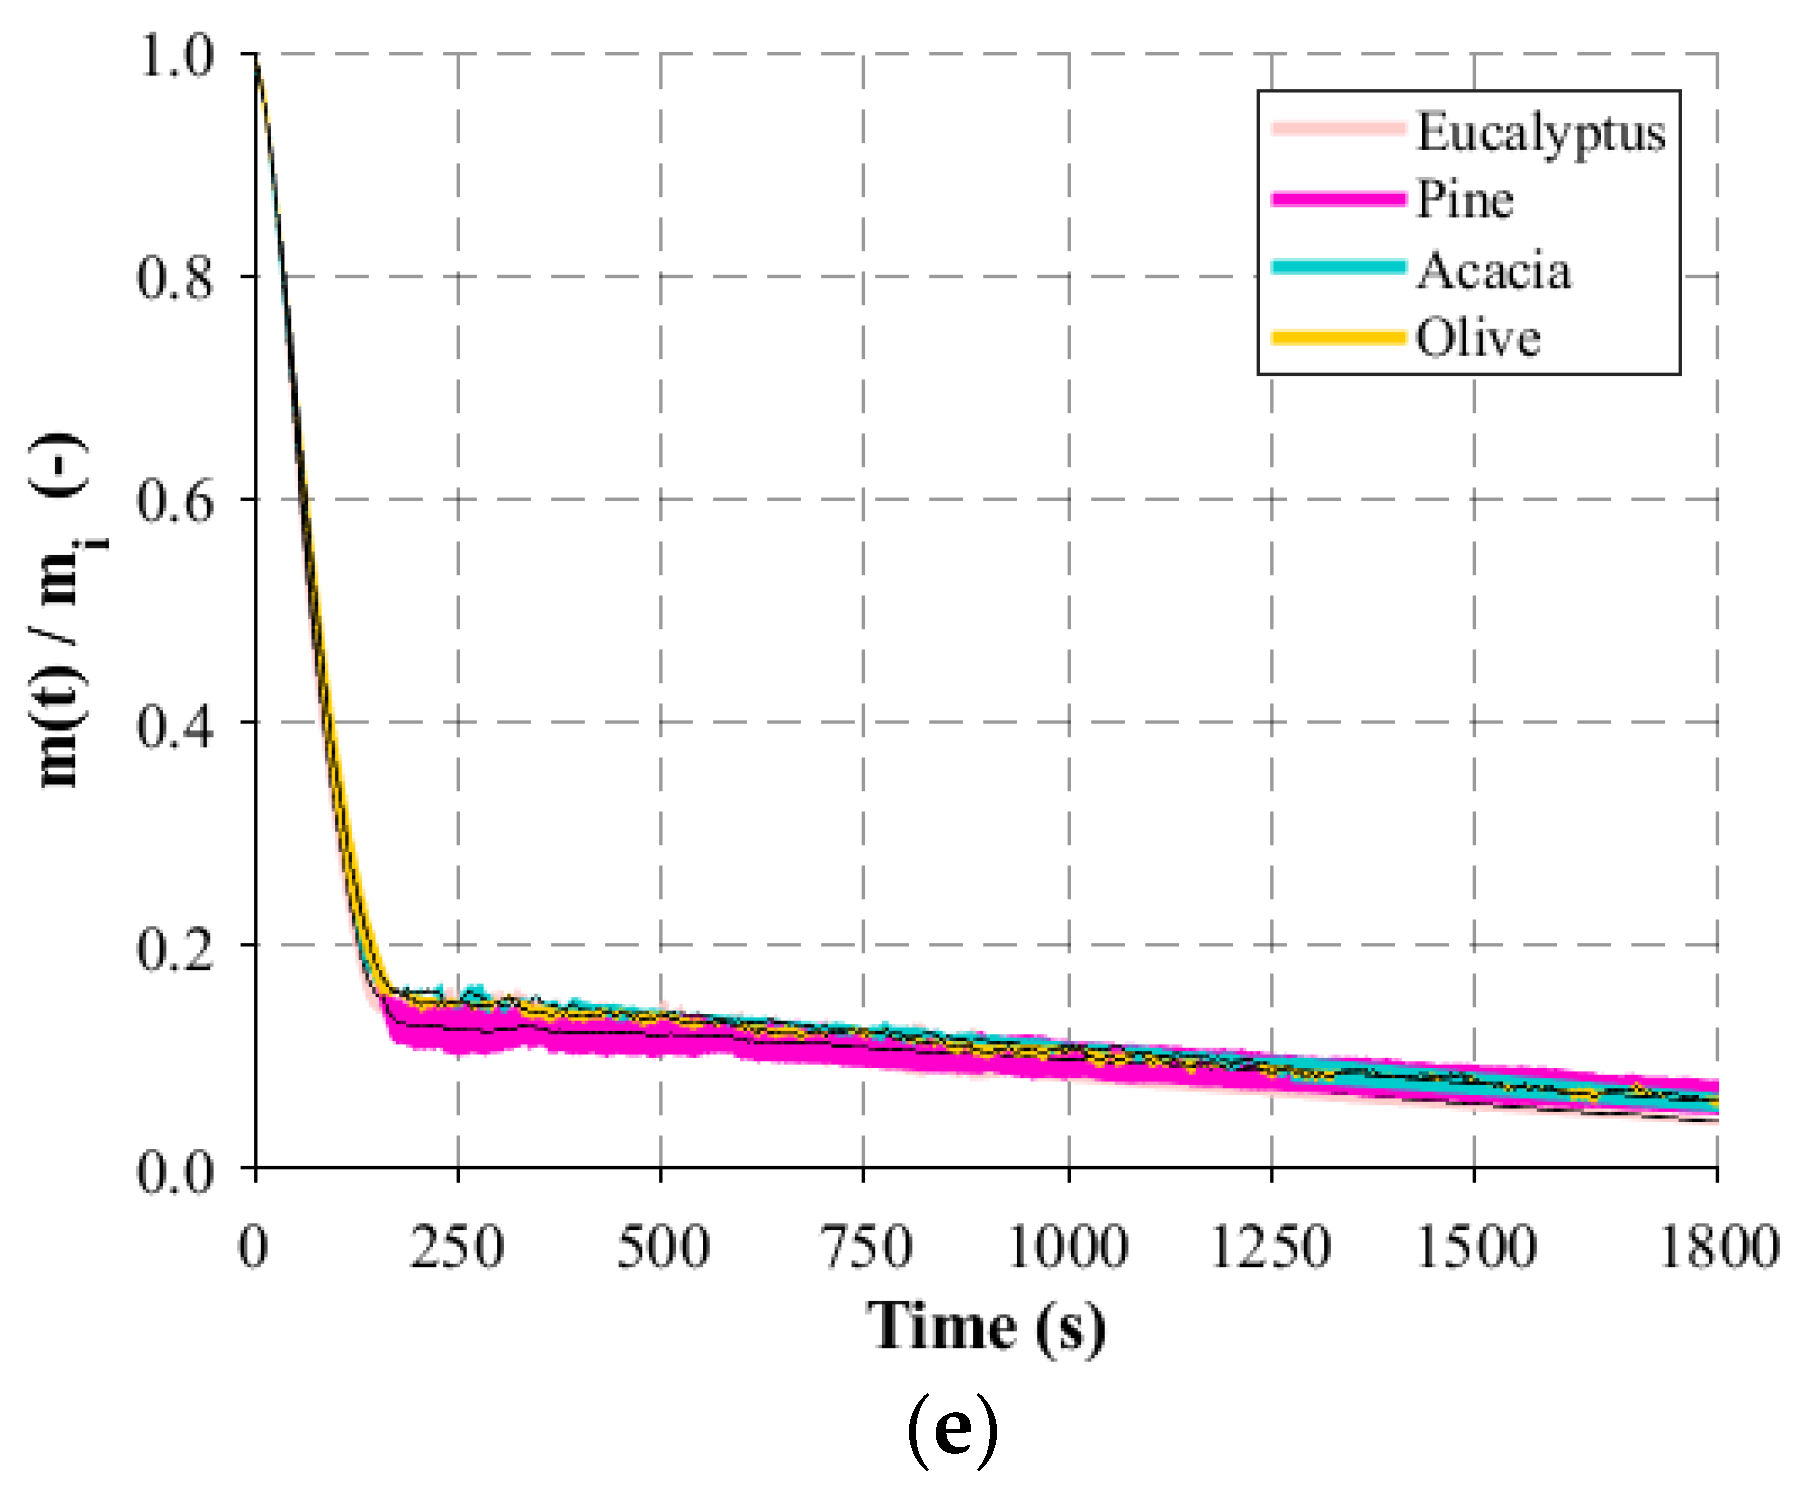
As the different solid biomass fuels present different physical, chemical, and thermal properties, the combustion behavior can present differences according to the fuel burnt. Figure 3 presents a comparison of the normalized mass loss between the different fuels at the same temperature.
The combustion behavior of the various fuels presents small differences. In particular, the differences are detected at lower reactor temperatures, while at higher temperatures the profiles are almost coincident within the experimental uncertainty. Although some authors, for instance, Becidan et al. [8], argue that factors such as physical, thermal, and chemical properties are known to be relevant in the decomposition of solid biomass fuels, the present data suggest that their influence is only relevant at low temperatures, while at high temperatures the combustion behavior is mostly dependent on the reaction kinetics.
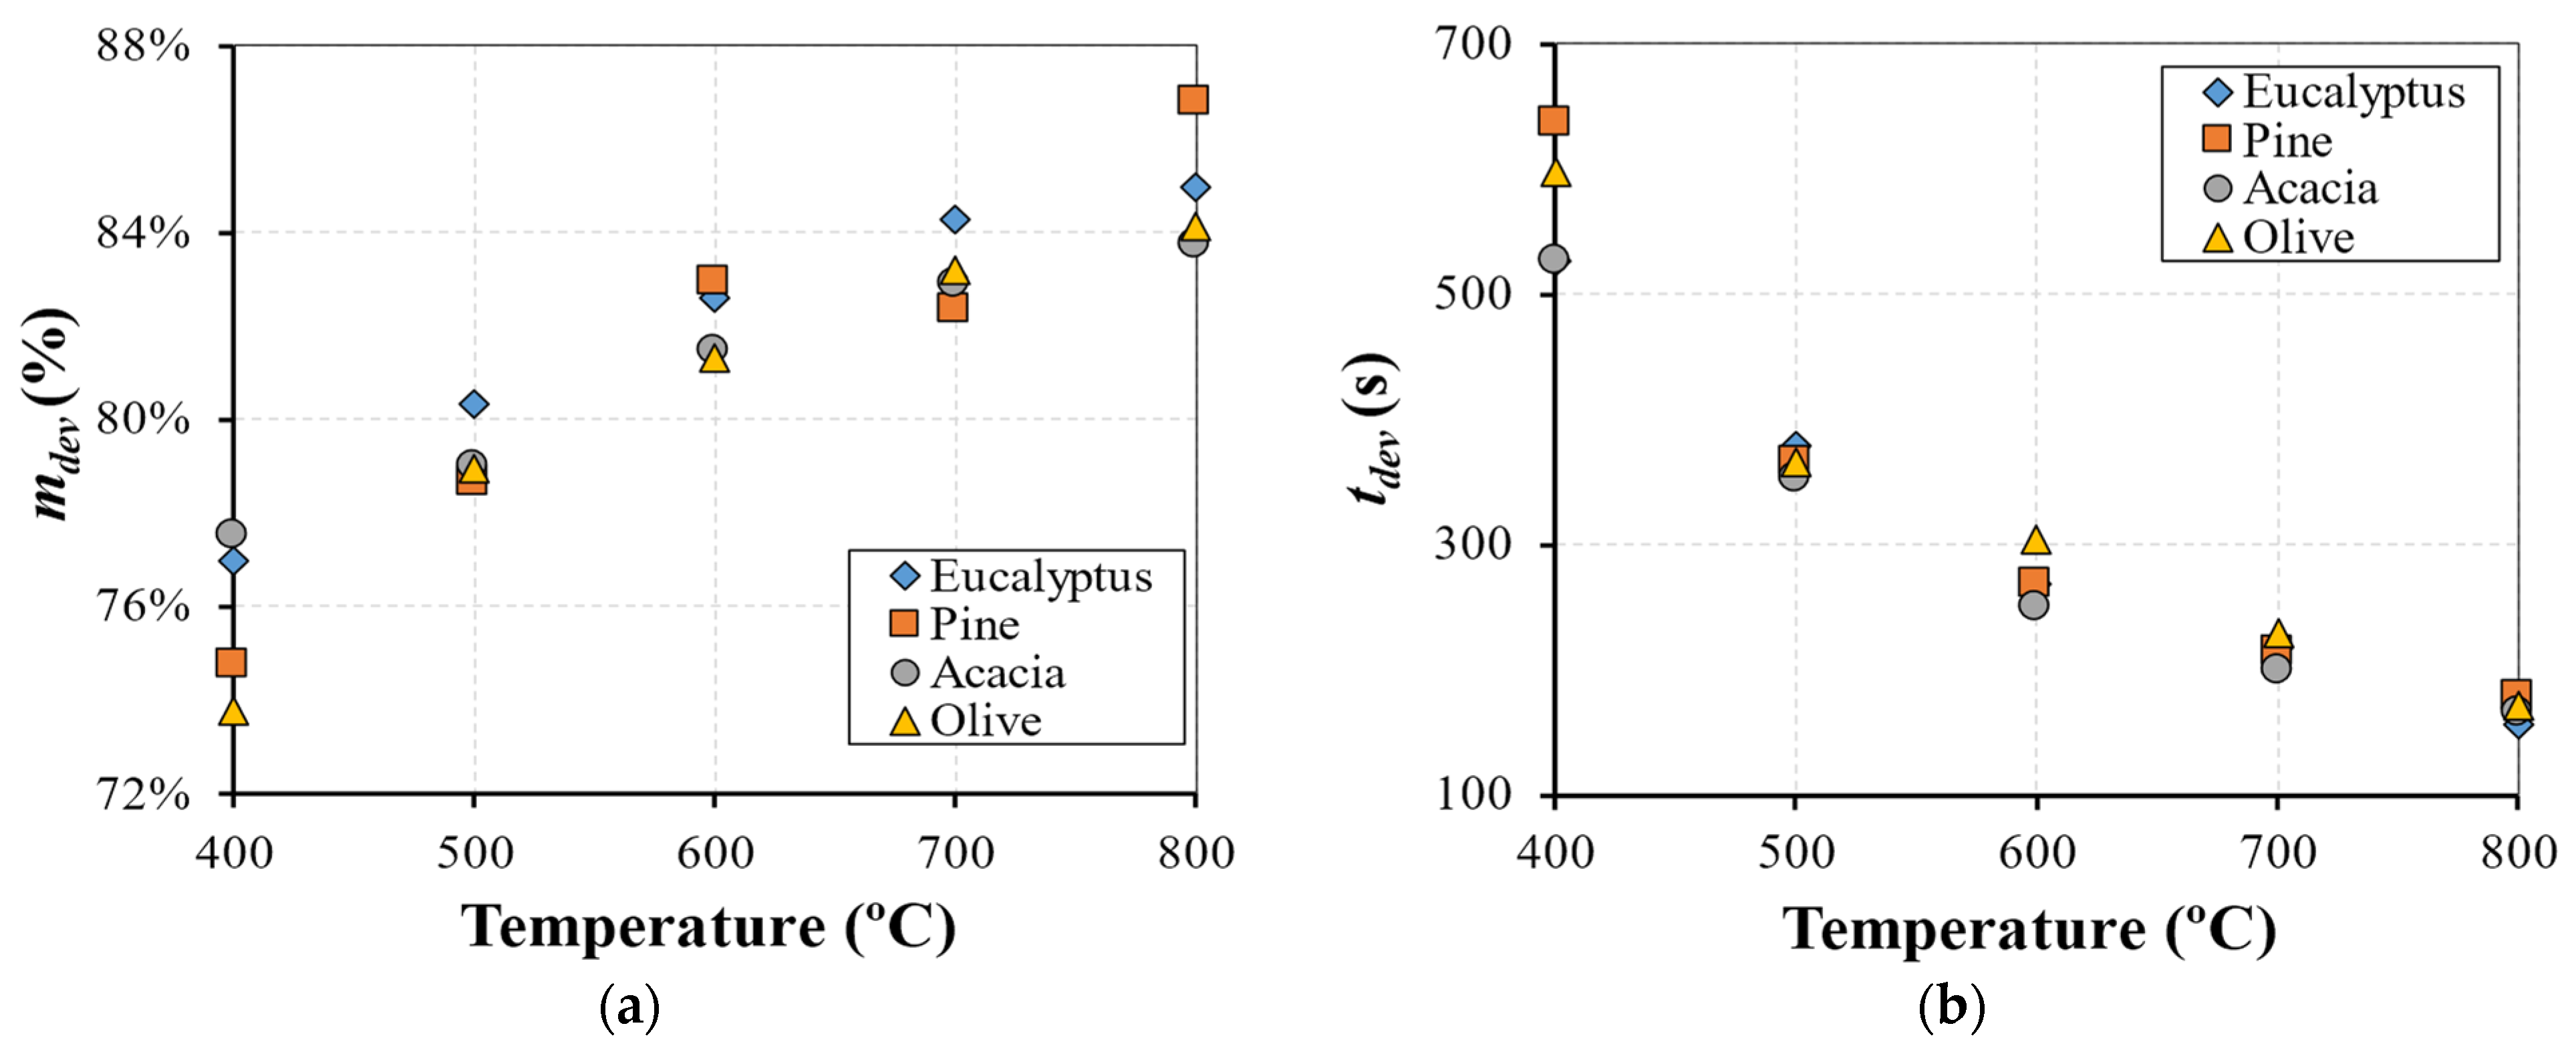
To further analyze the mass-loss data, Figure 4 shows the difference between the different fuels in terms of the mass loss during the first stage and the time necessary to complete the reaction. As can be observed, the mass loss during devolatilization increases with temperature for all fuels. The differences between the different fuels become smaller with increasing temperature. However, eucalyptus, which has a higher volatile content, presents almost all reactor temperatures with the highest mass loss. This observation is in line with the findings described in [20], where the reactivity of the fuels was correlated with the volatile content. Hence, based on the data presented in Figure 4a, the reactivity of the fuels studied can be ordered by the descending order of reactivity as follows: eucalyptus, acacia, pine, and olive. Pine and acacia present similar values, although, at 800 °C, pine was the fuel with the highest mass loss. Another important aspect to note is that pine is the fuel that has a stronger temperature influence on the conversion rate.
Hence, for pine, the ratio between the final mass at lower and higher temperatures was 8, while for eucalyptus and olive, it was 2.8, and for acacia, it was only 1.6. Therefore, considering that, at 800 °C, the residual mass of pine was close to the ash content (2%), it is possible to state that pine samples present the best combustion performance at higher temperatures. Furthermore, from Figure 4b, it is possible to observe that the time to complete the first reaction was very similar for all fuels.
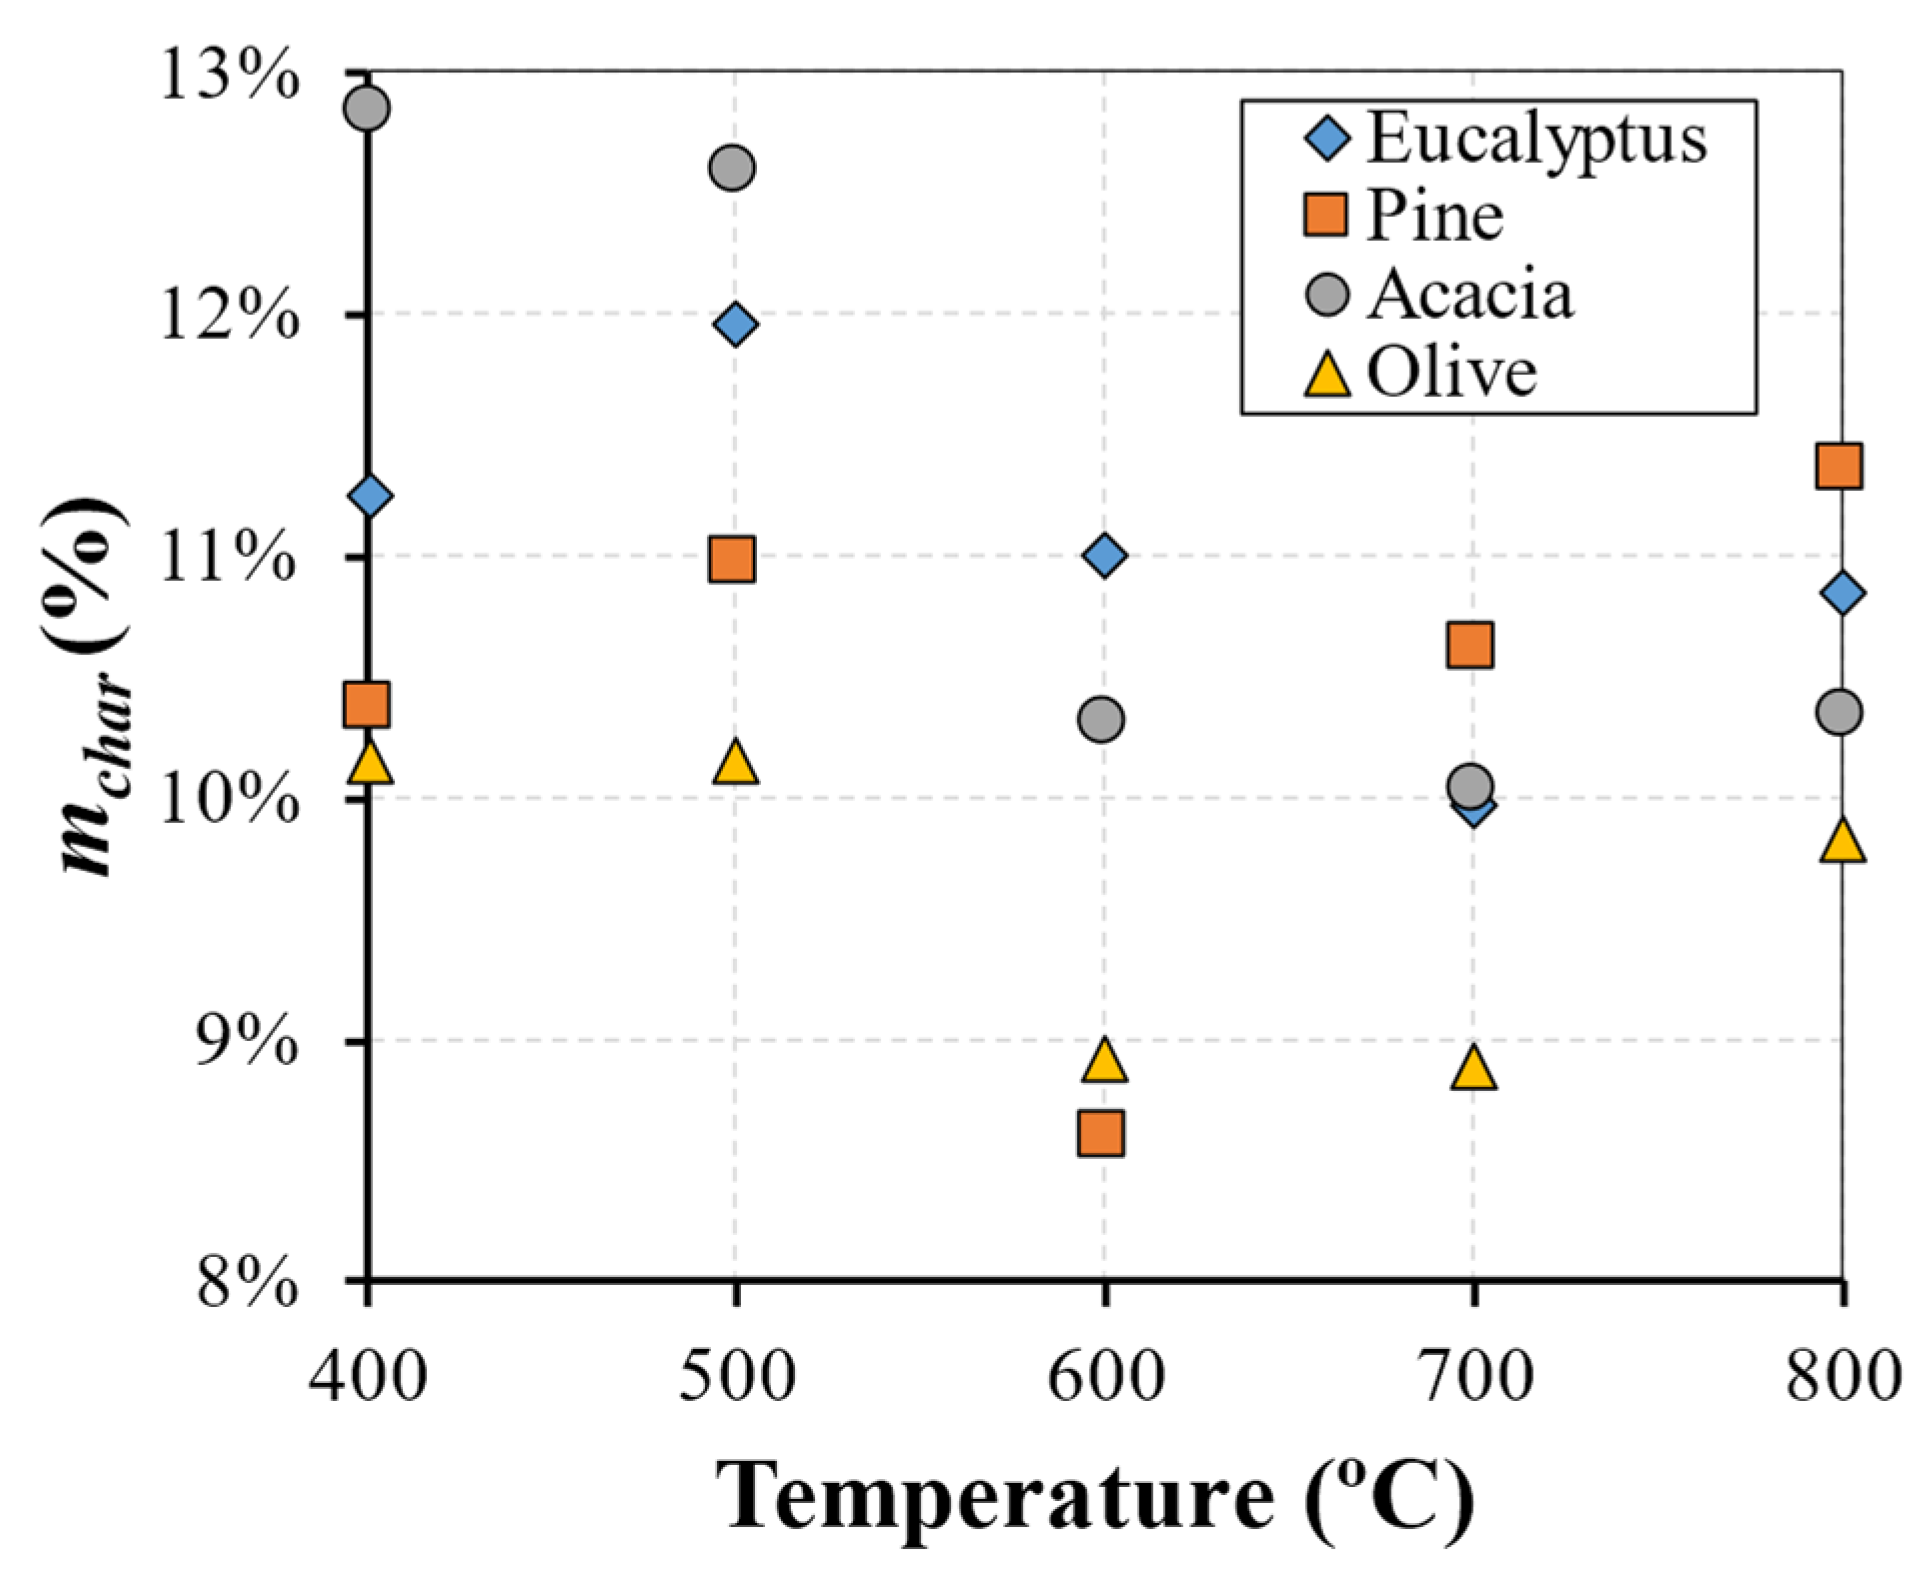
Regarding the second conversion stage, Figure 5 presents the percentage of mass loss as a function of temperature. As it can be seen, there is no evident influence of temperature in this reaction. In addition, the differences between the different fuels are within 3%. These results help to support the hypothesis that char conversion is governed by diffusion.

3.1.3. Gaseous Emissions

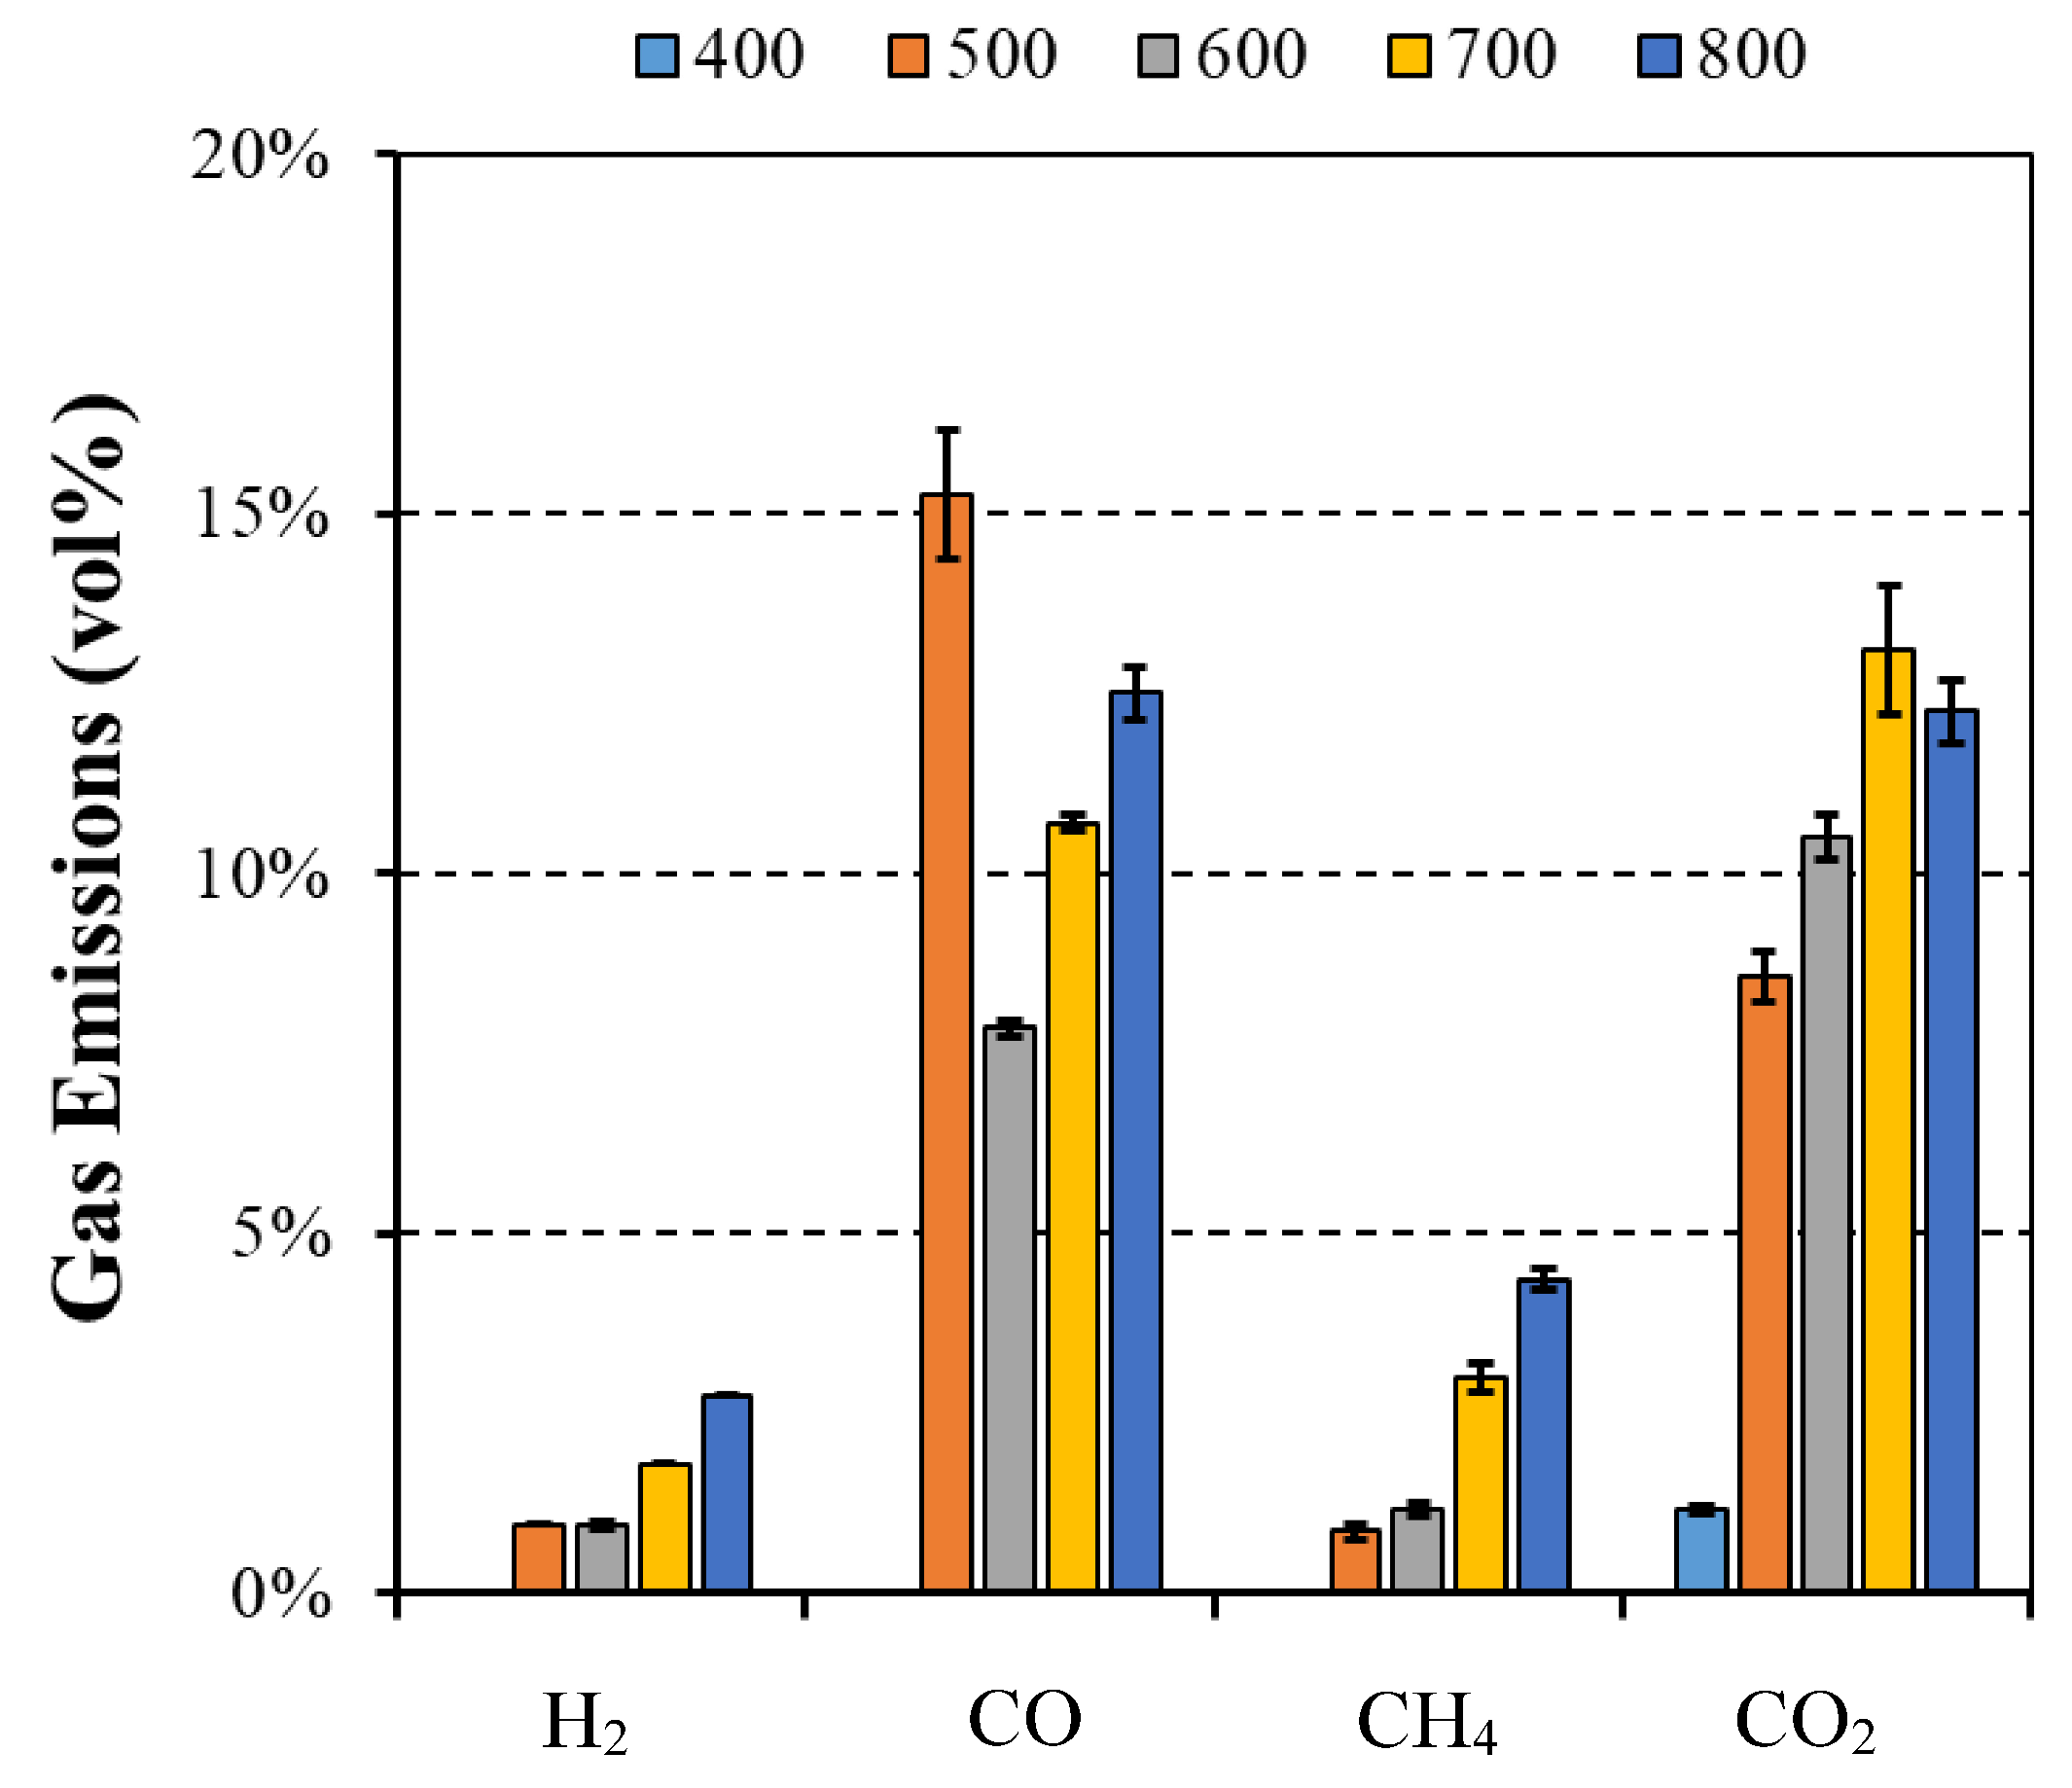
Figure 6 presents the results from these experiments, and it shows, in particular, that gaseous emissions are strongly dependent on the temperature. The remaining volumetric fraction corresponds to the nitrogen and oxygen content. Consequently, the results reflect that the main gas compounds are produced through thermally favored reactions such as oxidation. CO2 and CO are always the main pyrolysis products, where CO contribution represents a maximum of 13%, and CO2 represents 12% of the total concentration at 800 °C. The temperature dependence of both compounds shows the same upward trend, although the CO yield increases from 8 to 13% between 600 and 800 °C, while the CO2 yield only slightly increases from 11 to 12%. As mentioned by Becidan et al. [21], the trend of CO2 production tends to stabilize at high temperatures due to its formation through the cellulose and hemicellulose conversion. These are reactions that occur mainly at low temperatures, and they are not favored by the increase in temperature. In turn, CH4 and H2 are the minor compounds of the flue gas composition. CH4 ranges from 1% at 500 °C to around 4% at 800 °C.
The H2 yield, a product mainly attributed to cracking reactions, slightly increases with a temperature from less than 1% at 500 °C to approximately 2.75% at 800 °C. The O2 content is not necessarily formed through biomass conversion, and it possibly results from the air introduced in the reactor or due to the desorption of air adsorbed in the particles, as also mentioned by Figueiredo et al. [22]. Thus, to avoid any disturbance in the sample collection, the air flow was kept at low levels.
Considering the previous results, a general reaction describing the mass fraction of the main compounds released during the devolatilization at the highest temperature, to simulate the hot environment inside an industrial boiler, was established as represented in Equation (1):
Biomass       0 . 07 CH 4 + 0 . 56 CO 2 + 0.36 CO + 0 . 01 H 2
Although similar observations have been made elsewhere [6,21,23,24], these results are scarce in the literature, and they represent extremely useful data for computational fluid dynamics simulations or mathematical purposes to fully describe the biomass conversion. Neves et al. [23] found that, at temperatures above 500 °C, the permanent gas compounds strongly become temperature-dependent, leading to a substantial increase in the CO mass fractions. This was considered a product of secondary reactions, which resulted in the decrease in the tar mass fraction, and also was due to the conversion to CH4. The same behavior was described by Mehrabian et al. [24] based on dedicated experiments and data collected from the literature. Secondary reactions of the volatiles are negligible at low temperatures, and most of the permanent gases result directly from biomass thermal degradation. Within the low temperature range, gases like CO and CO2 are the main permanent gas compounds, with low quantities of CH4. As the temperature increases, secondary reactions occur, and an increase in CO and CH4 is associated with the decrease in tar. Here, due to the higher temperatures, the yields of the volatiles have a strong correlation with the temperature, and CO is considered responsible for the conversion of two-thirds of the tar. Although the tar was not measured during the experiments, this is in line with the trend presented in the results presented in Figure 6. Becidan et al. [21] investigated the main gas components from the pyrolysis of thermally thick biomass residue samples at 600 to 900 °C using an FTIR analyzer and a micro-GC. The authors also mentioned a clear dependence of the gas composition on temperature and observed a clear tendency of the hydrocarbon yields to stabilize. Gauthier et al. [6], in the study of pyrolysis of beech-wood particles for temperatures ranging between 450 and 1050 °C, also found a similar trend. The authors also reported that, at low temperatures, the emissions are mainly composed of CO2, whereas pyrolysis above 800 °C was found to produce mainly CO.
In addition to the main compounds analyzed in this section, it is important to note the possible presence of other compounds like NOx and SO2 [25,26].

3.2. Comparison of the Different Conversion Scales

Figure 7 illustrates the comparison between macro-TGA and TGA experiments, illustrating the conversion rate of different fuels at different reactor temperatures for macro-TGA experiments and heating rates for TGA experiments. The analysis reveals distinct mass-loss profiles when considering different scales.
These findings underscore the high sensitivity of TGA, enabling the detection of subtle changes in mass and reaction kinetics. The experiments offer valuable insights into the initial stages of biomass decomposition, encompassing moisture release (drying), devolatilization, the onset temperature of thermal degradation, and char oxidation. Such data aid in understanding the intricate thermal behavior of biomass at the particle level.
In Figure 7, it is evident that all fuels, regardless of the heating rate, exhibit three distinct phases marking different reactions. At a heating rate of 20 °C/min, devolatilization manifests through two reactions with varying slopes, indicative of different biomass component reactions. However, at a higher heating rate of 100 °C/min, these reactions appear simultaneous, suggesting altered reaction kinetics. While the macro-TGA results align with these observations, the TGA experiments, even at lower reactor temperatures, lack clear differentiation between drying and devolatilization. Moreover, the scale disparity between the two experiments significantly influences the kinetics of thermal decomposition reactions, resulting in divergent results.

4. Conclusions

This paper presents an assessment of the thermal behavior of different solid biomass fuels under an oxidizing atmosphere and in sub-stoichiometric conditions.
The main results and key findings have led to the conclusion that isothermal experiments showed two distinct stages that can be identified for mass loss, each one with a linear trend. This pattern of the combustion behavior is significantly different from the TGA results and revealed that, in the combustion of large particles, the presence of consecutive conversion stages cannot be clearly identified. The first stage, which includes drying and devolatilization, presented a dependency on the reactor temperature, while the last stage was not influenced by the temperature. This fact highlighted the influence of the diffusion mechanism, thereby combining the kinetic phenomenon and transport processes in the combustion of large biomass particles. The influence of fuel type on the combustion behavior was only detected at lower temperatures, while at higher temperatures, the profiles are almost coincident. This fact shows that physical, thermal, and chemical properties are only relevant at lower reactor temperatures, while at higher temperatures, the combustion behavior is only dependent on the reaction kinetics. Considering the previous findings, the gas compounds released during the combustion of eucalyptus presented a strong correlation to the reactor temperature, with CO2 and CO always being the main devolatilization products.
Despite being conducted at a laboratory scale, the experiments offered valuable insights into the transport phenomena occurring at both the particle and particle levels under various operating conditions and with different fuels. Furthermore, these experiments enabled the quantification of gas emissions, making them a crucial undertaking that yielded the reliable and significant data necessary for the development of a numerical model for biomass combustion systems. Thus, a crucial future research development would be the integration of the experimental data into a particle conversion model for coupled CFD simulations, which would allow more details to be obtained about the bed conversion in the biomass boiler and improve the gas-phase combustion inside the furnace.

Author Contributions

Conceptualization, J.S., S.T. and J.T.; Methodology, J.S., S.T. and J.T.; Investigation, J.S. and L.F.; Writing—Original Draft Preparation, J.S., J.T. and S.T.; Writing—Review and Editing, J.S., J.T. and S.T.; Supervision, J.T. and S.T. All authors have read and agreed to the published version of the manuscript.

Funding

This work was supported by the Portuguese Foundation for Science and Technology (FCT) within the R&D Units Project Scope UIDB/00319/2020 (ALGORITMI) and R&D Units Project Scope UIDP/04077/2020 (MEtRICs).

Data Availability Statement

Data is contained within the article.

Acknowledgments

The first author would like to express his gratitude for the support given by FCT through the PhD Grant SFRH/BD/130588/2017.

Conflicts of Interest

The authors declare no conflicts of interest.

References

  1. Silva, J.P.; Teixeira, S.; Grilo, É.; Peters, B.; Teixeira, J.C. Analysis and monitoring of the combustion performance in a biomass power plant. Clean. Eng. Technol. 2021, 5, 100334. [Google Scholar] [CrossRef]
  2. Silva, J.; Teixeira, S.; Teixeira, J. A Review of Biomass Thermal Analysis, Kinetics and Product Distribution for Combustion Modeling: From the Micro to Macro Perspective. Energies 2023, 16, 6705. [Google Scholar] [CrossRef]
  3. Gil, M.V.; Casal, D.; Pevida, C.; Pis, J.J.; Rubiera, F. Thermal behaviour and kinetics of coal/biomass blends during co-combustion. Bioresour. Technol. 2010, 101, 5601–5608. [Google Scholar] [CrossRef]
  4. Fraga, L.G.; Silva, J.; Teixeira, S.; Soares, D.; Ferreira, M.; Teixeira, J. Thermal Conversion of Pine Wood and Kinetic Analysis under Oxidative and Non-Oxidative Environments at Low Heating Rate. Proceedings 2020, 58, 23. [Google Scholar] [CrossRef]
  5. Samuelsson, L.N.; Umeki, K.; Babler, M.U. Mass loss rates for wood chips at isothermal pyrolysis conditions: A comparison with low heating rate powder data. Fuel Process. Technol. 2017, 158, 26–34. [Google Scholar] [CrossRef]
  6. Gauthier, G.; Melkior, T.; Grateau, M.; Thiery, S.; Salvador, S. Pyrolysis of centimetre-scale wood particles: New experimental developments and results. J. Anal. Appl. Pyrolysis 2013, 104, 521–530. [Google Scholar] [CrossRef]
  7. Bruch, C.; Peters, B.; Nussbaumer, T. Modeling Wood Combustion Under Fixed Bed Conditions. Fuel 2003, 82, 729–738. [Google Scholar] [CrossRef]
  8. Becidan, M.; Skreiberg, Ø.; Hustad, J.E. Experimental study on pyrolysis of thermally thick biomass residues samples: Intra-sample temperature distribution and effect of sample weight (“scaling effect”). Fuel 2007, 86, 2754–2760. [Google Scholar] [CrossRef]
  9. Hu, Q.; He, X.; Yao, Z.; Dai, Y.; Wang, C.-H. Gaseous production kinetics and solid structure analysis during isothermal conversion of biomass pellet under different atmospheres. J. Energy Inst. 2021, 98, 53–62. [Google Scholar] [CrossRef]
  10. Baumgarten, B.; Reinhardt, J.; Lepski, C.; Risio, B.; Thorwarth, H. Kinetics of Wood Devolatilization during Start-up. Energy Fuels 2019, 33, 11285–11291. [Google Scholar] [CrossRef]
  11. Nikku, M.; Deb, A.; Sermyagina, E.; Puro, L. Reactivity characterization of municipal solid waste and biomass. Fuel 2019, 254, 115690. [Google Scholar] [CrossRef]
  12. Weissinger, A. In situ FT-IR spectroscopic investigations of species from biomass fuels in a laboratory-scale combustor: The release of nitrogenous species. Combust. Flame 2004, 137, 403–417. [Google Scholar] [CrossRef]
  13. Orang, N.; Tran, H. Effect of feedstock moisture content on biomass boiler operation. TAPPI J. 2015, 14, 629–637. [Google Scholar] [CrossRef]
  14. Brunner, T.; Biedermann, F.; Kanzian, W.; Evic, N.; Obernberger, I. Advanced Biomass Fuel Characterization Based on Tests with a Specially Designed Lab-Scale Reactor. Energy Fuels 2013, 27, 5691–5698. [Google Scholar] [CrossRef]
  15. Alegria, C.; Roque, N.; Albuquerque, T.; Fernandez, P.; Ribeiro, M.M. Modelling Maritime Pine (Pinus pinaster Aiton) Spatial Distribution and Productivity in Portugal: Tools for Forest Management. Forests 2021, 12, 368. [Google Scholar] [CrossRef]
  16. Silva, J.; Castro, C.; Teixeira, S.; Teixeira, J. Evaluation of the Gas Emissions during the Thermochemical Conversion of Eucalyptus Woodchips. Processes 2022, 10, 2413. [Google Scholar] [CrossRef]
  17. Mishra, R.K.; Mohanty, K. Pyrolysis kinetics and thermal behavior of waste sawdust biomass using thermogravimetric analysis. Bioresour. Technol. 2018, 251, 63–74. [Google Scholar] [CrossRef] [PubMed]
  18. Hosseini Rahdar, M.; Nasiri, F.; Lee, B. A Review of Numerical Modeling and Experimental Analysis of Combustion in Moving Grate Biomass Combustors. Energy Fuels 2019, 33, 9367–9402. [Google Scholar] [CrossRef]
  19. Khodaei, H.; Al-Abdeli, Y.M.; Guzzomi, F.; Yeoh, G.H. An overview of processes and considerations in the modelling of fixed-bed biomass combustion. Energy 2015, 88, 946–972. [Google Scholar] [CrossRef]
  20. Silva, J.P.; Teixeira, S.; Teixeira, J.C. Characterization of the physicochemical and thermal properties of different forest residues. Biomass Bioenergy 2023, 175, 106870. [Google Scholar] [CrossRef]
  21. Becidan, M.; Skreiberg, Ø.; Hustad, J.E. Products distribution and gas release in pyrolysis of thermally thick biomass residues samples. J. Anal. Appl. Pyrolysis 2007, 78, 207–213. [Google Scholar] [CrossRef]
  22. Figueiredo, J.L.; Valenzuela, C.; Bernalte, A.; Encinar, J.M. Pyrolysis of holm-oak wood: Influence of temperature and particle size. Fuel 1989, 68, 1012–1016. [Google Scholar] [CrossRef]
  23. Neves, D.; Thunman, H.; Matos, A.; Tarelho, L.; Gómez-Barea, A. Characterization and prediction of biomass pyrolysis products. Prog. Energy Combust. Sci. 2011, 37, 611–630. [Google Scholar] [CrossRef]
  24. Mehrabian, R.; Shiehnejadhesar, A.; Scharler, R.; Obernberger, I. Multi-physics modelling of packed bed biomass combustion. Fuel 2014, 122, 164–178. [Google Scholar] [CrossRef]
  25. Kuprianov, V.I.; Kaewklum, R.; Chakritthakul, S. Effects of operating conditions and fuel properties on emission performance and combustion efficiency of a swirling fluidized-bed combustor fired with a biomass fuel. Energy 2011, 36, 2038–2048. [Google Scholar] [CrossRef]
  26. Qian, X.; Lee, S.; Chandrasekaran, R.; Yang, Y.; Caballes, M.; Alamu, O.; Chen, G. Electricity Evaluation and Emission Characteristics of Poultry Litter Co-Combustion Process. Appl. Sci. 2019, 9, 4116. [Google Scholar] [CrossRef]
Figure 1. Experimental apparatus.
Energies 17 03650 g001
Figure 2. Normalized mass as a function of time and temperature for: (a) eucalyptus, (b) acacia, (c) pine, and (d) olive.
Energies 17 03650 g002
Figure 3. Comparison of the mass-loss behavior of the different fuels at different isothermal temperatures: (a) 400 °C, (b) 500 °C, (c) 600 °C, (d) 700 °C, and (e) 800 °C.
Energies 17 03650 g003aEnergies 17 03650 g003b
Figure 4. Influence of temperature on (a) the percentage of mass loss during the first stage, and (b) corresponding time as a function of temperature.
Energies 17 03650 g004
Figure 5. Percentage of mass loss during the second stage as a function of temperature.
Energies 17 03650 g005
Figure 6. Average gas emissions and standard deviation as a function of reactor temperature.
Energies 17 03650 g006
Figure 7. Degree of conversion as a function of time for (a) acacia, (b) pine, (c) olive, and (d) eucalyptus (TGA experiments—20 and 100 °C/min, and macro-TGA experiments—400 and 800 °C).
Energies 17 03650 g007
Table 1. Composition of the eucalyptus woodchips.
EucalyptusPineAcaciaOlive
Proximate analysis (wt.%, dry basis)
Volatile matter89.683.781.881.5
Ash4.23.21.11.8
Fixed carbon6.213.917.116.7
Ultimate analysis (wt.%, dry-ash-free)
Carbon47.2047.3045.4049.40
Hydrogen7.036.406.886.95
Nitrogen0.110.130.770.24
Oxygen45.6545.1846.9442.53
Calorific Value (MJ/kg, dry basis)
HHV15.2019.1017.1417.71
LHV13.8118.6015.6616.22
Table 2. Operating conditions of the thermogravimetric experiments.
ParameterValue
Initial mass (mg)10
Particle size (mm)0.125–0.250
Flow rate (mL/min)100
Temperature (°C)Ambient to 900
Heating rate (°C/min)20 and 100
Disclaimer/Publisher’s Note: The statements, opinions and data contained in all publications are solely those of the individual author(s) and contributor(s) and not of MDPI and/or the editor(s). MDPI and/or the editor(s) disclaim responsibility for any injury to people or property resulting from any ideas, methods, instructions or products referred to in the content.