Article

A Study on the Efficient Degradation of Sulfur Hexafluoride by Pulsed Dielectric Barrier Discharge Synergistic Active Gas

1
Scientific Research Institute of Electric Power, Guizhou Power Grid Company Ltd., Guiyang 550000, China
2
Hubei Engineering Research Center for Safety Monitoring of New Energy and Power Grid Equipment, Hubei University of Technology, Wuhan 430068, China
*
Author to whom correspondence should be addressed.
Energies 2024, 17(15), 3648; https://doi.org/10.3390/en17153648
Submission received: 24 June 2024 / Revised: 15 July 2024 / Accepted: 23 July 2024 / Published: 24 July 2024
(This article belongs to the Section F: Electrical Engineering)

Abstract

:
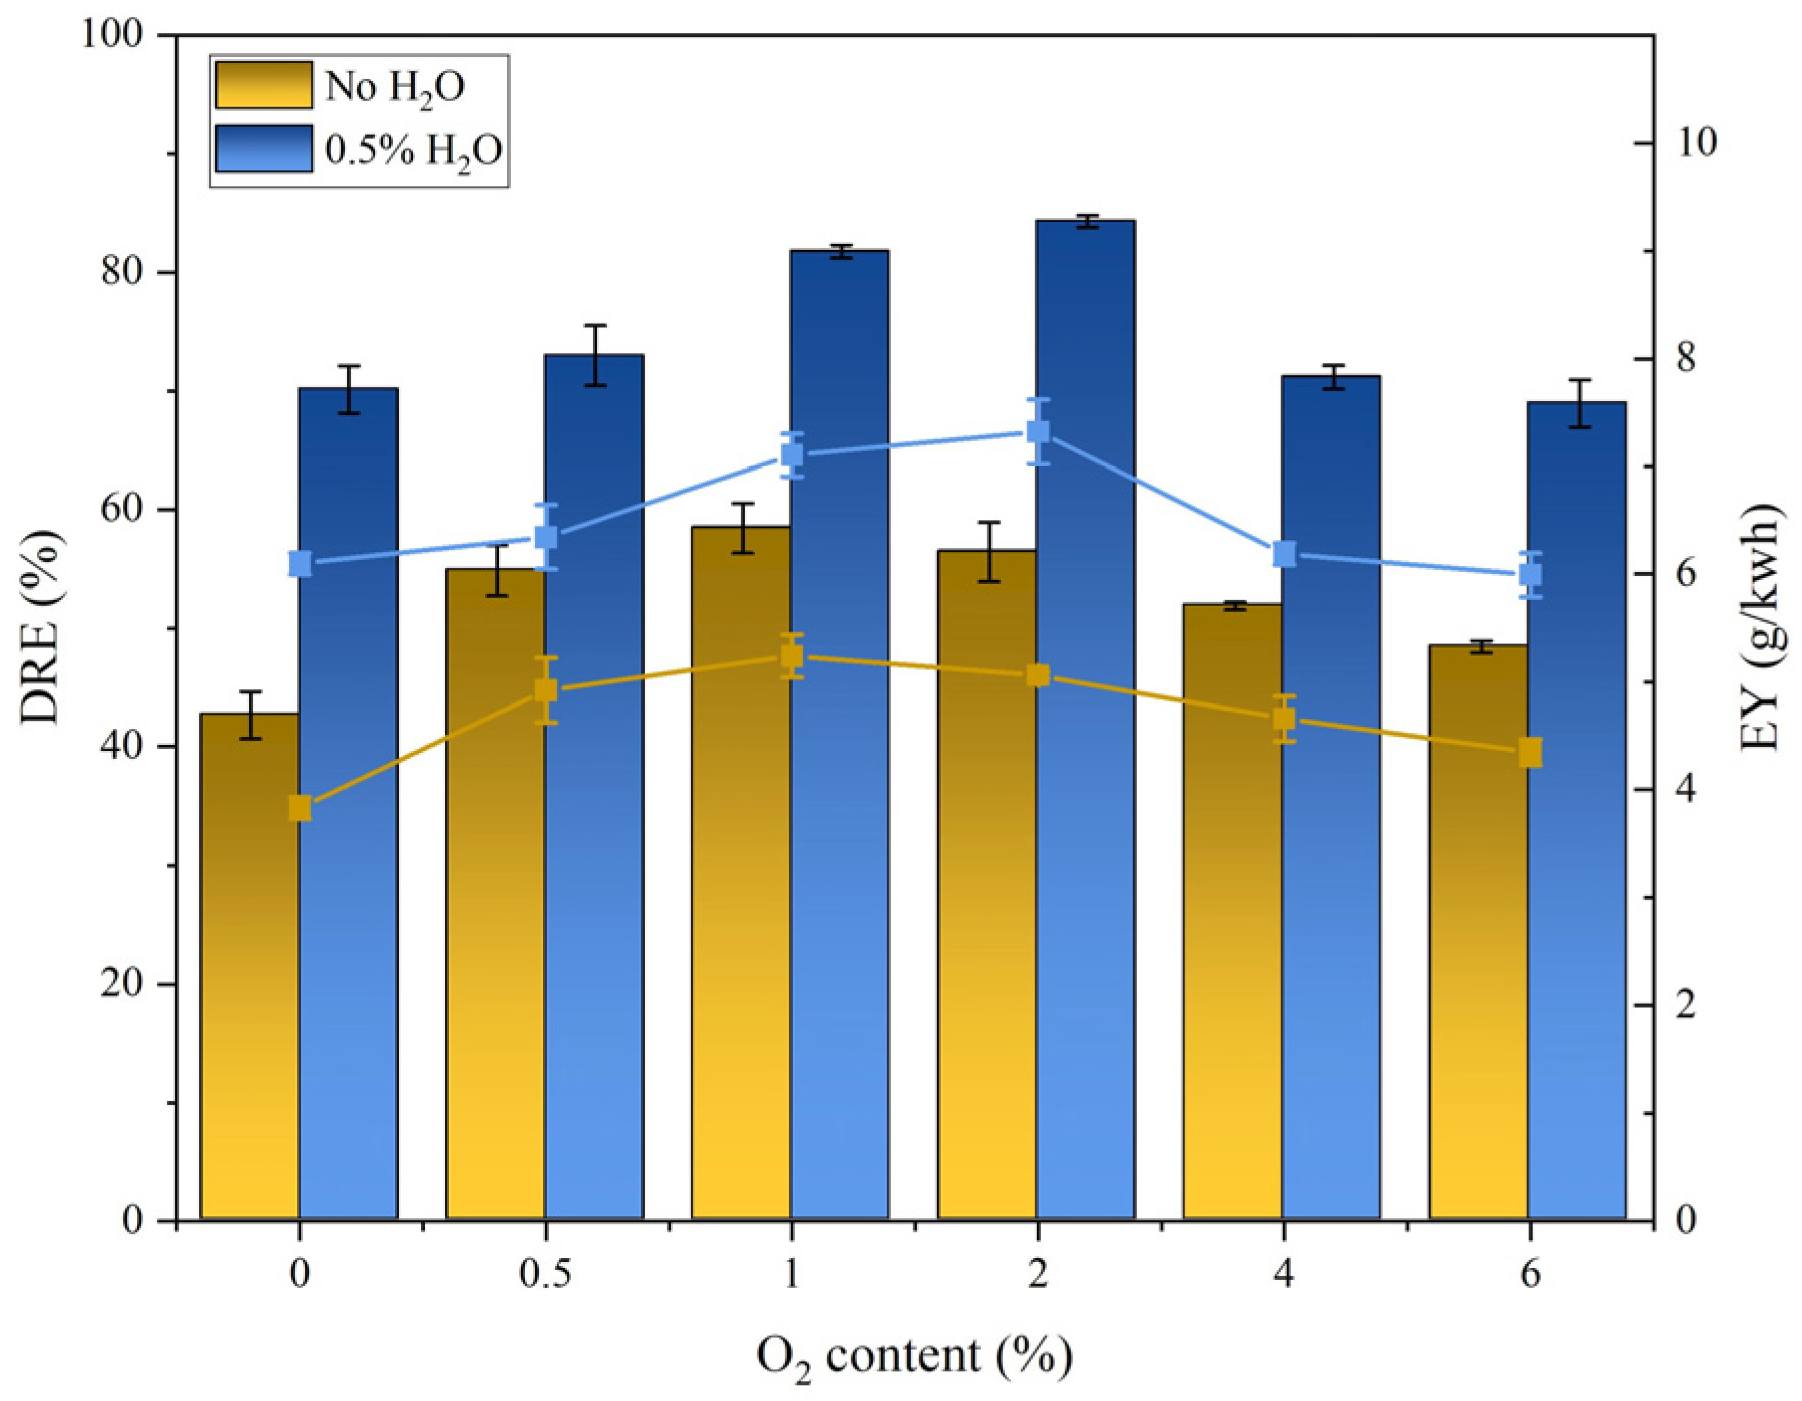
SF6 is a strong greenhouse effect gas, which is widely used in high-voltage electrical equipment such as circuit breakers and high-voltage switchgear because of its excellent insulation performance and arc extinguishing ability. In recent years, the use and emission of SF6 have been rising, and with the proposal of the dual carbon strategic goal, its harmless degradation has become an urgent problem to be solved. In this paper, SF6 was degraded by pulsed DBD plasma technology and O2. Studies have shown that the addition of O2 can effectively promote the degradation of SF6. With the increase in the added O2 content, the DRE and EY of SF6 first increased and then decreased. Under the conditions of the input power of 50 W, SF6 concentration of 2%, and gas flow rate of 50 mL/min, the reaction system obtained the highest DRE and EY of 58.40% and 5.24 g/kWh when the O2 content was 1%, respectively. In the SF6/Ar/O2/H2O system, the addition of H2O could improve the product selectivity of SO2F2, and when the O2 concentration was 1%, the highest selectivity of SO2F2 was 48.96%, and the concentration was 8006.76 ppm. The addition of O2 inhibited the production of SO2, and with the addition of the O2 system, SO2F2 and SOF4 were the main components of degradation products; however, there were also SOF2, SO2, SiF4, SF4, etc. In this paper, the decomposition path of O2 under SF6 was analyzed in detail according to infrared spectroscopy and decomposition products.

1. Introduction

Sulfur hexafluoride (SF6) is an artificial inert gas synthesized by French chemists Moissan and Lebeau in 1900. Under normal conditions, it is a colorless, odorless non-toxic non-flammable gas, slightly soluble in water, ethanol, and diethyl ether. Its insulation capacity is more than 2.5 times that of air and nitrogen, and its arc extinguishing capacity is 100 times that of air [1,2,3]. Because of its excellent electrical insulation and arc extinguishing characteristics, it is widely used in high-voltage electrical equipment such as circuit breakers, relays, high-voltage switchgear, etc. It is also used in metal smelting, aerospace, medical, and other fields [4,5,6]. However, due to its strong greenhouse effect, SF6 was listed as a greenhouse gas in the Kyoto Protocol in 1997 [7]. Its global warming potential (GWP) is 23500 times greater than that of CO2, and it takes 3200 years to degrade in the atmosphere, making it impossible to degrade naturally [8].
With the rapid development of the electric power industry in recent years, the demand and emission of SF6 have been rising year by year, and the concentration of SF6 increased dramatically in the atmosphere [9]. With the proposal of a double carbon strategic goal, the degradation and emission reduction of SF6 has become an urgent problem to be solved. Many scholars at home and abroad have carried out extensive research on SF6 degradation, and at present, there are mainly thermal catalytic degradation, photocatalytic degradation, plasma degradation, and so on. Thermal catalytic degradation is more effective and has a larger degradation amount, but its energy utilization rate is small [10]. Photocatalytic degradation reaction conditions are mild and easy to control, but the degradation amount and destruction and removal efficiencies (DREs) in this method are low [11]. Plasma degradation has the advantages of good degradation effect, high energy utilization, and ease of control [12]. Plasma degradation technology generates a large number of electrons and active particles in the plasma region to react with SF6, causing it to gradually break bonds and decompose. Plasma degradation techniques are divided into gliding arc plasma [13], radiofrequency plasma [14], and dielectric barrier discharge (DBD) plasma [15,16,17], according to the plasma generation method. The gliding arc plasma can quickly produce a large amount of plasma, the phenomenon is more intense, and the processing rate is fast, but its energy utilization is low, and the reaction conditions are harsh [18]. Radiofrequency plasma is generated by the radiofrequency source of high-frequency alternating magnetic field excitation of the ionization of the gas undergoing reaction for its production, with low power consumption, and high degradation rate, but the equipment is more complex, and the method is not conducive to industrial applications [19]. DBD plasma has the advantages of mild reaction, easy control, high energy utilization, and adaptability [20,21]. In 2007, Shen et al. [22], used AC plasma to investigate the degradation law of SF6 under different input voltages and found that the DRE gradually increased with the increase in power. The addition of water vapor can effectively improve the DRE; the initial partial pressure ratio of water vapor to SF6 is close to 1:1, which can lead to a DRE of close to 90%, and the addition of water vapor of 28.2 kPa and 1.8 kPa of air can lead to SF6 degradation of 92%. The addition of 28.2 kPa water and 1.8 kPa air can degrade SF6 by 92%. In 2014, Zhuang et al. used an AC power supply to drive a star-shaped electrode DBD reactor to degrade 820 ppm SF6 gas and found that the microdischarge generated at the tip of the star-shaped electrode effectively promoted the decomposition of SF6 gas [23]. Zhang et al. [24,25] used DBD plasma to study the effects of different background gases and different filling dielectric on SF6 degradation and found the degradation effect He > Ar > N2 > air and the degradation effect Al2O3 > glass spheres > no filler with different filling dielectric materials, as well as the maximum DRE of 2% SF6 at 110 W in the system filled with γ-Al2O3 particles. The maximum DRE of SF6 reached 85.97%, and the energy yield (EY) reached 9.17 g/kWh. The pulsed power supply is a switching power supply system, and compared with the AC power supply, it will not continuously apply voltage to the reactor, effectively avoiding the thermal effect generated between two pulses. More discharge energy is used to ionize the gas so that the temperature of the reactor is maintained at a relatively low level, and at the same time, the narrow pulse rise time can inhibit the generation of the fine filament discharge and improve the uniformity of the discharge [26]. Shao et al. used nanosecond pulsed plasma and bimetallic nickel–iron catalyst coupling to synergistically catalyze CO2 methanation and found that the Fe/Ni ratio at 231 °C had a CO conversion and energy efficiency of 67.5% and 57,823 μg/kJ, and a C-H selectivity of 99%, with complete suppression of the side reactions of CO generation [27]. Dong et al. established a multi-needle-plate high-pressure pulsed gas–liquid two-phase discharge plasma for the degradation of phenolic wastewater, and the results showed that under the conditions of a pulse voltage of 26 kV, a pulse frequency of 70 Hz, and an aeration volume of 4 L/min, the best degradation effect was achieved by the addition of 0.05 g of the Fe-TiO2 catalyst coupled with the discharge plasma at a roasting temperature of 500 °C. In addition, the addition of active gas can effectively improve the DRE and EY and can change the product distribution to some extent [28]. Zhang et al. [29,30] explored the effects of the addition of H2O and NH3 on SF6 degradation and found that the addition of H2O can improve the selectivity of SO2, and the addition of NH3 can convert SF6 gas into solid products such as sulfur monomers, NH4HF2, and NH4F, which is convenient for harmless treatment of the products.
In order to further investigate the effect of adding active gas O2 on SF6 decomposition, in this study, an experimental platform of pulsed DBD was developed to analyze the effect of O2 on the degradation of SF6 by pulsed DBD. The decomposition path and promotion mechanism of SF6 under the participation of O2 were analyzed, and the findings provide an experimental basis for the efficient degradation of SF6 waste gas.

2. Experimental Platforms

In this study, a pulsed DBD experimental platform was built, as shown in Figure 1, which mainly consisted of a gas distribution system, a plasma degradation system, a decomposition product detection system, and a decomposition product absorption processing system. Without special instructions, the SF6 concentration was 2%, the gas flow rate was 50 mL/min, the input power was 45 W, the input voltage was 15 kV, and the pulse frequency was 15 kHz.
In this study, a GC500 (Jiangsu Electric Technology Co., Zhenjiang, Jiangsu, China) Ltd. four-channel intelligent dynamic gas distributor was used to control the input gas concentration and flow rate. The water gas generator was customized by (Suzhou Vorand Experimental Equipment Co., Ltd., Suzhou, China), and the range of the input gas flow rate was 0~500 mL/min with an instrumental accuracy of 1% F.S. The distribution concentration and output gas flow rate can be set in the gas distributor. A Fourier transform infrared spectrometer (FTIR) was used for qualitative analysis of SF6 gas products. Gas chromatography–mass spectrometry (GC-MS) was used to quantify the main degradation products SO2, SOF2, SO2F2, and SOF4. An MX2500+ three-channel spectrometer produced by (Ocean Optics Co., Ltd, Quadrangle Blvd Orlando, FL, USA) was used to detect the plasma emission spectra. In order to improve the reproducibility of the experiments, all the experiments in this study were repeated three times, and the results were averaged.
The DRE of SF6 is calculated as follows:
D R E ( % ) = C i n C o u t C i n × 100 %
where C i n is the concentration of SF6 before degradation, and C o u t is the concentration of SF6 remaining after the degradation reaction.
The EY of SF6 is defined as the mass of SF6 degraded per unit of input energy and is calculated using Equation (2).
E Y ( g / kWh ) = M S F 6 P × t
where M S F 6 is the mass of degraded SF6 gas at a certain time, in g; P is the input power, in W; t is the degradation time; and EY is the energy efficiency, in g/kWh.
The product selectivity of the main degradation products of SO2, SOF2, SO2F2, and SOF4 is calculated using Equation (3) as follows:
S K = C K C i n C o u t × 100 %
where C K is the concentration of the decomposition product K gas after the SF6 degradation reaction, and SK indicates the concentration of the decomposition product K gas as a percentage of the total SF6 degradation.

3. Results

3.1. DER and EY

The addition of H2O and O2 can change the decomposition path of SF6; therefore, we explored the influence law of different O2 concentrations on SF6 degradation. Figure 2 shows the changing law of the DRE and EY of SF6 by the O2 concentration without the addition of H2O and with the addition of 0.5% H2O to the system. With the increase in the O2 concentration, both the DRE and EY of SF6 showed a trend of first increasing and then decreasing. In the system without additional H2O, when the O2 concentration was 1%, the DRE of SF6 in the system was 58.40%, and the EY was 5.24 g/kWh. With the addition of 6% O2, the DRE and EY of SF6 were 48.45% and 4.35 g/kWh, respectively, which were higher than that of the case with no additional gas (42.65%, 3.82 g/kWh). The DRE and EY of SF6 were significantly higher in the system with 0.5% H2O added than in the system without the added H2O, and the highest DRE and EY were observed at 2% O2 concentration, namely at 84.2% and 7.3 g/kWh, respectively. In the system with 6% O2, the DRE and EY of SF6 were 68.94% and 5.99 g/kWh, which were lower than those in the system without the added O2 (70.14% and 6.09 g/kWh). In the synergistic degradation of SF6 by H2O and O2, excessive O2 inhibited its degradation, probably because more energy was used to activate the decomposition of O2, and thus less energy was used to decompose SF6, resulting in a lower degradation rate of SF6.

3.2. Active Particle Analysis

After investigating the influence of the O2 concentration on the degradation of SF6 by pulsed DBD, in order to further study the microscopic mechanism of O2 promoting the decomposition of SF6, we detected and analyzed the active particles in the decomposition process of SF6 discharge with the addition of different concentrations of O2.
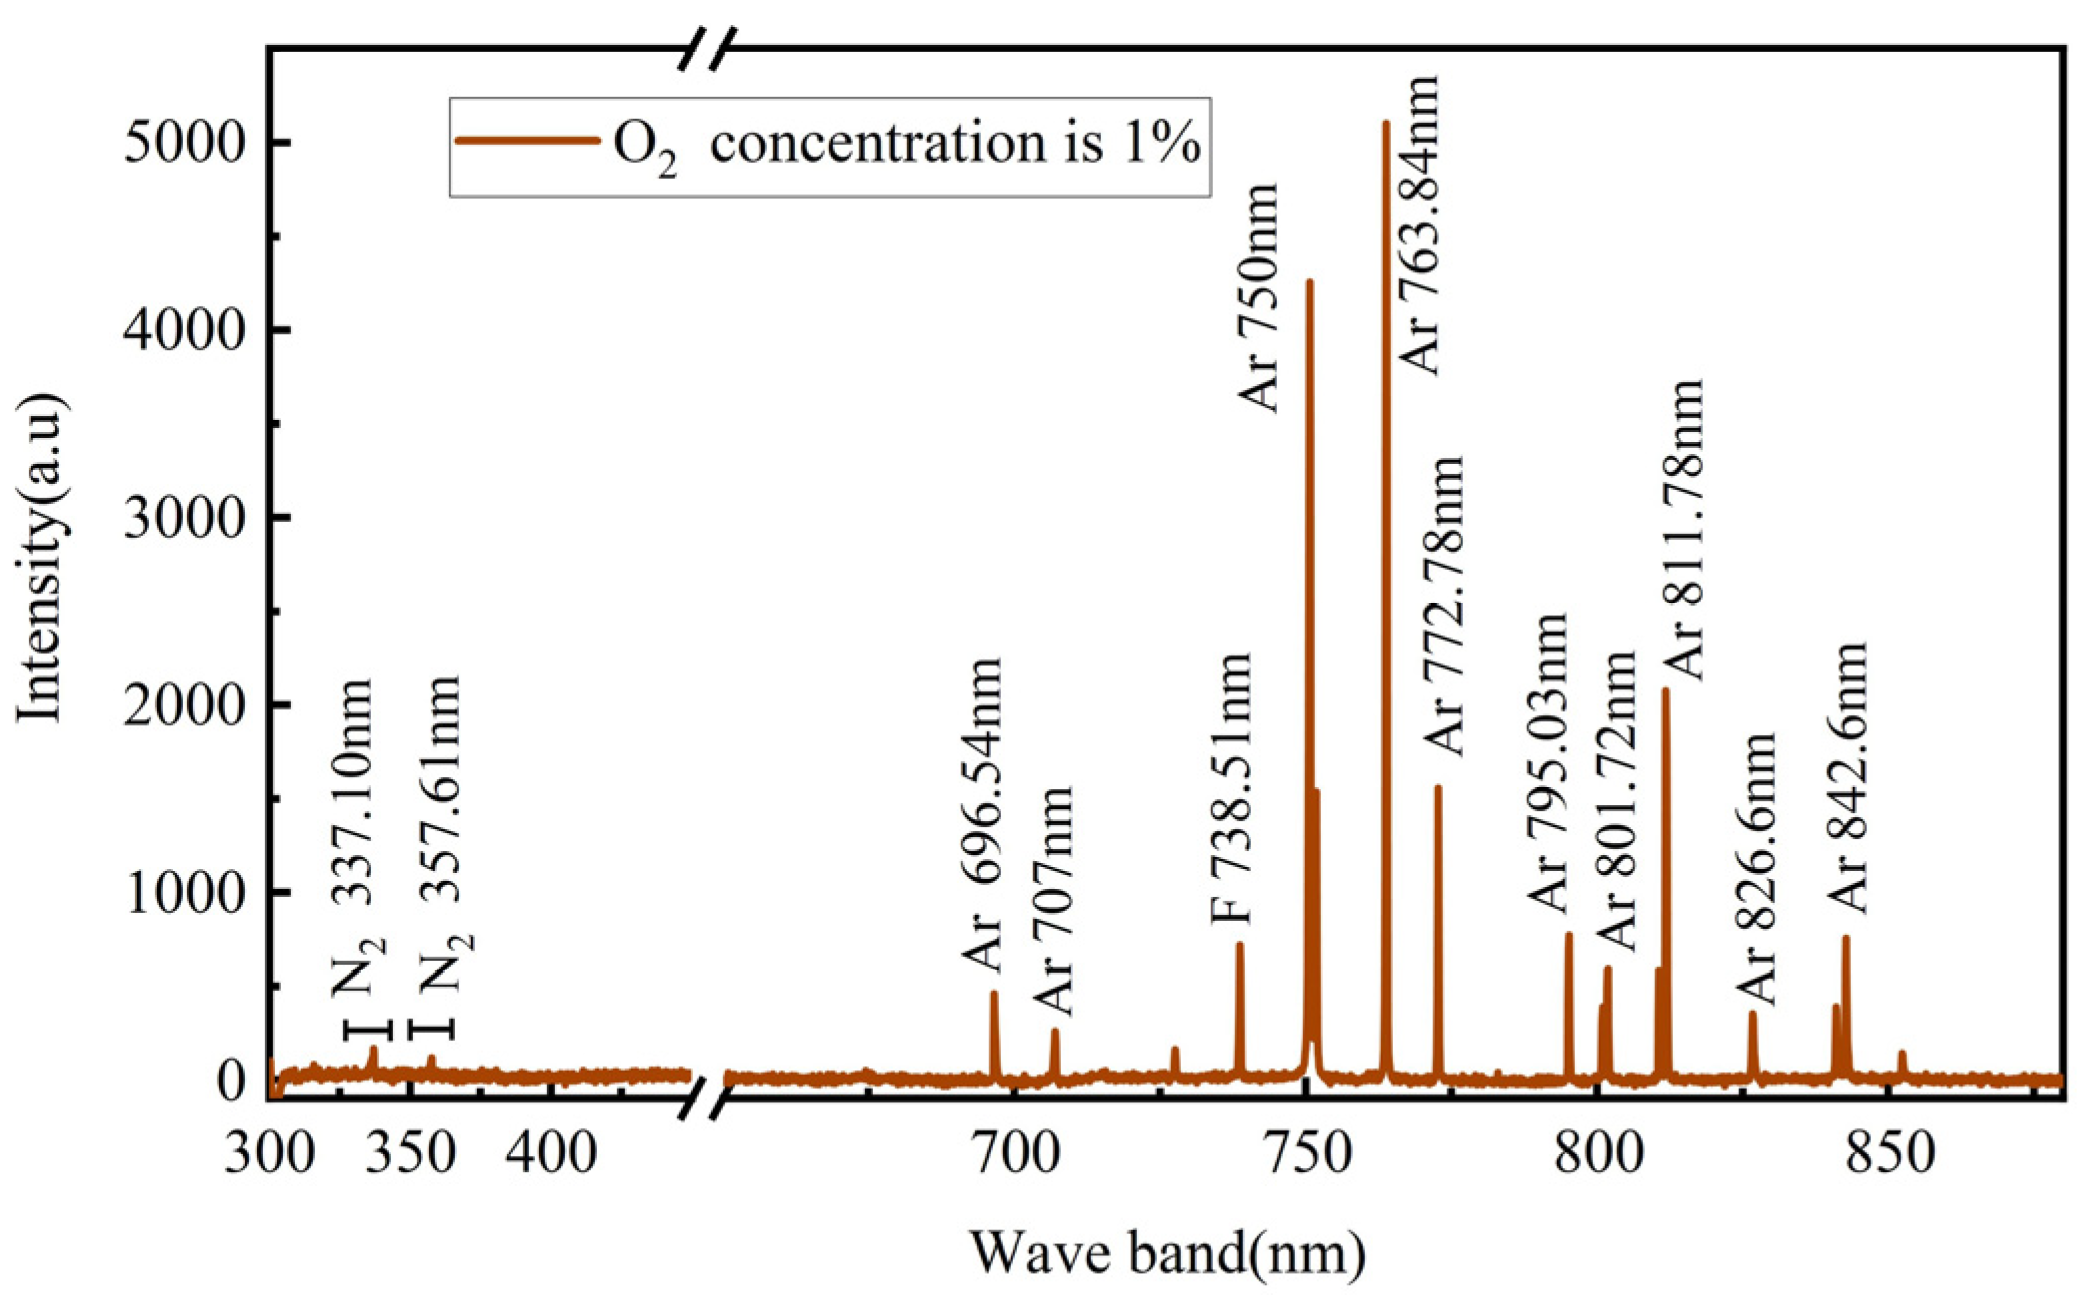
Figure 3 shows the emission spectra of the SF6/Ar/O2 system with oxygen concentration at 1%. The main characteristic spectral lines in the 300~850 nm band include Ar and F spectral lines. The Ar spectral lines mainly include Ar 696.54 nm, Ar 750 nm, Ar 763.84 nm, Ar 772.78, and Ar 811.78 nm. The F spectral line produced by the free F atoms, which are generated by the bond breaking of (4) and (5), is F 738.51 nm. Weak N2 out peaks were detected at 337.10 nm and 357.61 nm. Since there was no N2 involved in the system, this may be due to the characteristic spectral line of the N2 band generated by the N2 excitation in the air between the spectrometer and the reactor.
According to the literature [31], the main dissociation process of O2 molecules in the DBD reaction is shown in (6)~(9), and the O radicals produced by dissociation can provide the system with O elements and promote the SF6 degradation reaction. However, O2 is also an electronegative gas, which will adsorb electrons in the reaction and reduce the probability of collision reaction between free electrons and SF6 gas molecules.
e * + SF 6 SF x + ( 6 x ) F + e   ( 1 x 5 )
Ar * + SF 6 SF x + ( 6 x ) F + Ar   ( 1 x 5 )
e * + O 2 O + O + e
e * + O 2 O + O
e * + O 2 O + + O + 2 e
O O + e
e + Ar Ar * + e
In addition, the spectral intensity of the Ar 763.84 nm spectral line under different O2 concentration conditions was recorded in this study. Figure 4 shows the relative intensity of the Ar 763.84 nm spectral line under different O2 concentration conditions. With the gradual increase in O2 concentration, the intensity of the Ar 763.84 nm spectral line in the system gradually decreased, which was mainly caused by the fact that the increase in the O2 concentration led to a decrease in the Ar gas in the system; thus, the reaction process of (7) was inhibited, and the content of the excited-state Ar* in the reaction system decreased, which led to the weakening of the intensity of the Ar spectral line. Although O radicals could promote the SF6 degradation process and inhibit the recombination of primary decomposition products of SF6, when the O2 concentration was excessive, the Penning ionization process in the DBD reaction was weakened, and the plasma density decreased, which reduced the opportunity for the interaction of active substances such as high-energy electrons, excited-state particles, and other active substances with SF6 gas molecules, which then resulted in a decrease in the DRE of SF6.

3.3. Product Analysis

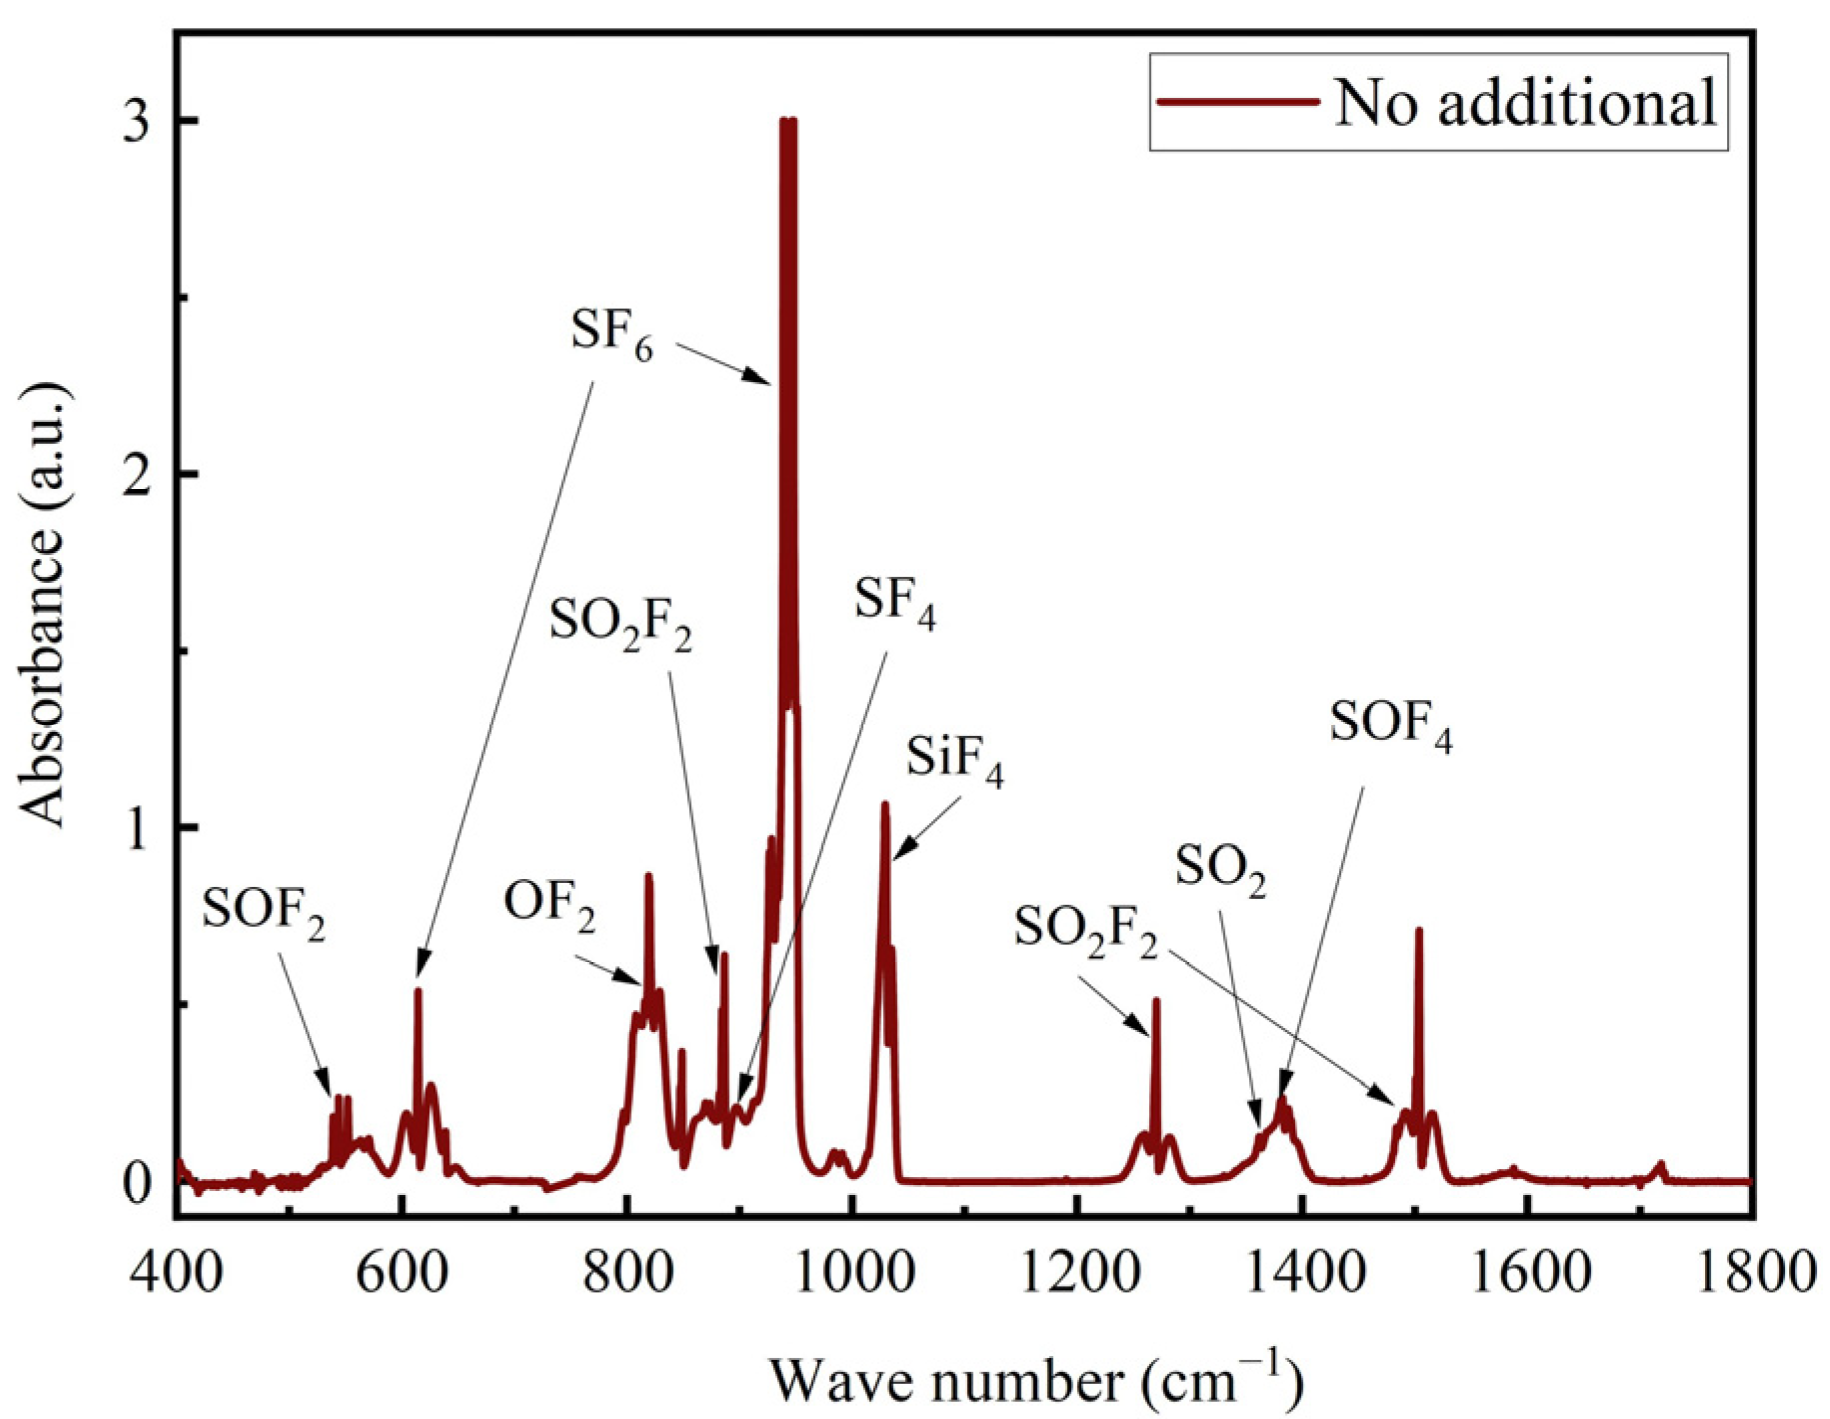
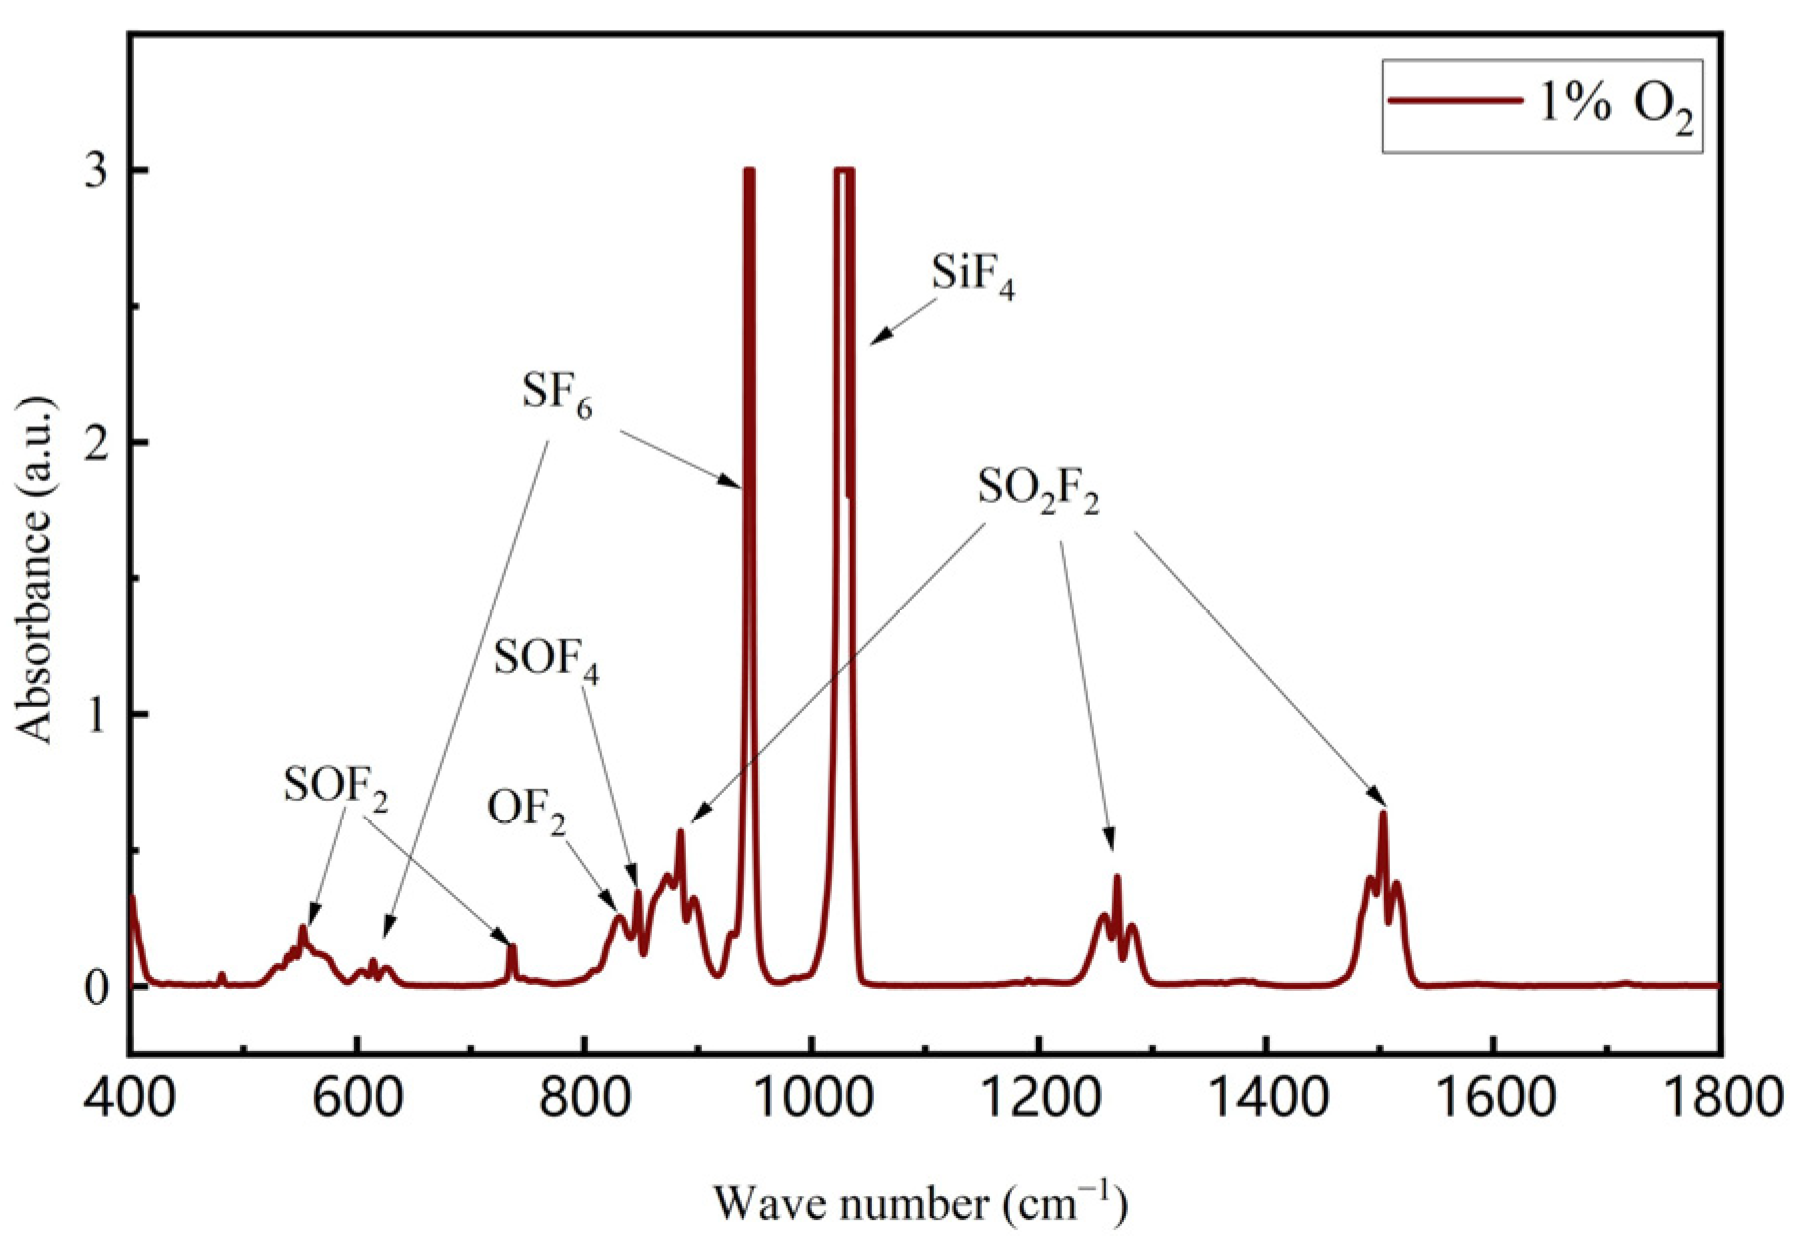
In order to qualitatively analyze the decomposition products of SF6 under the added O2 system, FTIR was used to detect and analyze the system with and without added O2. Figure 5, Figure 6 and Figure 7 show the FTIR spectra of the degradation products in the systems without the addition of O2 and with the addition of 1% O2, and 2% O2/0.5% H2O, respectively. The main degradation products included SOF4, SO2F2, SOF2, SF4, OF2, and SiF4. The addition of 2% O2/0.5% H2O system showed a significant decrease in the absorbance of SF6 and a significant increase in SO2F2 and SiF4 compared with the no-addition system and 1% O2 system. The results are consistent with the GCMS quantitative detection results in Figure 8 and Figure 9. The addition of O2 and H2O significantly initiated the degradation of SF6, which was decomposed into SO2F2. The reason for the detection of SiF4 in the SF6 decomposition products is that the reactor material used in the experiment is SiO2 quartz glass. The F ions produced by the ionization of SF6 gas in the plasma region etched with SiO2 and generated SiF4. However, when different concentrations of O2 were added, no characteristic peaks of SO2 appeared in the FTIR spectra, indicating that SO2 is relatively difficult to generate when O2 is added. There were more obvious SO2 characteristic peaks in the system with the addition of 0.5% H2O, indicating that the addition of H2O can improve the product selectivity of SO2. The formation pathways of each product were hypothesized based on the main degradation products, as shown in (11) to (17). It can be seen that the energy of the reaction path for the formation of S-O-F intermediate products such as SOF4 and SOF2 during the reaction was low, and these reactions were more likely to occur. The S-O-F intermediate products could further generate SO2F2 and the final products SO2 and HF through the reaction.
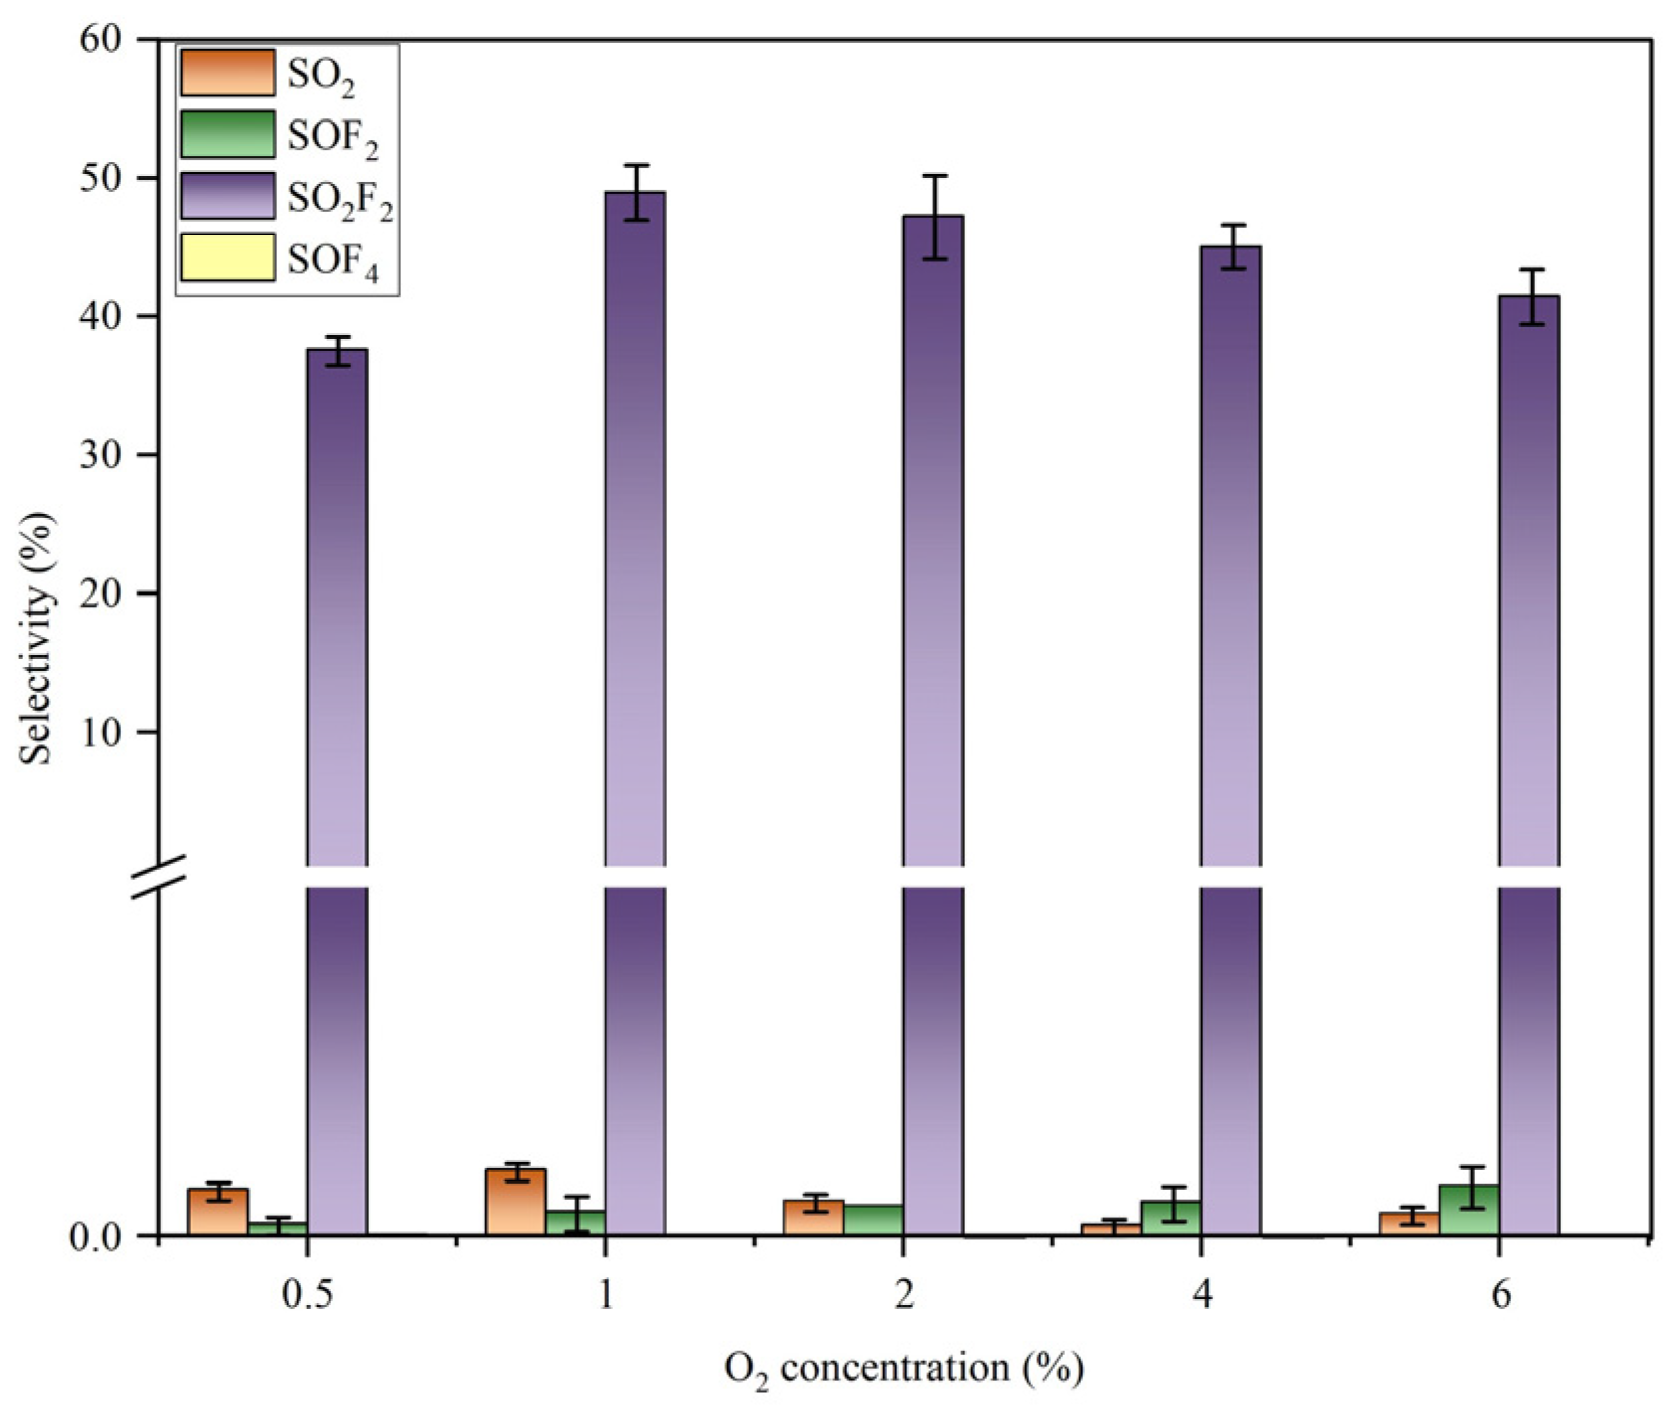
To further understand the distribution of the main degradation products, four gases, namely SO2, SOF2, SO2F2, and SOF4, were quantitatively detected by GCMS, and the selectivity distributions of the four products are shown in Figure 8 and Figure 9. In the SF6/Ar/O2 system, the product selectivity of SO2F2 and SOF4 dominated, and only a small amount of SO2 and SOF2 was detected. With the increase in O2 content, the selectivity of SO2F2 showed a rising trend as a whole, and the selectivity of SO2F2 after the addition of O2 was higher than that of the system without the addition of O2. The selectivity of SOF4 showed a trend of increasing and then decreasing, as shown in (15), and the selectivity of SO2F2 and SOF4 with the addition of O2 was higher than that of the system without O2. The product selectivity of SO2F2 and SOF4 was higher than that of the system without O2, which indicated that O2 improved the generation of S-O-F products at 1% O2 concentration; the selectivity of SO2F2 was 34%, and its concentration was 3978.83 ppm at this time. The concentration of SOF4 was 408.29 ppm at 1% O2 concentration. The decomposition products such as SO2, SOF4, and SO2F2 are acidic gases, which can be absorbed by the saturated NaOH solution at the end of the reaction system, as shown in Figure 1, thus effectively minimizing their harmful effects on the environment and human safety. The gases absorbed by lye no longer contained atmospheric pollutants, thus achieving the purpose of harmless emission.
In the SF6/Ar/O2/H2O system, the main products were SO2F2, and trace SO2 with SOF2 and SOF4. Compared with the SF6/Ar/O2 system, the addition of O2 improved the product selectivity of SO2F2. With the increase in the O2 content, the product selectivity of SO2F2 showed a trend of increasing and then decreasing, and in the case of 1% O2, the selectivity of SO2F2 was 48.96%; the highest selectivity was 48.96% at a concentration of 8006.76 ppm. SOF2 increased with the increase in the O2 content, as shown in Equation (14).
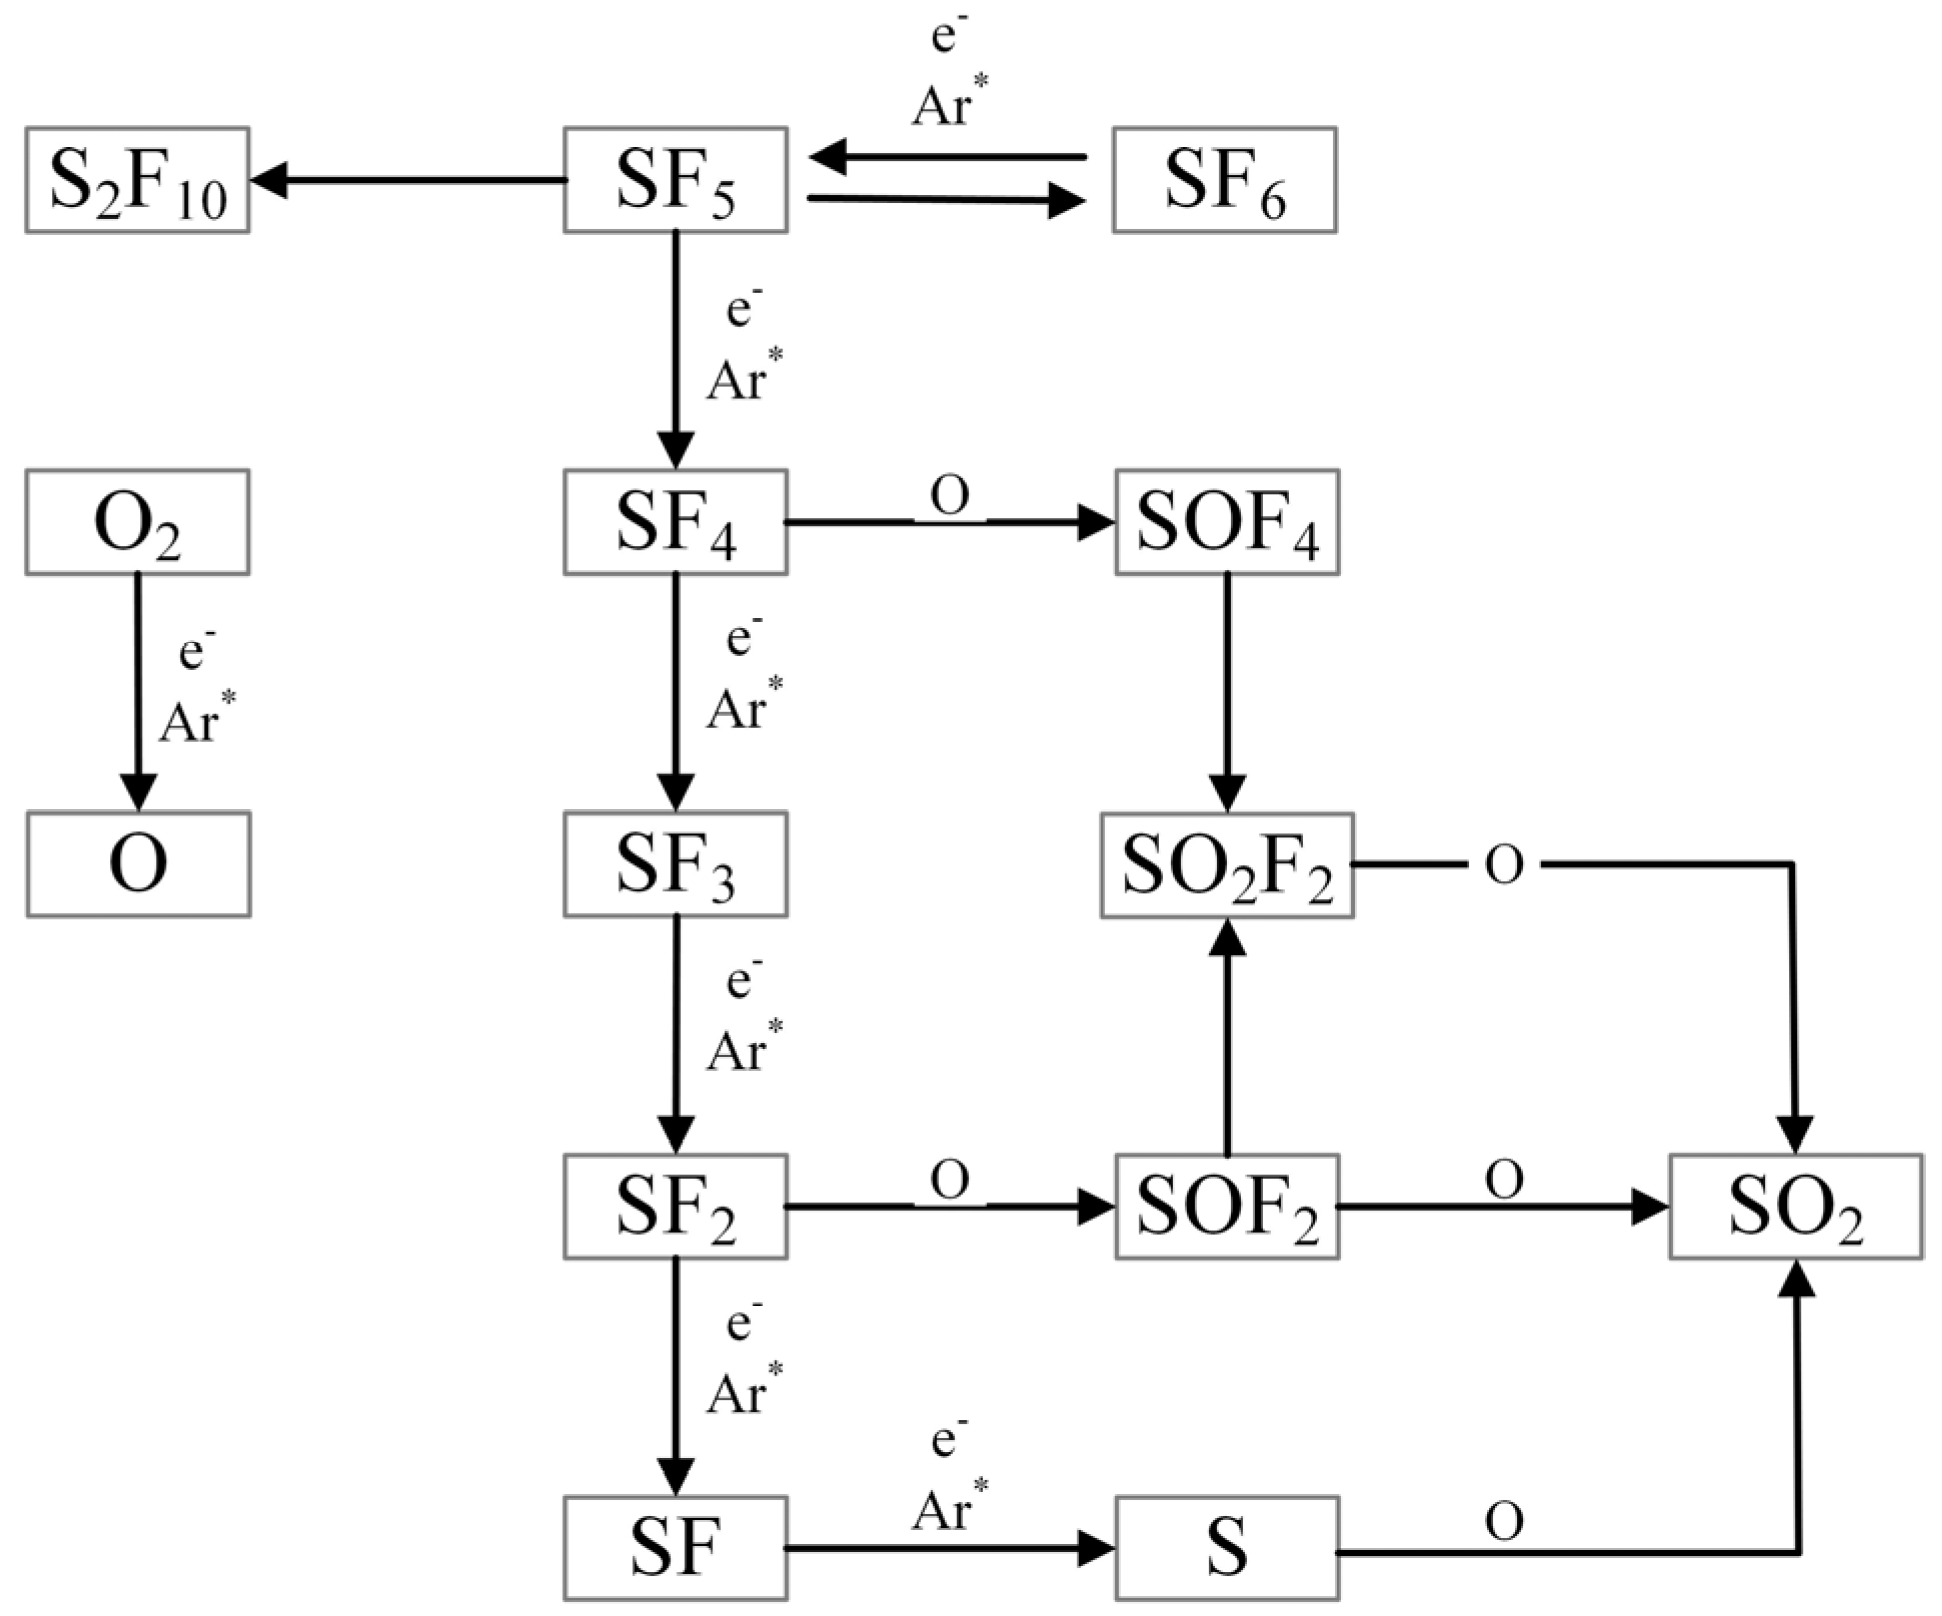
In the SF6/Ar/O2 system, the free O radicals, produced according to Formula (6), reacted with the low-fluorine sulfide produced by gradual dissociation to form the main degradation products such as SO2F2, in which SOF4, SOF2, SO2F2, and SO2 were mainly produced according to Equations (11)–(17) in Table 1 [32]. SOF4 is the intermediate product of the degradation reaction, which will be further oxidized by O2 to SO2F2, which is the reason why the content of SOF4 is lower than that of SO2F2. The formation process of SOF2 is shown in Equations (13) and (14); this process requires SF6 gas molecules to combine with O after breaking 3~4 S-F bonds. In addition, SOF2 gas also combines with O to form further products such as SO2F2, resulting in a relatively low content, while SO2 has a relatively low content due to its formation pathway requiring more steps and energy in the reaction system.
In summary, the O radicals provided by O2 in the plasma reaction can react rapidly with the low-fluorinated sulfides produced by the gradual dissociation of SF6 to form stable compounds, which facilitates the SF6 degradation process. In order to more clearly show the path of O2 involved in SF6 decomposition, Figure 10 summarizes the decomposition of SF6 and the generation of products.

3.4. Comparison of Degradation Methods and Harmless Treatment of SF6 Degradation Products

3.4.1. Comparison of Degradation Methods

Table 2 summarizes the performance of various degradation methods in terms of the degradation rate, energy efficiency, and product regulation. Overall, except for the DBD plasma technique used for the degradation of SF6, catalytic degradation techniques suffer from low energy efficiency and small processing capacity, which presents many critical issues that need to be resolved before achieving large-scale industrial applications. The currently implemented high-temperature pyrolysis methods require significant heating and constant replacement of adsorption materials, resulting in high operational costs and increased danger. In contrast, DBD plasma technology boasts high degradation rates and high energy efficiency, with relatively strong safety and scalability. It can flexibly form portable and centralized degradation devices, making this technology a promising solution for the degradation of SF6 in the power industry [33].

3.4.2. Harmless Treatment of SF6 Degradation Products

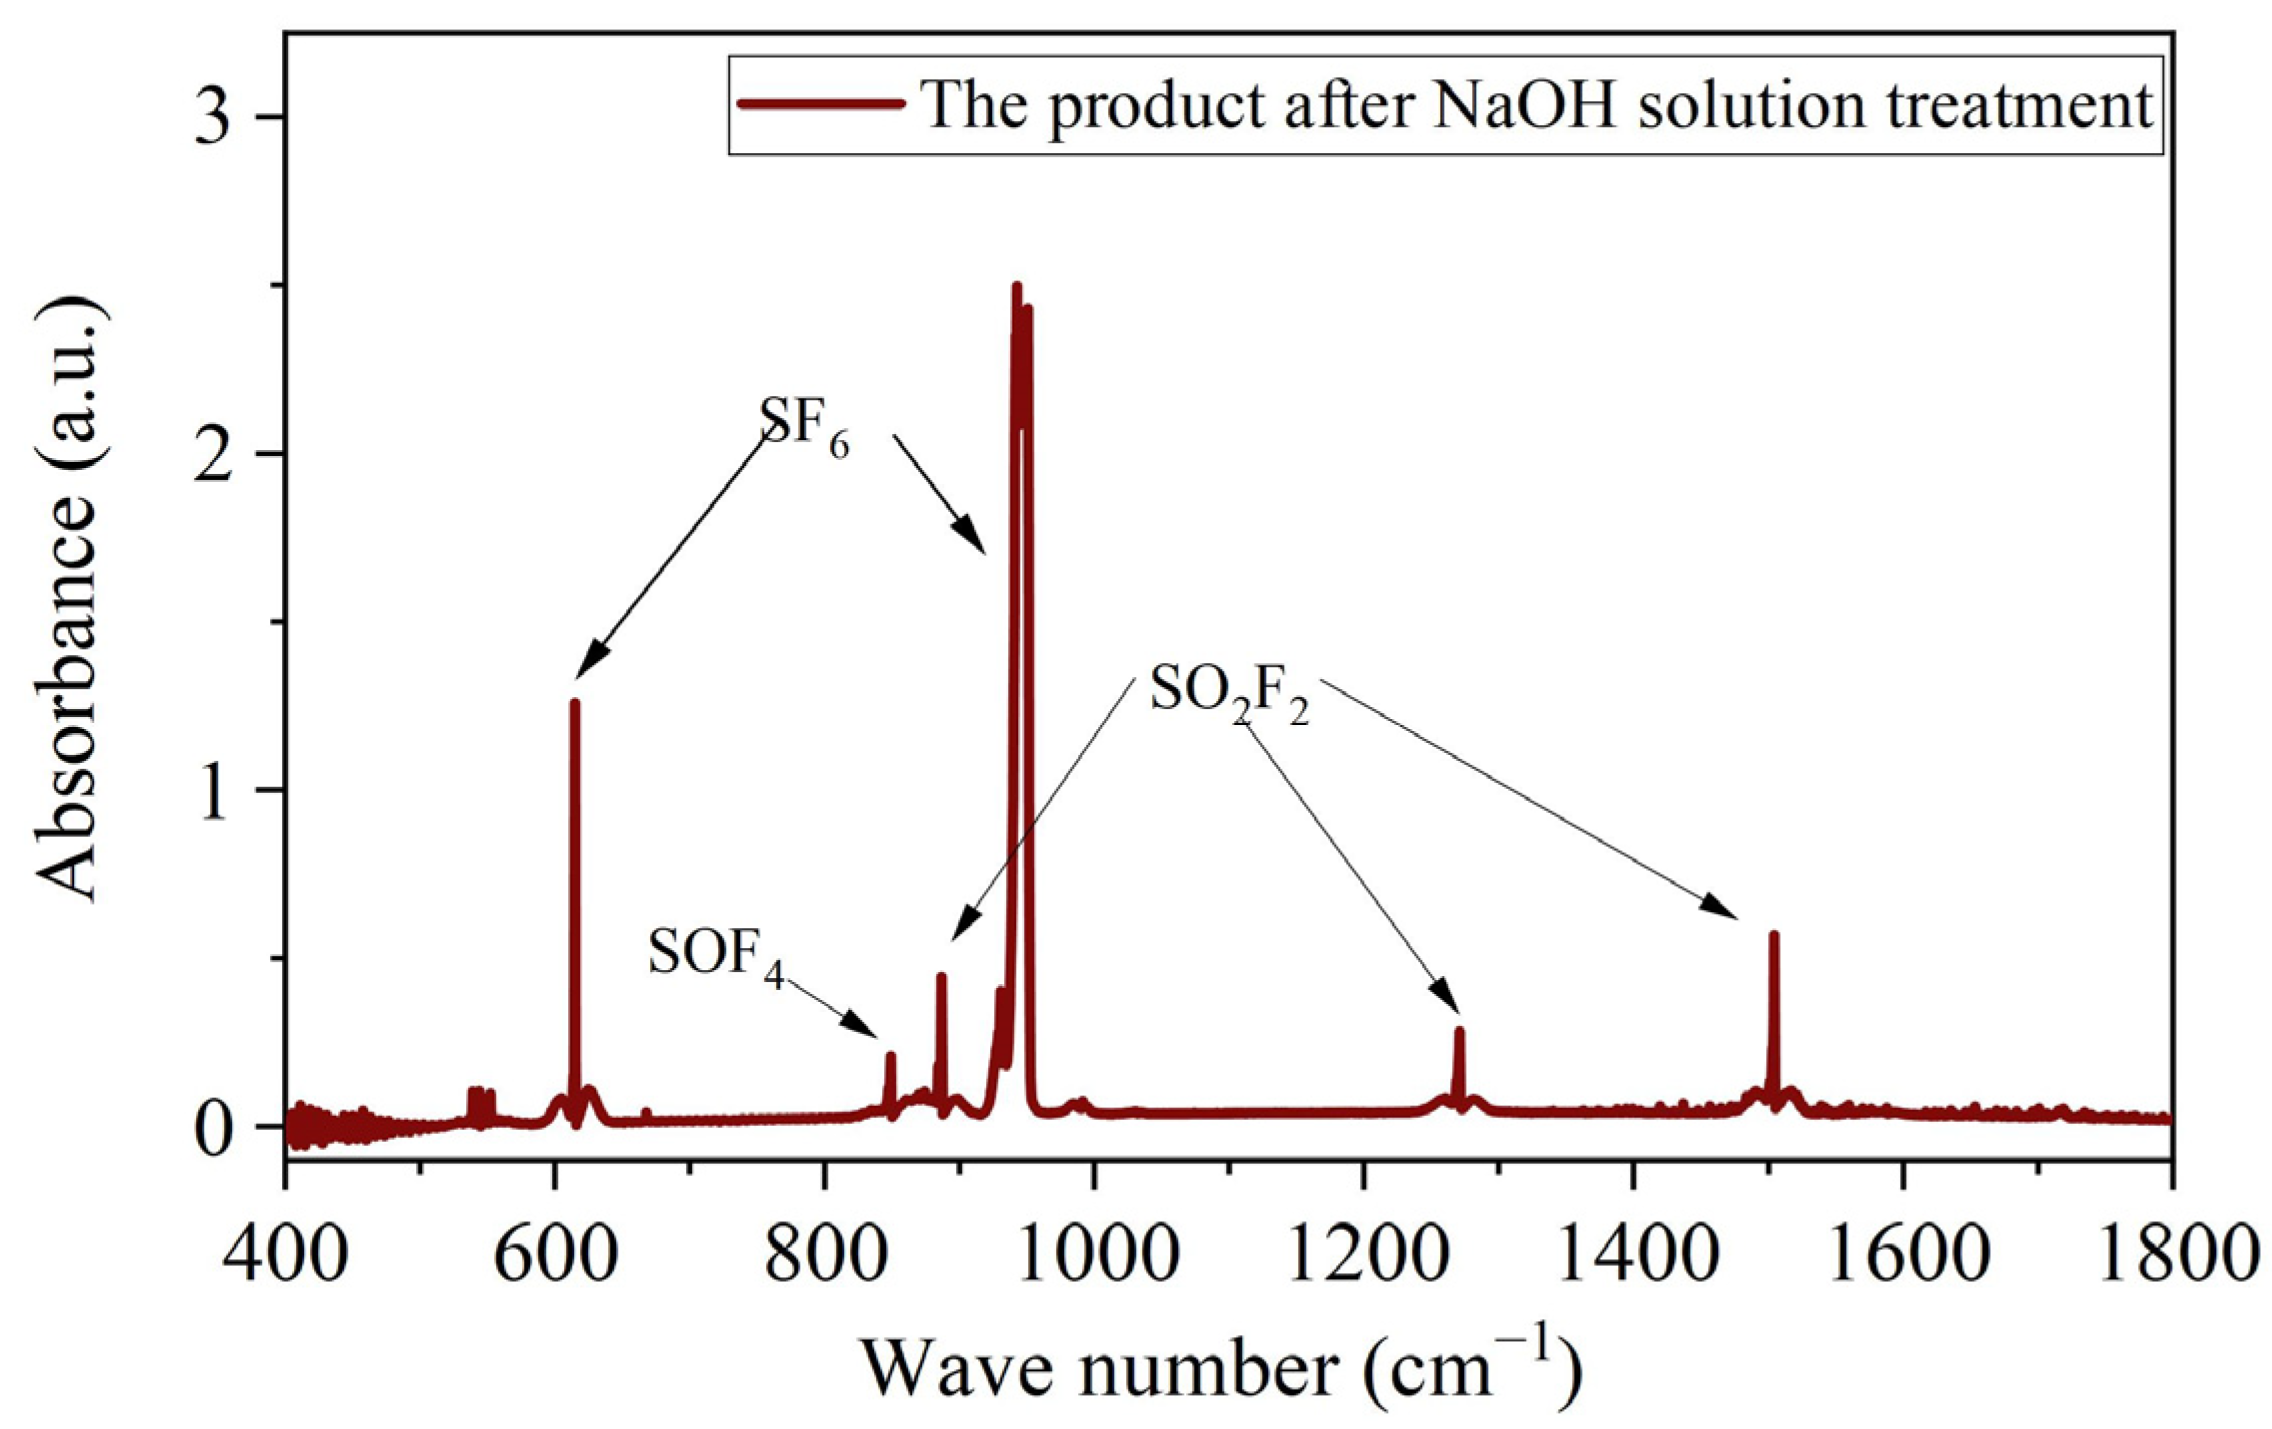
The degradation products of SF6, SOF2, SO2, SO2F2, and SOF4 are all harmful substances. From a safety point of view, it is necessary to minimize the direct emission of harmful products. SOF2 and SO2 can be quickly absorbed by lye, and SOF4 and SO2F2 can also be hydrolyzed and absorbed in a saturated NaOH solution. Therefore, 40% NaOH solution was used to absorb SF6 degradation tail gas. The qualitative analysis of the treated exhaust gas by FTIR detection is shown in Figure 11. It can be seen that most of the degradation products of SF6 are absorbed, and there is a small amount of SOF4 gas and SO2F2 gas in the remaining gas except for some SF6 gas, which is not involved in the reaction.
In order to detect the content of each substance in the SF6 degradation tail gas treated with NaOH solution, the concentrations of SO2, SOF2, SO2F2, and SOF4 were quantitatively detected by GCMS. The results are shown in Figure 12. SO2 and SOF2 were completely treated with the NaOH solution, and the concentrations of SO2F2 and SOF4 were 100.9 and 23.6 ppm, respectively. According to Emission Standards of Pollutants for Inorganic Chemical Industry GB31573-2015 [34], the fluoride emission limit is 6 mg/m3, and the value converted into ppm is 134.4. Therefore, the exhaust gas absorbed by 40% NaOH solution meets the emission standards, thus achieving the purpose of harmless emission.

4. Conclusions

  • The addition of O2 could effectively promote the degradation of SF6. With the increase in the addition of the O2 content, the DRE and EY of SF6 first increased and then decreased. The highest DRE and EY were obtained in the reaction system with 2% SF6 at the input power of 45 W and the gas flow rate of 50 mL/min and in the reaction system with the O2 content of 1%, which were 58.40% and 5.24 g/kWh, respectively.
  • In the SF6/Ar/O2/H2O system, the addition of H2O improved the product selectivity of SO2F2, and the highest SO2F2 selectivity of 48.96% was obtained at an O2 concentration of 1% and a concentration of 8006.76 ppm.
  • The increase in the O2 content led to a decrease in the Ar content, which in turn led to a decrease in the excited-state Ar* content, resulting in a decrease in the degradation rate in this system.
  • The addition of O2 inhibited the generation of SO2, and in the addition of O2, SO2F2 and SOF4 were the main components in the degradation products. In addition, there were SOF2, SO2, SiF4, SF4, and OF2.

Author Contributions

Supervision and data curation, Y.Z.; visualization, M.W. and Y.L.; formal analysis and writing—original draft preparation, L.Y. and Z.Y.; software, K.W. All authors have read and agreed to the published version of the manuscript.

Funding

The work was funded by Guizhou Province (General), Grant/Award Number: QianKeHeZhiCheng [2022] General 207 and China Southern Power Grid Co. (Project No. GZKJXM20220049).

Data Availability Statement

The data presented in this study are available upon request from the corresponding author.

Conflicts of Interest

The authors declare no conflict of interest.

References

  1. Christophorou, L.G.; Olthoff, J.K.; Van Brunt, R.J. Sulfur hexafluoride and the electric power industry. IEEE Electr. Insul. Mag. 1997, 13, 20–24. [Google Scholar] [CrossRef]
  2. Chuah, C.Y.; Lee, Y.; Bae, T. Potential of adsorbents and membranes for SF6 capture and recovery: A review. Chem. Eng. J. 2021, 404, 126577. [Google Scholar] [CrossRef]
  3. Ju, T.; Jianyu, P.; Qiang, Y. Decomposition Characteristic Study of SF6 With Fault Temperature Between 300~400 °C. Proc. CSEE 2013, 33, 202–210. [Google Scholar]
  4. Zhou, S.; Teng, F.; Tong, Q. Mitigating Sulfur Hexafluoride (SF6) Emission from Electrical Equipment in China. Sustainability 2018, 10, 2402. [Google Scholar] [CrossRef]
  5. Cui, H.; Zhang, X.; Zhang, J.; Zhang, Y. Nanomaterials-based gas sensors of SF6 decomposed species for evaluating the operation status of high-voltage insulation devices. High Volt. 2019, 4, 242–258. [Google Scholar] [CrossRef]
  6. Chen, D.; Zhang, X.; Xiong, H.; Li, Y.; Tang, J.; Xiao, S.; Zhang, D. A First-Principles Study of the SF6 Decomposed Products Adsorbed Over Defective WS2 Monolayer as Promising Gas Sensing Device. IEEE Trans. Device Mater. Reliab. 2019, 19, 473–483. [Google Scholar] [CrossRef]
  7. Ma, X.; Li, Y.; Zhong, P.; Wang, W.; Liu, S. Key Issues for Negotiation of Adaptation Committee Under UNFCCC. Res. Prog. Clim. Chang. 2012, 8, 144–149. [Google Scholar]
  8. Li, Y.; Zhang, X.; Fu, M.; Song, X.; Ju, T.; Tian, S. Research and Application Progress of Eco-Friendly Gas Insulating Medium C4F7N, Part I: Insulation and Electrical, Thermal Decomposition Properties. Trans. Chin. Electrotech. Soc. 2021, 36, 3535–3552. [Google Scholar]
  9. Parthiban, A.; Gopal, A.A.R.; Siwayanan, P.; Chew, K.W. Disposal methods, health effects and emission regulations for sulfur hexafluoride and its by-products. J. Hazard. Mater. 2021, 417, 126107. [Google Scholar] [CrossRef]
  10. Zhang, X.; Li, X.; Wang, Y.; Meng, F.; Zou, Y.; Tian, S.; Cui, Z. Experimental Study on Thermal Catalytic Degradation of SF6 Waste Gas by Metal Phosphate. J. Electr. Eng. Technol. 2022, 18, 1251–1262. [Google Scholar] [CrossRef]
  11. Karthikeyan, N.; Nirmal, M.R.; Sathishkumar, G.; Akilan, R. Photodegradation studies of pure and cobalt doped zinc oxide nanoparticles. Mater. Res. Innov. 2023, 27, 69–74. [Google Scholar]
  12. Shao, T.; Yan, P. Atmospheric Pressure Gas Discharge and Its Plasma Applications; Science Press: Alexandria, Australia, 2015. [Google Scholar]
  13. Zhang, H.; Xu, R.; Ananthanarasimhan, J.; Zheng, J.; Wan, J.; Wang, K.; Lan, B.; Yan, J.; Lix, X. Destruction of biomass tar model compound in a rotating gliding arc plasma catalytic system: Contribution of typical transition metals in Ni-based bimetallic catalyst. Fuel 2022, 323, 124385. [Google Scholar] [CrossRef]
  14. Richards, C.; Jans, E.; Gulko, I.; Orr, K.; Adamovich, I.V. N2 vibrational excitation in atmospheric pressure ns pulse and RF plasma jets. Plasma Sources Sci. Technol. 2022, 31, 034001, Erratum in Plasma Sources Sci. Technol. 2022, 31, 079601. [Google Scholar] [CrossRef]
  15. Li, Y.; Yang, Z.; Wang, Y.; Zhang, X.; Wan, K.; Zhang, Y. Experimental study on the Effect of H2 on the Degradation of SF6 by Pulsed Dielectric Barrier Discharge. IEEE Trans. Dielectr. Electr. Insul. 2024, 31, 448–456. [Google Scholar]
  16. Jung, W.; Lee, J.; Ha, K.S. A combined production technology for ethylene and hydrogen with an ethane cracking center and dielectric barrier discharge plasma reactor. Chem. Eng. J. 2023, 462, 142155. [Google Scholar] [CrossRef]
  17. Li, Y.; Wan, K.; Wang, Y.; Zhang, X.; Yang, Z.; Fu, M.; Zhuo, R.; Wang, D. Experimental study on the effect of H2O and O2 on the degradation of SF6 by pulsed dielectric barrier discharge. Plasma Sci. Technol. 2024, 26, 025506. [Google Scholar] [CrossRef]
  18. Hamed, R.; Atamalek, G. Parallel electrodes gliding plasma: Working principles and application in dry reforming of methane. Energy 2021, 230, 120753. [Google Scholar]
  19. Joshi, A.V. Decomposition of SF6–R134a effluents by RF plasma. Nucl. Instrum. Methods Phys. Res. Sect. A Accel. Spectrometers Detect. Assoc. Equip. 2012, 661, S245–S248. [Google Scholar] [CrossRef]
  20. Danhua, M.; Zhi, F.; Tao, S. Recent Progress on Characteristics and Applications of Atmospheric Pressure Low Temperature Plasmas. Proc. CSEE 2020, 40, 1339–1358. [Google Scholar]
  21. Lee, H.M.; Chang, M.B.; Wu, K.Y. Abatement of sulfur hexafluoride emissions from the semiconductor manufacturing process by atmospheric-pressure plasmas. J. Air Waste Manag. Assoc. 2004, 54, 960–970. [Google Scholar] [CrossRef]
  22. Shen, Y.; Huang, L.; Zhang, R. Decomposition of SF6 by dielectric barriers discharge. Environ. Chem. 2007, 26, 275–279. [Google Scholar]
  23. Zhuang, Q.; Clements, B.; McFarlan, A.; Fasoyinu, Y. Decomposition of the most potent greenhouse gas (GHG) sulfur hexafluoride (SF6) using a dielectric barrier discharge (DBD) plasma. Can. J. Chem. Eng. 2014, 92, 32–35. [Google Scholar] [CrossRef]
  24. Xiao, C.; Zhang, X.; Xiao, S.; Hu, X. Experiment of Effects of Ambient Medium on Sulfur Hexafluoride Degradation for a Double Dielectric Barrier Discharge Reactor. Trans. Chin. Electrotech. Soc. 2017, 32, 20–27. [Google Scholar]
  25. Zhang, X.; Hu, X.; Xiao, Q.; Cui, Z. Experimental Study on the Effect of Different Dilution Gases to the Degradation of SF6 Gas by Dielectric Barrier Discharge. Proc. CSEE 2018, 38, 937–946. [Google Scholar]
  26. Wang, X.; Gao, Y.; Zhang, S.; Sun, H.; Li, J.; Shao, T. Nanosecond pulsed plasma assisted dry reforming of CH4: The effect of plasma operating parameters. Appl. Energy 2019, 243, 132–144. [Google Scholar] [CrossRef]
  27. Gao, Y.; Dou, L.; Zhang, S.; Zong, L.; Pan, J.; Hu, X.; Sun, H.; Ostrikov, K.; Shao, T. Coupling bimetallic Ni-Fe catalysts and nanosecond pulsed plasma for synergistic low-temperature CO2 methanation. Chem. Eng. J. 2020, 420, 127693. [Google Scholar] [CrossRef]
  28. Dong, B.; Li, Z.; Wang, P.; Luo, T.; Zou, Y.; Tu, W. 4-Chlorophenol containing wastewater joint treated by pulsed discharge. Chem. Ind. Eng. Prog. 2021, 40, 6721–6728. [Google Scholar]
  29. Zhang, X.; Cui, Z.; Li, Y.; Xiao, H.; Li, Y.; Tang, J.; Xiao, S. Abatement of SF6 in the Presence of NH3 by Dielectric Barrier Discharge Plasma. J. Hazard. Mater. 2018, 360, 341–348. [Google Scholar] [CrossRef] [PubMed]
  30. Dong, X.; Cheng, S.; Yao, J.; Wang, H.; Chen, S.; Xiong, L.; Zhang, G.; Zhou, C.; Zhang, X. Experimental Study on H2O Concentration on Degradation Effect of SF6 by Packed-bed Reactor. High Volt. Appar. 2021, 57, 172–179. [Google Scholar]
  31. Zhang, X.; Cui, Z.; Li, Y.; Xiao, H.; Li, Y.; Tang, J. Study on Degradation of SF6 in the Presence of H2O and O2 Using Dielectric Barrier Discharge. IEEE Access 2018, 6, 72748–72756. [Google Scholar]
  32. Zhang, Y.; Li, Y.; Cui, Z.; Xiao, H.; Zhang, X. Experiment of Effect of H2O and O2 on Degradation of High Concentration SF6 by Dielectric Barrier Discharge. High Volt. Eng. 2019, 45, 512–517. [Google Scholar]
  33. Cui, Z.; Hao, Y.; Yang, L.; Li, L.; Wang, Y.; Zhou, C.; Zhang, X. Review on Harmless Abatement of SF6 Waste Gas. Proc. CSEE 2023, 43, 7720–7737. [Google Scholar]
  34. GB 31573-2015; Emission Standards of Pollutants for Inorganic Chemical Industry. Ministry of Ecology and Environment of People’s Republic of China: Beijing, China, 2015.
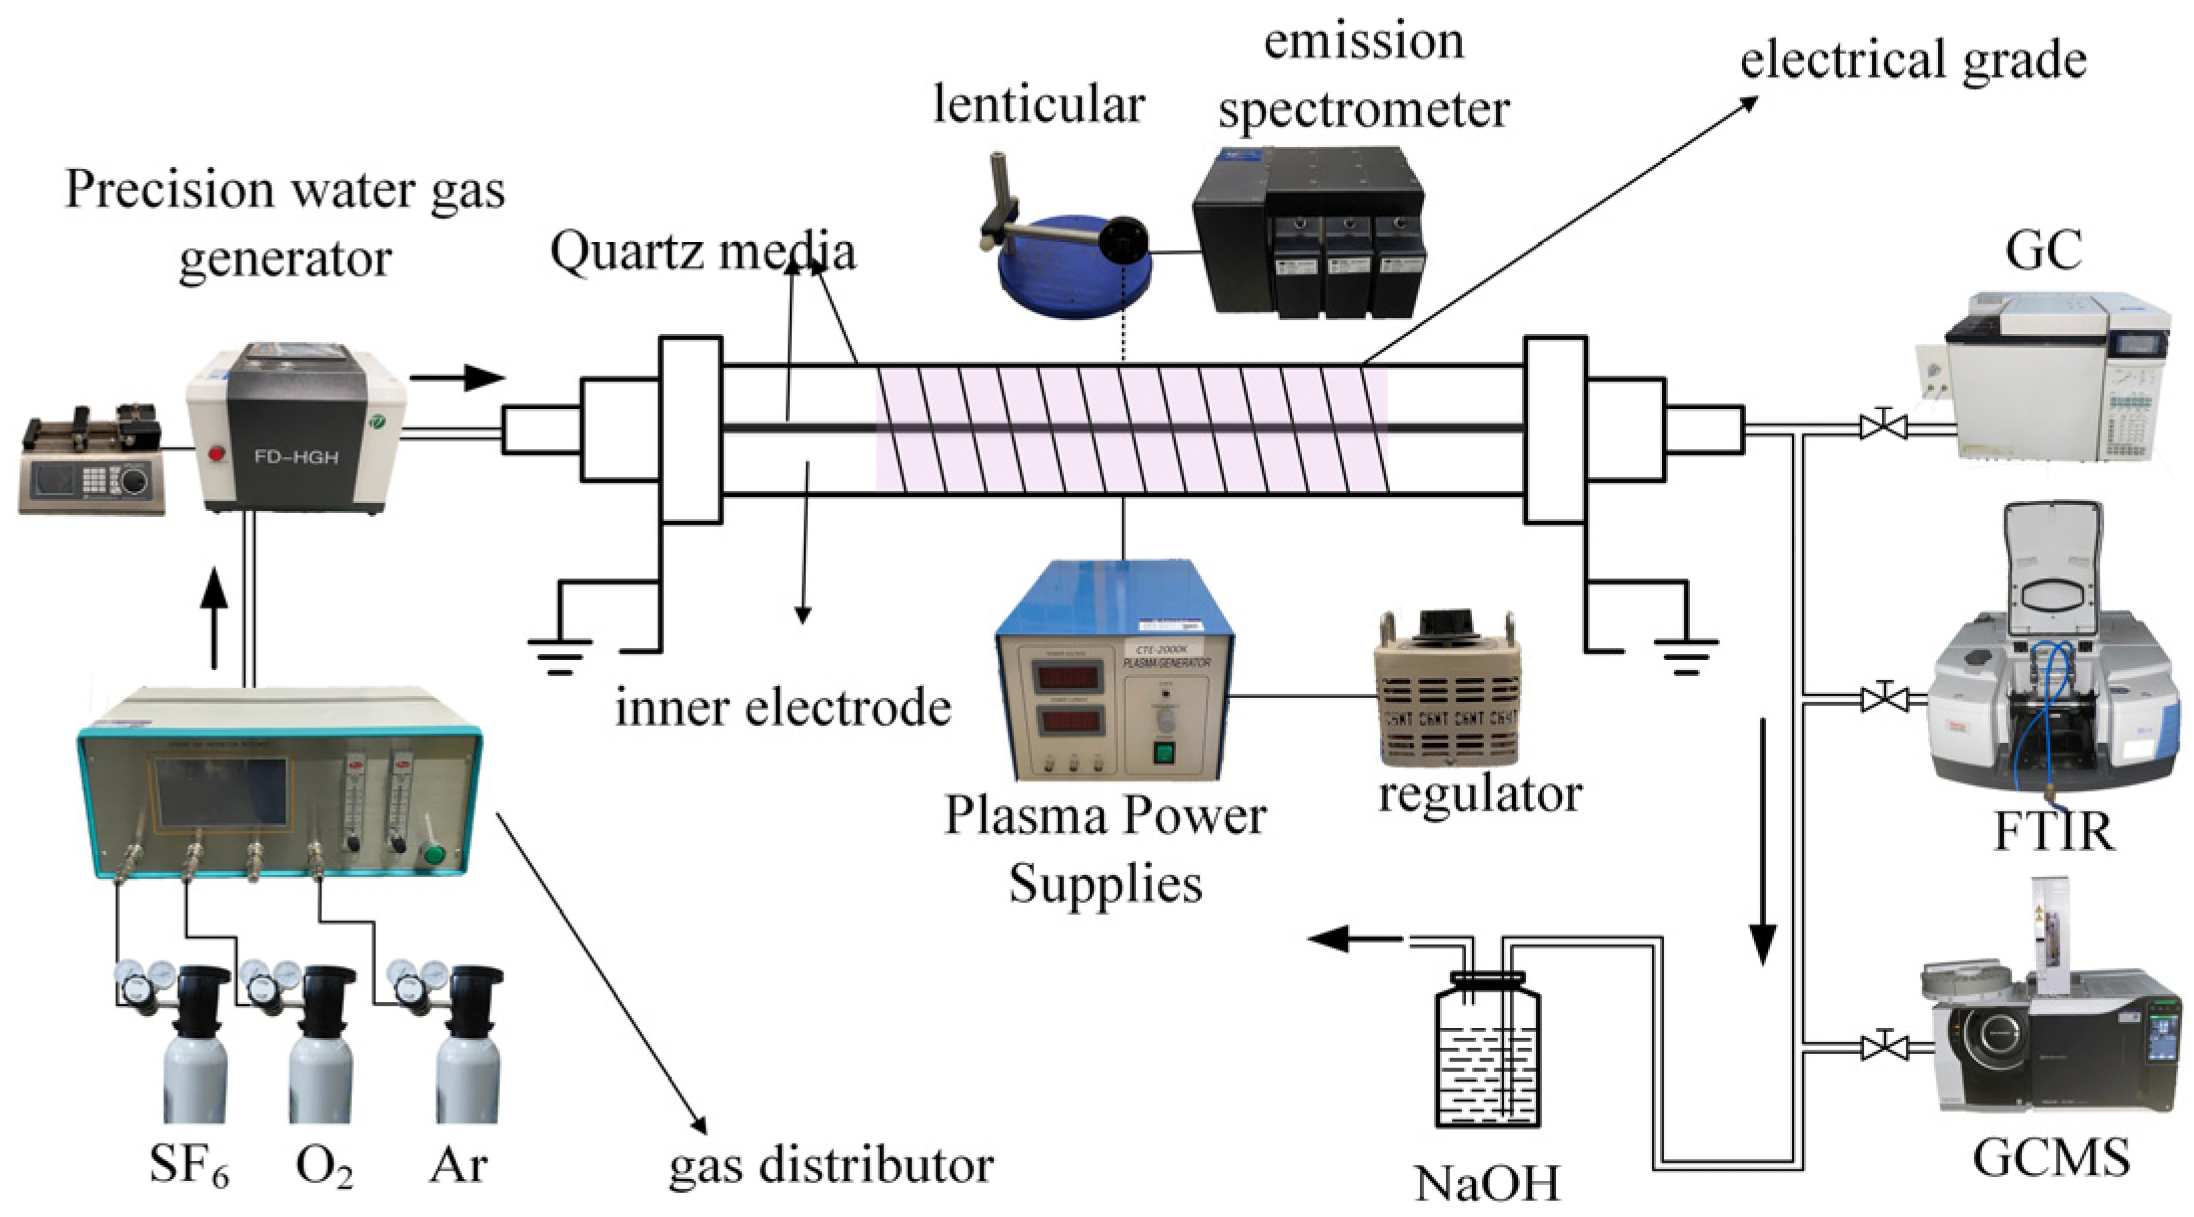
Figure 1. Experimental platform.
Energies 17 03648 g001
Figure 2. The DRE and EY of SF6 under different O2 concentrations.
Energies 17 03648 g002
Figure 3. Emission spectrum at an O2 concentration of 1%.
Energies 17 03648 g003
Figure 4. The relative intensity of Ar lines at different O2 concentrations.
Energies 17 03648 g004
Figure 5. FTIR pattern without added O2 degradation products.
Energies 17 03648 g005
Figure 6. FTIR pattern of degradation products of 1% O2 system.
Energies 17 03648 g006
Figure 7. FTIR pattern of degradation products of 1% O2/0.5% H2O system.
Energies 17 03648 g007
Figure 8. Selectivity of SF6 degradation products at different O2 concentrations.
Energies 17 03648 g008
Figure 9. Selectivity of degradation products at different O2 concentrations at 0.5% H2O.
Energies 17 03648 g009
Figure 10. SF6 decomposition path.
Energies 17 03648 g010
Figure 11. FTIR pattern of the product after treatment with NaOH solution.
Energies 17 03648 g011
Figure 12. The content of each substance in SF6 degradation tail gas treated with NaOH solution.
Energies 17 03648 g012
Table 1. Formation reactions of the products and their reaction heat with O2.
NO.ReactionReaction Heat (kcal/mol)
(11) SF 5 + O SOF 4 + F −177.94
(12) SF 4 + O SOF 4 −529.82
(13) SF 3 + O SOF 2 + F −324.56
(14) SF 2 + O SOF 2 −547.64
(15) SOF 4 + O SO 2 F 2 + 2 F −365.64
(16) SOF 2 + O SO 2 F 2 −246.46
(17) SOF 2 + O SO 2 2 F −285.89
Table 2. Comparison of degradation performance of main methods.
Degradation MethodDegradation RateEnergy EfficiencyProduct Regulation
Thermal DegradationHighLowConverts to salts when reacting with corrosive materials
Thermal CatalysisModerateModerateGenerates toxic gases such as SO2 and SO3
PhotocatalysisLow-Produces harmless substances
DBD PlasmaHighHighProduces toxic substances such as SO2F2
Electrochemical DegradationExtremely Low-Produces harmless substances
Disclaimer/Publisher’s Note: The statements, opinions and data contained in all publications are solely those of the individual author(s) and contributor(s) and not of MDPI and/or the editor(s). MDPI and/or the editor(s) disclaim responsibility for any injury to people or property resulting from any ideas, methods, instructions or products referred to in the content.