Article

Ambient Temperature Effects on Energy Consumption and CO2 Emissions of a Plug-in Hybrid Electric Vehicle

Department of Mechanical Engineering, University of Alberta, Edmonton, AB T6G 2R3, Canada
*
Author to whom correspondence should be addressed.
These authors contributed equally to this work.
Energies 2024, 17(14), 3566; https://doi.org/10.3390/en17143566
Submission received: 31 May 2024 / Revised: 15 July 2024 / Accepted: 17 July 2024 / Published: 20 July 2024
(This article belongs to the Section E: Electric Vehicles)

Highlights

What are the main findings?
  • The effect of ambient temperature is more pronounced in powertrain modes with higher levels of electrification. While decreasing the ambient temperature from approximately 30 °C to −23 °C does not significantly affect the energy consumption in the internal combustion engine mode, it increases energy consumption in the charge depleting mode by 350%.
  • At an ambient temperature of approximately −23 °C, total CO2 emissions increase across all powertrain modes, factoring in the CO2 intensity of the Alberta power grid. The most significant effect is seen in charge depleting modes, with emissions rising by up to 290%, while the internal combustion engine mode shows a more modest increase of 8%.
What is the implication of the main finding?
  • The study emphasizes that, in cold climates, the advantages of using electrified powertrains for reducing CO2 emissions must be evaluated based on ambient temperature and the CO2 intensity of the power grid used to charge the battery.
  • Regions with low CO2 intensity in the power grid, moderate climates, and short travel distances are ideal for the use of electric and plug-in hybrid electric vehicles.

Abstract

:
The ambient temperature affects the operation of different powertrain systems, including electric, hybrid electric, and internal combustion engines. This study investigated the effect of the ambient temperature on the energy consumption and CO2 emissions of a plug-in hybrid electric vehicle running in different powertrain modes. The vehicle was driven for 4150 km following a selected route 199 times in different powertrain modes and in different ambient temperatures ranging from −24 °C to 32 °C. Instantaneous and cumulative fuel consumptions were measured using a fuel flow meter, and the battery energy usage was determined from the vehicle telematics during each test. The total energy consumption and total CO2 emissions were affected by the ambient temperature in all powertrain modes, including electric, hybrid electric (charge-depleting and charge-sustaining), and conventional internal combustion engine modes. The highest increase was associated with the charge-depleting hybrid electric mode, with 350% and 290% increases in energy consumption and CO2 emissions when the ambient temperature dropped from 29 °C to −24 °C. The conventional internal combustion engine mode was the least affected, with only 7% and 8% increased in energy consumption and CO2 emissions, respectively.

1. Introduction

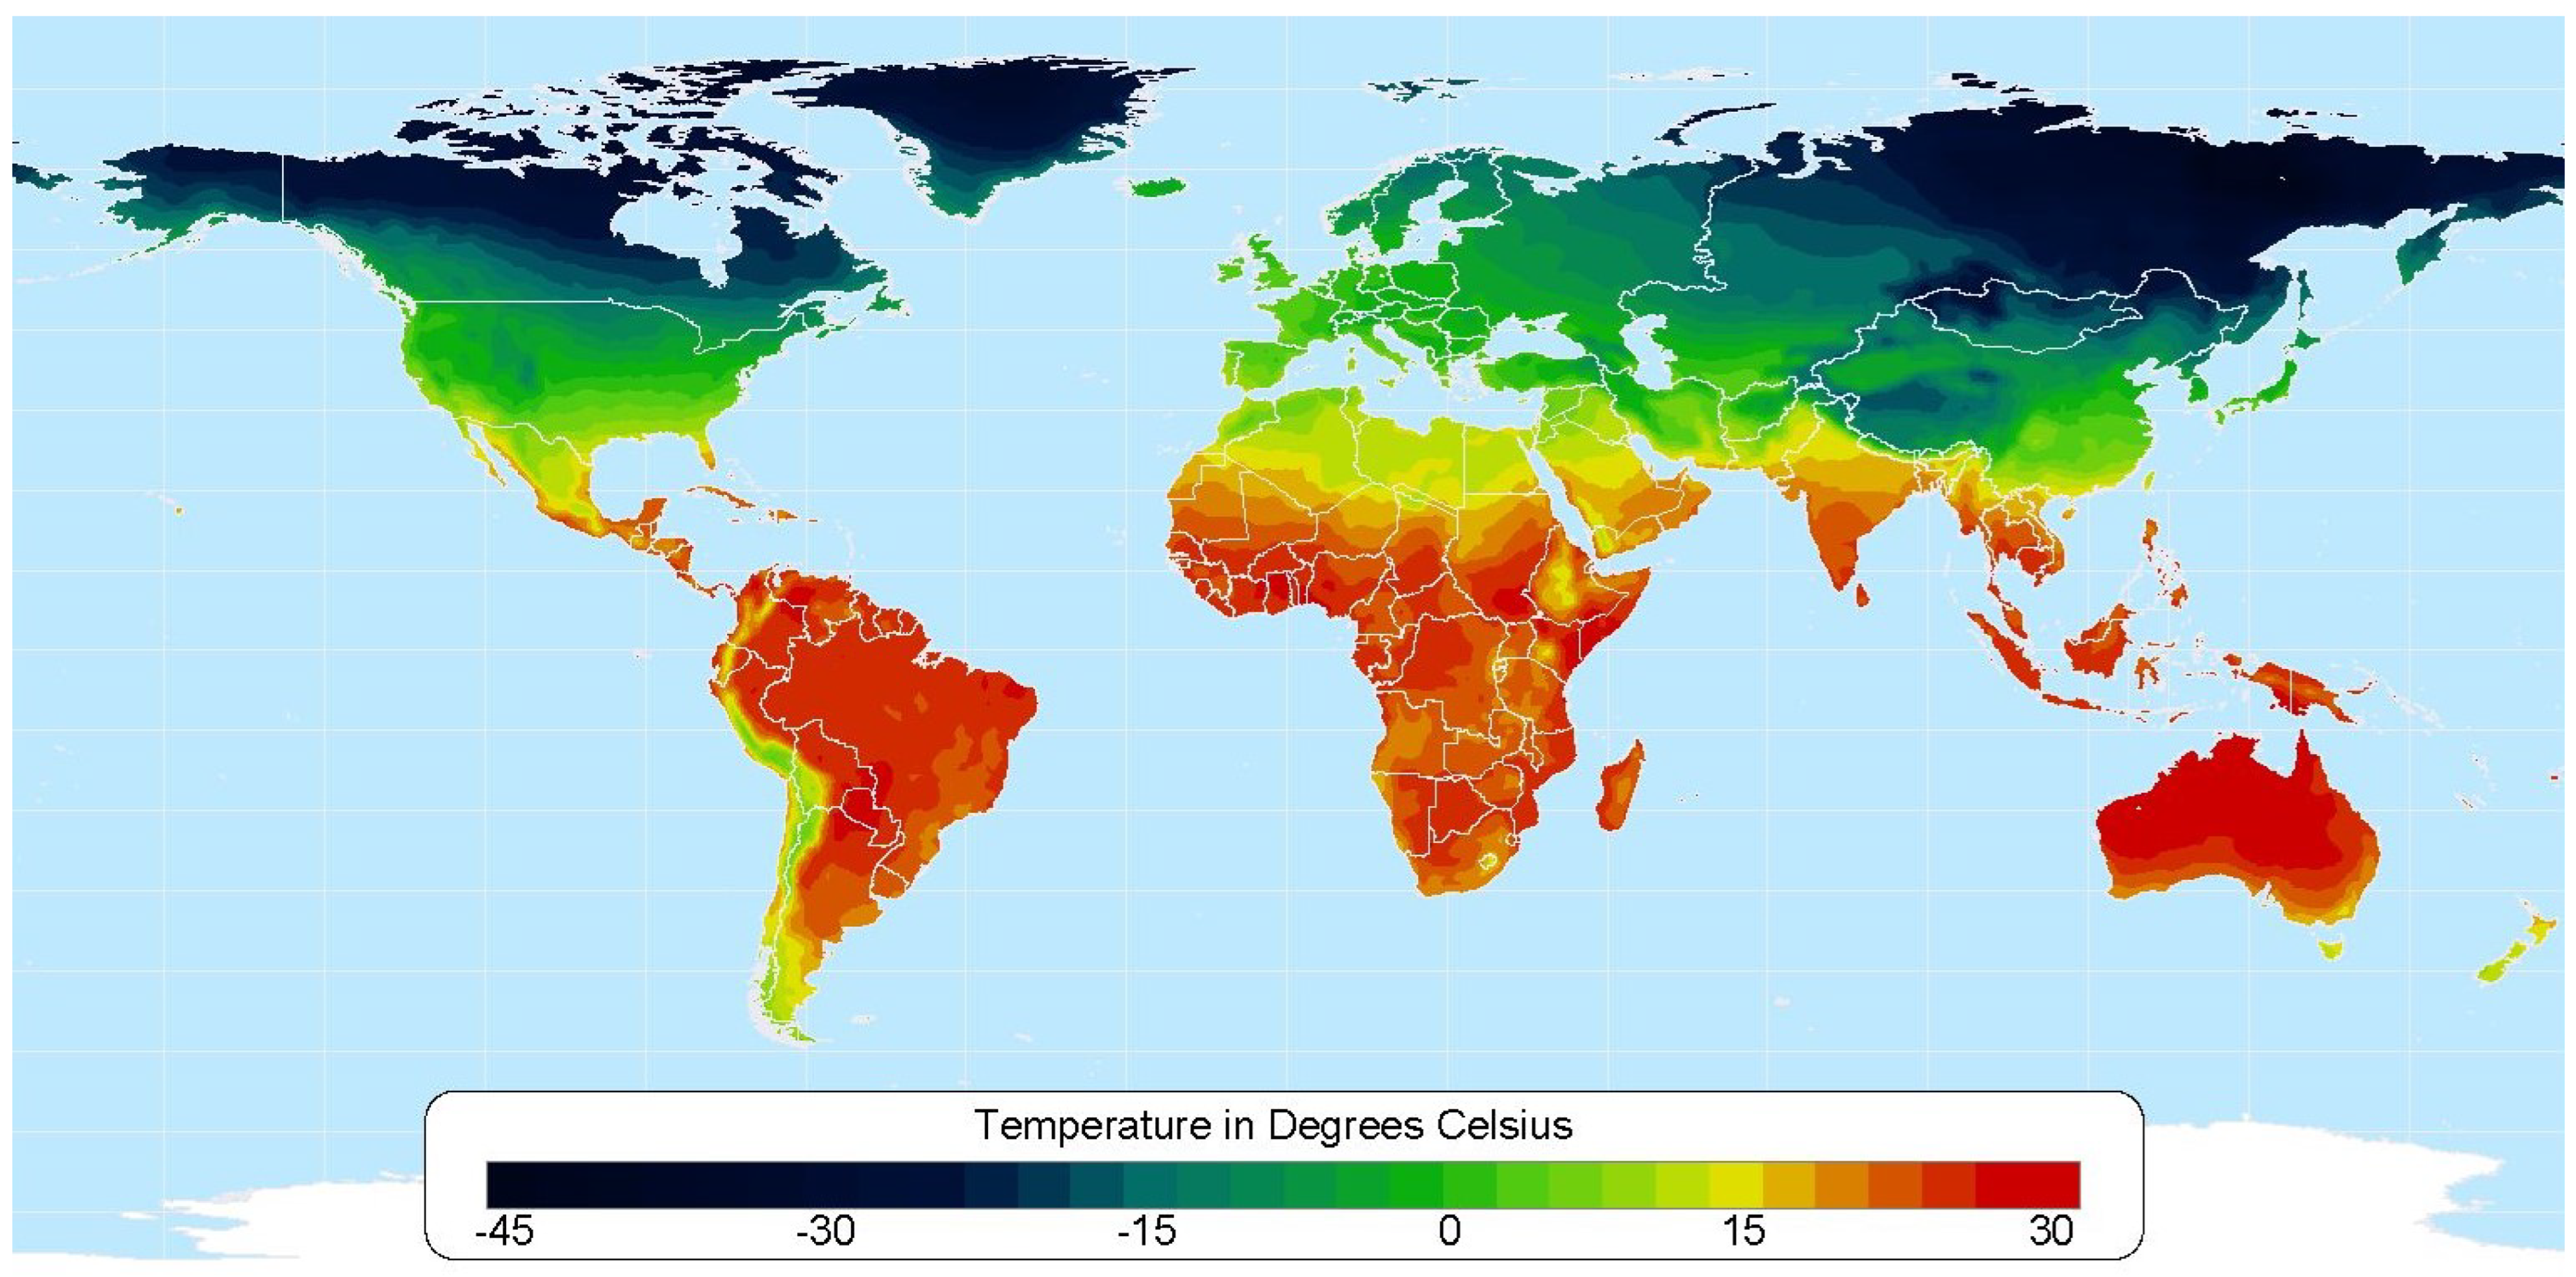
Vehicle powertrain technology is shifting towards electric and hybrid electric vehicles (EVs and HEVs) for light-duty applications [1,2]. However, the energy consumption and CO2 emission reduction of EVs and HEVs in extremely cold climates are understudied. Figure 1 indicates the global average temperature during winter in the Northern Hemisphere, showing a considerable part of the world with a substantial population experiencing temperatures below −7 °C during winter. In North America, the Federal Test Procedure (FTP) is used for the emission certification and fuel economy testing of light-duty vehicles. The coldest temperature covered in the cold phase of the FTP is 20 °F (−6.7 °C). This is the same as the European Real Driving Emission (RDE) test, in which the coldest ambient temperature (Tamb) covered is −7 °C [3]. This study goes further and reports the energy consumption and CO2 emission results of a plug-in hybrid electric vehicle (PHEV) in a Tamb as low as −24 °C.
Battery electric vehicles (BEVs) are suitable options to reduce combustion-generated air pollutant emissions from transportation fleets. With recent advances in renewable energy production, BEVs can be effective in lowering CO2 emissions [4]. The effectiveness of electric powertrains in reducing CO2 emissions depends on how the electric energy is produced at the source and how the vehicle performs in real-world conditions. If the power source is carbon intensive, shifting toward an electric powertrain may not necessarily translate to a substantial reduction in CO2 emissions [5]. The reduction in CO2 emissions of EVs varies geographically due to significant differences in the carbon intensity of electricity production in different world regions [6,7]. In Alberta, Canada, only 23% of electricity is provided by renewable and zero-carbon sources of energy [8], so the benefits of electric powertrains compared to internal combustion engines (ICEs) should be carefully studied. This is of particular interest in this region, where there are climate conditions with extreme winter seasons and high carbon-intensity electric power grid.
A PHEV with the capability of using different powertrain modes (ICE, EV, and HEV) is a suitable vehicle platform to study and compare the energy consumption and CO2 emissions of different powertrains running under real-world driving conditions at different ambient temperatures. Thus, this study centers on a PHEV platform.
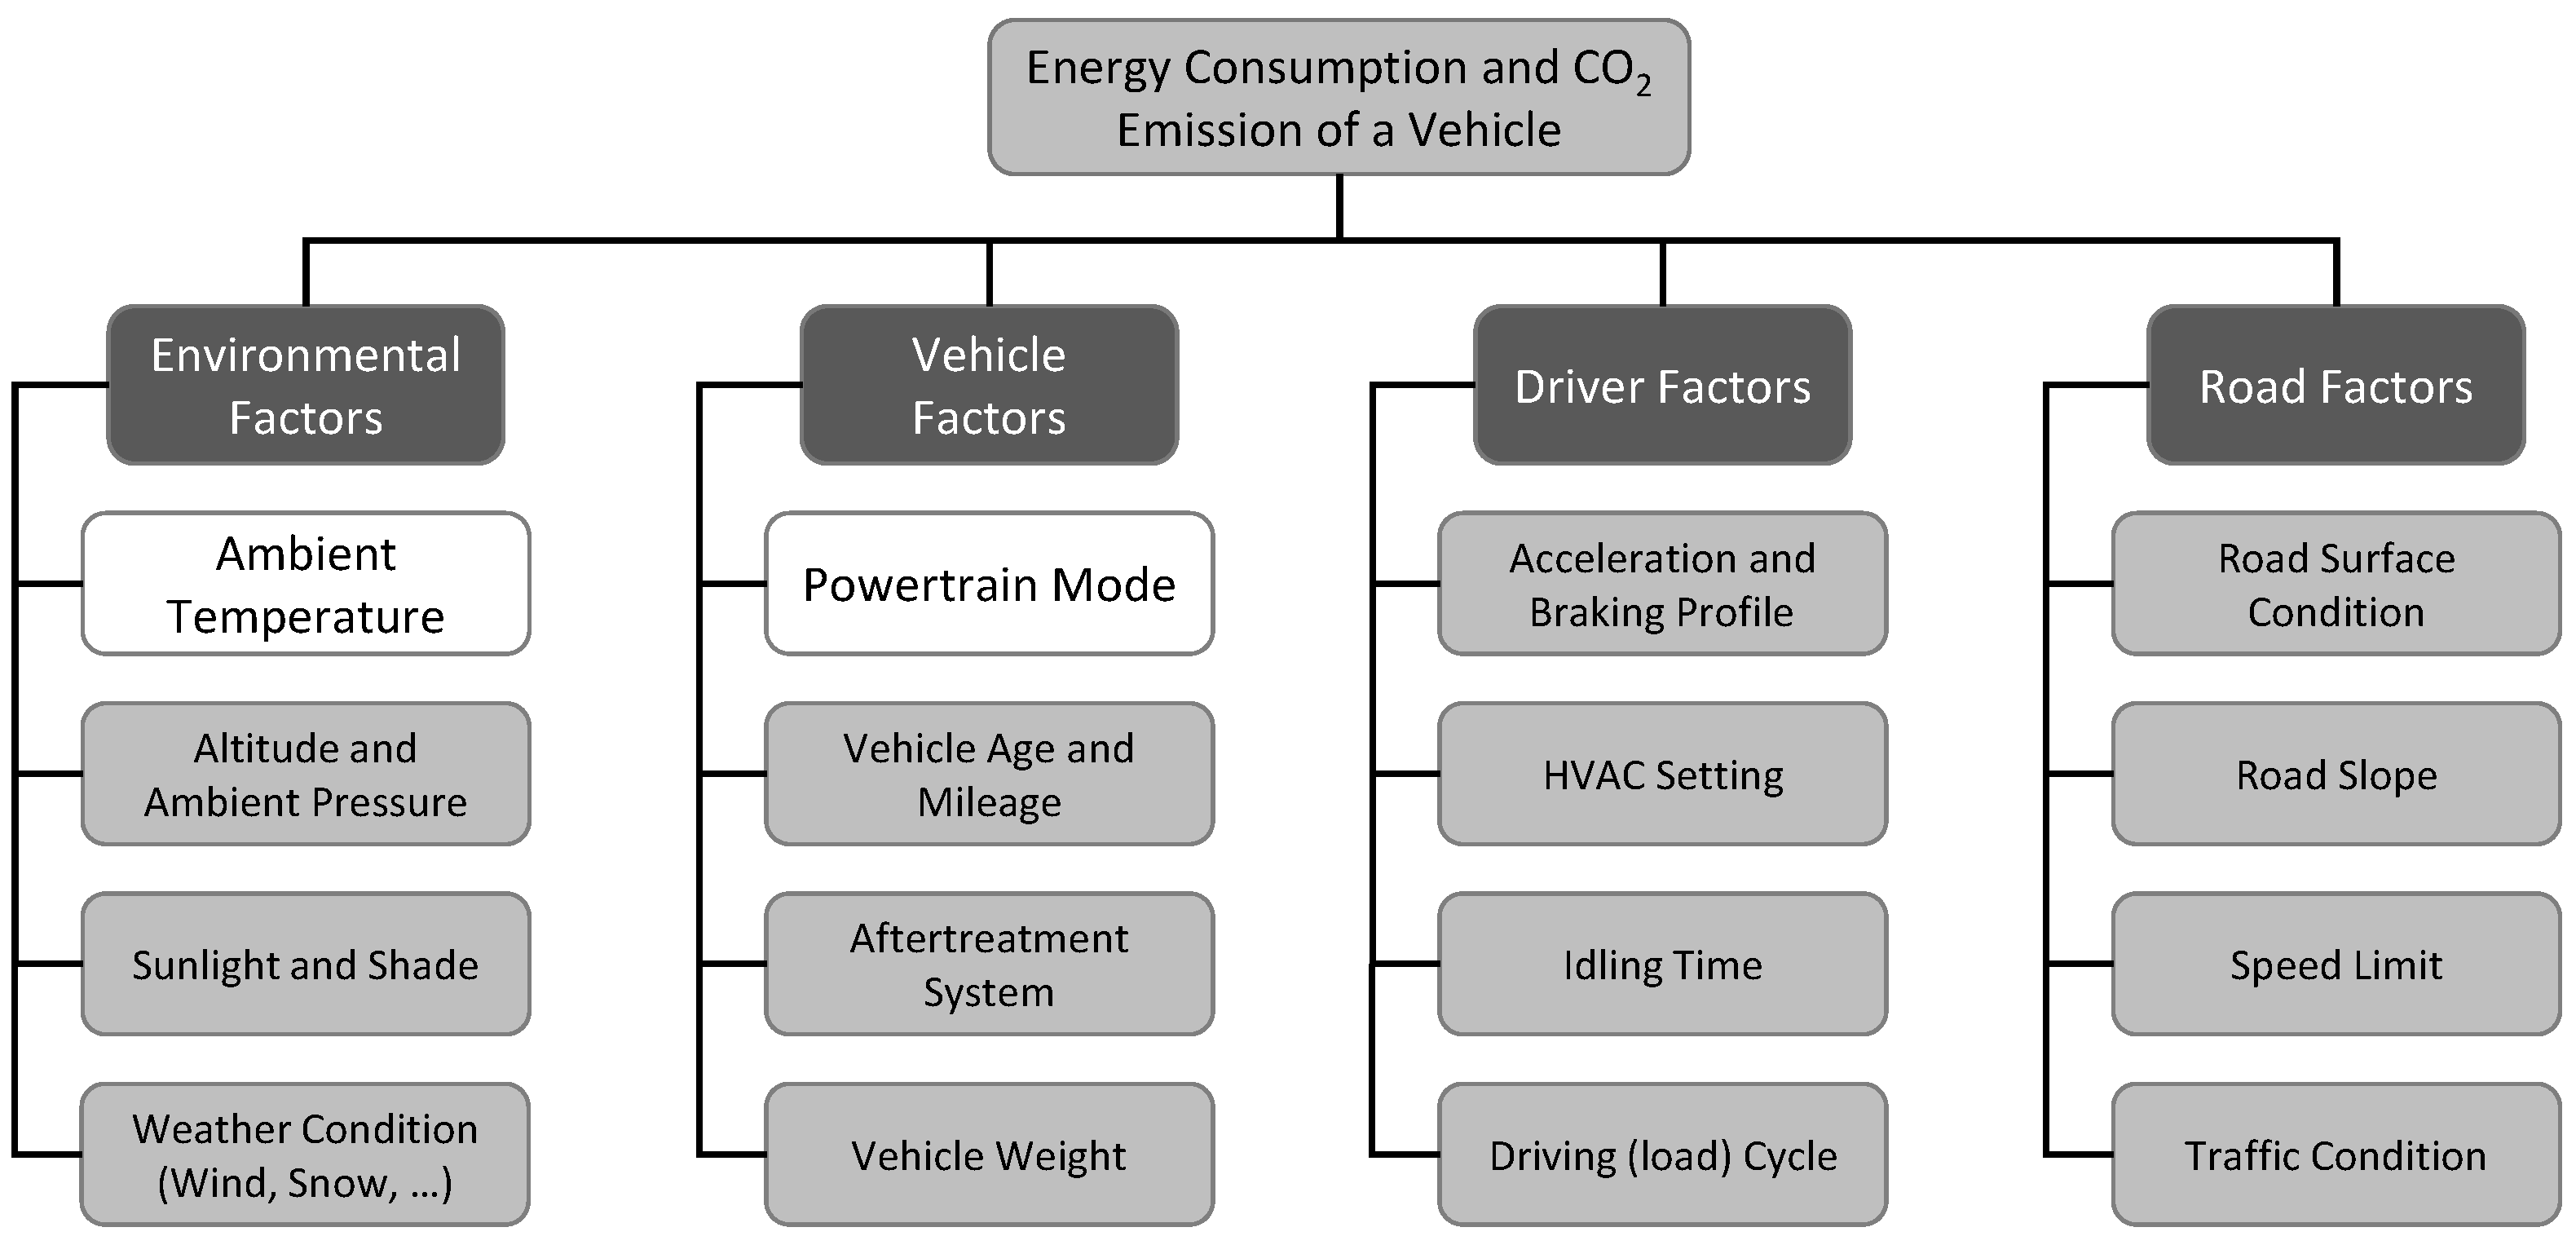
Figure 2 shows the main factors affecting vehicular energy consumption and CO2 emissions in real-driving conditions. The powertrain mode and Tamb are two of the main factors focused on in this study.
Generally, the energy consumption and emissions of road vehicles in all powertrain modes increase in a lower Tamb (i.e., Tamb < 10 °C) [3]. For ICEs, low ambient temperatures elevate cold start emissions and fuel consumption penalties due to the engine and aftertreatment systems operating below their optimal warmed-up conditions [9]. In all powertrain modes, the increase in energy consumption ranged from 20% to 100% in previous studies compared to normal operating temperatures (i.e., 20 °C < Tamb < 25 °C) [3]. In EVs, a large portion of this increase is due to cabin heating in cold climates [3,10]. In ICE vehicles, the waste heat from the combustion engine is usually used to provide cabin heating; thus, EVs are more affected by energy consumption increase in cold climates [11,12,13]. An optimal thermal management system is essential to increase the energy conversion efficiency by maintaining the vehicle cabin and components at an optimum temperature to avoid overheating and overcooling [10,14].
An overview of previous related studies is presented in Table 1. Here, a brief review of these previous studies is provided. A real-driving test of a PHEV on three different urban, rural, and freeway routes showed that the initial battery state of charge (SOC) could change tailpipe CO2 emissions and fuel consumption by up to 40%. The powertrain mode selection of the vehicle between charge-depleting (or EV) and charge-sustaining (or HEV) is based on the SOC [15]. In another real-driving PHEV study [16], the distance-specific energy consumption of the charge-depleting mode, compared with the charge-sustaining mode, was found to be 45% lower. However, the CO2 emission was 50% higher due to the electricity generation carbon intensity. Another PHEV, a 2013 Toyota Prius, was driven on different routes to assess the energy consumption and emissions in different powertrain modes. The results show that, based on the electricity generation efficiency and transmission loss, the PHEV operating in charge-depleting mode was found to be less energy efficient than in charge-sustaining mode considering the gasoline equivalent energy use. However, the charge-depleting mode was more energy efficient compared to a comparably sized conventional light-duty gasoline vehicle [17].
Among driving behavior and trip condition factors, the Tamb had the biggest influence on the specific energy consumption of an EV in real-world driving data, causing it to double as the temperature dropped from 20 °C to 0 °C [18]. Testing a Chevrolet Volt PHEV in different Tamb showed the high dependency of energy consumption on the Tamb in urban and highway driving conditions. The least energy was consumed during the operation at 20 °C to 25 °C. In charge-sustaining mode in extreme winter temperatures (−25 °C), it consumed 20–30% more fuel than at 22 °C. In charge-depleting mode, at around 0 °C, the vehicle electricity consumption increased by 50% and 100% for highway and city driving, respectively [19]. In another study on a Chevrolet Volt PHEV in an Tamb range from −26 °C to 25 °C in Winnipeg, Canada, it was shown that the electric travel range was half of the baseline condition in temperatures below −4 °C, and the engine was turned on more frequently as the temperature dropped [20]. For BEVs, tests on a Nissan Leaf and a Mitsubishi i-MiEV in the same Tamb range from −25 °C to 25 °C in Winnipeg, Canada, revealed that at −15 °C and below, the travel range was approximately one-third of the range at normal temperatures (i.e., 25 °C) [21]. A PHEV and a range-extended battery electric vehicle (BEVX) were examined for their all-electric range in cold temperatures. The PHEV’s range decreased from 20.1 km at 23 °C to 15.5 km at −7 °C. For the BEVX, the reduction was from 123.9 km to 73.5 km (a 40% drop) [22]. A group of vehicles with different powertrain systems, such as conventional, hybrid electric, plug-in hybrid electric, and battery electric vehicles, were investigated for fuel and energy consumption. The test temperatures were −6.7 °C, 22 °C, and 35 °C with 850 W/m2 of emulated radiant solar energy, and the tests were on the Urban Dynamometer Driving Schedule (UDDS), Highway Fuel Economy Test (HWFET), and Supplemental Federal Test Procedures (SFTP) drive cycles, maintaining the cabin temperature at 22 °C during warm and cold temperatures. For the PHEV, the maximum increase in energy consumption was in the cold start UDDS test at −6.7 °C relative to 22 °C, with a 60% increase in charge-sustaining and a 100% increase in charge-depleting modes [23].
The existing body of research lacks a comprehensive analysis of energy consumption and CO2 emissions for PHEVs across all four possible powertrain modes: pure electric, charge-depleting hybrid electric, charge-sustaining hybrid electric, and ICE. This gap is particularly pronounced in studies considering a wide range of ambient temperatures, especially under extremely cold conditions. Furthermore, there is a notable absence of research on the cold start and warm-up periods for different powertrain modes of PHEVs and their subsequent effect on energy consumption and CO2 emissions. Additionally, previous studies often overlooked the actual measurement of fuel consumption from PHEVs. This paper aims to address these research gaps through the following contributions:
  • Real-world data collection and an analysis of the effect of Tamb on the energy consumption and CO2 emissions of a PHEV for urban and highway conditions for a Tamb ranging from −24 °C to 32 °C;
  • A study of the cold start and warm-up period of an electrified vehicle, considering the exhaust aftertreatment temperature and coolant temperature;
  • The measurement and analysis of the vehicle’s actual fuel and energy consumption in different powertrain modes for over 4000 km of vehicle operation.
Through these contributions, this research provides a comprehensive understanding of the performance variations in different powertrain modes under a wide range of ambient temperatures, particularly at extremely low temperatures. It also clarifies and quantifies the effects and significance of cold starts in these conditions. The study enables comparisons of different powertrain modes with varying levels of electrification in terms of their energy consumption and CO2 emissions under real-driving conditions. The findings are particularly relevant for cold climate regions with a high CO2 intensity in electricity generation, underscoring the importance of advancing renewable and low-carbon electricity generation to complement vehicle electrification efforts.
This paper is organized as follows: Section 2 explains the research methodology and the experimental setup. Next, Tamb coverage, cold phase operation, energy consumption, and CO2 emissions are described in Section 3. Section 4 presents the summary and key conclusions from this paper.

2. Methodology

2.1. Tested Vehicle

A Ford Escape PHEV MY2021 (Figure 3) was selected from the University of Alberta fleet vehicles for this study. This vehicle was selected since it provided the possibility to assess energy consumption under (i) pure electric, (ii) hybrid electric, and (iii) pure combustion engine operations using the same vehicle platform. The vehicle is powered by a 123 kW ICE, and a total power (ICE and electric motor) of 149 kW is delivered by the powertrain. The vehicle is equipped with a 14.4 kWh lithium-ion battery. According to the U.S. Environmental Protection Agency (EPA) data, based on 45% highway and 55% city driving, the energy consumption of the Ford Escape PHEV is 19.9 kWh/100 km [24]. The claimed all-electric range of the vehicle based on the EPA data is 61 km in the Tamb range from 20 °C to 30 °C [25]. The specifications of the test vehicle are shown in Table 2.
The vehicle powertrain system has four different modes to allow the driver to choose the electrification level. “EV Now” mode provides a pure electric experience in which the battery and electric motor power the vehicle. “Auto EV” mode is the default powertrain mode of the vehicle, which provides an automatic use of battery power during the drive, staying in electric mode when possible, and running the engine when more power is needed. The EV Now and Auto EV modes are considered charge-depleting powertrain modes of the vehicle. The third mode is “EV Later”, which is basically the charge-sustaining powertrain mode of the vehicle, maintaining the battery SOC on the current value for later use in Auto EV or EV Now modes. Finally, the “EV Charge” mode includes the vehicle operation when the ICE is always running to power the vehicle while charging the battery simultaneously.
The Ford Escape PHEV is equipped with regenerative braking, which converts kinetic energy into electric energy and stores it in the 14.4 kWh battery during braking or coasting. The vehicle maintained the same set of tires throughout the testing period, and routine maintenance, such as engine oil changes, wheel alignments, fluid checks, brake inspections, and battery inspections, was performed according to the manufacturer’s guidelines.

2.2. Electric Energy Consumption Measurement

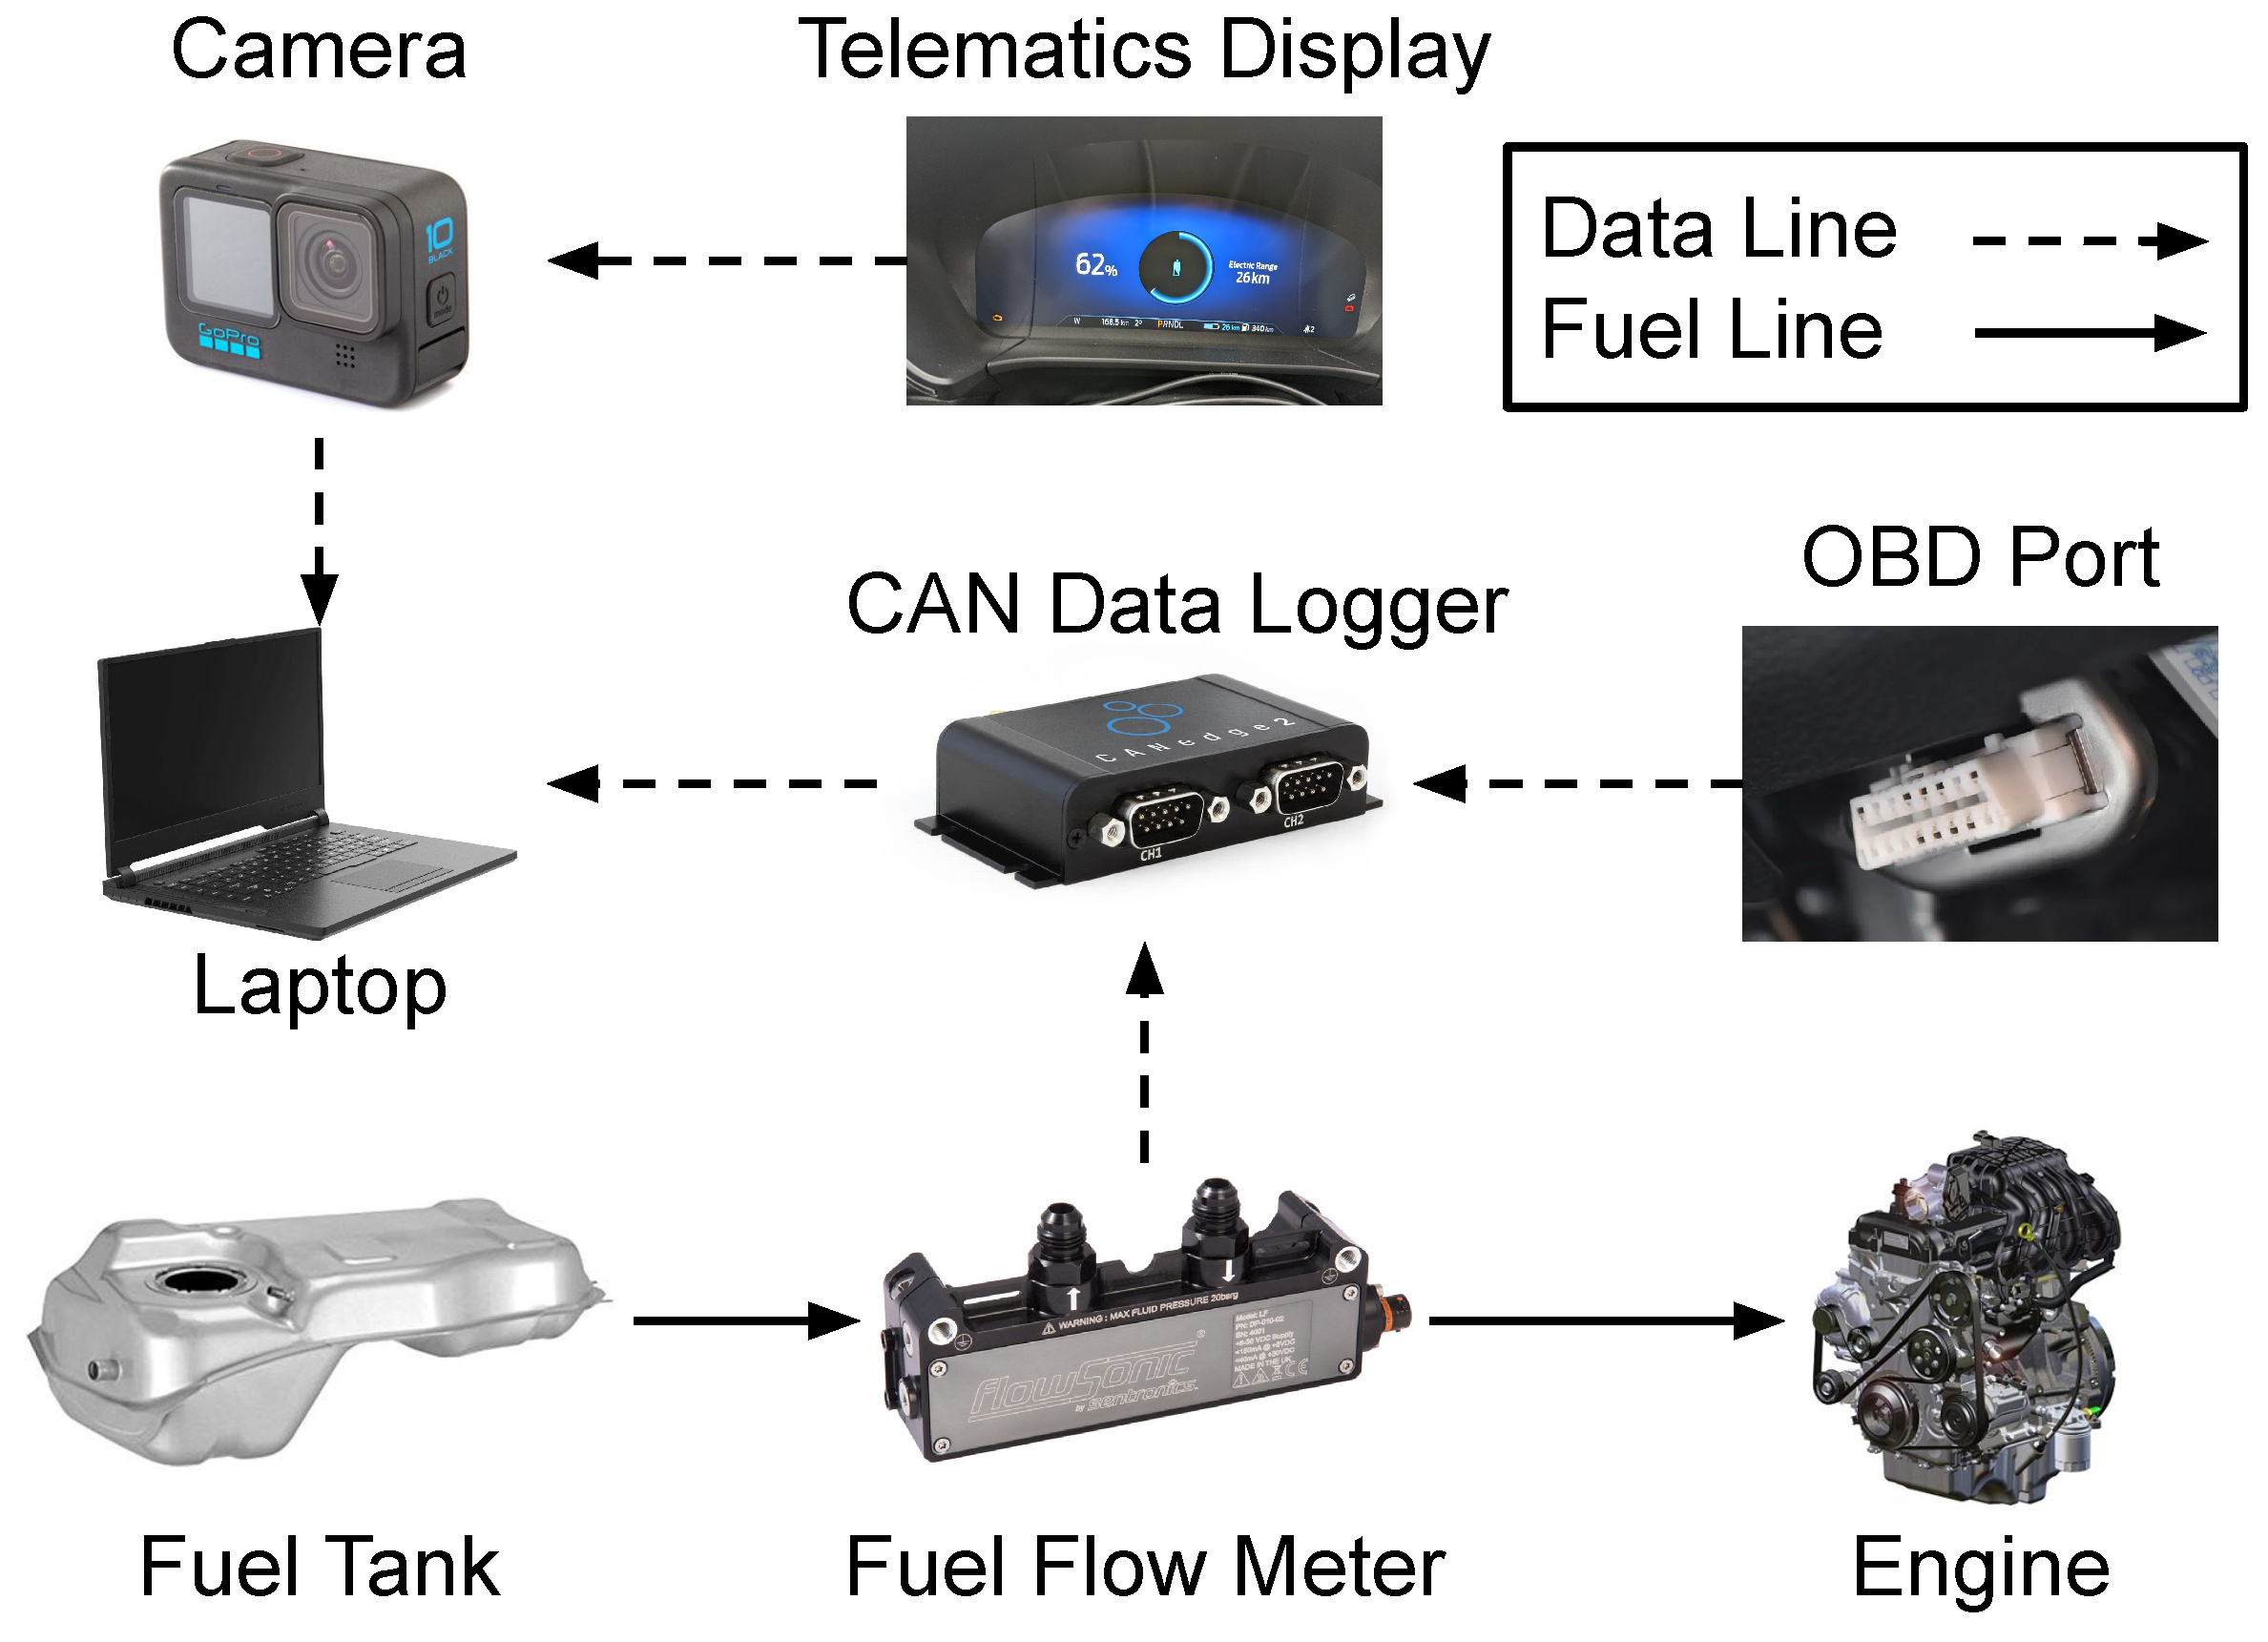
The battery energy usage data were collected from the vehicle’s telematics system, which reports the SOC in real-time during both battery charging and vehicle operation. All vehicle operations, including the multi-information digital display, were recorded during the driving tests using a GoPro HERO9 camera (GoPro Inc., San Mateo, CA, USA).
A full battery charge from 0% to 100% SOC consumed 12.02 kWh of energy at the charging station, indicating that about 84% of the reported 14.4 kWh battery capacity was usable. This is important because a SOC of 0% or 100% does not necessarily mean the battery is fully discharged or fully charged. Therefore, the actual energy between the displayed 0% to 100% SOC should be considered instead of the total battery capacity.

2.3. Fuel Flow Measurement

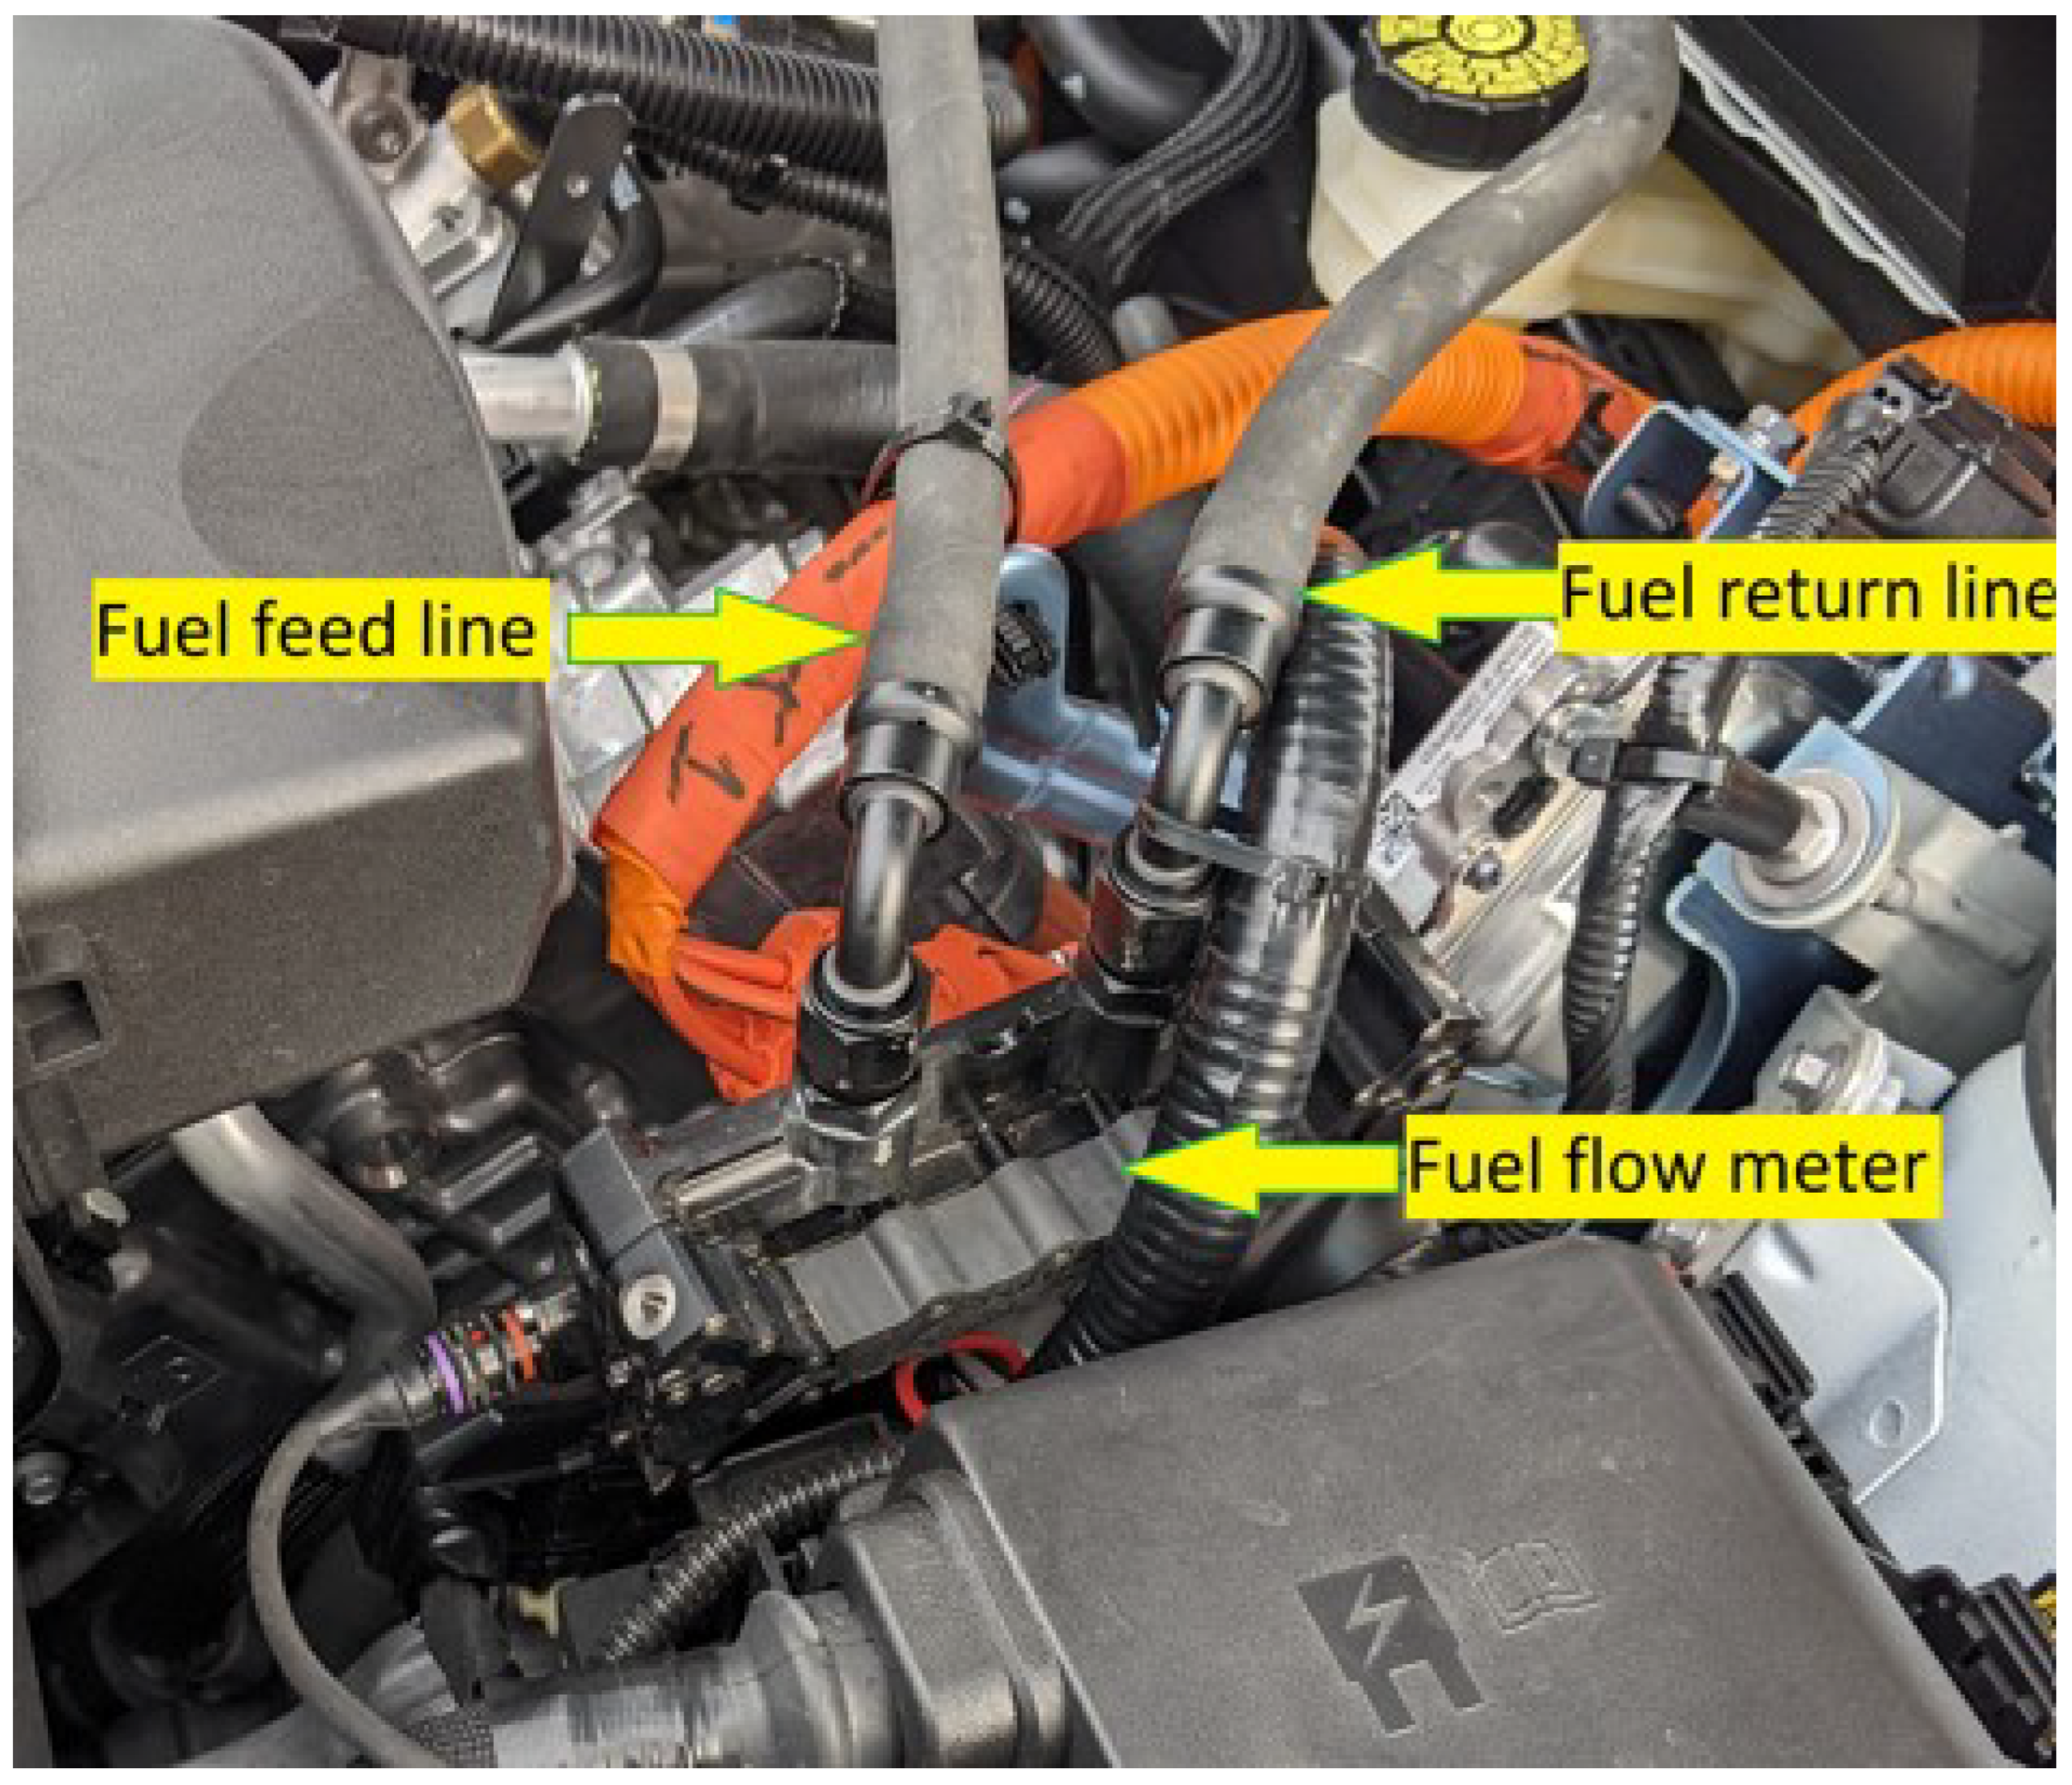
An ultrasonic fuel flow meter was installed on the vehicle to measure the instantaneous and cumulative volume and mass of the consumed gasoline fuel. The fuel flow meter was a Sentronics FlowSonic Low-Flow Sensor, and it was set to collect fuel consumption rate data with a sampling rate of 5 Hz. A 5 Hz sampling rate appears sufficient for capturing the transient behavior of fuel consumption, based on the dynamics of changes observed in real-world driving conditions. The flow meter was installed on the vehicle’s fuel line to the engine as shown in Figure 4. The technical specifications of the Sentronics fuel flow meter, along with the calibration information provided by the manufacturer, are shown in Table 3.

2.4. CAN Data Collection

A CSS Electronics CANedge2 controller area network (CAN) data logger was used to collect data from both the fuel flow meter and the on-board diagnostics (OBD) port of the vehicle, enabling access to parameters not available through the vehicle’s telematics display. The collected data from the OBD port and the fuel flow meter were automatically synchronized through the CANedge2 data logger. The selected OBD parameters collected from the vehicle’s OBD port and fuel flow parameters collected from the CANedge2 data logger are listed in Table 4. The schematics of vehicle instrumentation and the data collection procedure for collecting fuel consumption, electric energy consumption, and OBD data are shown in Figure 5.

2.5. Driving Route

A test route was selected to cover various driving conditions (Figure 6). This 20 km route typically takes about 35 min to drive. Each round of driving the vehicle on this route is called a “test” in this study. Each test began at the University of Alberta, South Campus to North Campus, and then passed through residential and commercial areas and returned to the South Campus through Whitemud Dr Highway. The drive cycle distance (20 km) was less than the PHEV charge-depletion range (61 km @ Tamb range from 20 °C to 30 °C). Thus, the vehicle’s hybrid battery was able to propel the vehicle during the entire test.
The selected route contained 31 intersections with traffic lights, 13 intersections with stop signs, and 6 pedestrian crossing lights. These intersections were considered traffic factors that directly affected the test duration. The test duration in this study varied from 29.5 min to 42 min. For comparison among test trips, the test condition needed to be as consistent as possible. For this purpose, 14 tests were removed because of heavy traffic or construction on the route during the time of the test. Tests with a duration of more than 38.5 min were excluded to avoid bias in the data.

2.6. Test and Analysis Procedure

All powertrain modes of the Ford Escape PHEV were tested for this study. The modes were Auto EV, EV Now, EV Later, and EV Charge. At a battery SOC of more than 80%, the vehicle energy management system forced the vehicle to operate in charge-depleting modes. Therefore, to have control over the selected powertrain modes, the initial SOC (except for tests in EV Charge mode) was set to 77 ± 1%. Before testing, the battery was charged to an SOC of 77 ± 1% to ensure the battery did not deplete during the test and that the powertrain mode was maintained for the entire 20 km driving distance of each test. For the EV Charge mode, where the battery is charged by the engine, the tests started at an initial SOC of 0%, with the battery fully depleted. During these tests, the ICE could charge the high-voltage battery up to 77% SOC. According to the EPA [27], tests in which coolant and three-way catalyst (TWC) temperatures are the same as the Tamb are denoted as cold start tests. In this study, the first test of the day was considered a cold start. Proper equipment installation was the most essential part of the cold start tests. Any fault in the equipment installation could have disrupted the data collection process, rendering the test unacceptable. By turning on the ICE, the coolant and TWC temperatures increased quickly. However, the cooling down process was time-consuming. Even at the Tamb of −20 °C, a warmed-up vehicle did not cool down to Tamb after 7 h.
In order to allow a comparison among the tests, the cabin HVAC setting was constant during all tests. The HVAC temperature was set to 25 °C, and the fan speed was set to the second speed level. The initial conditions used for the Ford Escape PHEV tests are shown in Table 5.
The vehicle was driven through a specific test route in different weather conditions, with an Tamb ranging from −24 °C to 32 °C. The driving on the test route was repeated 213 times, out of which 14 tests were excluded as mentioned before in Section 2.5. The total driving distance was approximately 4150 km, spanning nine months from January to September 2022.
Table 6 shows the number of tests in each powertrain mode operation, including a minimum of 41 tests in each mode. Out of 199 tests, 53 of them were cold start tests. In order to increase the consistency of the tests, all efforts were taken to minimize variations among tests. For this purpose, the same driver was used for all the tests. In addition, during most parts of the tests, adaptive cruise control was used wherever possible to minimize variations among tests.
For the tests with a cold start, the TWC and engine coolant temperatures were investigated during the warm-up period. Typically, TWCs of gasoline fuel vehicles are considered warmed-up when they reach the light-off temperature of 300 °C [28].
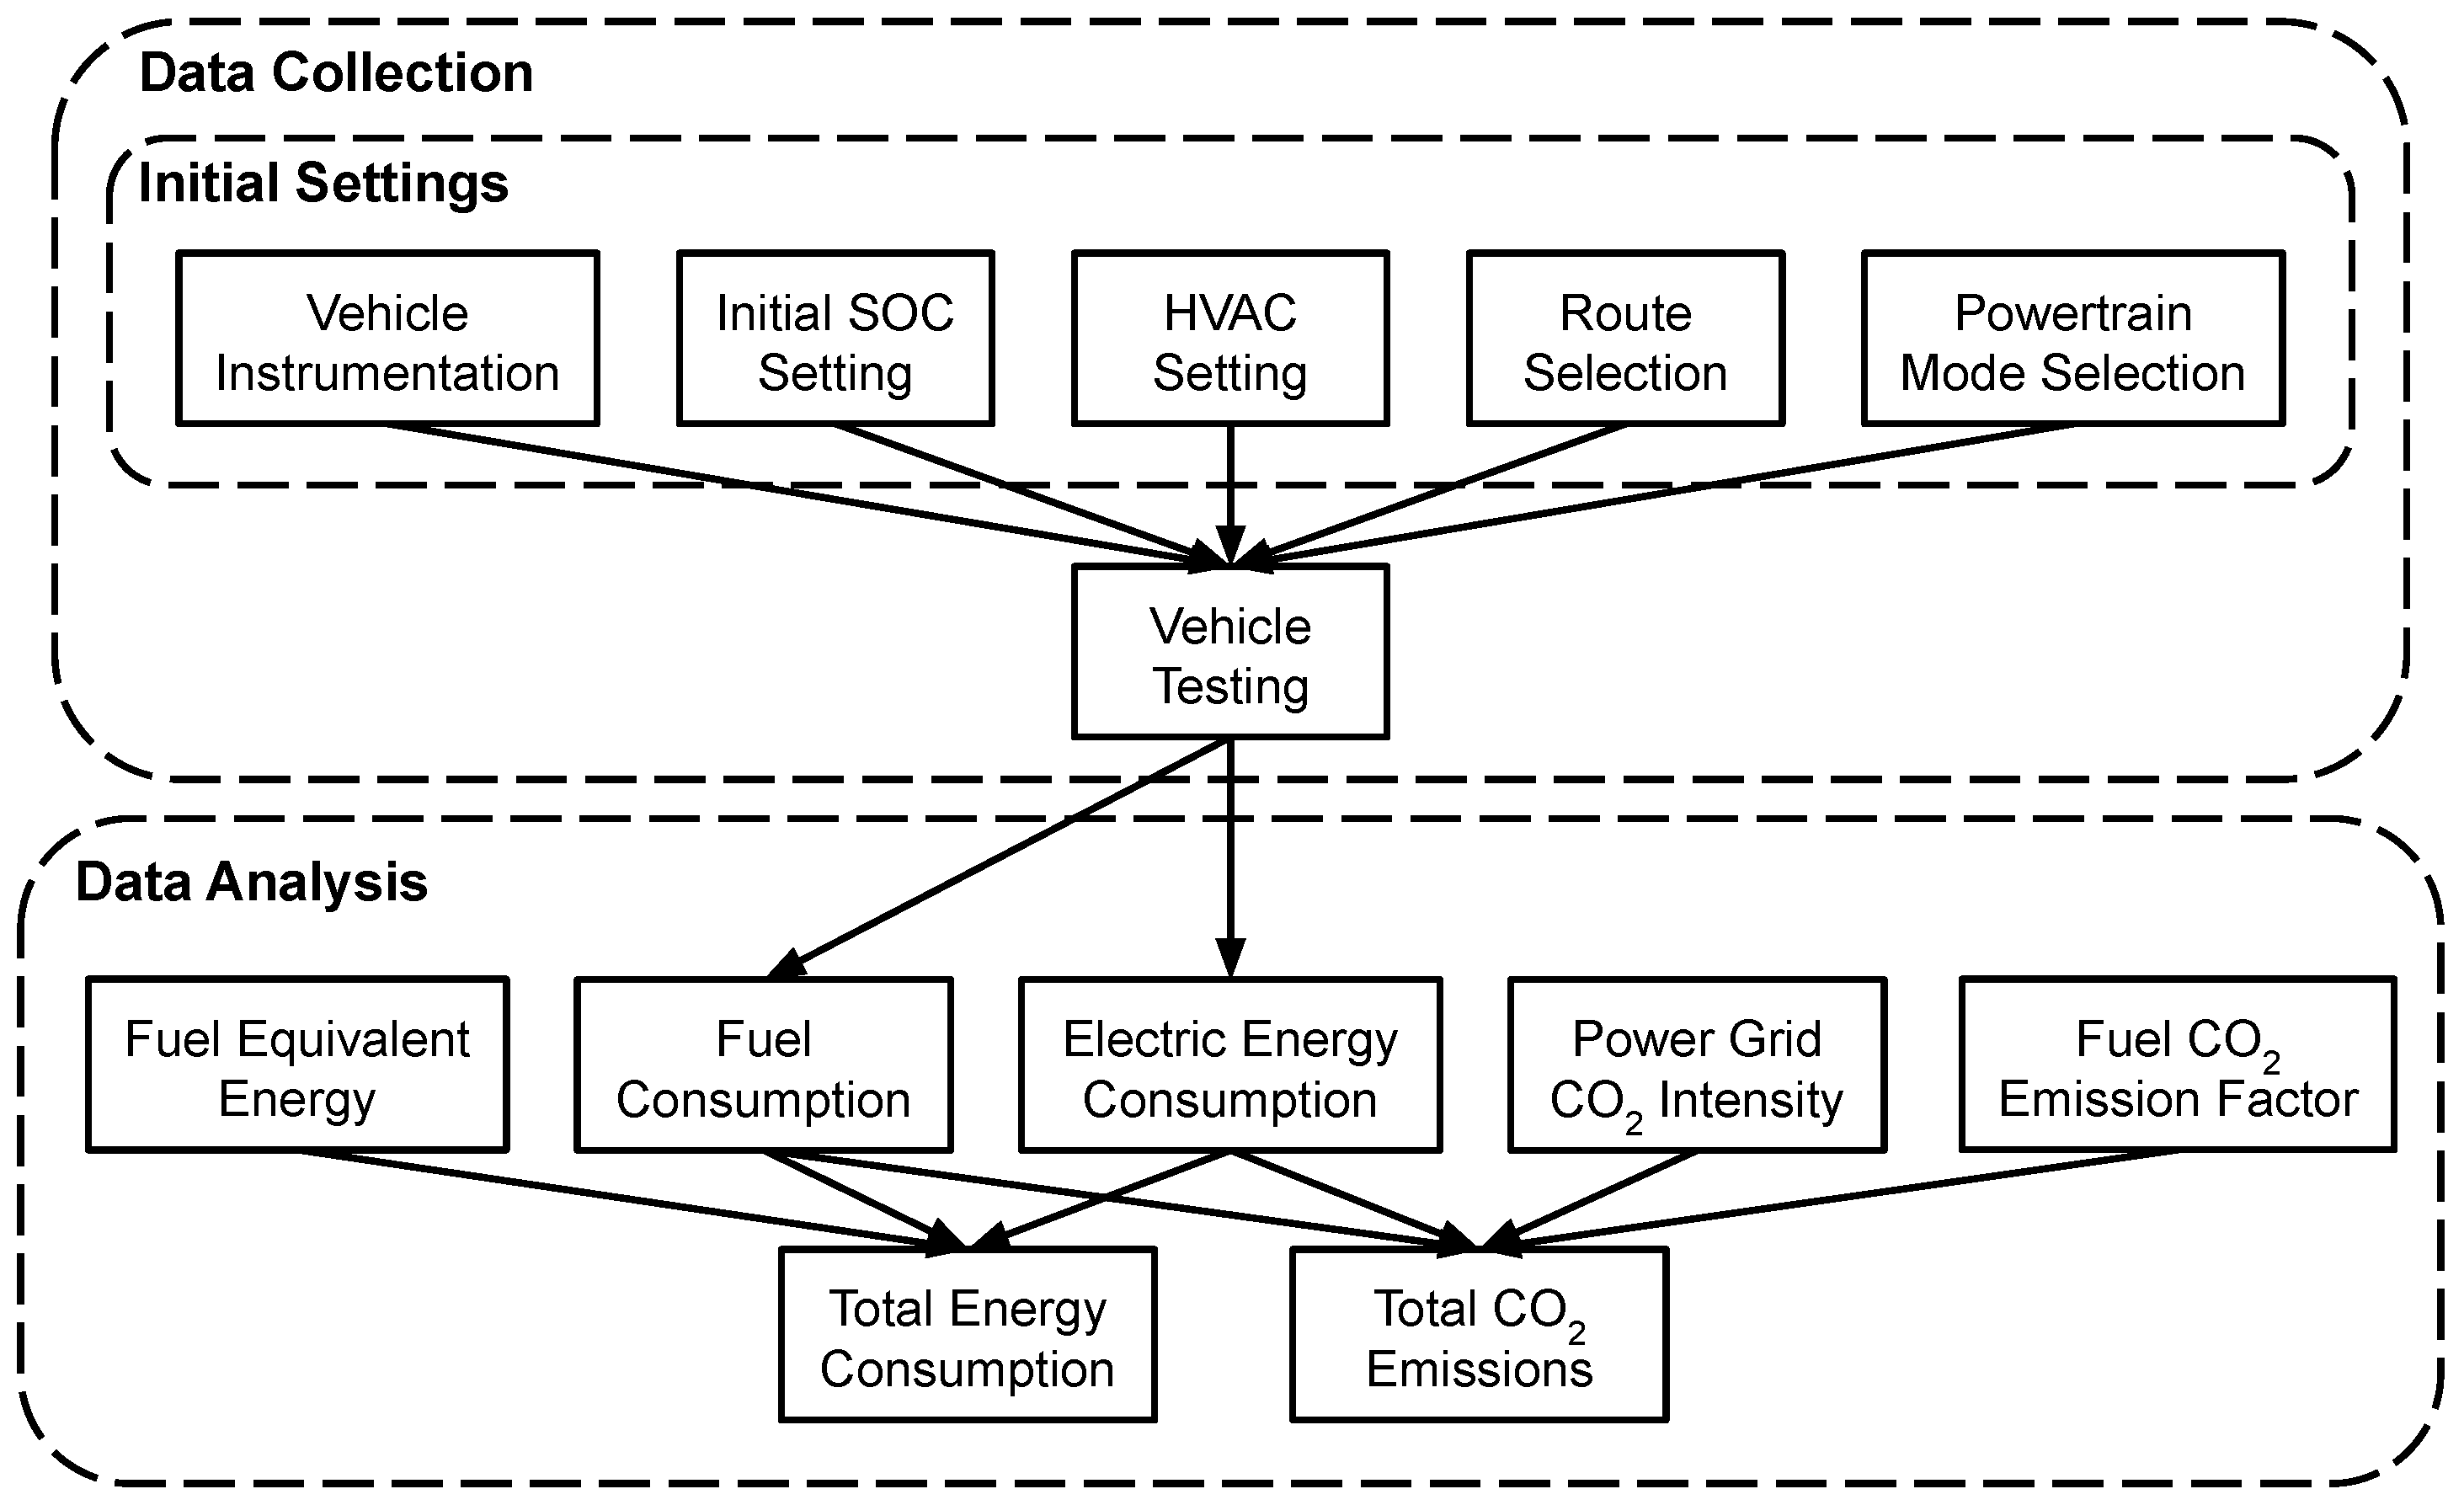
Figure 7 illustrates the procedure for calculating the vehicle energy consumption and CO2 emissions across all tests, detailing both the data collection and data analysis phases. The total energy consumption of the vehicle in each test includes two parts: the energy consumed by burning fuel in the ICE and the electric energy used from the battery. The energy consumed by the ICE was calculated based on the actual measured fuel consumed and the energy density of gasoline (i.e., 8.9 kWh/L) [29]. For the electric energy consumption, the difference in battery SOC from the beginning to the end of each test was used. In charge-depleting modes (i.e., Auto EV and EV Now), electric energy was always consumed. However, in EV Charge mode, the electric energy was stored in the battery by converting the fuel energy into electric energy using the ICE and generator. In EV Later mode, the SOC typically remained constant, meaning no electric energy was consumed or stored in the battery.
The total CO2 emissions of the vehicle in each test comprise two parts: tailpipe CO2 emissions from the gasoline fuel burned in the ICE, and upstream CO2 emissions from gasoline production and electricity generation [30,31]. Tailpipe emissions were calculated using the CO2 emission factor for gasoline reported by Environment and Climate Change Canada (i.e., 2307 gCO2/L) [32]. Since most of the gasoline produced in Alberta is derived from oil sands, the upstream CO2 emissions from gasoline production in this region are higher compared to regions utilizing conventional oil production methods [33,34]. Based on previous studies [35,36], about 30% of the total life cycle CO2 emissions of gasoline produced from oil sands occur upstream, prior to vehicle use. Consequently, an emission factor of 3290 gCO2/L of gasoline was used for ICE-related CO2 emissions, considering 70% tailpipe CO2 emissions and an additional 30% from upstream gasoline production. Furthermore, the upstream CO2 emissions from electricity grid generation depend on the region and the energy source mix used. In Alberta, Canada, for the year 2022, the emission factor of 455 gCO2/kWh was applicable [8], and this value was used in reported CO2 emissions from the test vehicle in this paper.

3. Results and Discussion

3.1. Ambient Temperature Range

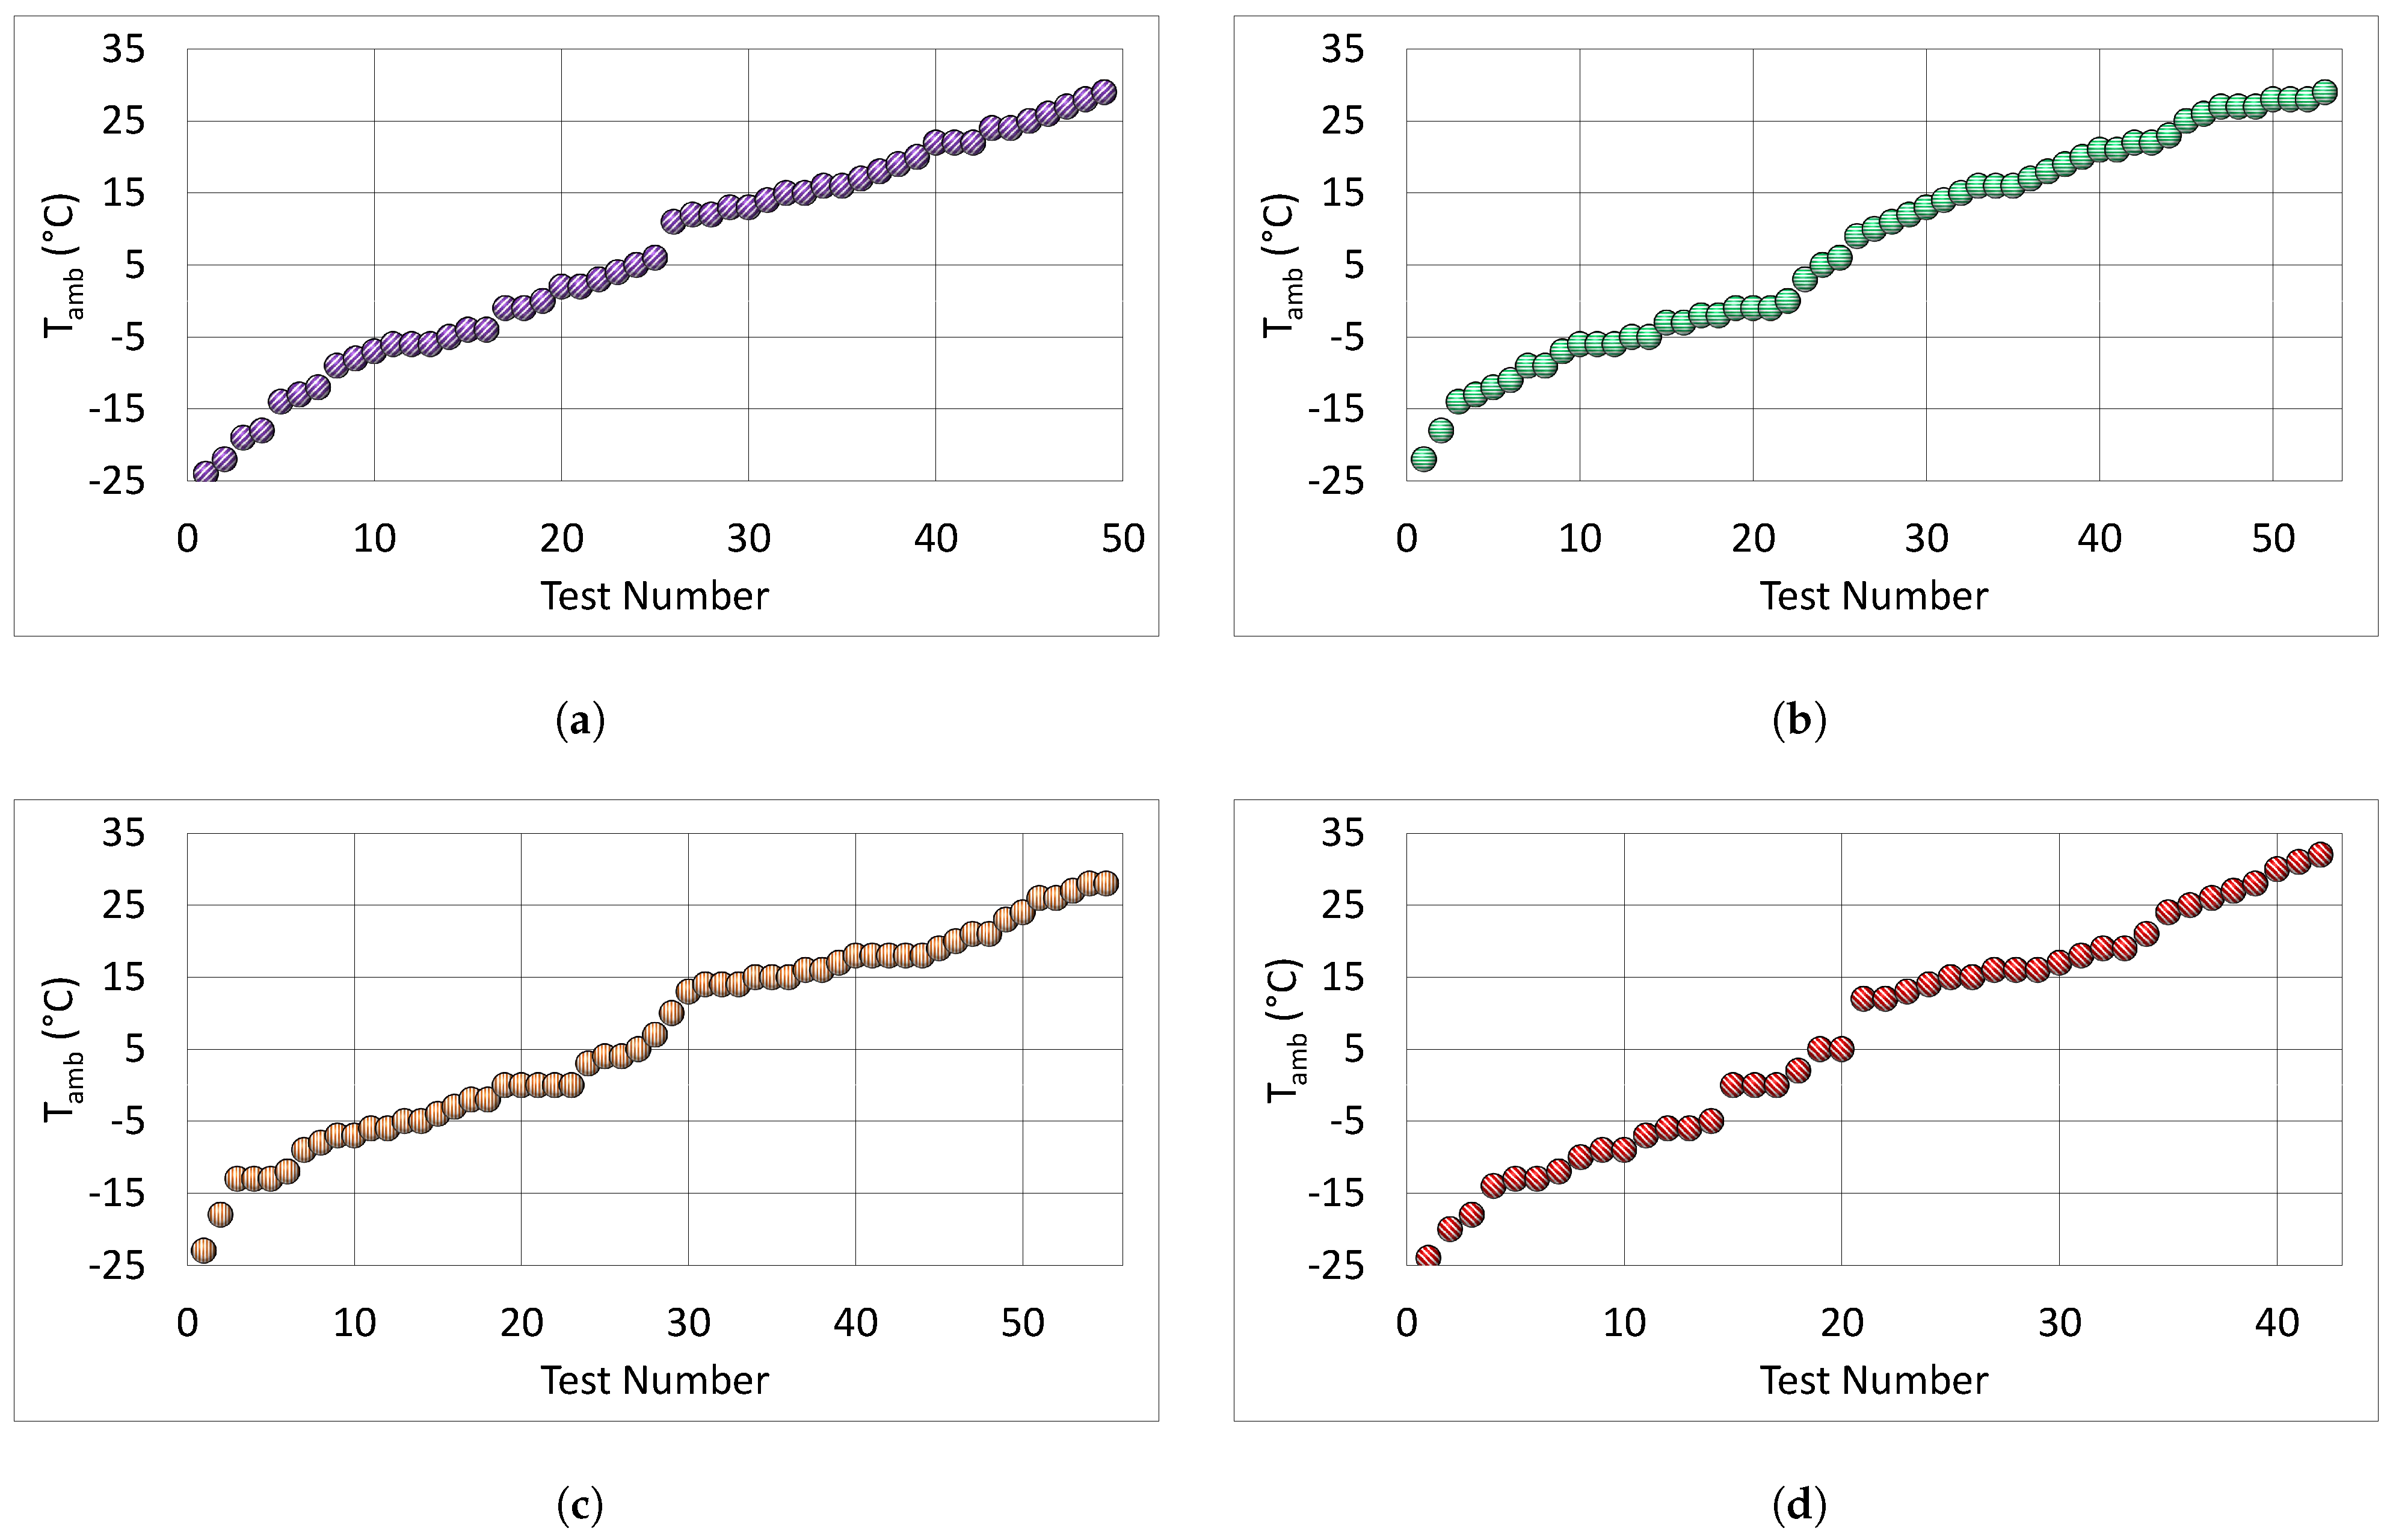
Figure 8 illustrates the Tamb associated with each test in all powertrain modes studied in this paper. The Tamb of each test is the average ambient temperature during that test. The tests included a broad Tamb spectrum, ranging from the coldest of −24 °C to the warmest of 32 °C, covering a temperature range of 56 °C throughout the study. Efforts were made to cover a wide range of ambient temperatures for tests in each powertrain mode of the vehicle. This extensive temperature range enabled a comprehensive analysis of the effect of Tamb in each powertrain mode.
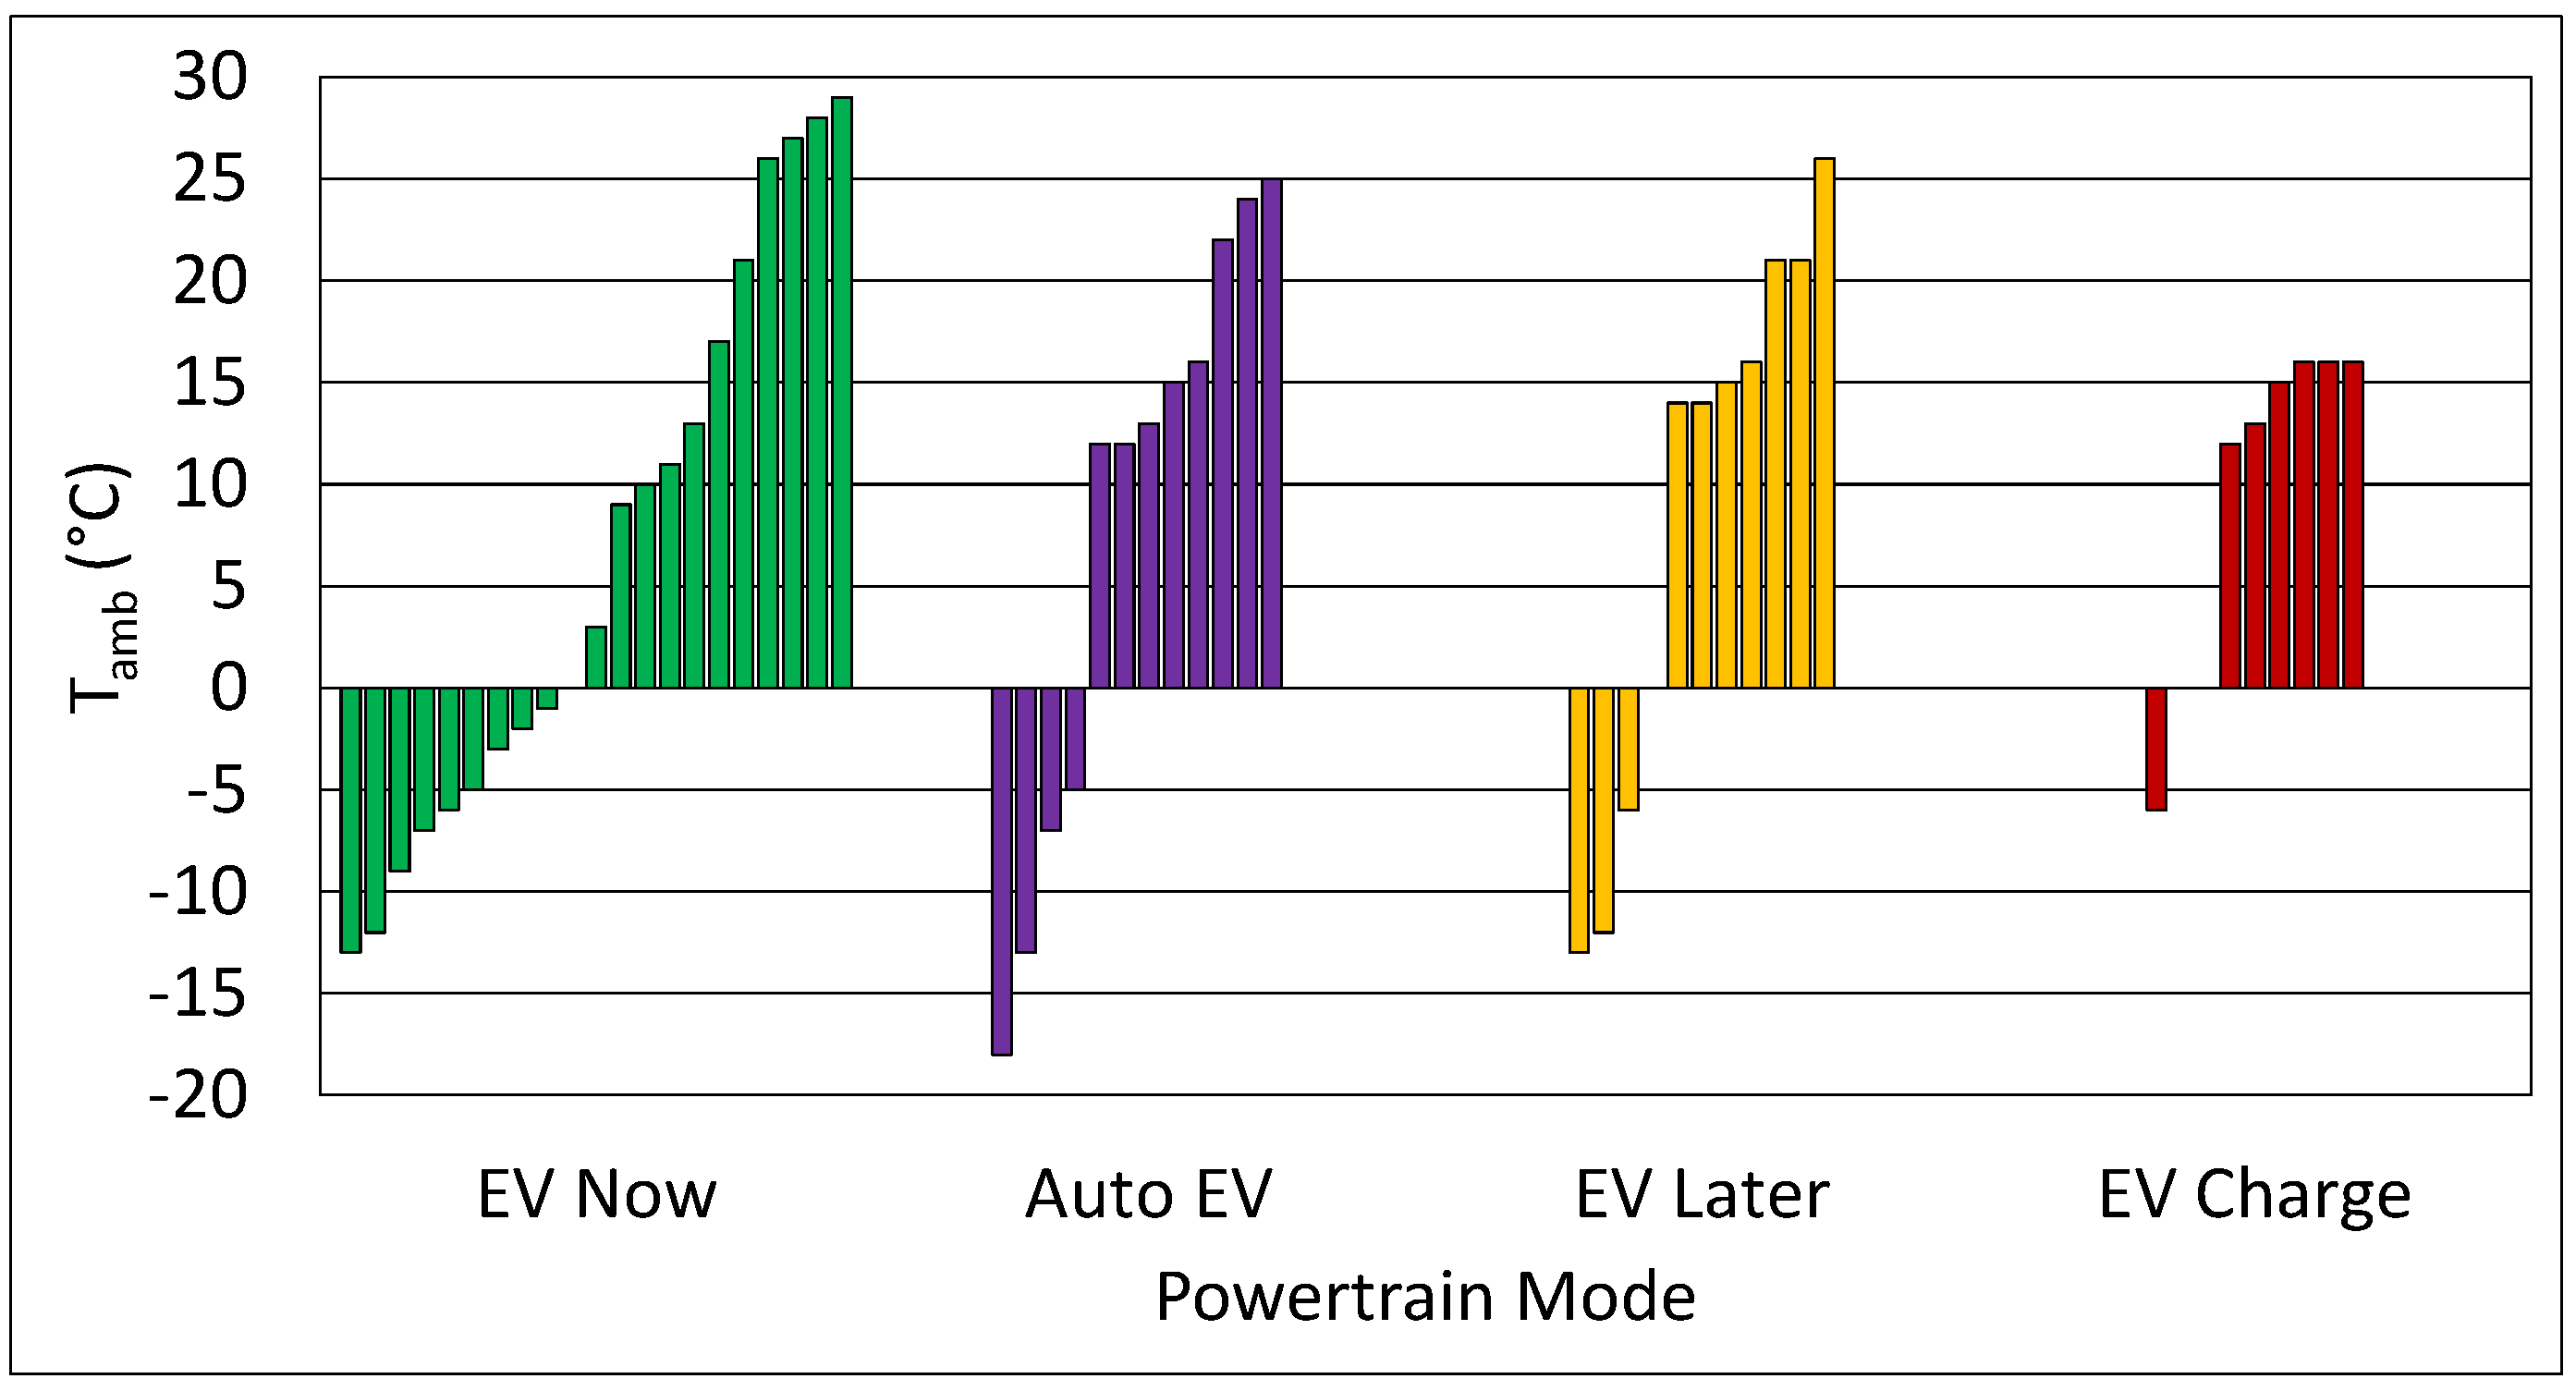
Figure 9 provides a breakdown of the Tamb for the tests with a cold start within each powertrain mode. The tests with a cold start were more affected by the ambient temperature compared to fully warmed-up tests. This is because, at the beginning of the test, all vehicle components were at the same temperature as the Tamb, and a portion of the energy was used for warming up the vehicle powertrain and components.
The highest number of cold start tests were conducted in the EV Now mode, totaling 21 tests, with a Tamb ranging from −13 °C to 29 °C. In the Auto EV mode, 12 cold start tests were conducted, covering Tamb values from −18 °C to 25 °C. The EV Later mode comprised 11 cold start tests, with Tamb values ranging from −13 °C to 26 °C. Finally, the EV Charge mode included eight cold start tests, with Tamb values ranging from −6 °C to 16 °C.

3.2. Ambient Temperature Effects on TWC and Engine Coolant Temperature

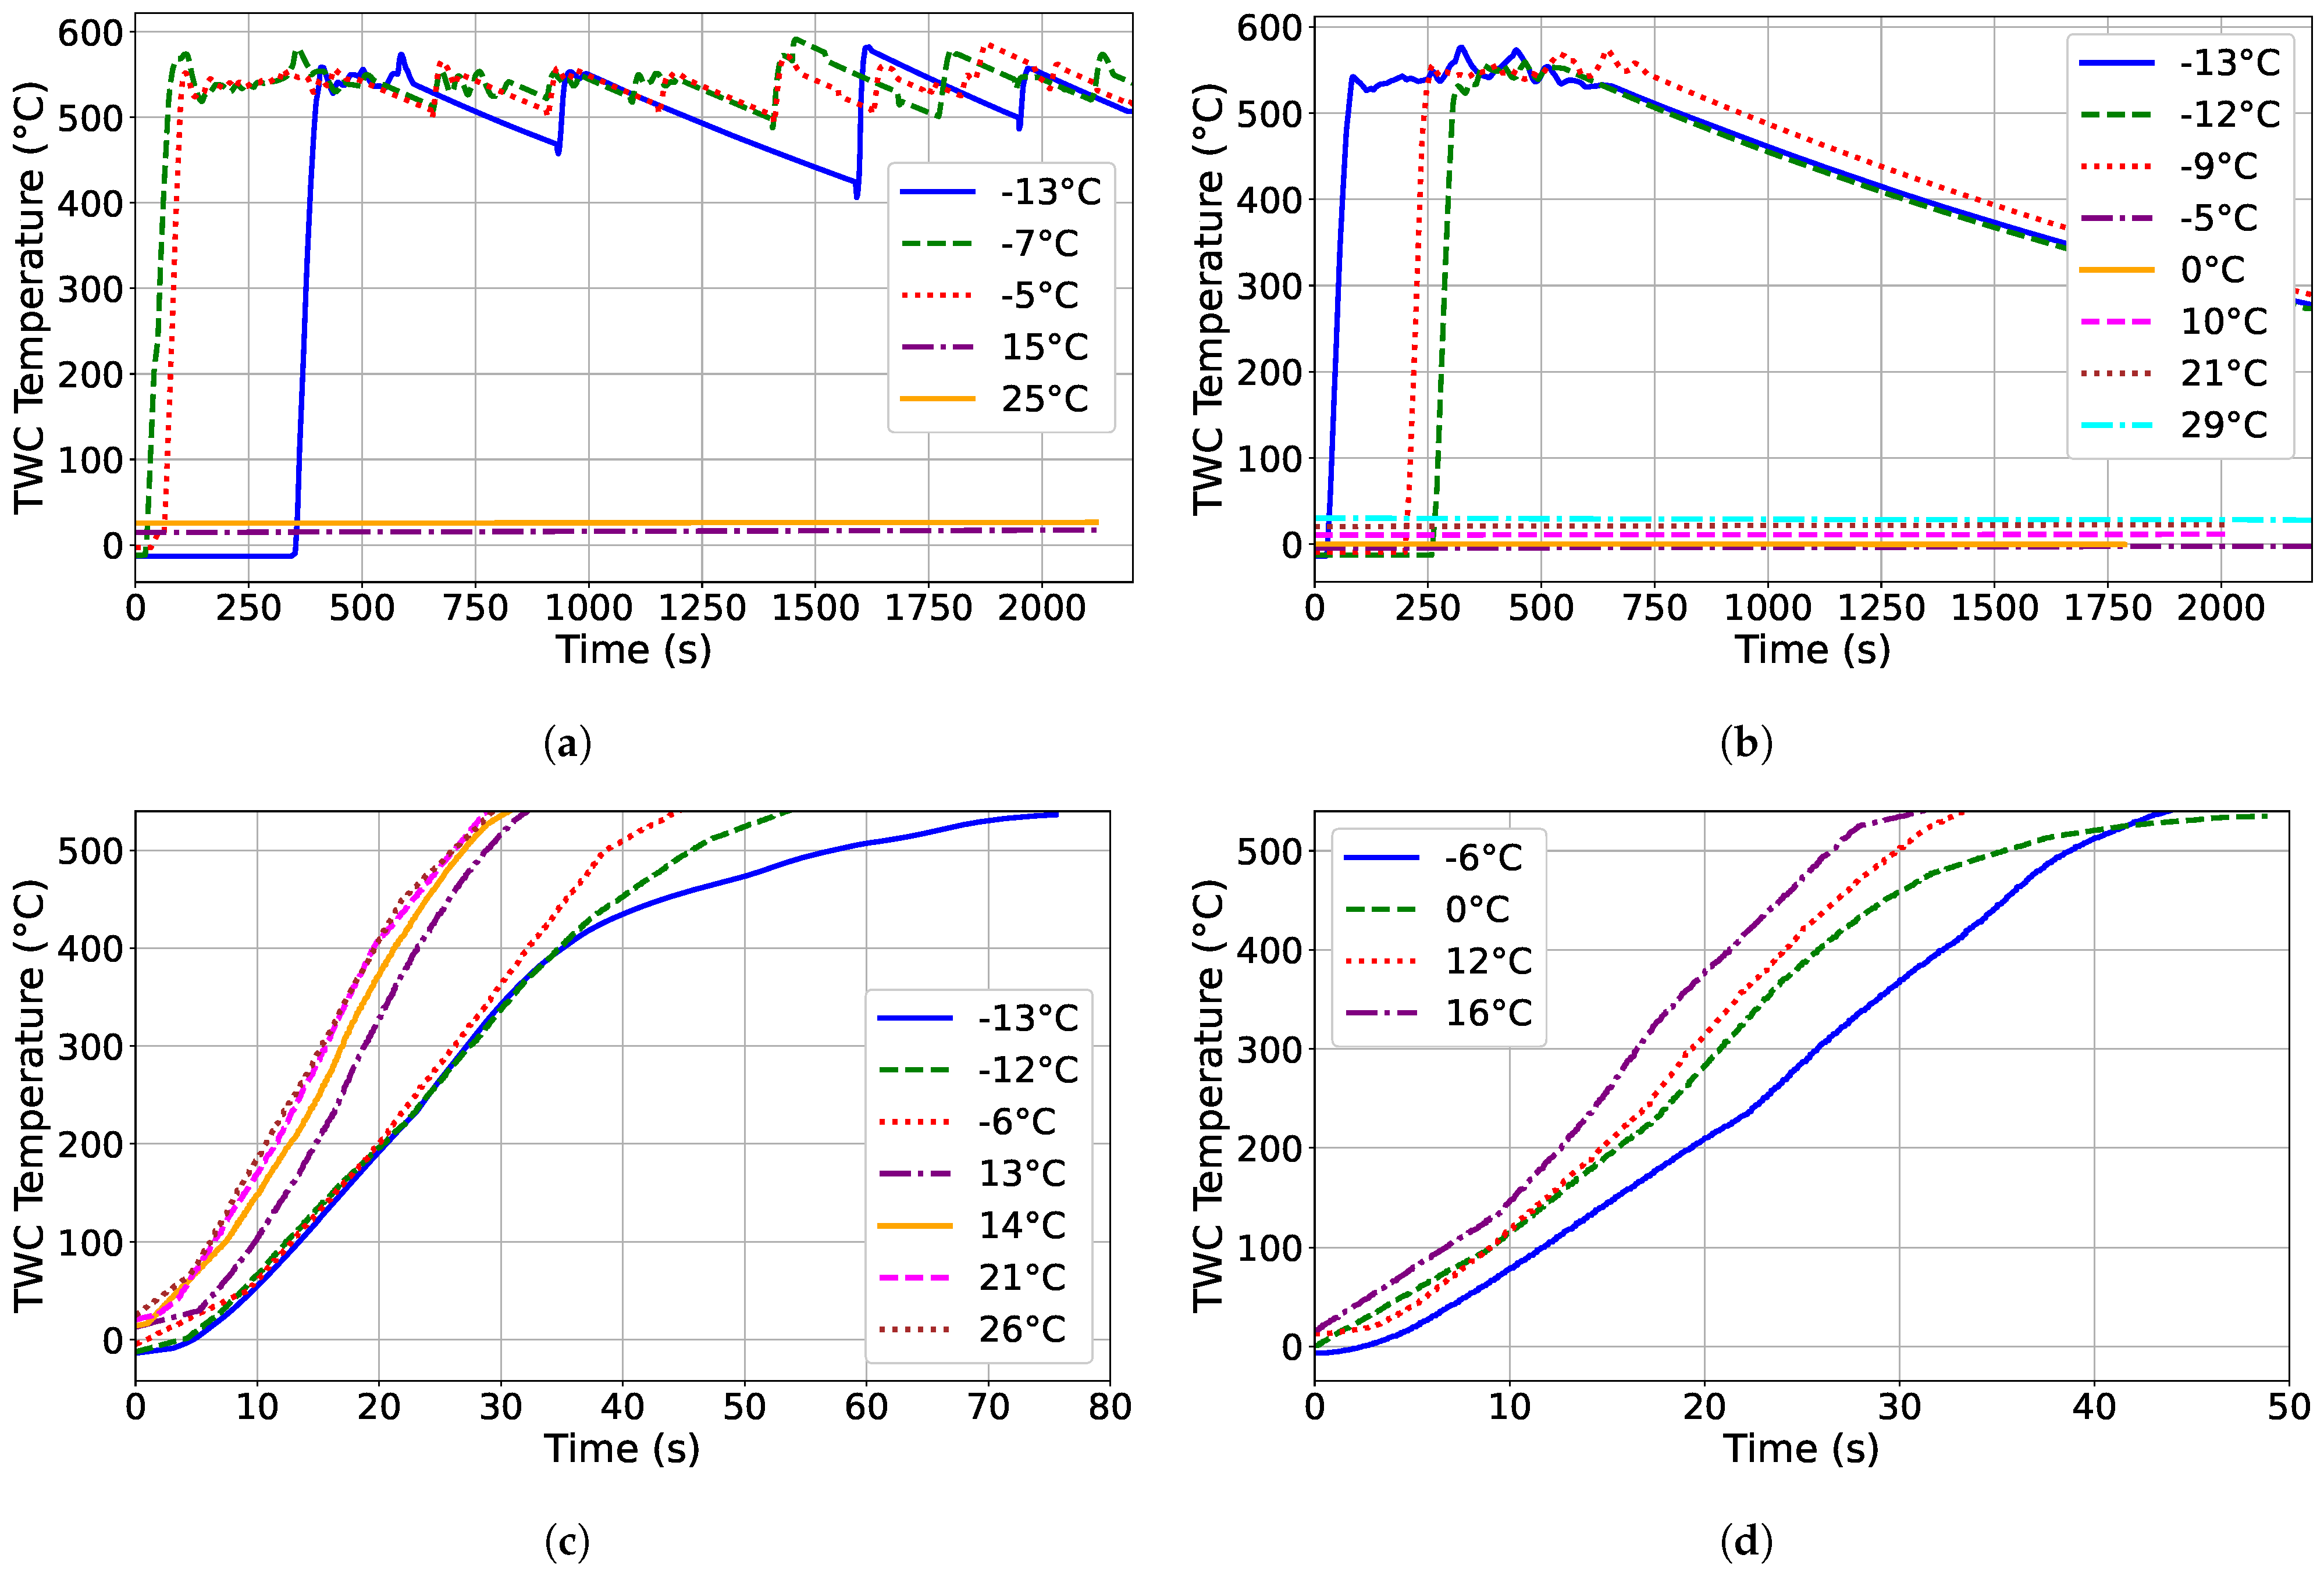
As noted earlier, the ambient temperature had a more significant effect on the cold start tests compared to those conducted under warmed-up conditions. The warming-up process is crucial for various vehicle components, particularly the battery, aftertreatment system, and engine. Cold operation reduces the powertrain efficiency and increases tailpipe emissions. The plots presented in Figure 10 demonstrate how the Tamb influenced the warm-up process of the TWC during the cold start tests across all powertrain modes.
In Auto EV mode, where the vehicle uses the ICE only when necessary, the Tamb is a key factor in determining whether the ICE is needed. At warmer ambient temperatures (i.e., 15 °C, 25 °C), the vehicle did not require the ICE, resulting in the aftertreatment system being inactive due to the absence of hot tailpipe exhaust gas flow and the TWC temperature remaining unchanged. Conversely, at lower ambient temperatures (i.e., ≤−5 °C), the TWC was warmed up, indicating the ICE was used to assist in propelling the vehicle and heating the cabin. This is consistent with the results from testing a Chevrolet Volt PHEV, which maintained fully electric operation in ambient temperatures above −3 °C, when operating in the charge-depleting mode [20]. In EV Now mode, the vehicle is expected to operate solely on the high-voltage battery and electric motor without engaging the ICE. However, this was not feasible for the tested PHEV at low ambient temperatures (i.e., <−5 °C), as the vehicle required ICE assistance at the start of the test, which led to the TWC warming up. The non-continuous operation of the ICE in these charge-depleting powertrain modes led to multiple decreases in the TWC temperature during vehicle operation, potentially resulting in multiple instances of cold operation. For example, in EV Now mode under cold ambient conditions, the TWC temperature dropped below the light-off temperature (i.e., 300 °C) during the test, even after initially warming up at the start.
In EV Later and EV Charge modes, where the ICE is used more extensively, the TWC warmed up at the beginning of the test quickly, ensuring that the aftertreatment system operated in a warmed state as quickly as possible. Considering 300 °C as the light-off temperature for the TWC, lower ambient temperatures increased the delay in warming up the aftertreatment system, resulting in higher tailpipe emissions. For instance, at the cold start ambient temperature of −13 °C, the TWC warm-up time was 80% longer compared to that in an ambient temperature of 26 °C in EV Later mode.
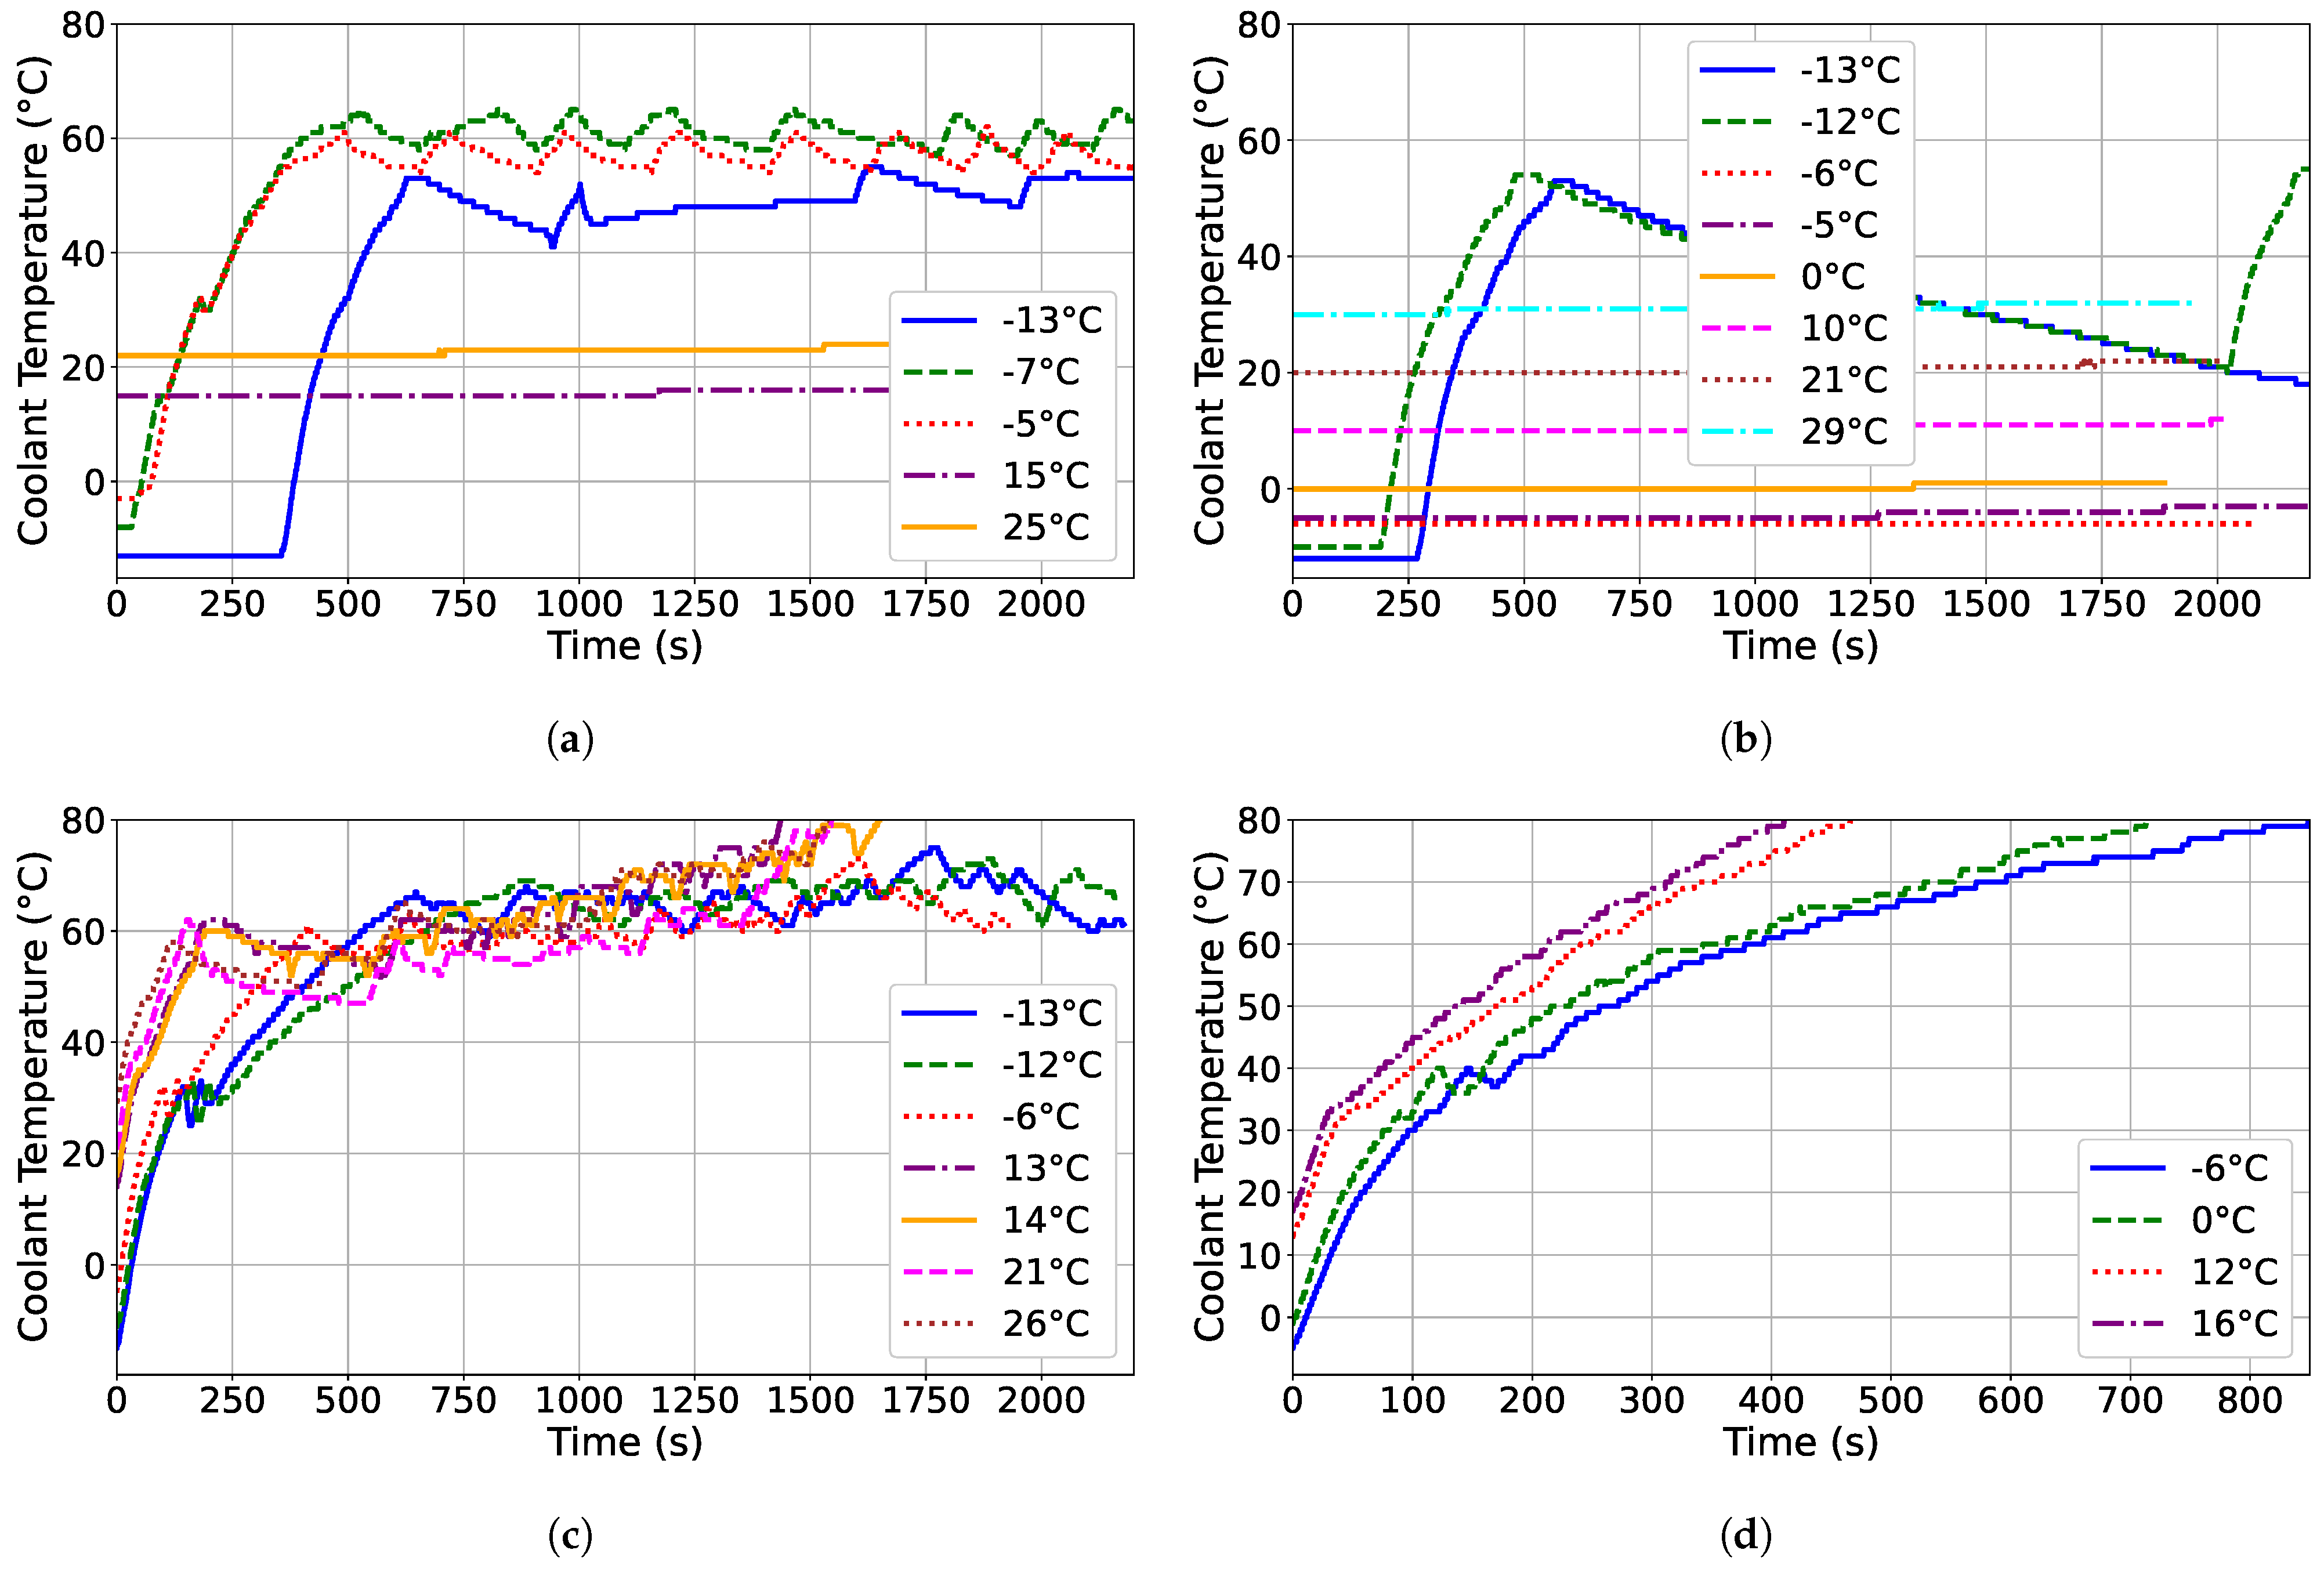
Figure 11 shows the effect of the Tamb on the engine coolant warm-up process across all powertrain modes during cold start tests. Similar to the TWC temperature, the constant engine coolant temperatures equal to the ambient temperature in Auto EV and EV Now modes indicate pure electric operation without ICE engagement. However, in low ambient temperatures, the engine coolant temperature increased due to engine activation in both Auto EV and EV Now modes. The rate of engine coolant warm-up among the powertrain modes correlates with engine involvement, with the highest rate occurring in EV Charge mode, where the engine coolant temperature reached 80 °C within the first 15 min of operation. At an ambient temperature of −6 °C, the engine coolant warm-up time was 100% longer compared to an ambient temperature of 16 °C in EV Charge mode.

3.3. Ambient Temperature Effects on Energy Consumption

The Tamb plays a significant role in influencing energy consumption. This section investigates the effects of the Tamb on the vehicle’s total energy consumption, distinguishing between cold start and warm start tests. Energy consumption was anticipated to be higher during cold starts, as a portion of the consumed energy is used to warm up the various components of the vehicle’s powertrain.

3.3.1. Energy Consumption in Warm Start Tests

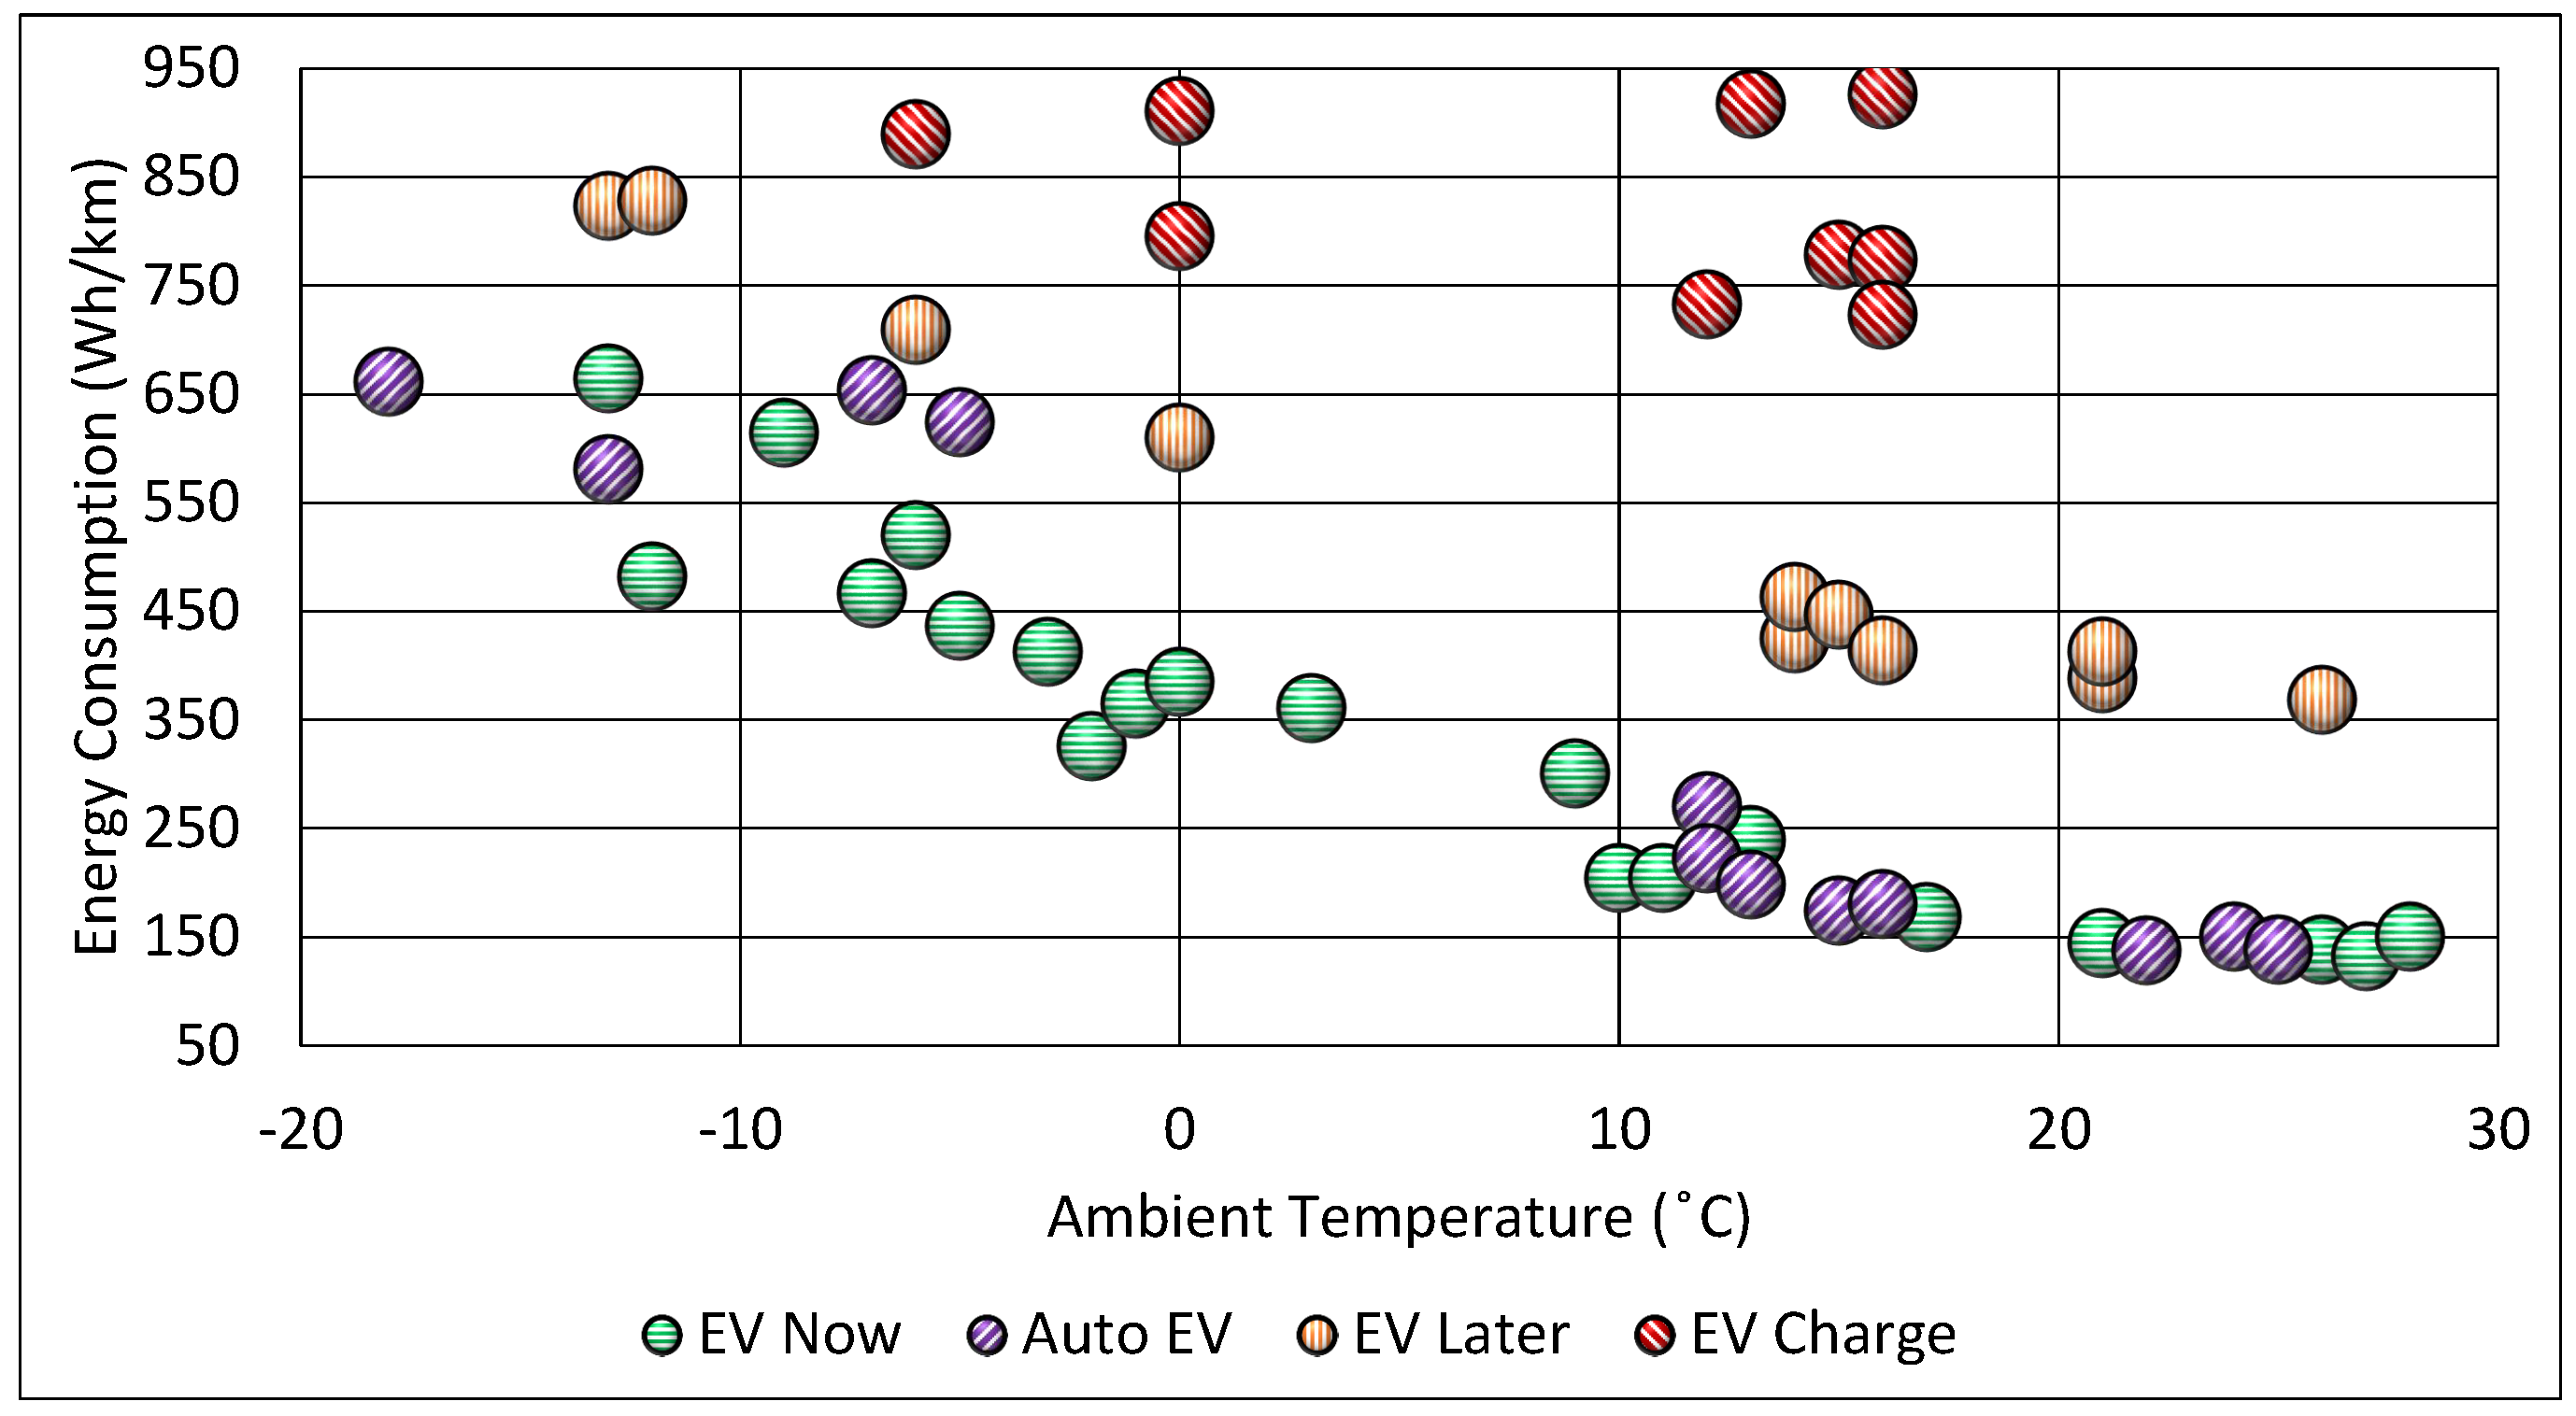
To calculate the total energy consumption of the PHEV, both fuel and battery electric energy consumption are accounted for in this study. Figure 12 shows the energy consumption of various powertrain modes during warm start tests. The least amount of energy consumption in all powertrain modes occurred at ambient temperatures above 20 °C, consistent with previous studies [19,20], due to the reduced need for extensive cabin temperature control. Auto EV and EV Now modes exhibited nearly identical consumption patterns, since they mostly rely on the electric powertrain and use the ICE as an auxiliary power source when needed. EV Charge mode had the highest energy consumption compared to the other powertrain modes, as this mode uses the ICE for both powering the vehicle and charging the battery. The fuel conversion efficiency of the ICE is much lower than that of the electric powertrain. Thus, it is natural that the EV Charge mode had the highest energy consumption.
The Tamb has the least effect on the energy consumption in the EV Charge mode because the ICE is always running, providing the cabin heating energy from the waste heat of the ICE. In the other three modes, at lower ambient temperatures, cabin heating based on electric energy is needed, which increases energy consumption when the Tamb is below 10 °C. This increase is more substantial in Auto EV and EV Now modes (with a slope of 29 Wh (km °C)−1) compared to the EV Later mode (with a slope of 22 Wh (km °C)−1), due to their greater reliance on electric energy.
Table 7 presents the data on the minimum and maximum temperatures tested during warm start experiments, along with the corresponding total energy consumption for each powertrain mode. The results indicate that, in warm start tests, the effect of the Tamb was more pronounced in the modes where the electric motor was used for longer durations. Notably, the most significant effect of the Tamb was observed in Auto EV mode, where a substantial increase of approximately 4.5 times (from 153 to 692 Wh/km) occurred when Tamb decreased from 29 °C to −24 °C. In the case of the EV Now mode, there was a threefold increase as the Tamb decreased from 28 °C to −22 °C. Similarly, for the EV Later mode, the energy consumption doubled with a Tamb decrease from 28 °C to −23 °C. However, in contrast, the EV Charge mode displayed only a minor 7% increase in energy consumption despite changes in the Tamb.

3.3.2. Energy Consumption in Cold Start Tests

Compared to the warm start tests, the energy consumption for the cold start tests was higher at the same Tamb. This increase was due to several factors: (i) Heating the cabin from Tamb to 25 °C; (ii) Heating the electric battery to reach optimal operational conditions (i.e., 15 °C to 30 °C); (iii) The lower efficiency of the battery and electric motor at low temperatures; (iv) Heating the engine coolant and TWC to their required warmed-up conditions; (v) Higher engine fuel consumption during cold starts due to increased engine friction and lower combustion efficiency.
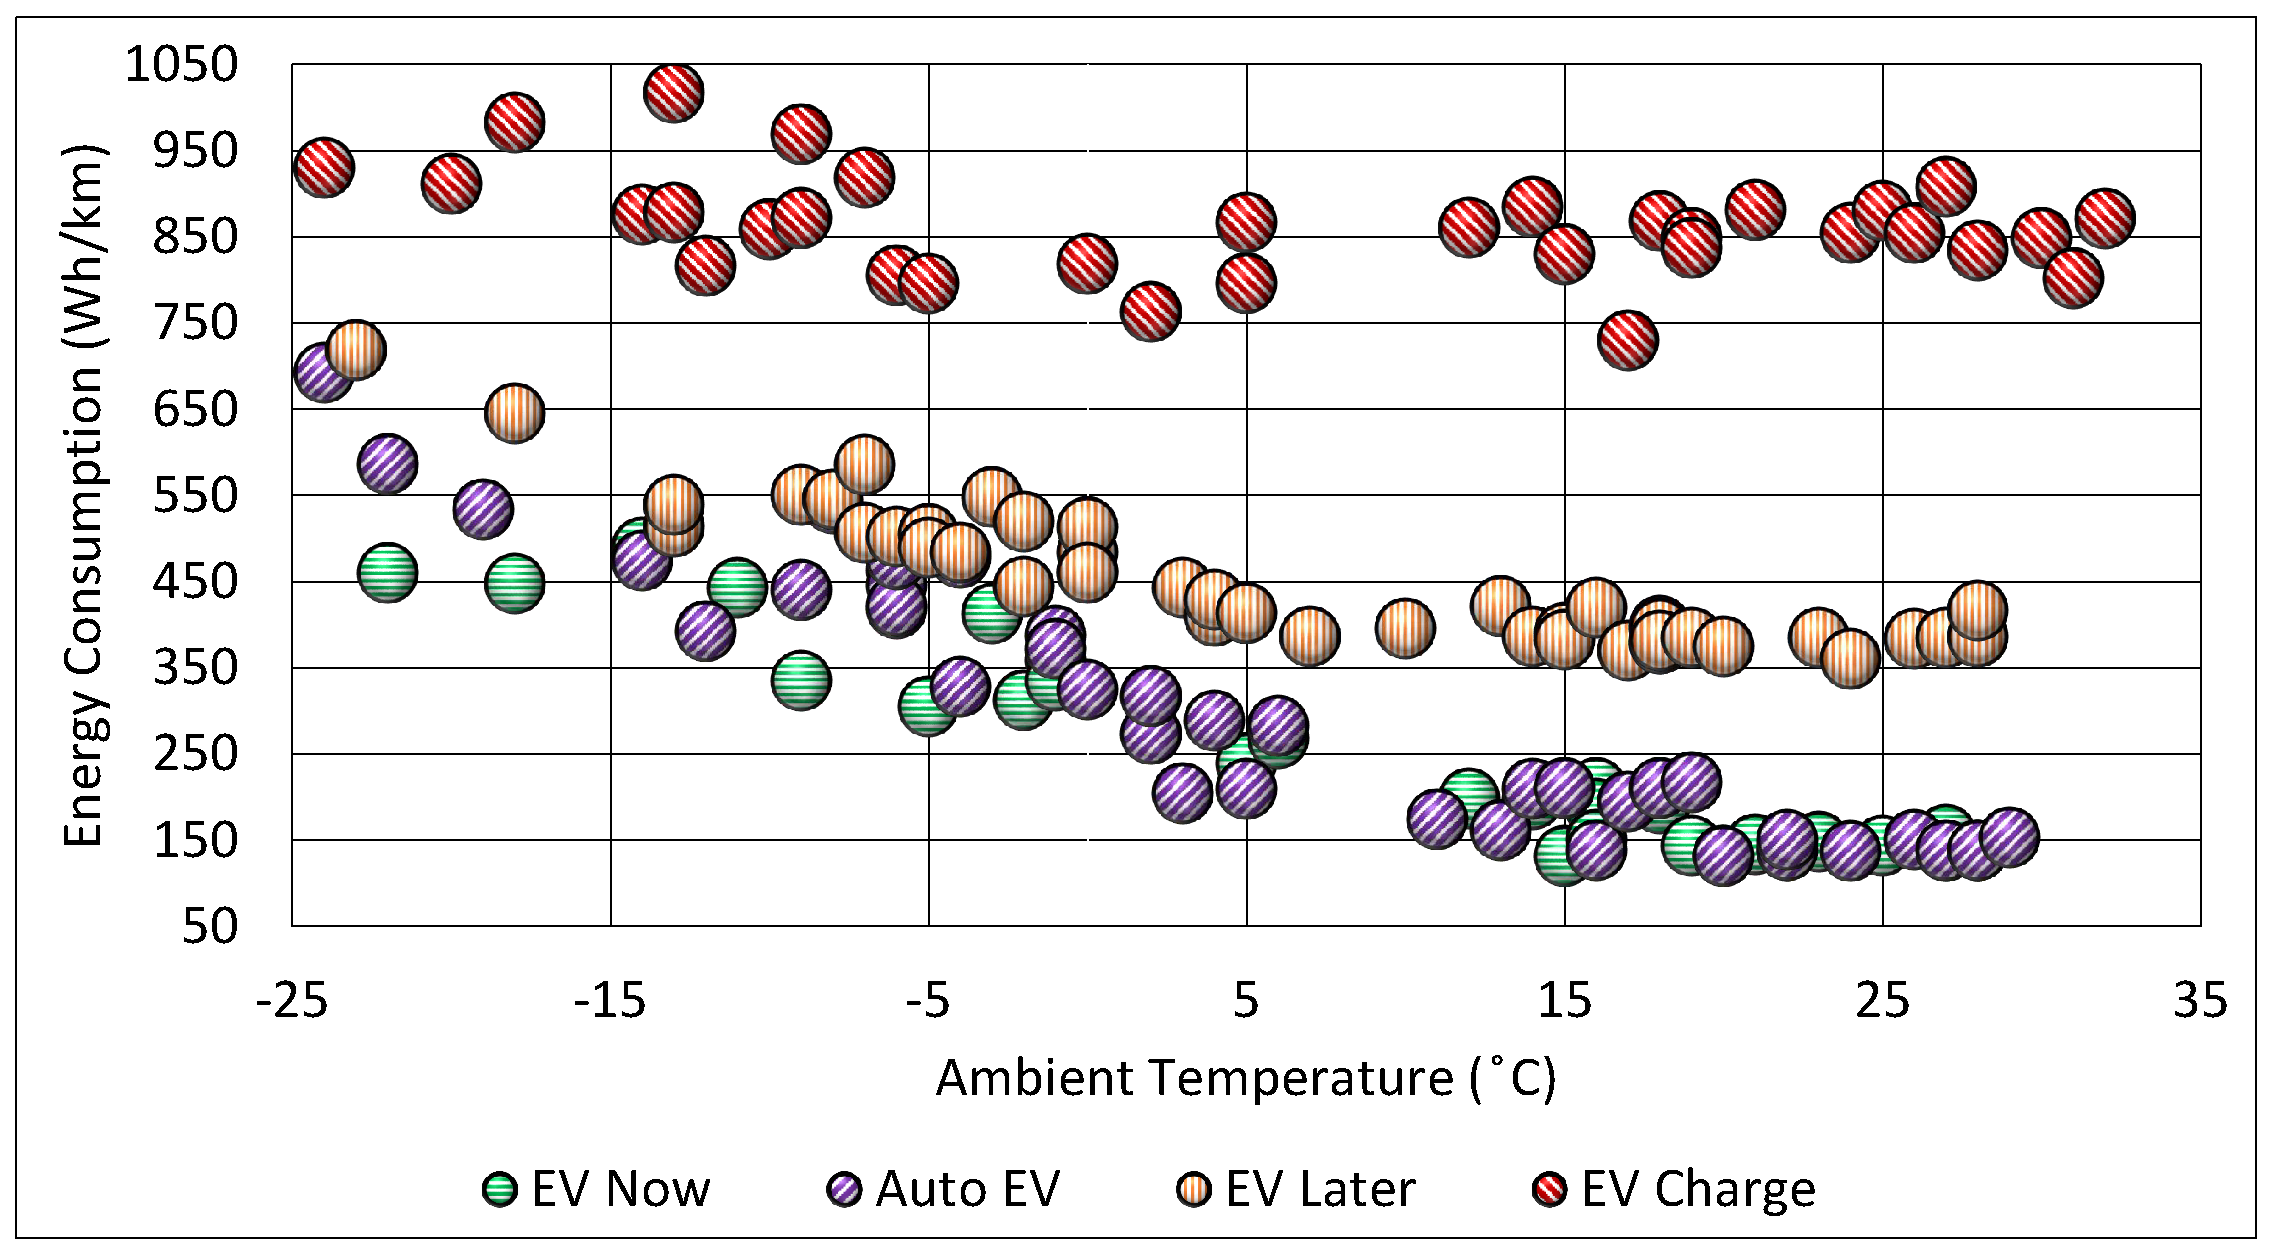
Figure 13 presents the energy consumption of the tests with cold starts for all powertrain modes at different ambient temperatures. The effect of the Tamb, particularly in extremely cold temperatures, is evident. At temperatures below 18 °C, the energy consumption for modes with a higher reliance on the electric motor increased sharply. Conversely, there were no significant changes in energy consumption for the EV Charge mode with continuous ICE operation, indicating that a low Tamb affects electric energy consumption much more than fuel consumption. The highest energy consumption in Auto EV mode was observed in the Tamb range from −5 °C to −20 °C, where the vehicle tends to use the ICE more frequently. The energy consumption patterns for EV Later, Auto EV, and EV Now modes were quite similar, with the highest energy consumption in the EV Later mode at −13 °C, nearly matching the energy consumption of the EV Charge mode with continuous ICE use, despite EV Later being a hybrid powertrain mode.
In Table 8, the energy consumption for cold start tests and the effect of the Tamb on them is shown by the difference in energy consumption between the minimum and the maximum Tamb. The results show that, for cold start tests, the Tamb had the highest effect on the energy consumption in EV Now mode, with more than a five-fold increase with the decrease in the Tamb from 29 °C to −13 °C. For the Auto EV mode, the increase was 379% as the temperature changed from 28 °C to −18 °C. EV Later energy consumption almost doubled from 26 °C to −13 °C. On the other hand, the energy consumption in EV Charge mode in different Tamb was almost constant at around 900 Wh/km.

3.4. Total CO2 Emissions

To assess the environmental impact of different powertrain modes of the PHEV and to investigate the effect of the ambient temperature on greenhouse gas emissions, the total CO2 emissions from the tests were calculated and analyzed. The total CO2 emissions considered in this study include both (i) tailpipe CO2 emissions and (ii) upstream CO2 emissions for generating electricity and producing gasoline.
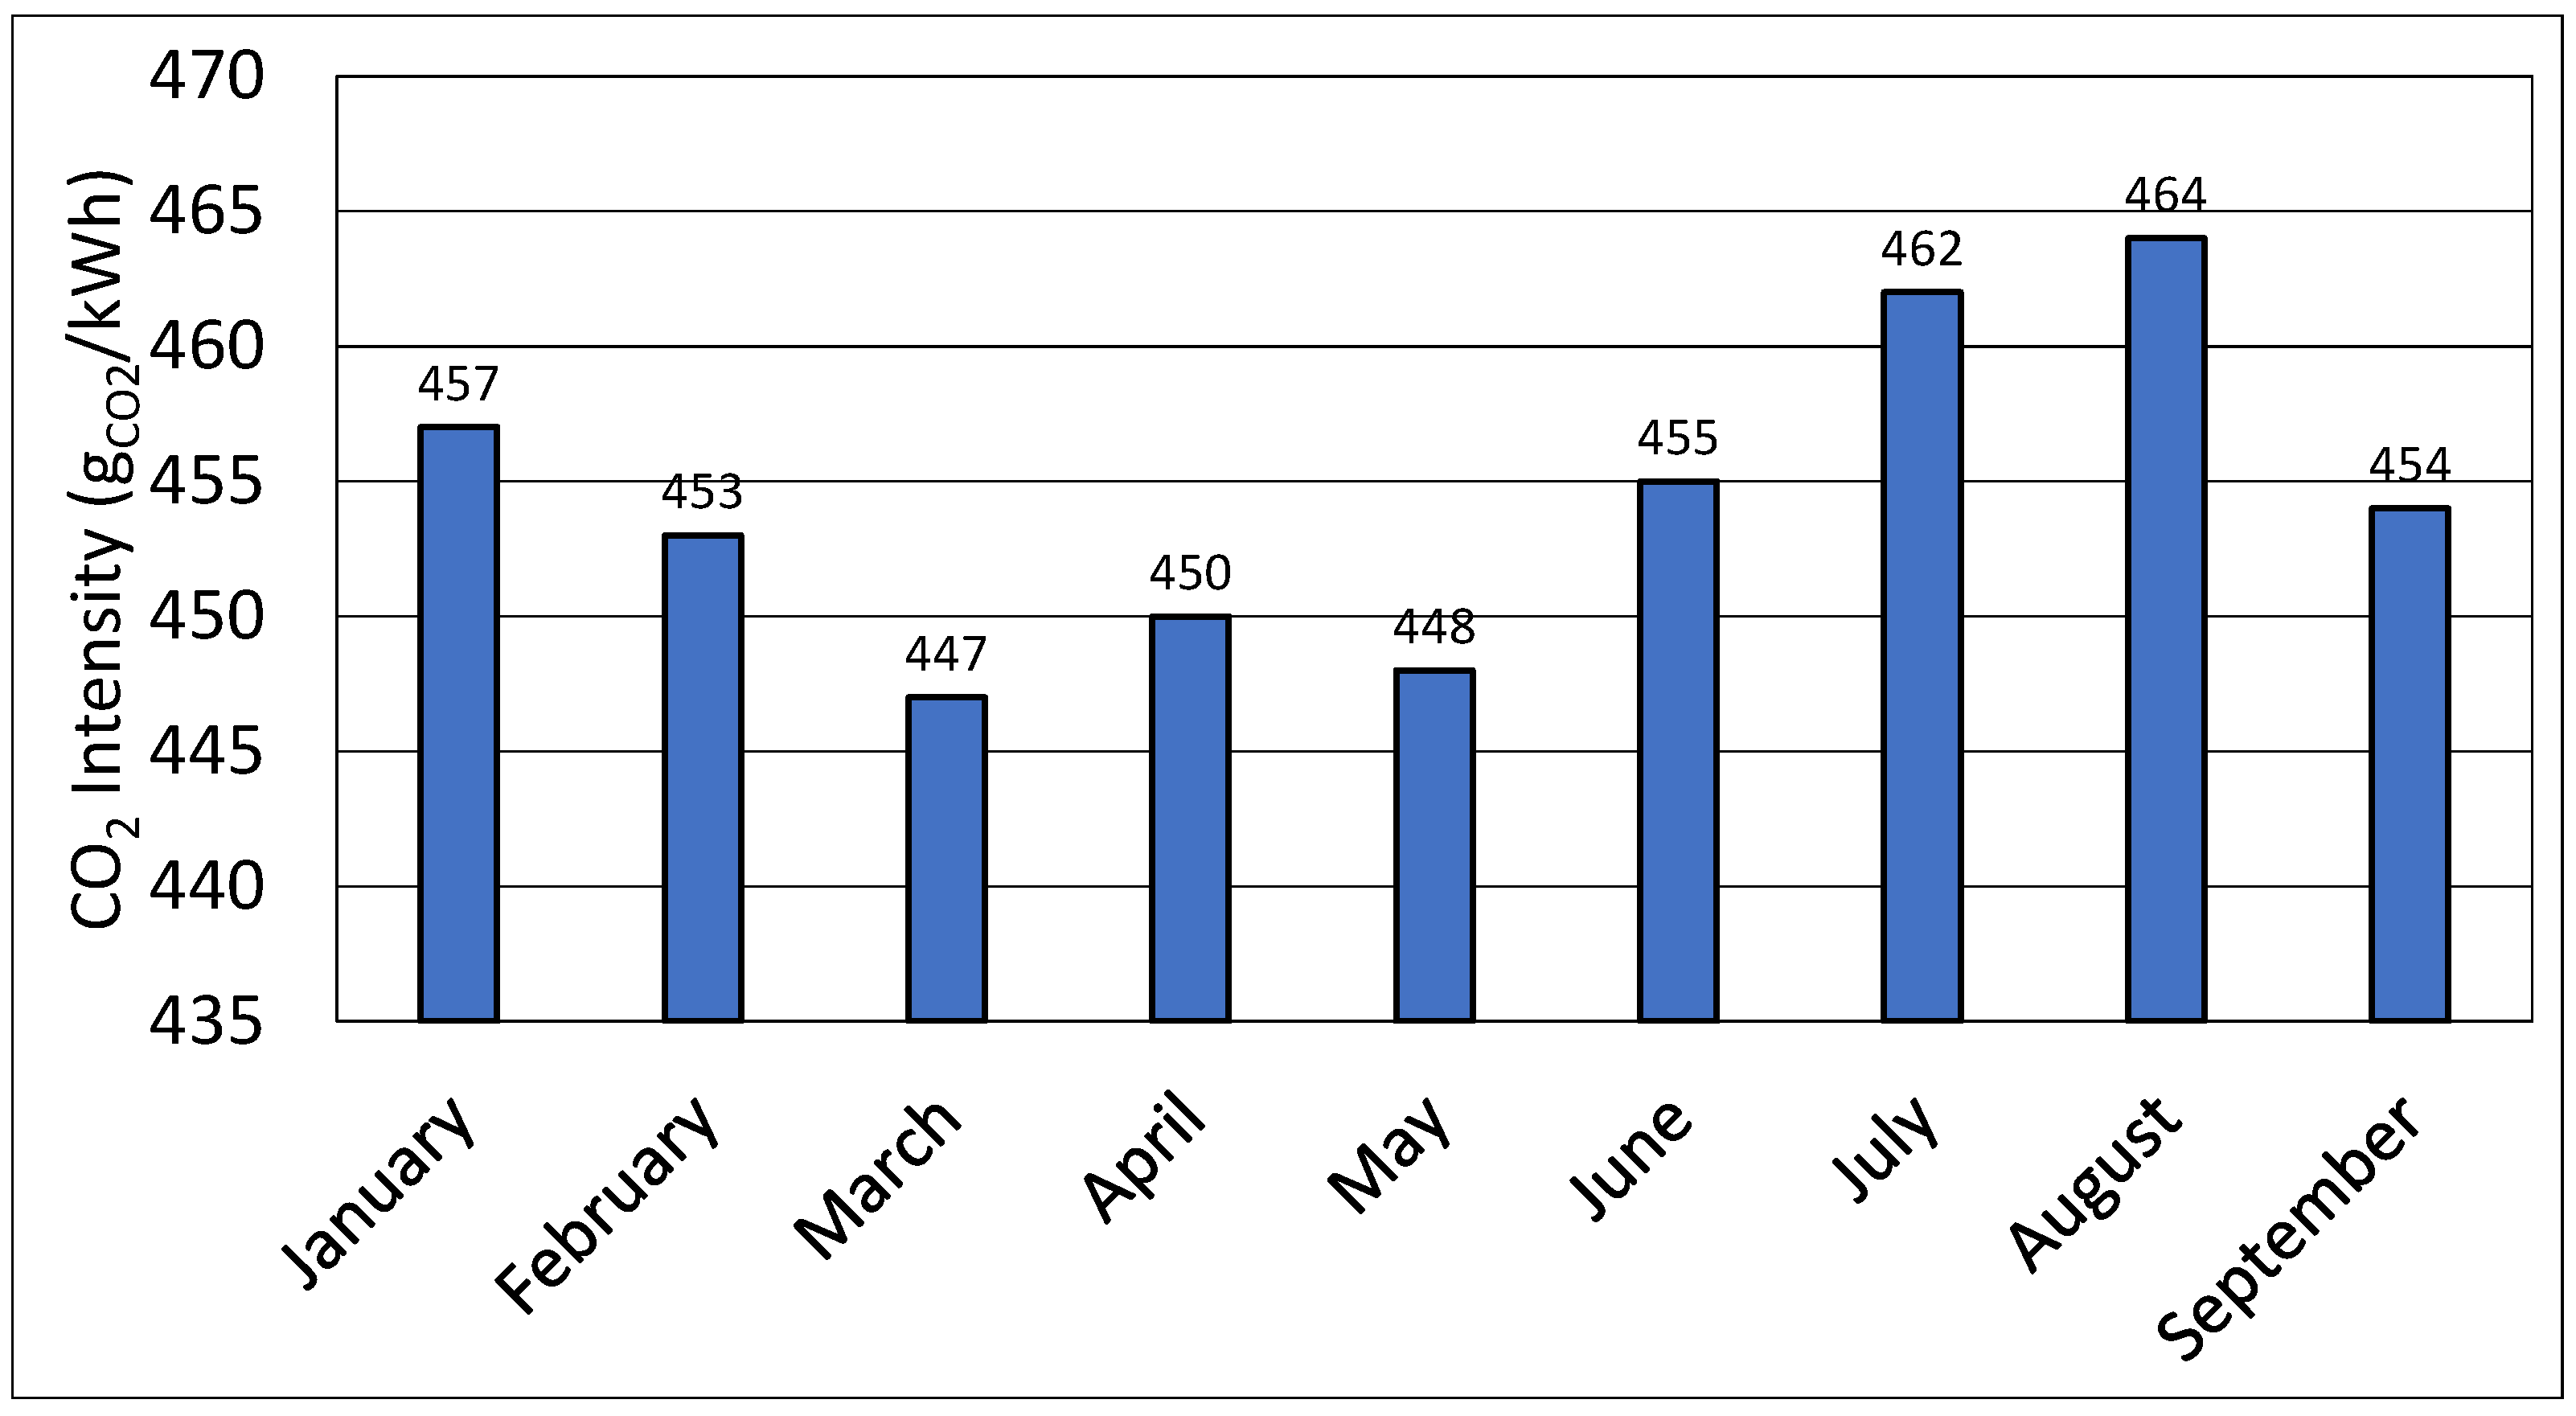
In terms of ICE-related CO2 emissions, the CO2 emission factor of gasoline accounts for both tailpipe and upstream emissions. For electricity-related CO2 emissions, the emission factor depends on the region and the CO2 intensity of the electricity generation grid in that region. Figure 14 presents the CO2 intensity data for electricity generation in Alberta for the year 2022, during which the vehicle was tested. This value does not vary significantly between different months of the year or between winter and summer. Therefore, the average value can be used year-round. The average CO2 intensity of Alberta’s electricity grid was 455 gCO2/kWh in 2022, which was one of the highest CO2 intensities in Canada [8].
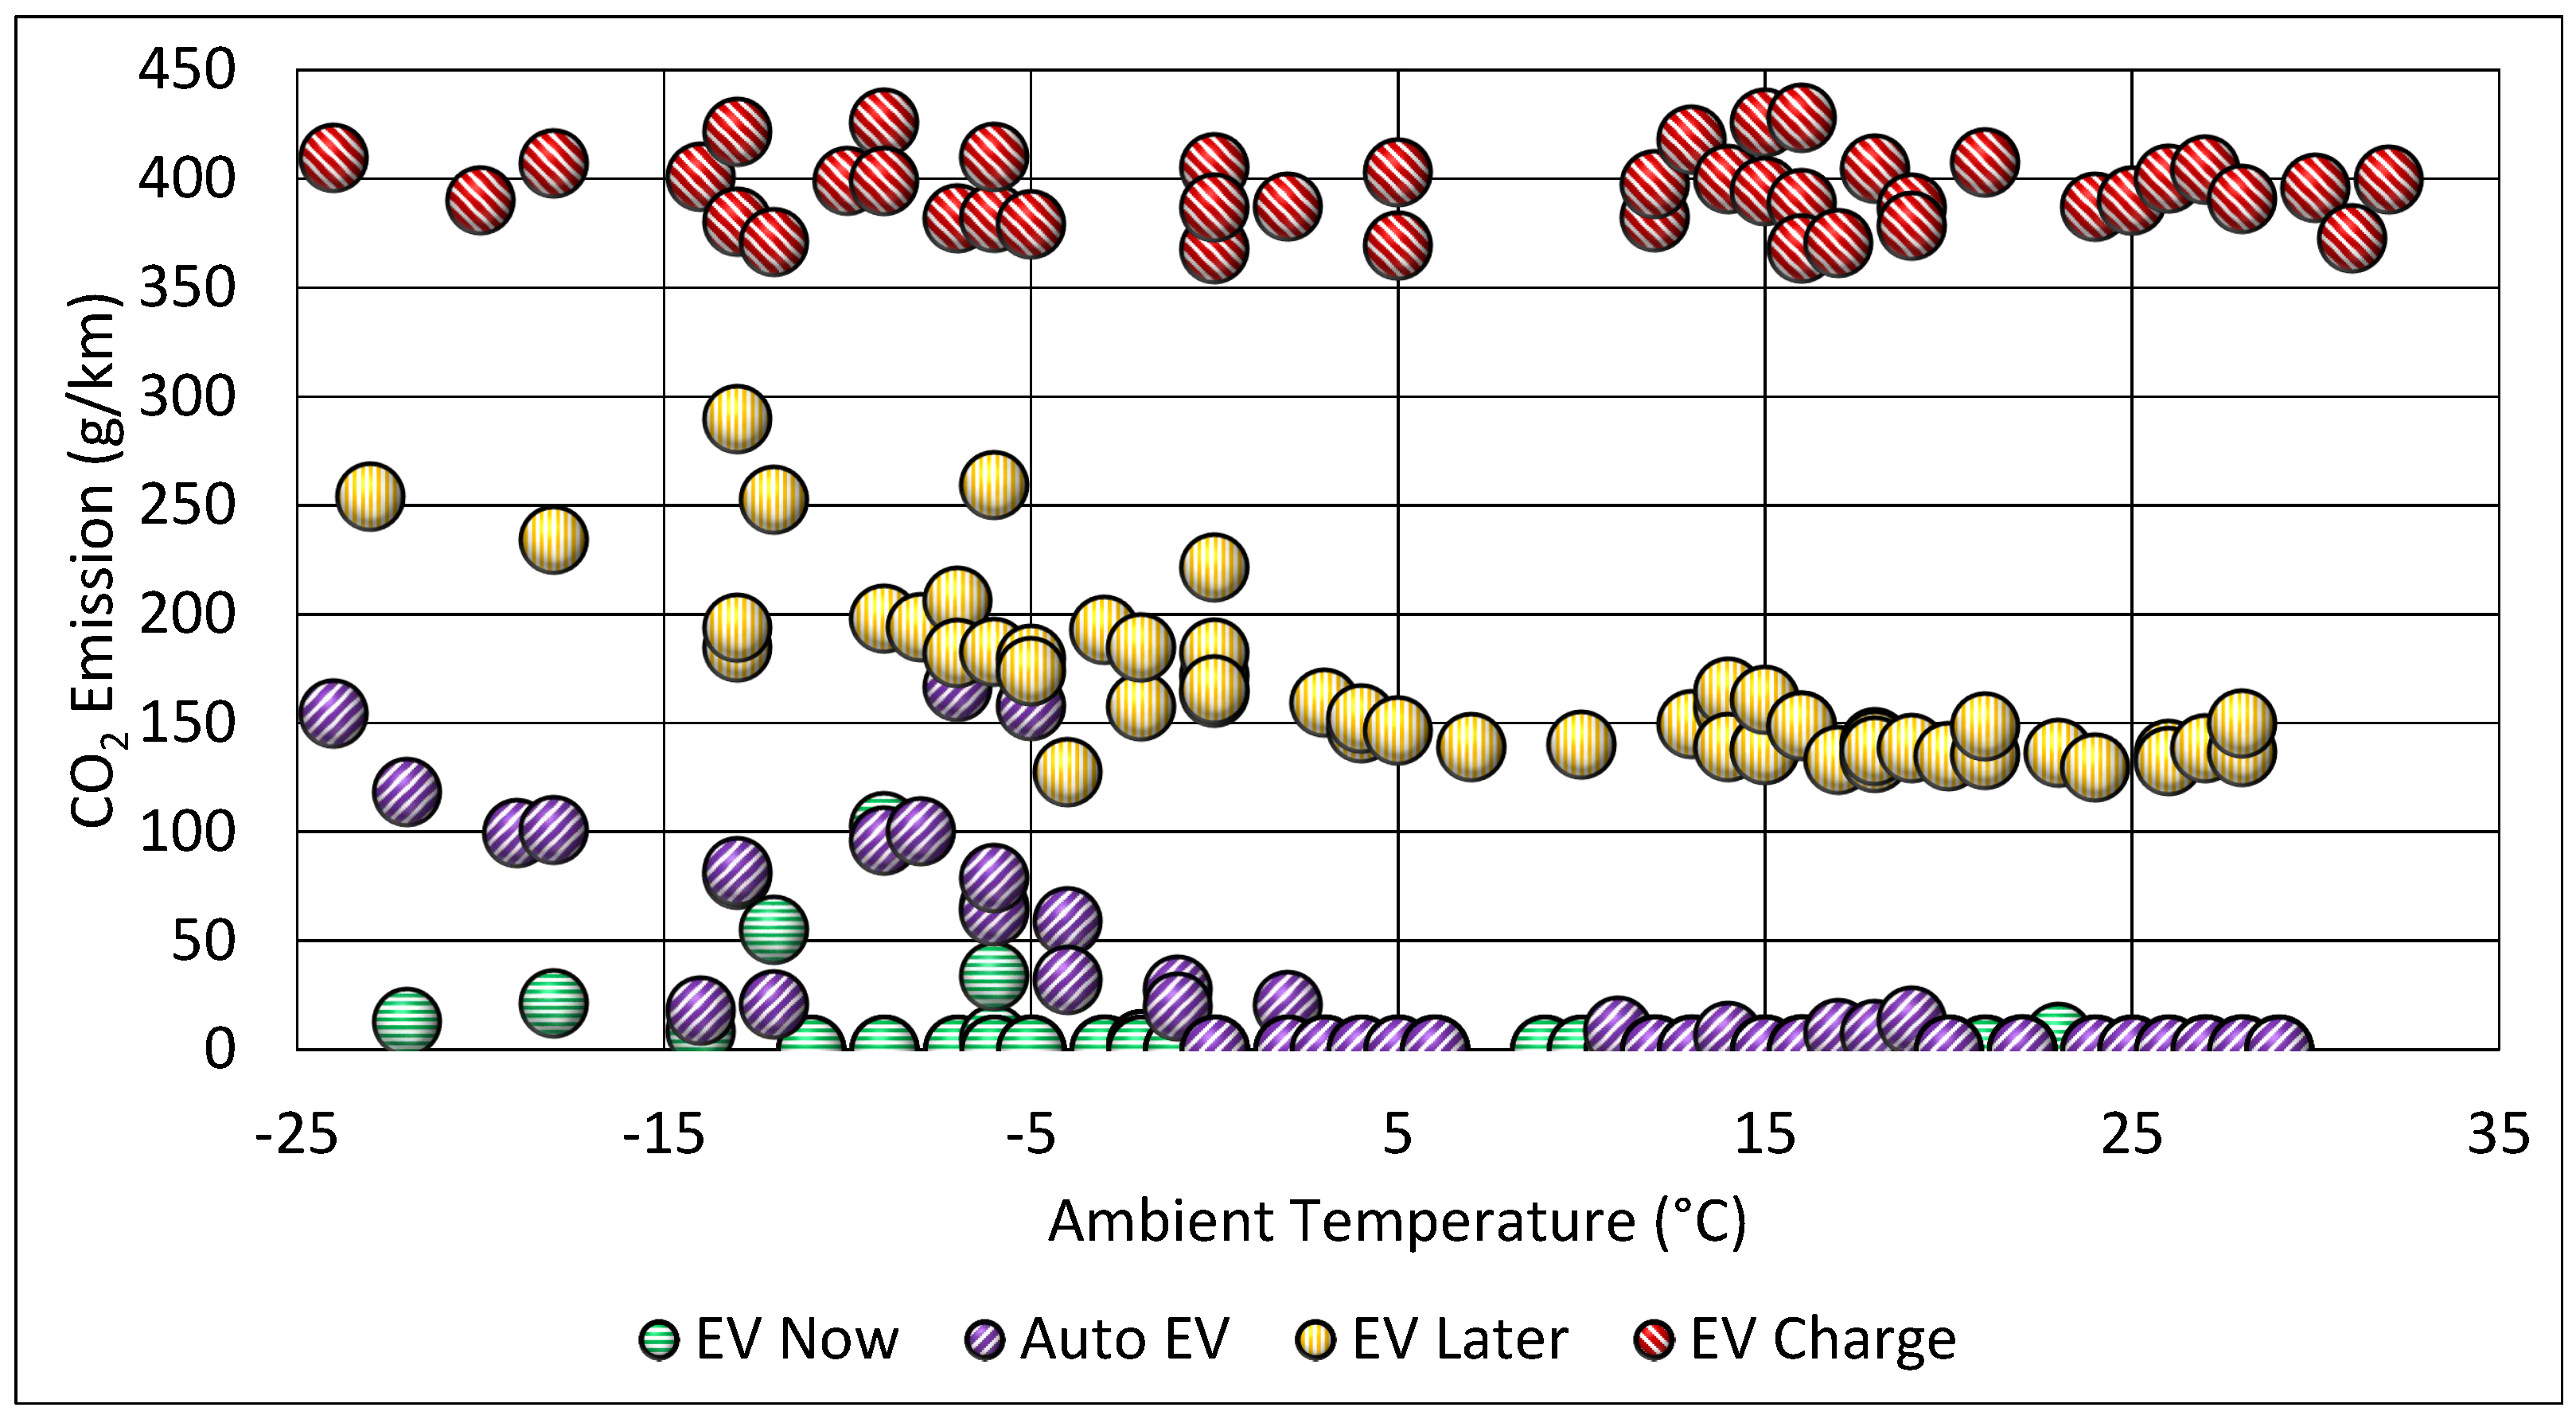
Figure 15 shows the total CO2 emissions of different powertrain modes across various ambient temperatures. In Figure 15a, the total CO2 emissions for each individual test are displayed. Figure 15b categorizes the ambient temperature into bins and shows the average CO2 emissions for the tests within each temperature bin. The findings indicate that as the Tamb decreased, there was an increase in total CO2 emissions, particularly prominent in ambient temperatures below 10 °C. In electrified powertrain modes (i.e., Auto EV, EV Now, and EV Later), the effect of the ambient temperature was significant, with lower temperatures leading to substantially higher CO2 emissions. For instance, the Auto EV and EV Now modes demonstrated the lowest total CO2 emissions at high and normal ambient temperatures (i.e., >10 °C). However, at low temperatures (i.e., <10 °C), they exhibited a sharp increase in total CO2 emissions, approaching the levels of the EV Charge mode, which continuously operates the ICE for propulsion and battery charging. This is primarily because the electrified modes depend on battery electric energy for cabin heating, resulting in increased emissions when considering Alberta’s power grid CO2 intensity for electric power generation (Figure 14). With advancements in renewable electricity generation and a reduction in the CO2 intensity of the grid, the effect of the ambient temperature on the CO2 emissions of electrified powertrain modes will be reduced.
Table 9 compares total CO2 emissions at the minimum and maximum tested Tamb. By reducing the ambient temperature from 29 °C to −22 °C in EV Now mode, CO2 emissions increased by almost 3.6 times, from the lowest of 57 g/km to 206 g/km. Similarly, in Auto EV mode, CO2 emissions rose 3.9 times when Tamb dropped from 29 °C to −24 °C. In EV Later mode, CO2 emissions increased by 70% as the temperature decreased from 28 °C to −23 °C, rising from 150 g/km to 259 g/km. These results emphasize that the influence of the Tamb on CO2 emissions is more pronounced in the modes that extensively utilize electric motors in a region like Alberta where the electricity generation is highly carbon intensive. The effect of the Tamb on CO2 emissions was least pronounced in EV Charge mode, with only a 8% increase. This means changing the Tamb had less effect on the tailpipe CO2 emissions related to the ICE.
Figure 16 shows the vehicle total CO2 emissions if Alberta’s electricity power grid used 100% renewable energy sources (i.e., 0 gCO2/kWh). Comparing Figure 15 and Figure 16 shows the importance of the need for combined efforts of decarbonizing electric power grid, powertrain electrification, and decarbonizing ICE technologies (e.g., by using zero- or low-carbon fuels like hydrogen, natural gas, and ethanol).

4. Summery and Conclusions

The effect of the ambient temperature on the energy consumption and CO2 emissions of a plug-in hybrid electric vehicle was studied. Real-world data on energy consumption and vehicle operation were collected by driving the vehicle in different powertrain modes (internal combustion engine, electric, and hybrid electric) on a representative route of urban and highway driving conditions. The testing route was located in Edmonton, with a wide range of ambient temperatures, including extremely cold winter. On-road data from a 9-month trial for a total of 199 tests (4150 km) were used for the analysis in this work, covering ambient temperatures from −24 °C to 32 °C. The equivalent energy consumptions of burned gasoline and consumed electricity were added together for all powertrain modes. The total CO2 emissions were also estimated by considering both tailpipe CO2 emissions and the upstream CO2 emissions of gasoline production and electricity generation in Alberta, Canada.
Energy consumption of different powertrain modes: For the EV Charge powertrain mode in which the internal combustion engine continuously powered the vehicle while charging the electric battery, the energy consumption was not affected significantly by variations in th ambient temperature. EV Now powertrain mode is very sensitive to variations in the ambient temperature. For instance, when the temperature dropped from 28 °C to −22 °C, energy consumption increased by 233%, mainly because of the energy consumption needed for cabin heating. In the Auto EV (charge-depleting hybrid electric) and EV Later (charge-sustaining hybrid electric) modes, low ambient temperatures increased the energy consumption dramatically, with a more prominent increase for the charge-depleting mode. Dropping the ambient temperature from ∼28 °C to ∼−24 °C increased energy consumption by about 350% for the Auto EV and 85% for the EV Later mode. In general, the effect of cold temperature was more substantial on the energy consumption of those powertrain modes that rely more on electric energy than the ICE.
Vehicle cold start: Low ambient temperatures affected the vehicle’s cold start by increasing the warm-up time of different vehicle components before they reached their normal thermal conditions. For instance, at an ambient temperature of −6 °C, the engine coolant warm-up time was 100% longer compared to an ambient temperature of 16 °C in EV Charge mode. The aftertreatment system light-off time (i.e., the time from the vehicle start until the three-way catalyst reaches 300 °C) increased by 80% when the cold start temperature dropped from 26 °C to −13 °C in EV Later mode.
CO2 emissions: Decreasing the ambient temperature from ∼30 °C to ∼−23 °C increased the total CO2 emissions of all powertrain modes, with the most drastic effect on the EV Now and Auto EV modes (a 290% and 260% increase, respectively) and the least effect on the EV Charge mode (8%). The CO2 intensity of the power grid (gCO2/kWh) must be considered for each region to determine the CO2-minimal operation mode for a plug-in hybrid powertrain. Regions with a low CO2 intensity of the power grid, a moderate climate, and short traveling distances are the ideal regions for the use of electric and plug-in hybrid electric vehicles.
Future work in this area could complement this research by designing experiments to measure a broader spectrum of emissions, including carbon monoxide, nitrogen oxides, unburned hydrocarbons, and particulate matter, to analyze the effect of ambient temperature and cold start conditions on these emissions. Additionally, investigating the effect of road surface conditions on energy consumption and emissions across different powertrain modes will provide a more comprehensive assessment of the impact of cold climates on vehicle performance.
Author Contributions

Conceptualization, H.A. and M.S.; methodology, A.A., H.A. and M.S.; validation, H.A. and M.S.; formal analysis, A.A., H.A. and M.S.; resources, M.S.; data collection, A.A.; writing—original draft preparation, A.A.; writing—review and editing, H.A. and M.S.; visualization, A.A.; supervision, M.S.; project administration, M.S.; funding acquisition, M.S. All authors have read and agreed to the published version of the manuscript.

Funding

This research was funded by the University of Alberta’s Energy Management and Sustainable Operations (EMSO) office under the Campus Sustainability Grant (contract #RES0063884), and the Natural Sciences and Engineering Research Council of Canada (NSERC, contract #RGPIN-2020-04403).

Data Availability Statement

The original contributions presented in the study are included in the article, further inquiries can be directed to the corresponding author.

Acknowledgments

The authors express their gratitude to Jim Laverty, the fleet manager of the University of Alberta, and the staff of the University Service Station for their assistance with vehicle instrumentation. Additionally, the authors extend their appreciation to Charles Robert Koch and Vahid Hosseini for their review and feedback during a part of the study.

Conflicts of Interest

The authors declare no conflicts of interest.

Abbreviations

ICE  Internal Combustion Engine
OBD  On-board Diagnostics
PHEV  Plug-in Hybrid Electric Vehicle
HEV  Hybrid Electric Vehicle
EV  Electric Vehicle
Tamb  Ambient Temperature
FTP  Federal Test Procedure
RDE  Real Driving Emission
BEVBattery Electric Vehicle
SOCState of Charge
BEVXRange-Extended Battery Electric Vehicle
UDDSUrban Dynamometer Driving Schedule
HWFETHighway Fuel Economy Test
SFTPSupplemental Federal Test Procedures
EPAU.S. Environmental Protection Agency
TWCThree-Way Catalyst
HVACHeating, Ventilation, and Air Conditioning
SFTPSupplemental Federal Test Procedures
CANController Area Network
ECEnergy Consumption
SUVSport Utility Vehicle

References

  1. Borgstedt, P.; Neyer, B.; Schewe, G. Paving the Road to Electric Vehicles—A Patent Analysis of the Automotive Supply Industry. J. Clean. Prod. 2017, 167, 75–87. [Google Scholar] [CrossRef]
  2. Pielecha, J.; Skobiej, K.; Kurtyka, K. Exhaust emissions and energy consumption analysis of conventional, hybrid, and electric vehicles in real driving cycles. Energies 2020, 13, 6423. [Google Scholar] [CrossRef]
  3. Abediasl, H.; Balazadeh Meresht, N.; Alizadeh, H.; Shahbakhti, M.; Koch, C.R.; Hosseini, V. Road transportation emissions and energy consumption in cold climate cities. Urban Clim. 2023, 52, 101697. [Google Scholar] [CrossRef]
  4. Grimaldi, F.M.; Capaldi, P. The Effectiveness of HEVs Phase-Out by 2035 in Favor of BEVs with Respect to the Production of CO2 Emissions: The Italian Case. Energies 2024, 17, 961. [Google Scholar] [CrossRef]
  5. Xu, B.; Sharif, A.; Shahbaz, M.; Dong, K. Have electric vehicles effectively addressed CO2 emissions? Analysis of eight leading countries using quantile-on-quantile regression approach. Sustain. Prod. Consum. 2021, 27, 1205–1214. [Google Scholar] [CrossRef]
  6. Wu, D.; Guo, F.; Field, F.R., III; De Kleine, R.D.; Kim, H.C.; Wallington, T.J.; Kirchain, R.E. Regional heterogeneity in the emissions benefits of electrified and lightweighted light-duty vehicles. Environ. Sci. Technol. 2019, 53, 10560–10570. [Google Scholar] [CrossRef] [PubMed]
  7. Wine, O.; Osornio Vargas, A.; Campbell, S.M.; Hosseini, V.; Koch, C.R.; Shahbakhti, M. Cold climate impact on air-pollution-related health outcomes: A scoping review. Int. J. Environ. Res. Public Health 2022, 19, 1473. [Google Scholar] [CrossRef] [PubMed]
  8. Environment and Natural Resources Canada. Live 24/7 CO2 Emissions of Electricity Consumption. Available online: https://app.electricitymaps.com/zone/CA-AB (accessed on 21 May 2024).
  9. Khameneian, A.; Dice, P.; Duncan, J.; Naber, J.D.; Shahbakhti, M.; Archer, C.; Moilanen, P.; Glugla, C.; Huberts, G. Dynamic individual-cylinder analysis of a Gasoline Direct Injection engine emissions for cold crank-start at elevated cranking speed conditions of a Hybrid Electric Vehicle. Control Eng. Pract. 2022, 129, 105349. [Google Scholar] [CrossRef]
  10. Hemmati, S.; Doshi, N.; Hanover, D.; Morgan, C.; Shahbakhti, M. Integrated cabin heating and powertrain thermal energy management for a connected hybrid electric vehicle. Appl. Energy 2021, 283, 116353. [Google Scholar] [CrossRef]
  11. Phlips, P.; Megli, T.; Ruona, W. Unified power-based analysis of combustion engine and battery electric vehicle energy consumption. SAE Int. J. Adv. Curr. Pract. Mobil. 2022, 4, 1598–1609. [Google Scholar] [CrossRef]
  12. Basciotti, D.; Dvorak, D.; Gellai, I. A novel methodology for evaluating the impact of energy efficiency measures on the cabin thermal comfort of electric vehicles. Energies 2020, 13, 3872. [Google Scholar] [CrossRef]
  13. Al-Wreikat, Y.; Serrano, C.; Sodré, J.R. Effects of ambient temperature and trip characteristics on the energy consumption of an electric vehicle. Energy 2022, 238, 122028. [Google Scholar] [CrossRef]
  14. Ghobadpour, A.; Kelouwani, S.; Amamou, A.; Agbossou, K.; Zioui, N. A brief review of plug-in hybrid electric vehicles operation in cold climates. In Proceedings of the IEEE Vehicle Power and Propulsion Conference (VPPC), Hanoi, Vietnam, 14–17 October 2019; pp. 1–5. [Google Scholar]
  15. Prati, M.V.; Costagliola, M.A.; Giuzio, R.; Corsetti, C.; Beatrice, C. Emissions and energy consumption of a plug-in hybrid passenger car in Real Driving Emission (RDE) test. Transp. Eng. 2021, 4, 100069. [Google Scholar] [CrossRef]
  16. Wang, Y.; Wen, Y.; Zhu, Q.; Luo, J.; Yang, Z.; Su, S.; Wang, X.; Hao, L.; Tan, J.; Yin, H.; et al. Real driving energy consumption and CO2 & pollutant emission characteristics of a parallel plug-in hybrid electric vehicle under different propulsion modes. Energy 2022, 244, 123076. [Google Scholar]
  17. Frey, H.C.; Zheng, X.; Hu, J. Variability in measured real-world operational energy use and emission rates of a plug-in hybrid electric vehicle. Energies 2020, 13, 1140. [Google Scholar] [CrossRef]
  18. Al-Wreikat, Y.; Serrano, C.; Sodré, J.R. Driving behaviour and trip condition effects on the energy consumption of an electric vehicle under real-world driving. Appl. Energy 2021, 297, 117096. [Google Scholar] [CrossRef]
  19. Ribberink, H.; Loiselle-Lapointe, A.; Conde, A. Chevrolet Volt On-Road Test Programs in Canada. Part 2: Evaluation of Gasoline Displacement and Extreme Weather Performance in Comparison with Other Vehicles Types. World Electr. Veh. J. 2015, 7, 154–165. [Google Scholar] [CrossRef]
  20. Reyes, J.R.D.; Hoemsen, R.; Parsons, R.V. Cold weather travel range and energy consumption of the Chevrolet Volt PHEV. In Proceedings of the IEEE Vehicle Power and Propulsion Conference (VPPC), Montreal, QC, Canada, 19–22 October 2015; pp. 1–6. [Google Scholar]
  21. Reyes, J.R.M.D.; Parsons, R.V.; Hoemsen, R. Winter happens: The effect of ambient temperature on the travel range of electric vehicles. IEEE Trans. Veh. Technol. 2016, 65, 4016–4022. [Google Scholar] [CrossRef]
  22. Suarez-Bertoa, R.; Pavlovic, J.; Trentadue, G.; Otura-Garcia, M.; Tansini, A.; Ciuffo, B.; Astorga, C. Effect of low ambient temperature on emissions and electric range of plug-in hybrid electric vehicles. ACS Omega 2019, 4, 3159–3168. [Google Scholar] [CrossRef]
  23. Lohse-Busch, H.; Duoba, M.; Rask, E.; Stutenberg, K.; Gowri, V.; Slezak, L.; Anderson, D. Ambient Temperature (20 F, 72 F and 95 F) Impact on Fuel and Energy Consumption for Several Conventional Vehicles, Hybrid and Plug-in Hybrid Electric Vehicles and Battery Electric Vehicle; Technical Report, SAE Technical Paper 2013-01-1462; SAE International: Warrendale, PA, USA, 2013. [Google Scholar]
  24. U.S. Environmental Protection Agency. Available online: https://www.fueleconomy.gov/feg/Find.do?action=sbs&amp;id=43912 (accessed on 11 February 2023).
  25. U.S. Environmental Protection Agency. Available online: https://www.fueleconomy.gov/feg/fe_test_schedules.shtml (accessed on 20 February 2023).
  26. ISO/IEC 17025:2017; General Requirements for the Competence of Testing and Calibration Laboratories. International Organization for Standardization: Geneva, Switzerland, 2017.
  27. U.S. Environmental Protection Agency. Federal Test Procedure Review Project: Preliminary Technical Report; Technical Report 420-R-93-007; U.S. Environmental Protection Agency: Washington, DC, USA, 1993.
  28. Kritsanaviparkporn, E.; Baena-Moreno, F.M.; Reina, T. Catalytic converters for vehicle exhaust: Fundamental aspects and technology overview for newcomers to the field. Chemistry 2021, 3, 630–646. [Google Scholar] [CrossRef]
  29. Kim, H.C.; Wallington, T.J. Life cycle assessment of vehicle lightweighting: A physics-based model to estimate use-phase fuel consumption of electrified vehicles. Environ. Sci. Technol. 2016, 50, 11226–11233. [Google Scholar] [CrossRef] [PubMed]
  30. McLaren, J.; Miller, J.; O’Shaughnessy, E.; Wood, E.; Shapiro, E. CO2 emissions associated with electric vehicle charging: The impact of electricity generation mix, charging infrastructure availability and vehicle type. Electr. J. 2016, 29, 72–88. [Google Scholar] [CrossRef]
  31. Kelly, J.C.; Elgowainy, A.; Isaac, R.; Ward, J.; Islam, E.; Rousseau, A.; Sutherland, I.; Wallington, T.J.; Alexander, M.; Muratori, M.; et al. Cradle-to-Grave Lifecycle Analysis of US Light-Duty Vehicle-Fuel Pathways: A Greenhouse Gas Emissions and Economic Assessment of Current (2020) and Future (2030–2035) Technologies; Technical Report ANL-22/27; Argonne National Laboratory: Argonne, IL, USA, 2023.
  32. Environment and Climate Change Canada. National Inventory Report: Greenhouse Gas Sources and Sinks in Canada; Technical Report 1910-7064; Environment and Climate Change Canada: Toronto, ON, Canada, 2022.
  33. Bergero, C.; Binsted, M.; Younis, O.; Davies, E.G.; Siddiqui, M.S.; Xing, R.; Arbuckle, E.J.; Chiappori, D.V.; Fuhrman, J.; McJeon, H.; et al. Technology, technology, technology: An integrated assessment of deep decarbonization pathways for the Canadian oil sands. Energy Strategy Rev. 2022, 41, 100804. [Google Scholar] [CrossRef]
  34. Sleep, S.; Guo, J.; Laurenzi, I.J.; Bergerson, J.A.; MacLean, H.L. Quantifying variability in well-to-wheel greenhouse gas emission intensities of transportation fuels derived from Canadian oil sands mining operations. J. Clean. Prod. 2020, 258, 120639. [Google Scholar] [CrossRef]
  35. Nimana, B.; Canter, C.; Kumar, A. Life cycle assessment of greenhouse gas emissions from Canada’s oil sands-derived transportation fuels. Energy 2015, 88, 544–554. [Google Scholar] [CrossRef]
  36. Guo, J.; Orellana, A.; Sleep, S.; Laurenzi, I.J.; MacLean, H.L.; Bergerson, J.A. Statistically enhanced model of oil sands operations: Well-to-wheel comparison of in situ oil sands pathways. Energy 2020, 208, 118250. [Google Scholar] [CrossRef]
Figure 1. Global average temperature in December, January, and February. Reprinted from [3] with the permission of Elsevier.
Energies 17 03566 g001
Figure 2. Major influencing factors on the energy consumption and CO2 emissions of a vehicle. White blocks show the focus areas of this study. HVAC stands for heating, ventilation, and air conditioning.
Energies 17 03566 g002
Figure 3. The Ford Escape PHEV used in this study.
Energies 17 03566 g003
Figure 4. The fuel flow meter installed on the fuel line of the vehicle.
Energies 17 03566 g004
Figure 5. Schematics of the vehicle instrumentation and data collection process in this study.
Energies 17 03566 g005
Figure 6. The 20 km driving route in this study, including urban and highway areas.
Energies 17 03566 g006
Figure 7. Procedure diagram for calculating vehicle energy consumption and CO2 emissions in this study.
Energies 17 03566 g007
Figure 8. Values of Tamb for all the vehicle tests specified for each powertrain mode. (a) Auto EV mode; (b) EV Now mode; (c) EV Later mode; (d) EV Charge mode.
Energies 17 03566 g008
Figure 9. Ambient temperature for vehicle tests with a cold start in each powertrain mode.
Energies 17 03566 g009
Figure 10. Three-way catalyst (TWC) temperature during cold start in each powertrain mode. The values in the legend show the ambient temperature for the presented test. (a) Auto EV mode; (b) EV Now mode; (c) EV Later mode; (d) EV Charge mode.
Energies 17 03566 g010
Figure 11. Engine coolant temperature during cold start in each powertrain mode. The values in the legend show the ambient temperature for the presented test. (a) Auto EV mode; (b) EV Now mode; (c) EV Later mode; (d) EV Charge mode.
Energies 17 03566 g011
Figure 12. The vehicle energy consumption for the warm start tests in different powertrain modes.
Energies 17 03566 g012
Figure 13. The vehicle energy consumption for the cold start tests in different powertrain modes.
Energies 17 03566 g013
Figure 14. CO2 intensity (gCO2/kWh) for electric grid power generation in Alberta during the period of this study in 2022 [8]. The average value of 455 gCO2/kWh is used in this study.
Energies 17 03566 g014
Figure 15. Total CO2 emissions of the vehicle in different powertrain modes, taking into account the upstream CO2 emissions from gasoline production [32] and electric grid power generation in Alberta [8]. (a) All trips. (b) Average values for different bins of ambient temperatures. The text within the figure denotes the standard deviation for each value.
Energies 17 03566 g015
Figure 16. Total CO2 emissions of the vehicle in different powertrain modes, with an electricity power grid of zero CO2 intensity.
Energies 17 03566 g016
Table 1. Summary of previous studies for analyzing the effect of powertrain modes and the Tamb on light-duty PHEV energy consumption and CO2 emissions along with this study.
StudyTambPowertrain ModeTest Condition
Prati et al., 2021 [15]Not studiedCharge-depleting, charge-sustainingReal driving
Wang et al., 2022 [16]Not studiedCharge-depleting, charge-sustainingReal driving
Frey et al., 2020 [17]Not studiedCharge-depleting, charge-sustainingReal driving
Al-Wreikat et al., 2021 [18]0 °C to 30 °CEVReal driving
Ribberink et al., 2015 [19]−27 °C to 37 °CCharge-depleting, charge-sustainingReal driving
Reyes et al., 2015 [20]−26 °C to 25 °CCharge-depletingReal driving
Reyes et al., 2016 [21]−25 °C to 25 °CEVReal driving
Suarez-Bertoa et al. 2019 [22]−7 °C, 23 °CEVChassis dynamometer
Lohse-Busch et al., 2013 [23]−6.7 °C, 22.2 °C, 35 °CCharge-depleting, charge-sustainingChassis dynamometer
This Paper−24 °C to 32 °CEV, Charge-depleting, charge-sustaining, ICEReal driving
Table 2. Specifications of the Ford Escape PHEV in this study.
SpecificationDetails
Vehicle body styleCompact sport utility vehicle (SUV)
Fuel typeGasoline / battery
Engine type2.5 L Atkinson cycle I-4
Engine rated power123 kW @ 6250 rpm
Total system power (hybrid and plug-in hybrid)149 kW @ 6250 rpm
Engine rated torque210 N.m @ 4500 rpm
Engine compressor ratio13.0:1
Engine induction systemNaturally aspirated
Transmission typeElectronic continuous variable transmission
High-voltage battery capacity14.4 kWh; providing up to 450 Volts DC
High-voltage battery typeLiquid cooled lithium-ion
Electric motor typeDirect current permanent magnet
Vehicle base curb mass1762 kg
Exhaust aftertreatment systemThree-way catalytic converter
EPA gasoline fuel consumption5.8 L/100 km city/hwy combined
EPA electricity + gasoline fuel consumption2.2 Le/100 km city/hwy combined
EPA electricity energy consumption19.9 kWh/100 km city/hwy combined
Table 3. Specifications of the fuel flow meter in this study.
ParameterValue
Measurement uncertainty+/−0.5% of reading
Repeatability+/−0.15% of reading
Tamb range−40 °C to +120 °C
Measurement flow range8–4000 mL/min
Measurement rateUp to 2.2 kHz
Electrical supply voltage8V DC to 30V DC
Fluid compatibilityGasoline, diesel, bio-diesel, ethanol, methanol
Calibration standardISO/IEC 17025:2017 [26]
Calibration fluid reference temperature0.0 °C
Calibration fluid reference density848.8 kg/m3
Table 4. The data collected through the CANedge2 data logger.
Data SourceParameterUnit
OBD portVehicle speedkm/h
Engine speedrpm
Engine load percentage%
Engine coolant temperature°C
Three-way catalyst temperature°C
Ambient air temperature°C
Fuel flow meterInstantaneous fuel consumptiong/s and mL/s
Cumulative fuel consumptiong and mL
Table 5. The initial conditions used for Ford Escape PHEV tests.
Powertrain ModeSOC at Beginning of Each TestCoolant Temperature for Cold StartsHVAC Setting
Auto EV77 ± 1%Same as Tamb25 °C; Fan Speed 2
EV Now77 ± 1%Same as Tamb25 °C; Fan Speed 2
EV Later77 ± 1%Same as Tamb25 °C; Fan Speed 2
EV Charge0%Same as Tamb25 °C; Fan Speed 2
Table 6. Overview of the conducted Ford Escape PHEV tests.
Powertrain ModeNumber of All TestsNumber of Tests with Cold Start
Auto EV4812
EV Now5321
EV Later5511
EV Charge418
Total19953
Table 7. Energy consumption (EC) of the vehicle in the warm start tests at the extremes of the tested Tamb.
Powertrain ModeMin Tamb (°C)EC (Wh/km)Max Tamb (°C)EC (Wh/km)EC Change (%)
Auto EV−2469229153352
EV Now−2246028138233
EV Later−237182838686
EV Charge−24930328717
Table 8. Energy consumption (EC) of the vehicle in the cold start tests at the extremes of the tested Tamb.
Powertrain ModeMin Tamb (°C)EC (Wh/km)Max Tamb (°C)EC (Wh/km)EC Change (%)
Auto EV−1866125138379
EV Now−1366429126427
EV Later−1382326368124
EV Charge−688916926−4
Table 9. Total CO2 emissions of the vehicle at the extremes of the tested Tamb, based on Alberta’s power grid CO2 intensity.
Powertrain ModeMin Tamb (°C)CO2 Emission (g/km)Max Tamb (°C)CO2 Emission (g/km)
Auto EV−242742970
EV Now−222062957
EV Later−2325928150
EV Charge−2431432290
Disclaimer/Publisher’s Note: The statements, opinions and data contained in all publications are solely those of the individual author(s) and contributor(s) and not of MDPI and/or the editor(s). MDPI and/or the editor(s) disclaim responsibility for any injury to people or property resulting from any ideas, methods, instructions or products referred to in the content.