Modeling the Efficiency of Biogas Plants by Using an Interval Data Analysis Method
Abstract
1. Introduction
2. A Review of Methods of Modeling Processes in Biogas Plants
3. Materials and Methods
3.1. Principle of Functioning of BGP
- The temperature, since different types of microorganisms reproduce optimally at different temperatures. Usually, the temperature regime for fermentation can be from 35 °C to 55 °C;
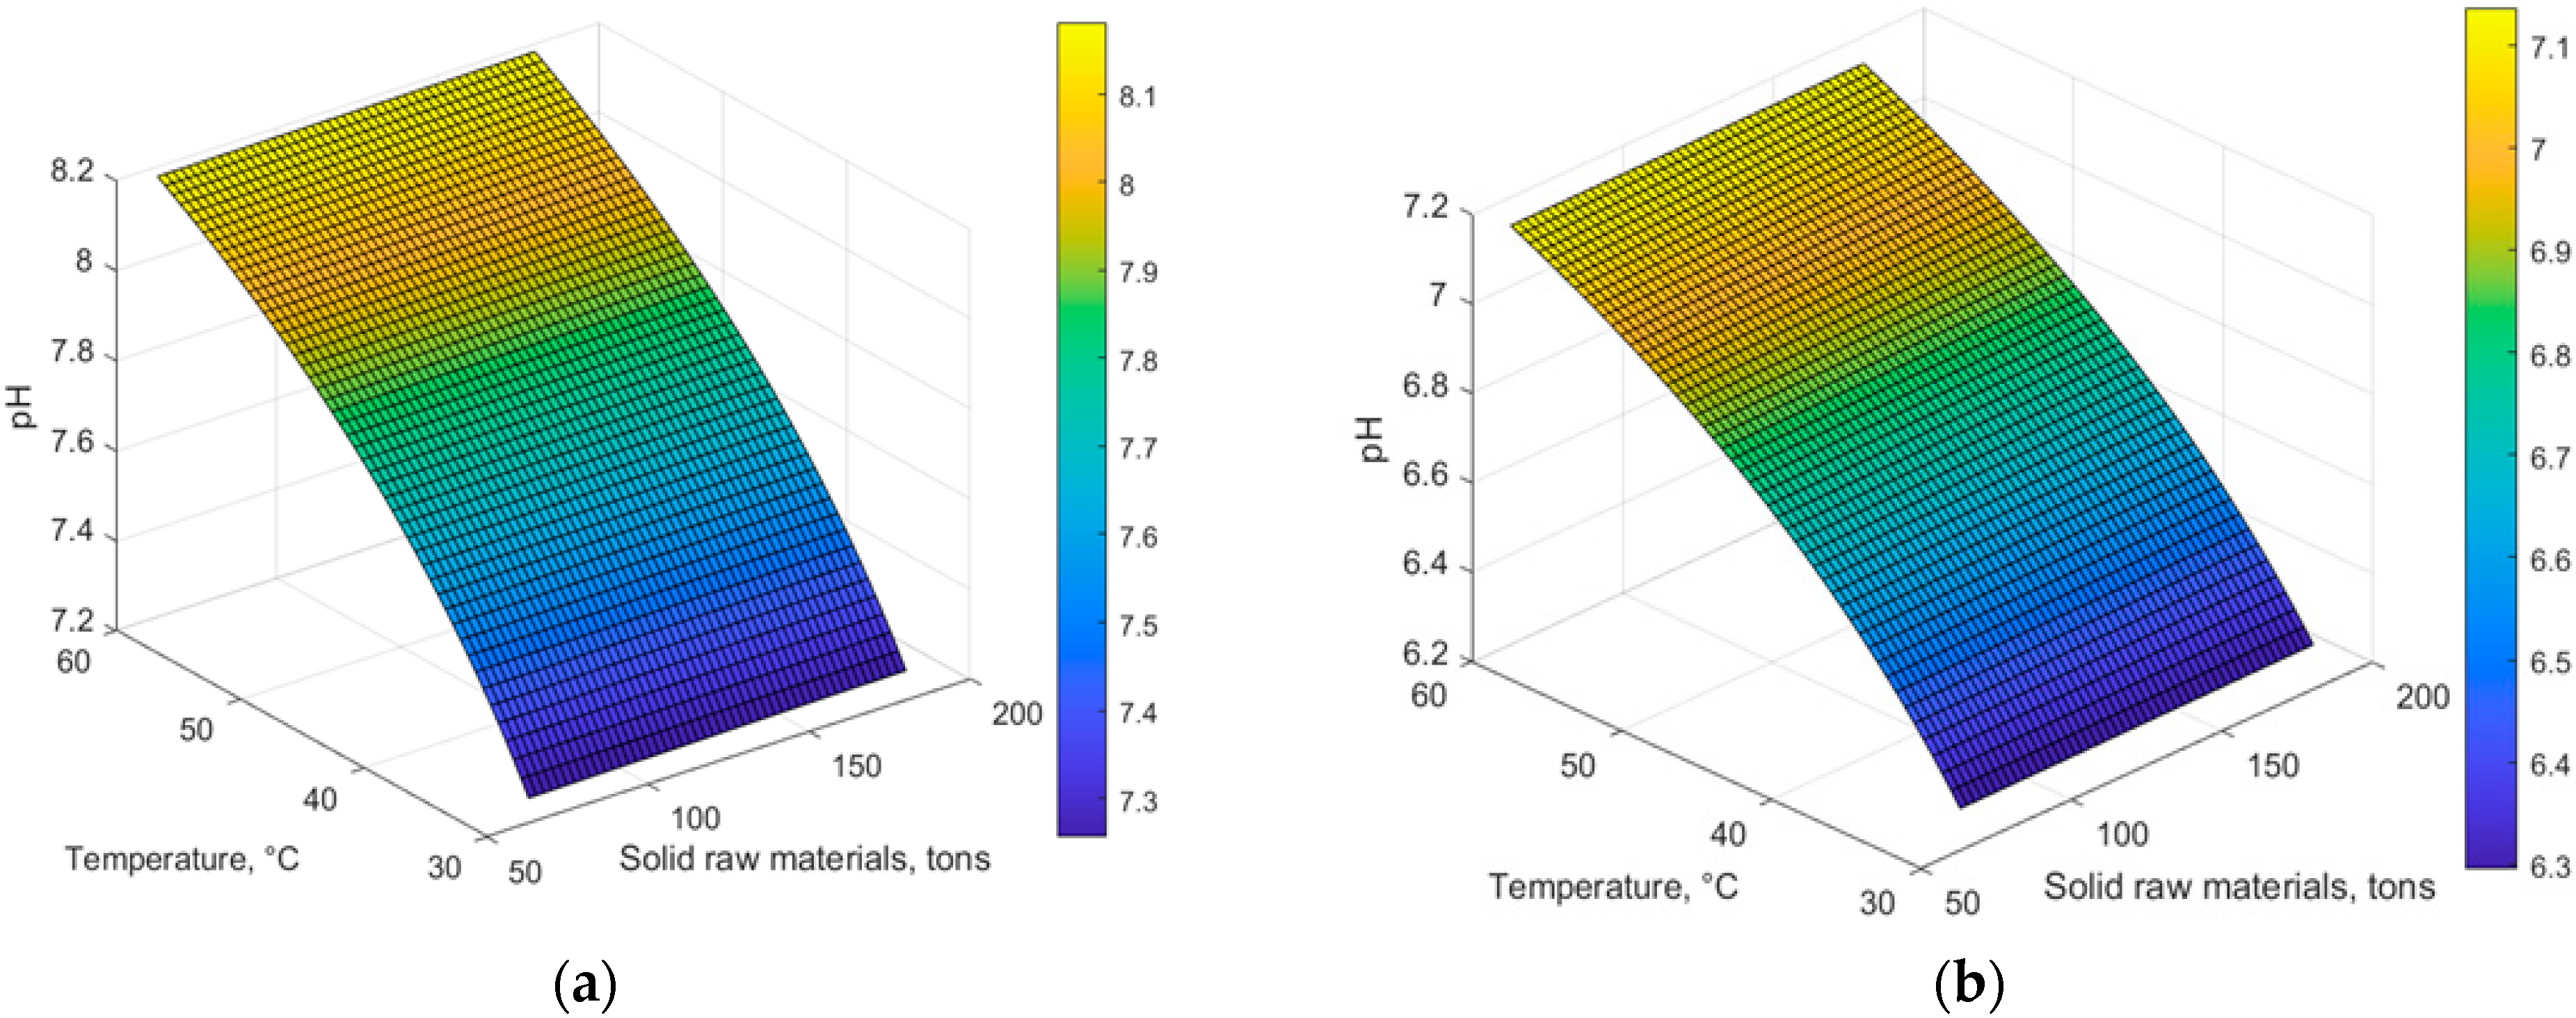
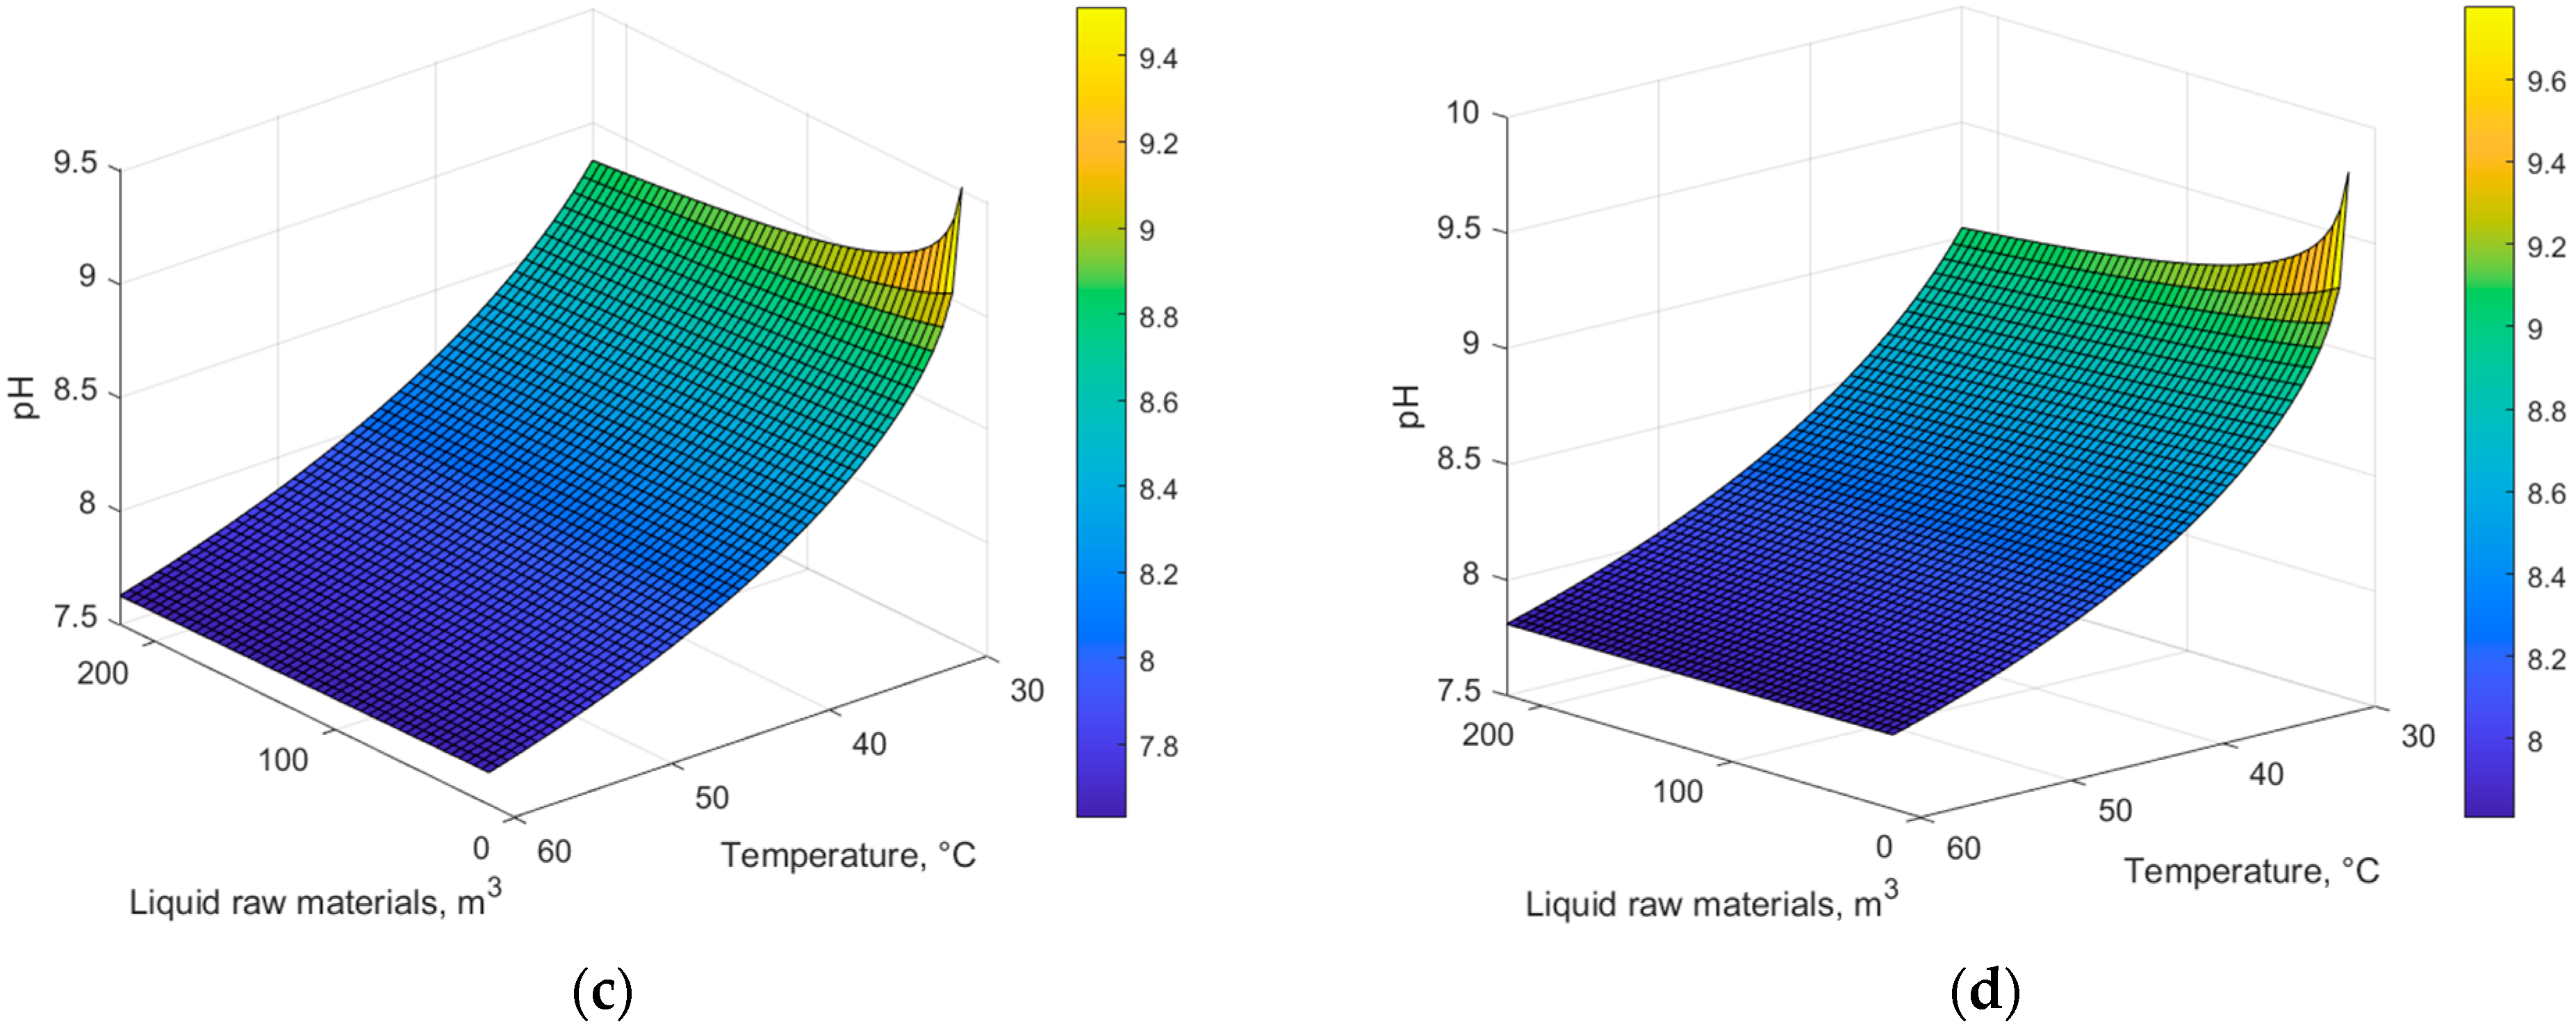
- The pH level, which indicates the concentration of hydrogen ions (H⁺) in a grout, which determines its acidity or alkalinity. Most of the microorganisms involved in fermentation reproduce optimally in a certain range of acidity in the environment. Usually, it can be from 6.5 to 8.5. Regulation of the pH level helps to provide optimal conditions for the growth of microorganisms;
- The fermentation time, which is determined by the decomposition of organic substances and the formation of biogas. It can vary from several days to several weeks, depending on the conditions and type of raw materials;
- The concentration and structure of raw materials: different types of raw materials can be used for biogas production, such as organic waste, biomass, agricultural residues, and others. At the same time, the quantity and quality of the raw material base are of great importance for the efficiency of the production process;
- The raw material humidity, which affects gas formation and mass balance of the process. Usually, the humidity of raw materials should be in the range from 70% to 80%;
- The C/N (carbon/nitrogen) ratio, which is determined by the ratio of the mass of carbon to the mass of nitrogen in the raw material. This is an important parameter, as too little or too much ratio can affect the efficiency of fermentation;
- The intensity of mixing ensures an even distribution of microorganisms and raw materials, which helps to avoid stagnation zones and improves fermentation efficiency.
3.2. The Task Statement and Its Solution
- -
- In the study of statistical data, the non-linear nature of the dependencies was revealed, and the indicator functions allowed modeling a wide range of non-linear dependencies between variables. Power values can define various curve shapes, including polynomial, exponential, and others, which can be adapted to a specific context and produce models that more adequately reflect the properties of the data;
- -
- Compared to some other nonlinear functions, exponential functions can be relatively simple to interpret;
- -
- The use of power functions can allow the building of complex nonlinear dependencies with a smaller number of parameters compared to other nonlinear models.
4. Results and Discussion
5. Conclusions
Author Contributions
Funding
Data Availability Statement
Conflicts of Interest
Abbreviations
| BGP | Biogas Plants |
| ADM | Anaerobic Digestion Model |
| COD | Chemical Oxygen Demand |
| C/N | Carbon/Nitrogen |
| ISNAE | Interval System of Nonlinear Algebraic Equations |
| LLC | Limited Liability Company |
References
- International Energy Agency. Gas Market Report, Q1-2024; IEA Publications: Paris, France, 2024; 87p. [Google Scholar]
- Laskri, N.; Nedjah, N. Comparative Study for Biogas Production from Different Wastes. Int. J. Bio-Sci. Bio-Technol. 2015, 7, 39–46. [Google Scholar] [CrossRef]
- Ellacuriaga, M.; García-Cascallana, J.; Gómez, X. Biogas Production from Organic Wastes: Integrating Concepts of Circular Economy. Fuels 2021, 2, 144–167. [Google Scholar] [CrossRef]
- Shpilevskiy, V.V.; Sapronov, Y.A.; Salashenko, T.I. Analytical aspects of assessment of energy dependence in petroleum-deficit countries. Probl. Econ. 2013, 1, 14–21. [Google Scholar]
- Zhang, C.; Sun, Y.; Cao, T.; Wang, W.; Huo, S.; Liu, Z. Influence of organic load on biogas production and the response of the microbial community in anaerobic digestion of food waste. Int. J. Hydrogen Energy 2022, 47, 32849–32860. [Google Scholar] [CrossRef]
- Piekutin, J.; Puchlik, M.; Haczykowski, M.; Dyczewska, K. The Efficiency of the Biogas Plant Operation Depending on the Substrate Used. Energies 2021, 14, 3157. [Google Scholar] [CrossRef]
- Dawei, Y.; Jibao, L.; Qianwen, S.; Yuansong, W. Biogas-pH automation control strategy for optimizing organic loading rate of an anaerobic membrane bioreactor treating high COD wastewater. Bioresour. Technol. 2015, 203, 62–70. [Google Scholar] [CrossRef]
- Golub, N.; Potapova, M.; Karpenko, Y. Mathematical Modeling of the Biogas Production Process from the Distillery Spent Wash on the First Stage. Innov. Biosyst. Bioeng. 2019, 3, 96–104. [Google Scholar] [CrossRef]
- Ivakhnenko, A.G. Group Method of Data Handling—A Rival of the Method of Stochastic Approximation. Sov. Autom. Control 1966, 13, 43–71. [Google Scholar]
- Dyvak, M.; Manzhula, V.; Kozak, O. New Method Tolerance Estimation of the Parameters Set of Interval Model Based on Saturated Block of ISLAE. In Proceedings of the Experience of Designing and Applications of CAD Systems in Microelectronics of the 9th International Conference, Lviv, Ukraine, 19–24 February 2007; pp. 376–379. [Google Scholar] [CrossRef]
- Dyvak, M. Parameters Identification Method of Interval Discrete Dynamic Models of Air Pollution Based on Artificial Bee Colony Algorithm. In Proceedings of the Advanced Computer Information Technologies (ACIT) of the 10th International Conference, Deggendorf, Germany, 16–18 September 2020; pp. 130–135. [Google Scholar] [CrossRef]
- Dyvak, M.; Melnyk, A.; Rot, A.; Hernes, M.; Pukas, A. Ontology of Mathematical Modeling Based on Interval Data. Complexity 2022, 19, 8062969. [Google Scholar] [CrossRef]
- Ramachandran, A.; Rustum, R.; Adeloye, A.J. Review of Anaerobic Digestion Modeling and Optimization Using Nature-Inspired Techniques. Processes 2019, 7, 953. [Google Scholar] [CrossRef]
- Komarysta, B.; Dzhygyrey, I.; Bendiuh, V.; Yavorovska, O.; Andreeva, A.; Berezenko, K.; Meshcheriakova, I.; Vovk, O.; Dokshyna, S.; Maidanskyi, I. Optimizing biogas production using artificial neural network. East.-Eur. J. Enterp. Technol. 2022, 2, 53–64. [Google Scholar] [CrossRef]
- Cinar, S.; Cinar, S.O.; Wieczorek, N.; Sohoo, I.; Kuchta, K. Integration of Artificial Intelligence into Biogas Plant Operation. Processes 2021, 9, 85. [Google Scholar] [CrossRef]
- Song, Y.-J.; Oh, K.-S.; Lee, B.; Pak, D.-W.; Cha, J.-H.; Park, J.-G. Characteristics of Biogas Production from Organic Wastes Mixed at Optimal Ratios in an Anaerobic Co-Digestion Reactor. Energies 2021, 14, 6812. [Google Scholar] [CrossRef]
- Scarlat, N.; Dallemand, J.-F.; Fahl, F. Biogas: Developments and perspectives in Europe. Renew. Energy. 2018, 129, 457–472. [Google Scholar] [CrossRef]
- Heiker, M.; Kraume, M.; Mertins, A.; Wawer, T.; Rosenberger, S. Biogas Plants in Renewable Energy Systems—A Systematic Review of Modeling Approaches of Biogas Production. Appl. Sci. 2021, 11, 3361. [Google Scholar] [CrossRef]
- Keshtkar, A.; Abolhamd, G.; Meyssami, B.; Ghaforian, H. Modeling of Anaerobic Digestion of Complex Substrates. Iran. J. Chem. Chem. Eng. 2003, 22, 61–74. [Google Scholar] [CrossRef]
- Poggio, D.; Walker, M.; Nimmo, W.; Ma, L.; Pourkashanian, M. Modeling the anaerobic digestion of solid organic waste—Substrate characterisation method for ADM1 using a combined biochemical and kinetic parameter estimation approach. Waste Manag. 2016, 53, 40–54. [Google Scholar] [CrossRef]
- Önen, S.; Kuchta, K. Evaluation of temperature changes in anaerobic digestion process. Detritus 2020, 10, 11–18. [Google Scholar] [CrossRef]
- Mauky, E.; Weinrich, S.; Jacobi, H.-F.; Nägele, H.-J.; Liebetrau, J.; Nelles, M. Demand-driven biogas production by flexible feeding in full-scale—Process stability and flexibility potentials. Anaerobe 2017, 46, 86–95. [Google Scholar] [CrossRef]
- Arzate Salgado, J.A. Modeling and Simulation of Biogas Production Based on Anaerobic Digestion of Energy Crops and Manure; Berlin University of Technology: Berlin, Germany, 2019. [Google Scholar]
- Andrews, J.F. Dynamic Model of the Anaerobic Digestion Process. J. Sanit. Eng. Div. 1969, 95, 95–116. [Google Scholar] [CrossRef]
- Andrews, J.F.; Graef, S.P. Dynamic modelling and Simulation of the Anaerobic Digestion Process. In Anaerobic Biological Treatment Processes; American Chemical Society: Washington, DC, USA, 1971; Volume 105, pp. 126–162. [Google Scholar] [CrossRef]
- Hill, D.T.; Barth, C.L. A dynamic model for simulation of animal waste digestion. J. Water Pollut. Control Fed. 1977, 49, 2129–2143. [Google Scholar]
- Heyes, R.H.; Hall, R.J. Anaerobic digestion modelling? The role of H2. Biotechnol. Lett. 1981, 3, 431–436. [Google Scholar] [CrossRef]
- Hill, D.T. Design parameters and operating characteristics of animal waste anaerobic digestion systems—Swine and poultry. Agric. Wastes 1983, 5, 157–178. [Google Scholar] [CrossRef]
- Mosey, F.E. Mathematical Modelling of the Anaerobic Digestion Process: Regulatory Mechanisms for the Formation of Short-Chain Volatile Acids from Glucose. Water Sci. Technol. 1983, 15, 209–232. [Google Scholar] [CrossRef]
- Costello, D.J.; Greenfield, P.F.; Lee, P.L. Dynamic modelling of a single-stage high-rate anaerobic reactor—I. Model derivation. Water Res. 1991, 25, 847–858. [Google Scholar] [CrossRef]
- Angelidaki, I.; Ahring, B.K. Thermophilic anaerobic digestion of livestock waste: The effect of ammonia. Appl. Microbiol. Biotechnol. 1993, 38, 560–564. [Google Scholar] [CrossRef]
- Vavilin, V.A.; Rytov, S.V.; Lokshina, L.Y. A description of hydrolysis kinetics in anaerobic degradation of particulate organic matter. Bioresour. Technol. 1996, 56, 229–237. [Google Scholar] [CrossRef]
- Husain, A. Mathematical models of the kinetics of anaerobic digestion—A selected review. Biomass Bioenergy 1998, 14, 561–571. [Google Scholar] [CrossRef]
- Bernard, O.; Hadj-Sadok, Z.; Dochain, D.; Genovesi, A.; Steyer, J.P. Dynamical model development and parameter identification for an anaerobic wastewater treatment process. Biotechnol. Bioeng. 2001, 75, 424–438. [Google Scholar] [CrossRef]
- Siegrist, H.; Vogt, D.; Garcia-Heras, J.L.; Gujer, W. Mathematical model for meso- and thermophilic anaerobic sewage sludge digestion. Environ. Sci. Technol. 2002, 36, 1113–1123. [Google Scholar] [CrossRef]
- Batstone, D.J.; Keller, J.; Angelidaki, I.; Kalyuzhnyi, S.V.; Pavlostathis, S.G.; Rozzi, A.; Sanders, W.T.M.; Siegrist, H.A.; Vavilin, V.A. The IWA anaerobic digestion model no 1 (ADM1). Water Sci. Technol. 2002, 45, 65–73. [Google Scholar] [CrossRef] [PubMed]
- Zaher, U.; Pandey, P.; Chen, S. A simple elemental continuity based model application to study the anaerobic microbial activity for the treatment of dairy manure. Appl. Math. Model. 2009, 33, 3553–3564. [Google Scholar] [CrossRef]
- Rajendran, K.; Kankanala, H.R.; Lundin, M.; Taherzadeh, M.J. A novel process simulation model (PSM) for anaerobic digestion using Aspen Plus. Bioresour. Technol. 2014, 168, 7–13. [Google Scholar] [CrossRef] [PubMed]
- Arzate, J.A.; Ertem, F.C.; Cruz Bournazou, M.N.; Neubauer, P.; Junne, S. Life Cycle Assesment and Modeling Approaches for Biogas Production. In Proceedings of the International Scientific Conference, Novi Sad, Serbia, 19–20 June 2015. [Google Scholar]
- Barampouti, E.; Mai, S.; Vlyssides, A. Dynamic modeling of biogas production in an UASB reactor for potato processing wastewater treatment. Chem. Eng. J. 2005, 106, 53–58. [Google Scholar] [CrossRef]
- Nopharatana, A.; Pullammanappallil, P.C.; Clarke, W.P. Kinetics and dynamic modelling of batch anaerobic digestion of municipal solid waste in a stirred reactor. Waste Manag. 2007, 27, 595–603. [Google Scholar] [CrossRef] [PubMed]
- Yusuf, M.O.L.; Ify, N.L. The effect of waste paper on the kinetics of biogas yield from the co-digestion of cow dung and water hyacinth. Biomass Bioenerg. 2011, 35, 1345–1351. [Google Scholar] [CrossRef]
- Syaichurrozi, I.; Sumardiono, S. Biogas production kinetic from vinasse waste in batch mode anaerobic digestion. World Appl. Sci. J. 2013, 26, 1464–1472. [Google Scholar]
- Brulé, M.; Oechsner, H.; Jungbluth, T. Exponential model describing methane production kinetics in batch anaerobic digestion: A tool for evaluation of biochemical methane potential assays. Bioproc. Biosyst. Eng. 2014, 37, 1759–1770. [Google Scholar] [CrossRef] [PubMed]
- Hural, I.; Dyvak, M.; Stakhiv, P. Macromodelling of fermentation process of municipal solid organic waste at biogas plants on the acidogenesis stage. J. Appl. Comput. Sci. 2016, 24, 134–142. [Google Scholar] [CrossRef]
- Karaboğa, D. An Idea Based on Honey Bee Swarm for Numerical Optimization. Technical Report—TR06, Erciyes University. 2005, p. 10. Available online: https://abc.erciyes.edu.tr/pub/tr06_2005.pdf (accessed on 19 May 2024).
- Xiao, W.S.; Li, G.X.; Liu, C.; Tan, L.P. A novel chaotic and neighborhood search-based artificial bee colony algorithm for solving optimization problems. Sci. Rep. 2023, 13, 20496. [Google Scholar] [CrossRef]
- Dyvak, M.; Pukas, A.; Oliynyk, I.; Melnyk, A. Selection the “Saturated” Block from Interval System of Linear Algebraic Equations for Recurrent Laryngeal Nerve Identification. In Proceedings of the Data Stream Mining & Processing (DSMP) of the Second International Conference, Lviv, Ukraine, 21–25 August 2018; pp. 444–448. [Google Scholar] [CrossRef]
- Dyvak, M.; Manzhula, V.; Trufanova, Y. Interval Non-linear Model of Information Signal Characteristics Distribution for Detection of Recurrent Laryngeal Nerve during Thyroid Surgery. In Proceedings of the Informatics & Data-Driven Medicine (IDDM-2022) of the 5th International Conference, Lyon, France, 18–20 November 2022; pp. 99–107. Available online: https://ceur-ws.org/Vol-3302/short5.pdf (accessed on 19 May 2024).
- Bober, W. Introduction to Numerical and Analytical Methods with MATLAB for Engineers and Scientists; CRC Press: Boca Raton, FL, USA; Florida Atlantic University: Boca Raton, FL, USA, 2013; 517p, ISBN 978-1-4665-7609-4. [Google Scholar]
- Quarteroni, A.; Saleri, F. Scientific Computing with MATLAB and Octave; Springer: Berlin/Heidelberg, Germany, 2014; 342p, ISBN 978-3-540-32612-0. [Google Scholar]
- Beck, A. Introduction to Nonlinear Optimization: Theory, Algorithms, and Applications with MATLAB; Society for Industrial and Applied Mathematics: Philadelphia, PA, USA, 2014; 290p, ISBN 978-1611973648. [Google Scholar]
- Cutting, V.; Stephen, N. Comparative review of java and python. Int. J. Res. Dev. Appl. Sci. Eng. 2021, 21, 6. [Google Scholar]


| Model | Model Description |
|---|---|
| Andrews, (1969) | This model demonstrates that modeling the rate-limiting step provides information on the entire process. Bacterial inhibition can be explained by the accumulation of acid [24]. |
| Andrews and Graef, (1971) | Dynamic modeling of the process of enzymatic hydrolysis of complex organic compounds has been carried out [25]. |
| Hill and Barth, (1977) | This model was created to ensure stability in the process of anaerobic digestion of animal husbandry wastes. Taking into account mass balances between volatile compounds, volatile acids, soluble organics, two groups of bacteria, cations, nitrogen, and carbon dioxide, the pH values were calculated [26]. |
| Heyes and Hall, (1981) | A dynamic model was developed to represent hydrogen inhibition of acetogenesis and pH inhibition of methanogenesis using glucose as a substrate [27]. |
| Hill, (1983) | The model was developed to simulate the steady-state methane productivity (qualitative and quantitative) in the process of anaerobic digestion of animal husbandry wastes [28]. |
| Mosey, (1983) | Four bacterial groups were identified in the model of biogas production through anaerobic digestion of glucose. Acetogenesis is determined as the limiting step in the model [29]. |
| Model | Model Description |
|---|---|
| Costello, (1991) | The reactor process, physico-chemical system, and biological composition were utilized in the system to create a mathematical model. Additionally, the model includes the accumulation of lactic acid, product inhibition, and pH acidity [30]. |
| Angelidaki, (1993) | The model was developed to simulate the anaerobic degradation of complex organic materials, including the enzymatic hydrolytic stage, four bacterial stages, and 12 chemical compounds [31]. |
| Vavilin, (1996) | The model was developed to simulate the hydrolytic (limiting) stage of anaerobic digestion. The model includes surface colonization of particles by hydrolytic bacteria and surface degradation [32]. |
| Husain, (1998) | Monod functions were used to determine the mortality rate of acidogens and methanogens [33]. |
| Model | Model Description |
|---|---|
| Bernard (2001) | A mass balance model was developed to determine parameters at the stages of acidogenesis and methanogenesis in the process. Electrochemical equilibrium is used to incorporate alkalinity into the model [34]. |
| Siegrist (2002) | The rate of hydrolysis, acetoclastic methanogenesis, and propionate degradation were the specific focus of the mathematical model created, which simulated the dynamic behavior of mesophilic and thermophilic fermentation [35]. |
| Batstone (2002) | ADM1 includes both biochemical and physico-chemical processes. In this comprehensive model, 26 dynamic state variable concentrations, 8 implicit algebraic variables, and 32 state variable concentrations are utilized [36]. |
| Zaher (2009) | The model was created to understand microbial activity based on the availability of macro-elements () and the thermodynamics of acidogenesis and methanogenesis [37]. |
| Rajendran (2014) | 46 reactions (for inhibition, kinetic rate, pH, ammonia, volume, loading rate, and retention time) are carried out in the model to predict biogas production from any substrate and under any operating conditions using Aspen Plus V 7.3.2 [38]. |
| Arzate (2015) | This model combines life cycle assessment characteristics and a mathematical model of process productivity, which can help reduce the environmental impact of fermentation processes [39]. |
| Model | Model Description |
|---|---|
| Barampouti, (2005) | The model was created to forecast biogas production by examining 17 parameters from two years of data from a wastewater treatment plant [40]. |
| Nopharatana, (2007) | The model was created to simulate biological reactions in a reactor with solid municipal waste considering them in two fractions: soluble and insoluble. The model incorporates Contois, Monod, and Gompertz equations [41]. |
| Yusuf and Ify, (2011) | The model was created to predict the maximum and final biogas yield as well as the final methane output during the co-fermentation of cow manure and water hyacinth based on a first-order kinetic model [42]. |
| Syaichurrozi and Sumardino, (2013) | A kinetic model for determining biogas production was developed using the modified Gompertz equation. The influence of the COD/N ratio on the kinetic model was investigated [43]. |
| Brule, (2014) | The model was created to optimize analyzes of raw materials. It provides quality control of analyses, interpretation of reaction kinetics and assessment of methane yield [44]. |
| Dyvak, Gural (2018) | The model for estimating the daily output of methane during anaerobic microbiological fermentation [45]. |
| Control Point Number, i | 1 | 2 | 3 | 4 | 5 | 6 | 7 | 8 | 9 | 10 |
|---|---|---|---|---|---|---|---|---|---|---|
| Pulp loading mass, 1000 kg, | 72 | 56 | 80 | 58 | 54 | 144 | 130 | 78 | 58 | 87 |
| Cattle manure loading mass, 1000 kg, | 10 | 10 | 10 | 10 | 40 | 20 | 10 | 5 | 5 | 10 |
| Pulp with a straw loading mass, 1000 kg | 4 | 4 | 8 | 16 | 0 | 16 | 0 | 0 | 0 | 0 |
| Bard loading volume, m3, | 150 | 40 | 80 | 140 | 90 | 0 | 160 | 90 | 120 | 150 |
| Urea loading volume, m3, | 59 | 14.4 | 59 | 0 | 72 | 14.4 | 59 | 14.4 | 14.4 | 43 |
| Humidity, %, | 97.9 | 97.8 | 97.2 | 96.525 | 96.9 | 96.291 | 97.1 | 96.837 | 96.75 | 96.73 |
| Temperature in the bioreactor, °C, | 47.9 | 48.2 | 48 | 47.6 | 48.3 | 47.3 | 47 | 47.2 | 46.6 | 44.4 |
| The lower limit of the measured Y, | 7.8012 | 8.1279 | 7.8804 | 8.0091 | 7.9299 | 8.0784 | 7.900 | 8.059 | 7.92 | 8.0388 |
| The upper limit of the measured Y, | 7.9588 | 8.2921 | 8.0396 | 8.1709 | 8.0901 | 8.2416 | 8.0598 | 8.2214 | 8.08 | 8.2012 |
| Control Point Number, i | 1 | 2 | 3 | 4 | 5 | 6 | 7 | 8 | 9 | 10 | 11 | 12 | 13 | 14 | 15 | 16 |
|---|---|---|---|---|---|---|---|---|---|---|---|---|---|---|---|---|
| Bard loading volume, m3, | 120 | 180 | 120 | 220 | 200 | 10 | 180 | 120 | 200 | 340 | 110 | 120 | 130 | 250 | 100 | 260 |
| Pulp loading mass, 1000 kg, | 117 | 244 | 156 | 209 | 137 | 195 | 223 | 137 | 127 | 109 | 84 | 102 | 96 | 78 | 170 | 106 |
| Cattle manure loading mass, 1000 kg, | 30 | 40 | 20 | 40 | 20 | 25 | 40 | 30 | 20 | 40 | 20 | 30 | 30 | 20 | 50 | 40 |
| Urea loading volume, m3, | 25 | 0 | 58.8 | 28.6 | 25 | 34.8 | 50 | 50 | 38.4 | 36 | 0 | 0 | 7.2 | 0 | 0 | 0 |
| Humidity, %, | 97.1 | 98 | 96.6 | 97 | 96.4 | 96.9 | 96.2 | 96.8 | 95.9 | 96.1 | 96.2 | 96.6 | 96.5 | 96.7 | 96.8 | 97 |
| Temperature in the bioreactor, °C, | 40.6 | 40.9 | 41 | 40.8 | 41 | 41.6 | 41 | 40.5 | 40.5 | 40.3 | 40.5 | 402 | 40.2 | 42.5 | 43.4 | 43.5 |
| The lower limit of the measured Y, | 8.039 | 7.901 | 8.059 | 8.039 | 8.069 | 7.979 | 8.029 | 7.949 | 7.959 | 7.959 | 7.920 | 7.880 | 7.999 | 8.058 | 8.029 | 7.969 |
| The upper limit of the measured Y, | 8.201 | 8.059 | 8.221 | 8.201 | 8.232 | 8.141 | 8.191 | 8.110 | 8.120 | 8.120 | 8.080 | 8.039 | 8.161 | 8.221 | 8.191 | 8.131 |
| Control Point Number, i | 1 | 2 | 3 | 4 | 5 | 6 | 7 | 8 | 9 | 10 | 11 | 12 | 13 |
|---|---|---|---|---|---|---|---|---|---|---|---|---|---|
| Bard loading volume, m3, | 20 | 265 | 560 | 90 | 130 | 120 | 180 | 110 | 50 | 120 | 170 | 200 | 200 |
| Pulp loading mass, 1000 kg, | 78 | 80 | 130 | 174 | 222 | 170 | 245 | 210 | 96 | 63 | 208 | 54 | 137 |
| Cattle manure loading mass, 1000 kg, | 40 | 20 | 40 | 40 | 40 | 40 | 60 | 50 | 50 | 30 | 40 | 20 | 30 |
| Dry bard loading volume, 1000 kg, | 8 | 0 | 24 | 18 | 24 | 12 | 30 | 0 | 0 | 0 | 0 | 0 | 0 |
| Urea loading volume, m3, | 0 | 0 | 0 | 0 | 50 | 25 | 0 | 10.8 | 25 | 27.6 | 18 | 18 | 10.2 |
| Humidity, %, | 96.794 | 96.2 | 96.3 | 97.019 | 96.5 | 96.8 | 96.5 | 96.906 | 96.1 | 96.305 | 96.771 | 96 | 96.4 |
| Temperature in the bioreactor, °C, | 43.5 | 44 | 44.3 | 44.4 | 44.4 | 44.6 | 44.4 | 44.5 | 42.3 | 42.6 | 43.6 | 45 | 45.1 |
| The lower limit of the measured Y, | 8.1279 | 7.9893 | 8.0982 | 8.0982 | 8.0289 | 8.0784 | 8.1972 | 7.9893 | 8.0685 | 8.0091 | 8.1477 | 7.8507 | 8.0388 |
| The upper limit of the measured Y, | 8.2921 | 8.1507 | 8.2618 | 8.2618 | 8.1911 | 8.2416 | 8.3628 | 8.1507 | 8.2315 | 8.1709 | 8.3123 | 8.0093 | 8.2012 |
| Control Point Number, i | 1 | 2 | 3 | 4 | 5 | 6 | 7 | 8 | 9 | 10 | 11 | 12 | 13 |
|---|---|---|---|---|---|---|---|---|---|---|---|---|---|
| Bard loading volume, m3, | 20 | 265 | 560 | 90 | 130 | 120 | 180 | 110 | 50 | 120 | 170 | 200 | 200 |
| Pulp loading mass, 1000 kg, | 78 | 80 | 130 | 174 | 222 | 170 | 245 | 210 | 96 | 63 | 208 | 54 | 137 |
| Cattle manure loading mass, 1000 kg, | 40 | 20 | 40 | 40 | 40 | 40 | 60 | 50 | 50 | 30 | 40 | 20 | 30 |
| Dry bard loading volume, 1000 kg, | 8 | 0 | 24 | 18 | 24 | 12 | 30 | 0 | 0 | 0 | 0 | 0 | 0 |
| Urea loading volume, m3, | 0 | 0 | 0 | 0 | 50 | 25 | 0 | 10.8 | 25 | 27.6 | 18 | 18 | 10.2 |
| Humidity, %, | 95.88 | 96.3 | 96.55 | 96 | 95.868 | 96.156 | 96.1 | 96.3 | 95.9 | 96.4 | 96.478 | 96.4 | 95.987 |
| Temperature in the bioreactor, °C, | 41.2 | 41.4 | 41.9 | 41.2 | 41.4 | 41.6 | 41.4 | 41.2 | 39.5 | 39.7 | 41.2 | 43.8 | 44.7 |
| The lower limit of the measured Y, | 7.9497 | 7.9299 | 8.1477 | 8.0289 | 7.9497 | 7.9992 | 8.0883 | 7.9497 | 8.0289 | 8.0784 | 8.1279 | 7.9398 | 8.1279 |
| The upper limit of the measured Y, | 8.1103 | 8.0901 | 8.3123 | 8.1911 | 8.1103 | 8.1608 | 8.2517 | 8.1103 | 8.1911 | 8.2416 | 8.2921 | 8.1002 | 8.2921 |
| Control Point Number, i | 1 | 2 | 3 | 4 | 5 | 6 | 7 | 8 | 9 | 10 | 11 | 12 | 13 | 14 | 15 |
|---|---|---|---|---|---|---|---|---|---|---|---|---|---|---|---|
| Bard loading volume, m3, | 130 | 70 | 80 | 130 | 200 | 150 | 30 | 110 | 320 | 120 | 130 | 210 | 220 | 40 | 220 |
| Pulp loading mass, 1000 kg, | 129 | 159 | 147 | 120 | 101 | 97.5 | 102 | 112.5 | 69 | 100 | 0 | 37.5 | 51 | 33 | 137.5 |
| Urea loading volume, m3, | 0 | 0 | 0 | 39.4 | 0 | 16.5 | 14.4 | 14.4 | 0 | 14.4 | 0 | 14.4 | 14.4 | 0 | 14.4 |
| Treacle loading volume, m3, | 0 | 0 | 14.4 | 10 | 0 | 0 | 10 | 15 | 5 | 0 | 0 | 0 | 0 | 11 | 10 |
| Humidity, %, | 96 | 96.6 | 96.1 | 96.635 | 96.5 | 97 | 96.4 | 97 | 96.7 | 96.9 | 96.8 | 97.2 | 96.3 | 96.696 | 96.8 |
| Temperature in the bioreactor, °C, | 34 | 34.7 | 32.1 | 35.4 | 34.8 | 35.8 | 35.9 | 36 | 36.3 | 36.1 | 36.1 | 36 | 36.9 | 38 | 38.2 |
| The lower limit of the measured Y, | 7.8447 | 7.8842 | 8.0127 | 7.9732 | 7.8546 | 7.8941 | 8.1312 | 7.9633 | 7.9336 | 7.9633 | 7.9139 | 7.9435 | 7.8447 | 8.0028 | 8.0522 |
| The upper limit of the measured Y, | 8.0353 | 8.0758 | 8.2073 | 8.1668 | 8.0454 | 8.0859 | 8.3288 | 8.1567 | 8.1264 | 8.1567 | 8.1061 | 8.1365 | 8.0353 | 8.1972 | 8.2478 |
| Control Point Number, i | 1 | 2 | 3 | 4 | 5 | 6 | 7 | 8 | 9 | 10 | 11 | 12 | 13 | 14 | 15 |
|---|---|---|---|---|---|---|---|---|---|---|---|---|---|---|---|
| Bard loading volume, m3, | 130 | 70 | 80 | 130 | 200 | 150 | 30 | 110 | 320 | 120 | 130 | 210 | 220 | 40 | 220 |
| Pulp loading mass, 1000 kg, | 129 | 159 | 147 | 120 | 101 | 97.5 | 102 | 112.5 | 69 | 100 | 0 | 37.5 | 51 | 33 | 137.5 |
| Urea loading volume, m3, | 0 | 0 | 0 | 39.4 | 0 | 16.5 | 14.4 | 14.4 | 0 | 14.4 | 0 | 14.4 | 14.4 | 0 | 14.4 |
| Treacle loading volume, m3, | 0 | 0 | 14.4 | 10 | 0 | 0 | 10 | 15 | 5 | 0 | 0 | 0 | 0 | 11 | 10 |
| Humidity, %, | 96.2 | 96.3 | 96.1 | 96.782 | 96.8 | 96.737 | 97 | 96.8 | 97 | 96.9 | 96.3 | 96.2 | 96.7 | 96.2 | 96.8 |
| Temperature in the bioreactor, °C, | 44.6 | 44.3 | 43.8 | 43.3 | 42.9 | 42.8 | 42.5 | 42.3 | 42.1 | 42.2 | 41.6 | 40.6 | 39.6 | 38.7 | 38.2 |
| The lower limit of the measured Y, | 8.062 | 8.062 | 8.1318 | 8.102 | 7.933 | 8.102 | 8.24 | 8.013 | 8.102 | 8.052 | 7.973 | 8.082 | 7.963 | 8.072 | 7.934 |
| The upper limit of the measured Y, | 8.258 | 8.258 | 8.329 | 8.298 | 8.126 | 8.298 | 8.44 | 8.207 | 8.298 | 8.248 | 8.167 | 8.278 | 8.157 | 8.268 | 8.126 |
Disclaimer/Publisher’s Note: The statements, opinions and data contained in all publications are solely those of the individual author(s) and contributor(s) and not of MDPI and/or the editor(s). MDPI and/or the editor(s) disclaim responsibility for any injury to people or property resulting from any ideas, methods, instructions or products referred to in the content. |
© 2024 by the authors. Licensee MDPI, Basel, Switzerland. This article is an open access article distributed under the terms and conditions of the Creative Commons Attribution (CC BY) license (https://creativecommons.org/licenses/by/4.0/).
Share and Cite
Dyvak, M.; Manzhula, V.; Melnyk, A.; Rusyn, B.; Spivak, I. Modeling the Efficiency of Biogas Plants by Using an Interval Data Analysis Method. Energies 2024, 17, 3537. https://doi.org/10.3390/en17143537
Dyvak M, Manzhula V, Melnyk A, Rusyn B, Spivak I. Modeling the Efficiency of Biogas Plants by Using an Interval Data Analysis Method. Energies. 2024; 17(14):3537. https://doi.org/10.3390/en17143537
Chicago/Turabian StyleDyvak, Mykola, Volodymyr Manzhula, Andriy Melnyk, Bohdan Rusyn, and Iryna Spivak. 2024. "Modeling the Efficiency of Biogas Plants by Using an Interval Data Analysis Method" Energies 17, no. 14: 3537. https://doi.org/10.3390/en17143537
APA StyleDyvak, M., Manzhula, V., Melnyk, A., Rusyn, B., & Spivak, I. (2024). Modeling the Efficiency of Biogas Plants by Using an Interval Data Analysis Method. Energies, 17(14), 3537. https://doi.org/10.3390/en17143537


