Article

Infill Well Location Optimization Method Based on Recoverable Potential Evaluation of Remaining Oil

1
School of Petroleum Engineering, China University of Petroleum (East China), Qingdao 266580, China
2
State Key Laboratory of Offshore Oil Exploitation, Beijing 100028, China
3
CNOOC Research Institute Co., Ltd., Beijing 100028, China
*
Authors to whom correspondence should be addressed.
Energies 2024, 17(14), 3492; https://doi.org/10.3390/en17143492
Submission received: 22 May 2024 / Revised: 2 July 2024 / Accepted: 12 July 2024 / Published: 16 July 2024
(This article belongs to the Special Issue Oil Recovery and Simulation in Reservoir Engineering)

Abstract

:
Infill well location optimization poses significant challenges due to its complexity and time-consuming nature. Currently, determining the scope of infill wells relies heavily on field engineers’ experience, often using single indices such as the remaining oil saturation or abundance of remaining oil reserves to evaluate the potential of remaining oil. However, this approach lacks effectiveness in guiding the precise tapping of remaining oil in ultra-high water cut reservoirs. To address this, our study comprehensively considers the factors influencing the recoverable potential of remaining oil in such reservoirs. We characterize the differences in reservoir heterogeneity, scale of recoverable remaining oil reserves, water flooding conditions, and oil–water flow capacity to construct a quantitative evaluation index system for the recoverable potential of remaining oil. Recognizing the varying degrees of influence of different indices on the recoverable potential of remaining oil, we determine the objective weight of each evaluation index by combining an accelerated genetic algorithm with the projection pursuit model. This approach enables the construction of a recoverable potential index for remaining oil and forms a quantitative evaluation method for the recoverable potential of remaining oil in ultra-high water cut reservoirs. Subsequently, we establish a mathematical model for infill well location optimization, integrating and optimizing the infill well location coordinates, well length, well inclination angle, and azimuth angle. Using the main layer sand body of an oilfield in Bohai as a case study, we conducted evaluations of the remaining oil potential and infill well location optimization. Our results demonstrate that the assessment of the remaining oil potential comprehensively characterizes the influence of the reservoir’s physical properties and oil–water diversion capacity on the remaining oil potential across different regional positions. This evaluation can effectively guide the determination of infill well location ranges based on the evaluation results. Furthermore, infill well location optimization can effectively enhance reservoir development outcomes.

1. Introduction

Suitable infill well location is the basis of realizing the efficient development of oilfields. The design of an infill well location is based on the determination of the infill method; that is, it is based on the known number of infill wells, the injection–production well type of infill wells, the injection–production well type conversion measures of existing wells, and the position of infill wells in a certain infill area, so that the well location can better adapt to the geological characteristics and development conditions of the reservoir [1,2].
The design method of infill well location mainly includes the selection of the infill well location and the optimization of the infill well location. The infill well location optimization method is used to design a variety of infill well location schemes, predict and compare the reservoir development effects of different schemes, and then select the best infill well location scheme [3,4,5,6,7]. The process of determining the infill well location is simple and easy to operate. However, the method of infill well location optimization can only select the best scheme from the limited number of infill well location schemes designed by reservoir engineers and cannot optimize the infill well location, and there is a possibility of not finding the best scheme.
In recent years, the method of infill well location optimization has become a research hotspot in production optimization [8,9,10,11,12]. The method transforms the well location problem into a mathematical problem. With reservoir development effect indicators (cumulative oil production, recovery degree, economic net present value, etc.) as the optimization objective [13,14,15,16,17] and with the characterization parameters of infill well location as the variables, the optimization of an infill well’s location is carried out under certain constraints. The optimal infill well location is affected by many factors, such as reservoir heterogeneity, fluid factors, production factors, and economic parameters [18,19,20,21,22]. The relationship between the development effect and infill well location is complex and nonlinear, resulting in infill well location optimization that is extremely complex, nonlinear, and multi-peak [18,22,23,24]. At present, this kind of problem is usually solved using coupling reservoir numerical simulators and optimization algorithms. This method uses the algorithm solution mechanism to update the infill well position automatically. However, the problem of well location optimization is often time consuming [25,26,27]. Therefore, to find the optimal infilling well location efficiently and accurately, some researchers use the way of production potential maps to determine it. Production potential mapping [28,29] is a method developed by Cruz and Horne to simplify the optimization of infill well placement. A well is arranged in all or part of the grid of a reservoir, and a reservoir numerical simulator is run to predict the cumulative oil production of the reservoir at each well location, and the kriging interpolation method is used to obtain the cumulative oil production map, that is, the production potential map. When the production potential map is applied to optimize the well location, all the grids are sorted according to the production potential from the largest to the smallest, the grids without drilling are selected in turn, and whether there are other wells in the control area of the selected well location is judged. If there are other wells, the well location is abandoned to continue the selection. Based on the calculation formula of production potential proposed by Liu et al. [30], the potential map not only contains static oil and gas reserve parameters but also includes parameters characterizing the oil and gas flow capacity. Ding et al. considered the influence of gas cap and bottom water and expanded the application scope of the optimization method of well location [31]. Molina et al. proposed a more commonly used formula for calculating the development potential index [32]. Karim et al. further combined the static and dynamic characteristics and carried out the corresponding development potential evaluation [10,33,34,35]. Geng et al., considering the nonlinear relationship between remaining oil’s diversion ability and water saturation, introduced dominant potential abundance to quantitatively characterize the distribution of remaining oil potential in high water cut reservoirs [36]. Ding et al. proposed to quantitatively characterize the distribution potential of the remaining oil in the high water cut period by using superior production potential and compared it with the abundance of reserves and superior potential [37].
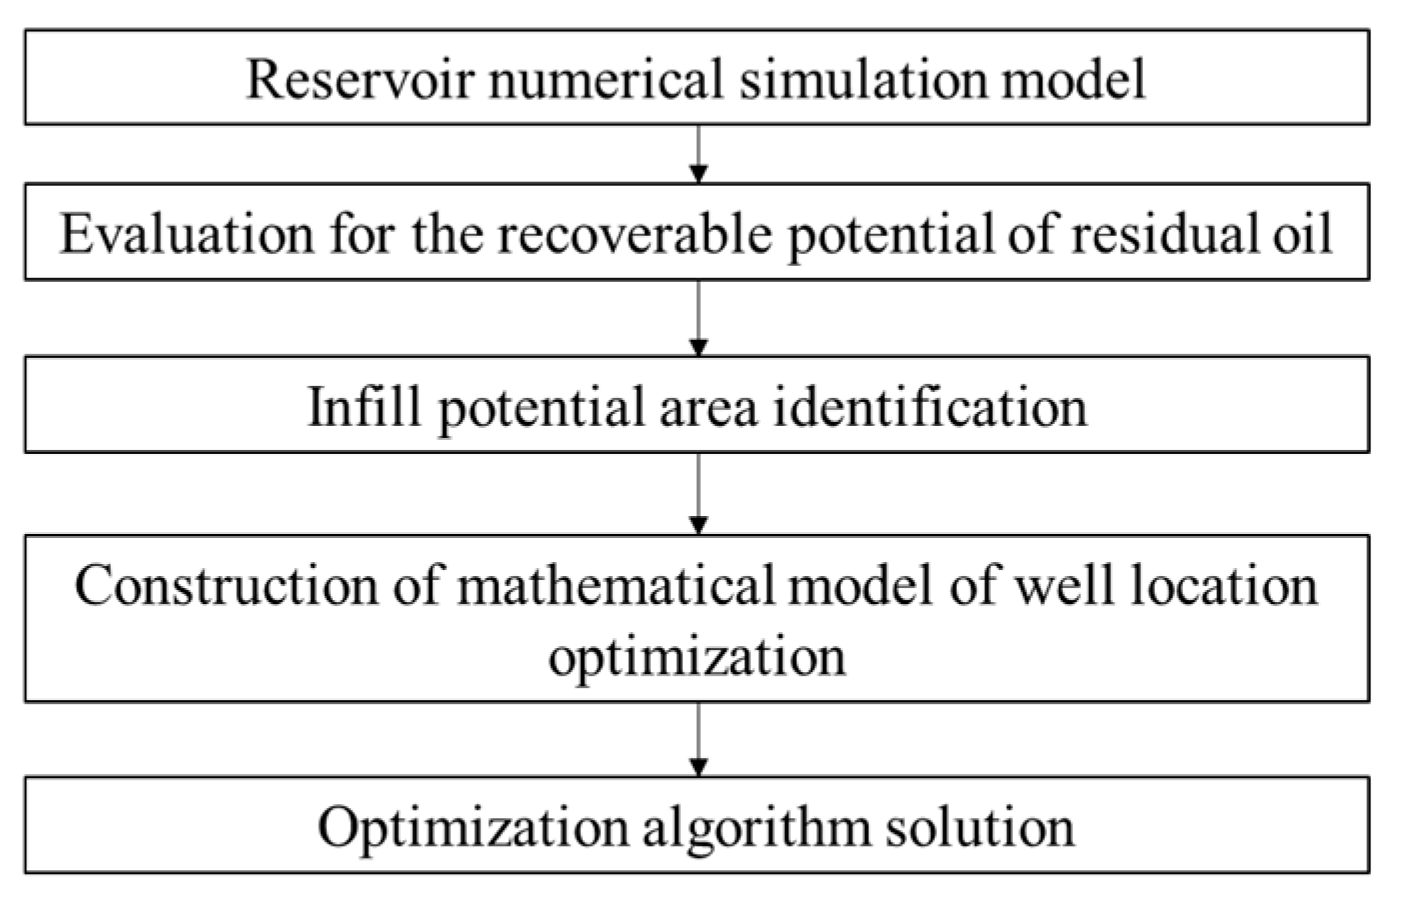
Therefore, in light of the existing challenges in evaluating remaining oil potential in ultra-high water cut reservoirs, this paper first establishes a quantitative evaluation method based on the quantitative characterization of recoverable reserves of remaining oil, water flooding conditions, and reservoir heterogeneity. It also considers the varying degrees of influence different indicators have on remaining oil potential to achieve a comprehensive evaluation of the distribution of recoverable potential of remaining oil. Based on the evaluation results, the potential area for infill wells is determined. The infill well location optimization method is then used to optimize the heel coordinates, well length, well inclination, and azimuth angle of the infill wells, enabling the precise design of infill well locations. Therefore, the structure of this paper is as follows: First, in Section 2, an evaluation method based on remaining oil potential is constructed to determine the range of encryption potential. On this basis, a certain point within the potential area of encryption is taken as the initial point, and an optimization method of encryption well location is constructed based on the mathematical model and solving algorithm of encryption well location optimization. Finally, the actual reservoir field application is carried out.

2. Establishment of Remaining Oil Recoverable Potential Evaluation Method

After long-term water injection in ultra-high water cut reservoirs, the distribution of underground oil and water becomes complex. Parameters such as the reservoir’s physical properties, pore structure, wettability, and seepage characteristics change significantly. The static and dynamic heterogeneity of reservoirs is further enhanced, resulting in a sharp increase in the difference in oil–water diversion capacity. The variation in the water flooding degree in different parts leads to a significant difference in the oil–water diversion capacity. The conventional quantitative characterization method for remaining oil potential can no longer effectively reflect this disparity. In ultra-high water cut reservoirs, the distribution of remaining oil is highly dispersed. Its development potential is influenced by multiple factors, including reservoir heterogeneity, the scale of recoverable remaining oil reserves, water flooding status, and oil–water diversion capacity.
Therefore, by thoroughly considering the factors affecting the potential of remaining oil recovery and taking into account the significant reservoir heterogeneity, a quantitative evaluation system is devised. This system comprehensively captures reservoir heterogeneity, the scale of recoverable remaining oil reserves, water flooding conditions, and oil–water diversion capacity. It delves deeply into the analysis of remaining oil recovery potential in ultra-high water cut reservoirs, offering insights for the comprehensive exploitation of remaining oil with varying potential.

2.1. Evaluation Index Construction

The unit conductance coefficient considers the influence of the parameters related to the remaining oil and reservoir properties on the flow capacity of the remaining oil. It is represented by the absolute permeability and crude oil viscosity of grid units within a certain range near the reservoir grid unit, rather than solely representing the attributes of individual grid units. This characterization reflects the ability of grid units to exchange remaining oil with neighboring grid units. A higher unit conductance coefficient indicates a stronger oil exchange capability between grid units and neighboring ones, implying a greater potential for remaining oil recovery. Its calculation formula is as follows:
C O I i , j = 0.5 K / μ o i 1 2 , j + K / μ o i + 1 2 , j 0.5 K / μ o i , j 1 2 + K / μ o i , j + 1 2
K / μ o i ± 1 2 , j = K / μ o i ± 1 , j K / μ o i , j K / μ o i ± 1 , j + K / μ o i , j
K / μ o i , j ± 1 2 = K / μ o i , j ± 1 K / μ o i , j K / μ o i , j ± 1 + K / μ o i , j
where COI represents the unit conductance coefficient; K denotes the reservoir permeability in 10−3 μm2; μo is the oil viscosity, mPa·s; subscripts i and j represent the X and Y direction indices of the grid unit, respectively.
The mobility of residual oil is influenced by the current oil saturation and residual oil saturation of the reservoir, which are affected by the permeability characteristics of the reservoir. Traditional methods for characterizing the potential scale of residual oil primarily use the abundance of remaining oil reserves or abundance of recoverable remaining oil reserves. Remaining oil abundance only reflects the scale of residual oil reserves per unit area, while recoverable residual oil abundance simply considers residual oil saturation, ignoring the diversion ability of mobile oil at different water saturation levels. Residual oil advantage potential abundance, building upon recoverable reserve abundance, further considers the nonlinear relationship between oil–water diversion capability and water saturation during high water saturation periods. This method characterizes both the recoverable reserve scale of underground residual oil and the differences in the diversion capabilities of residual oil within the reservoir during high water saturation periods. Higher remaining oil advantage potential abundance indicates a greater recoverable potential of remaining oil.
V O I i , j = μ w μ o e a ( c S w ) 2 e b S w S o i , j t S o r ϕ i , j h i , j N T G i , j
Here, VOI represents the unit remaining oil dominant potential abundance; μw is water viscosity, mPa·s; Sw denotes the water saturation; So signifies the oil saturation; Sor stands for the residual oil saturation; ø represents the porosity; h indicates the thickness of the grid unit, m; NTG represents the net-to-gross ratio; a, b, and c are the fitting coefficients of the nonlinear phase-permeability relationship during the high water cut period.
During the high water cut period, the reservoir has been extensively affected by water injection, leading to significant water-flooded areas where the late-stage development potential is limited. Based on Leverett’s concept of fractional flow, neglecting the influence of capillary forces and gravity, the formula for calculating the fractional flow of remaining oil (i.e., oil saturation) is as follows:
f o = 1 f w = 1 1 1 + μ w μ o K r o K r w = 1 1 1 + μ w μ o e a ( c S w ) 2 e b S w
where fo represents the oil cut of the unit; fw represents the water cut of the unit; Kro represents the relative permeability of oil; Krw represents the relative permeability of water.
For locations with different physical properties in the reservoir, the relative permeabilities of oil and water vary. Even if the oil saturation remains the same, the oil phase’s ability to flow differs. As the oil saturation decreases in a reservoir grid unit, the residual oil’s flow rate continuously decreases. Generally, stronger residual oil flow capacity indicates a greater remaining oil recovery potential.

2.2. Establishment of Evaluation Model

To characterize the remaining oil recovery potential during the high water cut period, the combination of the three evaluation criteria is weighted and multiplied together. This combined metric is defined as the residual oil recovery potential index, expressed mathematically as shown below. The advantage of combining these three indices by multiplication is that when any one of them indicates non-recoverable conditions, the residual oil recovery potential index can capture that characteristic. A higher value of the residual oil recovery potential index represents a higher potential for residual oil recovery in the area unit.
R O I = V O I α C O I β f o γ
Here, ROI is the residual oil recovery potential index; α, β, and γ are weighting coefficients used to emphasize the importance of each criterion in the residual oil recovery potential index. A higher weighting coefficient implies greater importance of the corresponding criterion in the residual oil recovery potential index.
To objectively determine the importance of each evaluation index and characterize the residual oil recovery potential during the high water cut period, this study introduces a projection pursuit model to project multidimensional evaluation index values into one-dimensional projection data [38]. An accelerated genetic algorithm is employed to optimize the projection index function to seek the optimal projection direction of the evaluation index system [39]. Based on the magnitudes of each component in the optimal projection direction, the objective weights of each evaluation index are determined, effectively avoiding subjective biases from manual assignment and enhancing the objectivity of evaluating the residual oil recovery potential during the high water cut period.
Taking the actual reservoir geological model grid as the unit, the spatial distribution of remaining oil is determined, the characteristic parameters are extracted, and the three evaluation index values of the remaining oil recoverable potential evaluation in the ultra-high water cut stage are calculated. Here, we take the logarithm at both ends of Equation (6):
R O I * = lg R O I = α lg V O I + β lg C O I + γ lg f o
The sample data set xk = {lgVOIk, lgCOIk, lgfok}, composed of m grid units and three evaluation indexes, is normalized to eliminate the influence of dimensional difference or numerical range difference of each index on the evaluation results. Since the above three indicators are positive, the normalization formula is as follows:
V O I k * = lg V O I k lg V O I min lg V O I max lg V O I min C O I k * = lg C O I k lg C O I min lg C O I max lg C O I min f o k * = lg f o k lg f o min lg f o max lg f o min
Assuming that d = {d1, d2, d3} is the projection direction vector, the normalized one-dimensional projection value Zk of the evaluation sample data xk* in this direction is:
Z k = d 1 V O I k * + d 2 C O I k * + d 3 f o k * k = 1 , 2 , , m
Usually, the optimal projection direction is obtained by maximizing the standard deviation matrix SZ and the local density matrix DZ of the projection value Zk, which preserves as much useful information in the original data as possible. Therefore, the projection index function can be expressed as:
Q d = S Z D Z
where
S Z = i = 1 m Z i Z ¯ 2 m 1 D Z = i = 1 m j = 1 m R r i j × u R r i j r i j = Z i Z j
When the sample data set of each evaluation index is given, the projection direction vector d is the only variable that affects the projection index function Q(d). Therefore, when the projection index function takes the maximum value, the corresponding projection direction vector reflects the best projection direction of the data. The optimization problem of the best projection direction is transformed into the problem of solving the maximization of the projection index function, that is:
max : Q a = S Z D Z s . t . j = 1 3 a j 2 = 1
The optimization problem is a typical complex nonlinear problem that is solved using an accelerated genetic algorithm based on real number coding [40]. The standard deviation matrix SZ and the local density matrix DZ in the projection pursuit model are used as the initial population of the accelerated genetic algorithm. The accelerated genetic algorithm is used to perform global optimization in the full parameter space until the optimal solution that maximizes the projection index function is found, that is, the optimal projection direction of the projection pursuit model. According to the projection pursuit model, each component of the optimal projection direction reflects the degree of influence of each evaluation index on the recoverable potential of the remaining oil in ultra-high water cut reservoirs.

3. Construction of Infill Well Location Optimization Method

The precise optimization of infill well placement involves identifying the optimal parameters, such as the coordinates, wellbore length, inclination angle, azimuth, etc., within regions of identified infill potential. This optimization is conducted based on the assessment results of residual oil potential, considering factors such as the number of infill wells, the assignment of injector–producer pairs, and the conversion of existing well assignments. The objective is to enhance reservoir development effectiveness by strategically locating infill wells in areas with high infill potential.

3.1. Construction of Mathematical Optimization Model

3.1.1. Optimization Variables

The optimization problem of infill well placement aims to find the optimal locations for these wells, with characteristic parameters representing the variables to be optimized. Assuming the wellbore is a straight-line segment, six variables (xh, yh, zh, L, θ, and ϕ) are used to represent the position of each well, where xh, yh, and zh are the coordinates of the wellhead, L is the length of the wellbore, θ is the azimuth angle, and ϕ is the inclination angle. The specific parameters are illustrated in Figure 1. For inclined wells, each well can be represented by six variables (xh, yh, zh, L, θ, and ϕ). For vertical wells, each well can be represented by four variables (xh, yh, zh, and L), and for horizontal wells, each well can be represented by five variables (xh, yh, zh, L, and θ).

3.1.2. Objective Function

Performance indicators represent the quantities to be optimized in the optimization problem. Common performance indicators for infill well optimization include cumulative oil production, oil recovery factor, and net present value (NPV). The objective function is the mathematical expression of the performance indicators. In this study, we use the maximization of NPV as the objective function for infill well optimization. The NPV comprehensively evaluates the economic factors of reservoir production during the development process, including the production revenue, injection cost, water treatment cost, and the impact of horizontal section drilling costs on development effectiveness. Additionally, NPV, as an optimization objective function, has been widely applied in optimization problems throughout the oil and gas field development process.
max N P V = t = 1 T 1 1 + b t p = 1 N p C o Q o t p = 1 N p C w Q w t I = 1 N I C I Q I t N inf C d L
Here, T represents the total production time in years; t represents the specific year; Co is the oil price, USD/m3; Cw is the water production cost, USD/m3; CI is the water injection cost, USD/m3; Cd is the drilling cost, USD /m; Qo is the oil production rate, m3/d; Qw is the water production rate, m3/d; QI is the injection rate, m3/d; NP is the number of production wells; NI is the number of injection wells; Ninf is the number of infill wells; L is the wellbore length, m; b is the discount rate.

3.1.3. Constraint Conditions

To ensure that the optimized infill well locations fall within feasible ranges, constraint conditions need to be incorporated into the optimization process. The constraints for infill well placement optimization include feasible infill range constraints, minimum well-spacing constraints, wellbore length constraints, azimuth angle range constraints, and inclination angle range constraints.
  • Feasible infill range constraints:
The feasible infill range constraints are incorporated into the optimization of infill wells, ensuring that the root and coordinates of the optimized wells do not exceed the feasible infill area. The upper and lower limits of the infill range are represented by xmax, ymax, zmax, and xmin, ymin, zmin. The constraints that the root coordinates (xh, yh, zh) must satisfy are as follows:
x min x h x max y min y h y max z min z h z max
The toe coordinates (xt, yt, zt) can be calculated based on the representative parameters of the well position:
x t = x h + L cos θ sin φ y t = y h + L sin θ sin φ z t = z h + L cos φ
The toe of the infill well needs to be within the feasible infill area. The constraints for the toe coordinates are as follows:
x min x t x max y min y t y max z min z t z max
  • Minimum well-spacing constraint:
The well spacing refers to the distance between two wellbores. When the well spacing is too small, it can lead to interference between wells. To prevent this from happening, a minimum distance between wells should be set during the optimization of infill well locations in the well pattern. If i and j represent two wells, the distance between these two wells can be denoted by Di,j, and the distance between any two wells must meet the following constraint conditions:
D i , j D min , i , j N T i j
where NT is the total number of wells in the reservoir.
  • Well length constraint:
The wellbore length needs to be within a certain range. When the minimum wellbore length is Lmin and the maximum length is Lmax, the wellbore length constraint satisfies a linear constraint condition, which can be expressed as:
L min L L max
  • Orientation angle range constraint:
When optimizing for deviated or horizontal wells, the orientation angle of the infill wells must fall within a feasible range, influenced by the actual production conditions and technical constraints. When the minimum orientation angle is θmin and the maximum angle is θmax, the constraint on the orientation angle falls within linear constraints.
θ min θ θ max
The wellbore inclination angle, representing the angle between the wellbore and the vertical line, is influenced by drilling techniques and geological factors. When optimizing for deviated wells, the inclination angle must fall within a feasible range. With a minimum angle φmin and maximum angle φmax, the inclination angle range constraint conforms to linear constraints.
φ min φ φ max
Combining the analysis above, based on the determination of infill potential areas, maximizing the net present value (NPV) is set as the objective function. The optimization variables consist of a matrix of well network characteristic parameters (well location, wellbore length, well deviation angle, and azimuth angle). Together with constraints including the infill range, wellbore length, azimuth angle, and minimum well spacing, the mathematical model for optimizing infill well locations is established to achieve the precise well design. The mathematical model is represented by Equation (21).
max N P V = t = 1 T 1 1 + b t p = 1 N p C o Q o t p = 1 N p C w Q w t I = 1 N I C I Q I t N inf C d L s . t . x min x h x max y min y h y max z min z h z max x min x h + L cos θ sin φ x max y min y h + L sin θ sin φ y max z min z h + L cos φ z max D i , j D min , i , j N T ( i j ) L min i L i L max i θ min i θ i θ max i φ min i φ i φ max i

3.2. Solution of Mathematical Optimization Model

After water injection, oil reservoirs often exhibit increased heterogeneity in parameters such as porosity, permeability, and oil saturation. Within feasible densification ranges, different densification well locations result in varying reservoir production parameters and consequently different reservoir development outcomes. Therefore, the optimization of densification of well locations involves multiple factors such as reservoir heterogeneity, fluid heterogeneity, and production systems, making it a complex optimization problem.
The optimization problem of densification of well locations exhibits the following characteristics: (1) It involves a large number of optimization variables, resulting in a high-dimensional optimization problem. For oil reservoirs of varying scales, the number of optimization wells can range from a few to hundreds, corresponding to several hundred optimization variables. The higher the number of optimization variables, the more challenging the optimization problem becomes to solve. (2) The solution space is rugged, with multiple peaks in the optimization problem. As the complexity of the optimization problem increases, the ruggedness of the solution space also increases. When solving optimization problems with multiple peaks, the rougher the solution space, the more prone it is to becoming trapped in local optima, making the solution process more complex. (3) The optimization problem is nonlinear, making it difficult to obtain derivative information. In the optimization of densification of well locations, parameters such as the permeability, porosity, oil saturation, reservoir fluids, well spacing, and displacement pressure gradients within injection and production units vary at different well locations. This leads to different reservoir development outcomes at different well locations, and the cumulative oil production of the reservoir exhibits a complex nonlinear relationship with reservoir and production parameters, making it difficult to obtain derivatives. Based on the analysis above, obtaining derivative information during the solution process of the optimization problem of densification of well locations is challenging. Therefore, gradient-free optimization algorithms are used to solve this problem.
PSO-MADS is a typical hybrid optimization algorithm that couples the particle swarm optimization (PSO) [41,42] algorithm with the mesh adaptive direct search (MADS) [43] algorithm, belonging to the class of global–local stochastic search algorithms. It combines the global optimization capability of PSO with the local optimization capability of MADS. The PSO-MADS algorithm benefits from the global search provided by PSO and the local search provided by MADS. The algorithm switches between PSO and MADS based on specific conditions and settings, as shown in Figure 2.
The PSO-MADS algorithm begins with an initial particle swarm, which includes one or more custom initial values, and then applies PSO for iterations. If the global best position improves, indicating a successful PSO search step where a new global best position with an objective function better than the previous one is generated, PSO continues to run. When the search step is not successful (i.e., no improvement is provided), the algorithm proceeds to the MADS polling step. In this step, the best position of the cluster serves as the center, and polling is conducted around the best solution found using PSO. As long as the polling step is successful, yielding better feasible points regarding the objective function, the polling continues. The MADS polling step runs until an unsuccessful iteration occurs, at which point the grid size parameter decreases, and the hybrid algorithm returns to PSO search. The PSO search continues around the best solution generated by the current MADS, repeating the above steps. This alternation between the PSO and MADS continues until the optimal solution is found and the search terminates. The calculation flow chart of the proposed method is shown in the Figure 3.

4. Field Application

4.1. Reservoir Model Description

An oilfield in Bohai is a large, low-amplitude drape structure developed on the background of a Paleogene paleo-uplift. Due to the multiple constraints of structure, fault, and lithology, the oil–water system is complex, the reservoir types are diverse, and lithologic structural reservoirs and structural reservoirs are developed. According to the internal fault segmentation and sand-body distribution range, the oilfield is divided into three blocks in the north, south, and west. The southern area is located in the southeast of the oilfield, and the structure is generally gentle. The NmIL sand body is an important main production layer in the southern area. The drilling data and 3-D seismic data reveal that the reservoir plane changes rapidly and the vertical thickness changes greatly, showing the sedimentary characteristics of typical multi-stage channel sand-body superposition. The reservoir type is a lithologic structural-edge water reservoir. From the perspective of reservoir physical properties, the average porosity of the reservoir in the southern area is 32%, and the average permeability is 3689 mD. It is a high-porosity and high-permeability reservoir with a large reservoir thickness, generally around 9 m. The current injection–production well pattern in the southern area of the oilfield is relatively perfect. There are 62 production wells and 29 injection wells in the NmIL sand body. The oil recovery is 31.5%, and the comprehensive water cut is 95.2%. It has entered the development stage of the ultra-high water cut period (Figure 4).
The distribution of the remaining oil in the plane of the NmIL sand body is quite different, showing the characteristics of overall dispersion and local enrichment. The remaining oil in the central well area is more dispersed, the remaining oil in the edge is locally enriched, and the remaining oil is difficult to tap. Therefore, according to the evaluation method of the recoverable potential of remaining oil, this section first clarifies the area with encryption potential, and on this basis, the precise optimization of the infill well location is carried out.

4.2. Determination of Encryption Potential Area

Taking the NmIL sand body of the main production layer in the southern area of the oilfield as the research object, the evaluation of the remaining oil exploitation potential of the ultra-high water cut reservoir is carried out. Based on reservoir numerical simulation, the grid units divided by the reservoir numerical simulation model are taken as the research object, and the oil saturation distribution data and related attribute parameters are extracted. According to Equations (1), (4), and (5), the conductivity coefficient, the abundance of remaining oil dominant potential, and the oil cut of each grid unit are calculated, respectively, as shown in Figure 5. It can be seen from Figure 5 that for the locations with different physical conditions in the reservoir, under the condition that the regional remaining oil saturation is the same, the remaining oil recoverable potential evaluated using the three evaluation indexes is quite different. For example, for the low well-pattern control area at the edge of the sand body, the remaining oil saturation is generally high, but the local unit conduction coefficient and the remaining oil dominant potential abundance distribution are different. Even due to the regional difference in the oil-phase diversion ability, there is a big difference in the oil content distribution of local units. Therefore, there will be some contradictions or problems when only a single index is used to describe the remaining oil recoverable potential. It is difficult to effectively guide the potential tapping of remaining oil in an ultra-high water cut period.
Based on the calculation of three evaluation index values of each grid unit of the NmIL sand body, three evaluation index values of each grid unit are taken as a set of sample data, and 1000 grid units are randomly selected from all grid units to form an evaluation index sample data set. The sample dimension is 1000, and the number of evaluation indexes is 3. After the index data are normalized, the projection index function is optimized using an accelerated genetic algorithm based on real number coding. The specific algorithm parameters are set as follows: the population size is 400, the random number required for the mutation direction is 20, the crossover probability is 0.8, the mutation probability is 0.2, the number of accelerations is 7, and the number of accelerations after two generations of evolution is 2. Then, the optimal projection direction vector d = (0.5106, 0.0538, 0.8581) of the remaining oil recoverable potential evaluation index system is obtained.
According to the projection pursuit model, the size of each component of the optimal projection direction essentially reflects the influence degree of each index on the evaluation of the remaining oil recoverable potential of the ultra-high water cut reservoir, that is, the weight. The order from large to small is the unit oil content, the unit remaining oil advantage potential abundance, and the unit conduction coefficient, of which the first two indicators are the main influencing factors. After normalization, the corresponding weights of each evaluation index are obtained: α = 0.35895, β = 0.03782, and γ = 0.60323. Substituted into Equation (6), the expression of the remaining oil recoverable potential index is obtained:
R O I = V O I 0.35895 C O I 0.03782 f o 0.60323
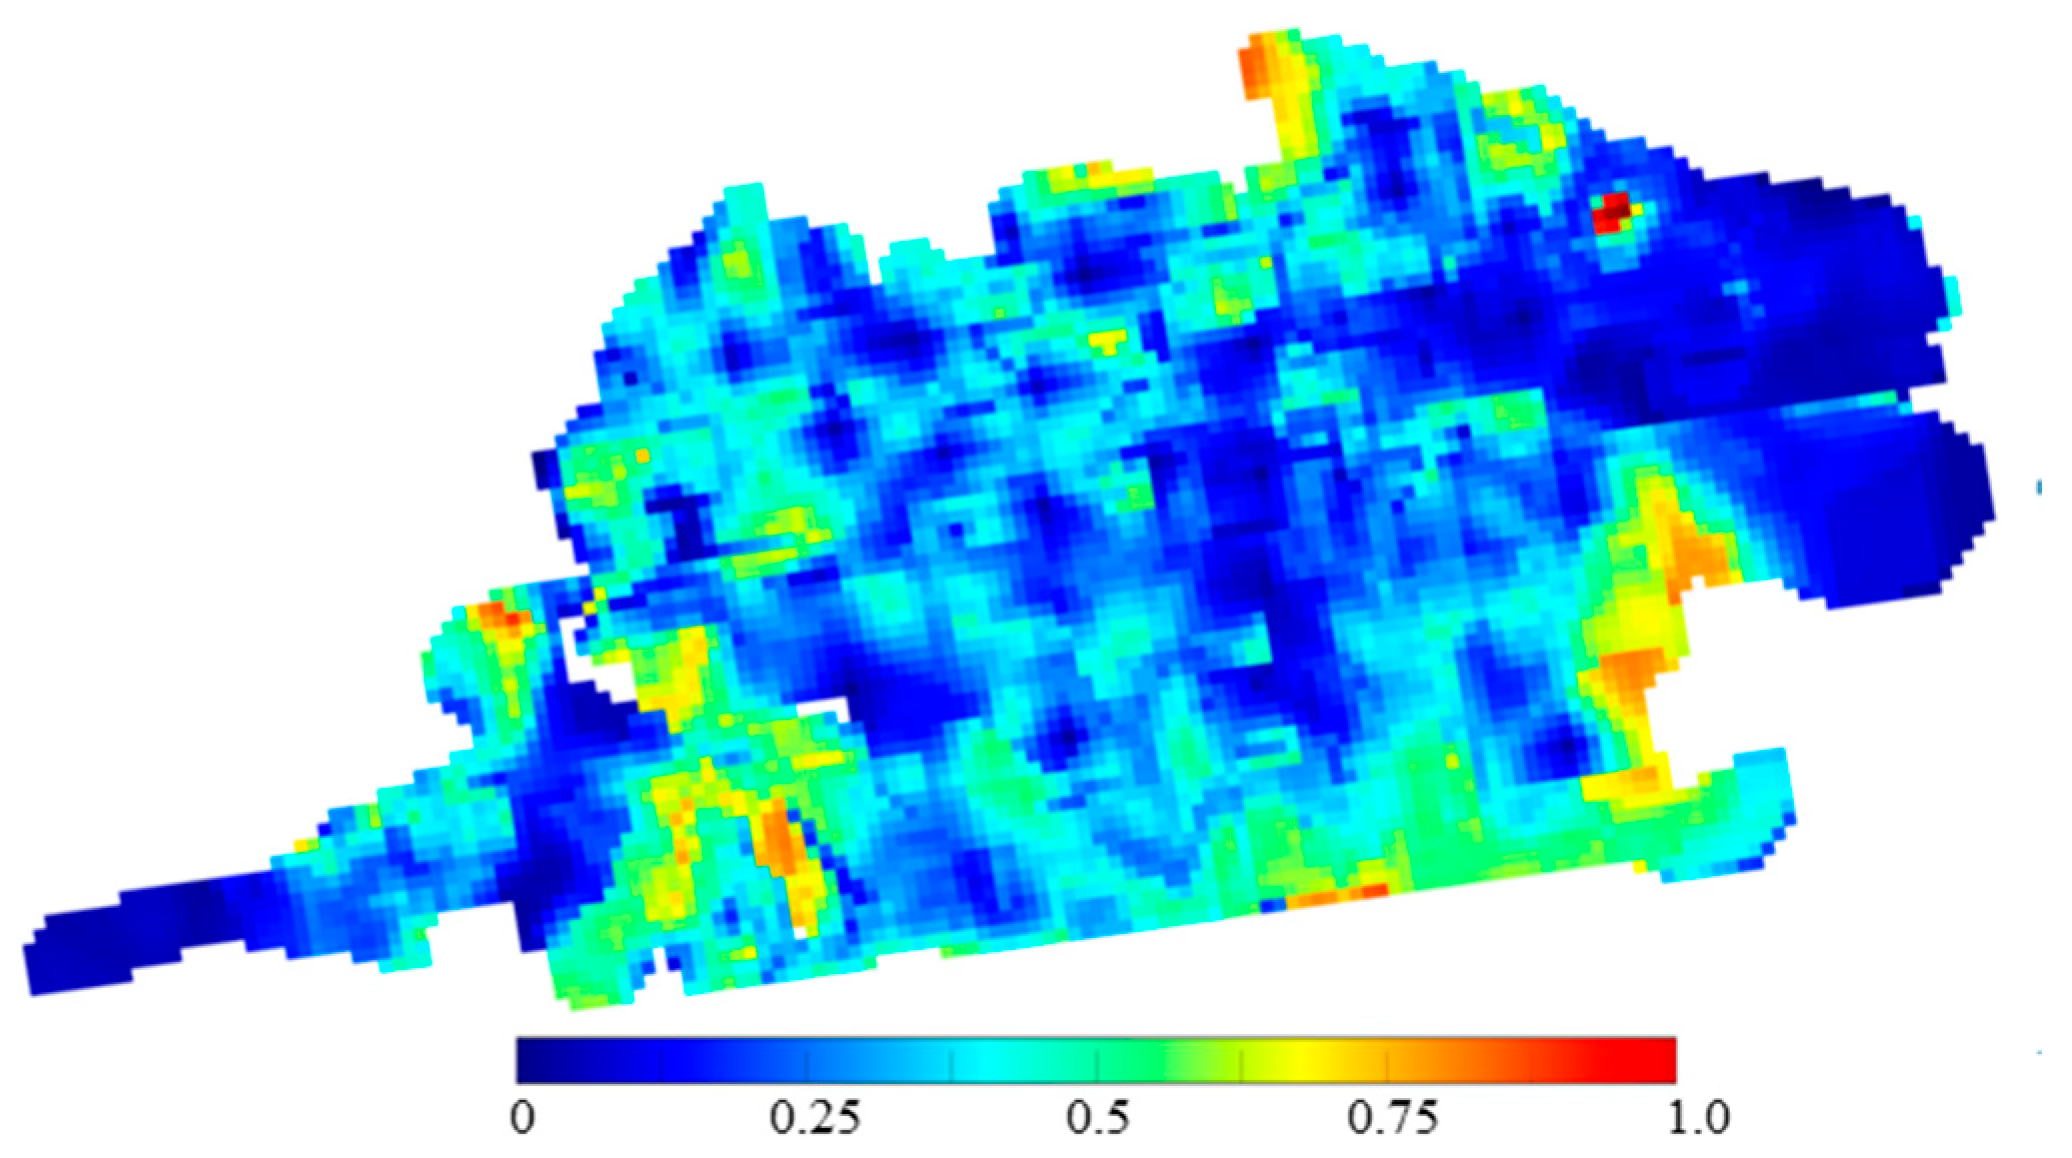
The remaining oil recoverable potential index of each grid unit is calculated using Equation (22), which can comprehensively characterize the influence of the reservoir’s physical properties, recoverable reserve abundance, and oil–water diversion capacity in different regional positions on the remaining oil production potential in the ultra-high water cut stage. Then, the remaining oil recoverable potential map of the NmIL sand body in the ultra-high water cut stage is drawn, as shown in Figure 6.
It can be seen from Figure 6 that when the remaining oil recoverable potential map is used to describe the remaining oil potential in the ultra-high water cut period, the remaining oil recoverable potential in different regions is different, and the dominant potential areas are prominent, which can more accurately and scientifically guide the adjustment of an injection–production well pattern. In the eastern part of the sand body adjacent to the edge water area, the reservoir permeability is generally high, and the local unit conductivity coefficient is also high, leading to serious water flooding and a low abundance of remaining oil advantage potential. Therefore, the remaining oil recoverable potential in this area is low. Similarly, in the high remaining oil saturation area in the northwest of the sand body, the unit conductivity coefficient and the abundance of remaining oil dominant potential are generally low, resulting in a low recoverable potential for the remaining oil in the region. There are localized areas with high remaining oil recoverable potential that can be targeted for the next infill well adjustment. The central well area exhibits high control over well patterns, with relatively perfect injection and production processes. However, there are limited high recoverable potential areas between local wells, reducing the potential for infill adjustments. Currently, the areas with high remaining oil recoverable potential in the main layer are typically situated at the edges of the sand body, especially in the southwest and southeast, where permeability is high, the oil-phase flow ability is strong, and remaining oil recoverable potential is prominent. The degree of well-pattern control is lower in these areas, making them prime candidates for infill well adjustments.

4.3. Infill Well Location Optimization

Based on the analysis of the remaining oil recoverable potential of the main production layer NmIL sand body in the southern area of the oilfield, the infill well location optimization method is applied to optimize the infill well location of the target block. In this optimization problem, the optimization variables are the coordinates of the heel end, the length of the well, the deviation angle, and the azimuth angle of each infill well. When conducting the optimization of the infill well location, the optimized infill well location should not change the well-pattern infill mode.
The objective function is to seek the maximum NPV, and the related economic parameters are listed in Table 1. The well spacing between any two wells needs to be greater than 100 m, the well length should not exceed 250 m, the well deviation angle needs to be less than 50°, and the infill well range constraint is determined using the remaining oil potential analysis in the previous section. Therefore, the constraint conditions of the optimization problem include the feasible infill range constraint, minimum well distance constraint, well length constraint, and well inclination constraint. The heel-end coordinate constraint, well length constraint, and well inclination constraint are treated using the truncation method, the toe-end coordinate constraint is treated using the direct rejection method, and the minimum well distance constraint is treated using the adaptive penalty function method. The PSO-MADS algorithm is used to solve the problem. The number of iterations is 50, the number of populations is 100, and the optimization is performed independently 10 times.
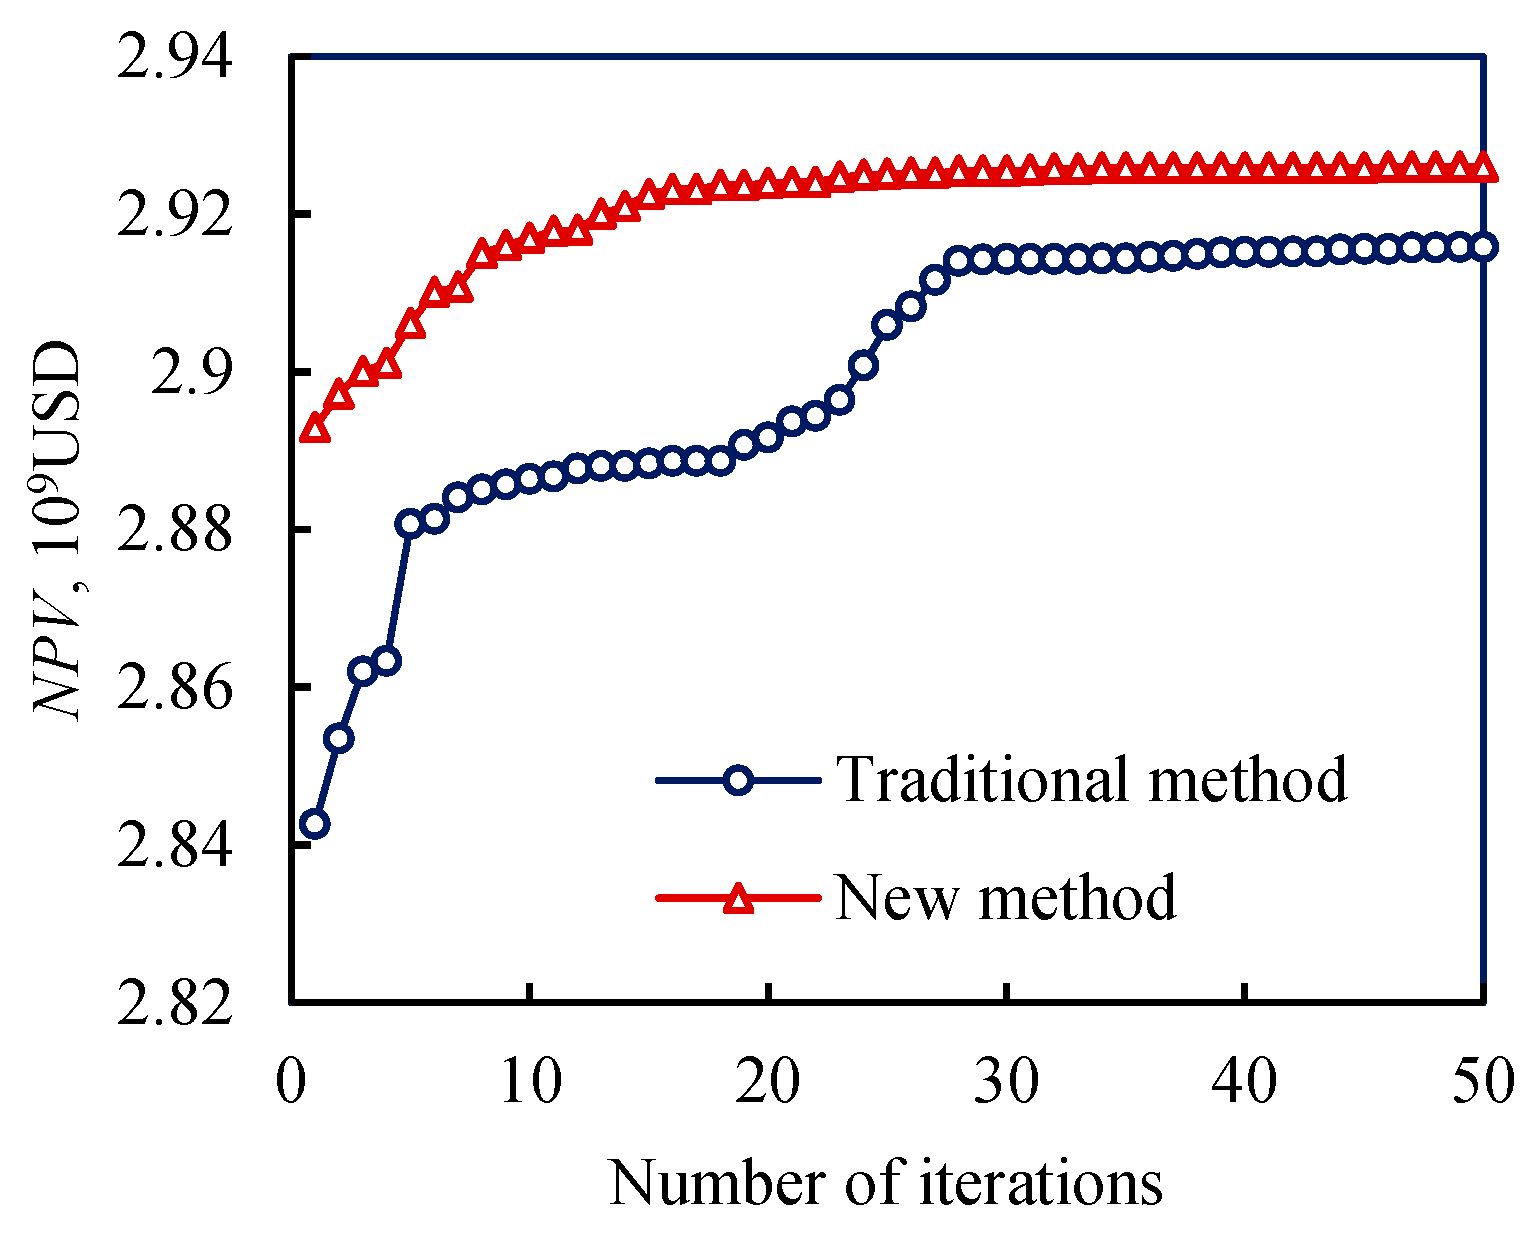
To analyze the difference between the remaining oil potential-based infill well optimization method and the conventional infill well optimization method in terms of the development effect, this section adopts the conventional infill well optimization method and the new method, respectively. The conventional infill well optimization method means that the infill well location is optimized throughout the reservoir. Based on the analysis of the remaining oil potential, the new method determines the region with encryption potential and then optimizes the region. As shown in Figure 7, the average iteration curve obtained using the two methods is that the initial infill well location of the conventional method is randomly given within the reservoir range, while the initial infill well location of the new method is given within the range of potential for infill. Therefore, the NPV obtained using the initial scheme of the two methods is different, and the NPV obtained using the new method is higher than that of the traditional method.
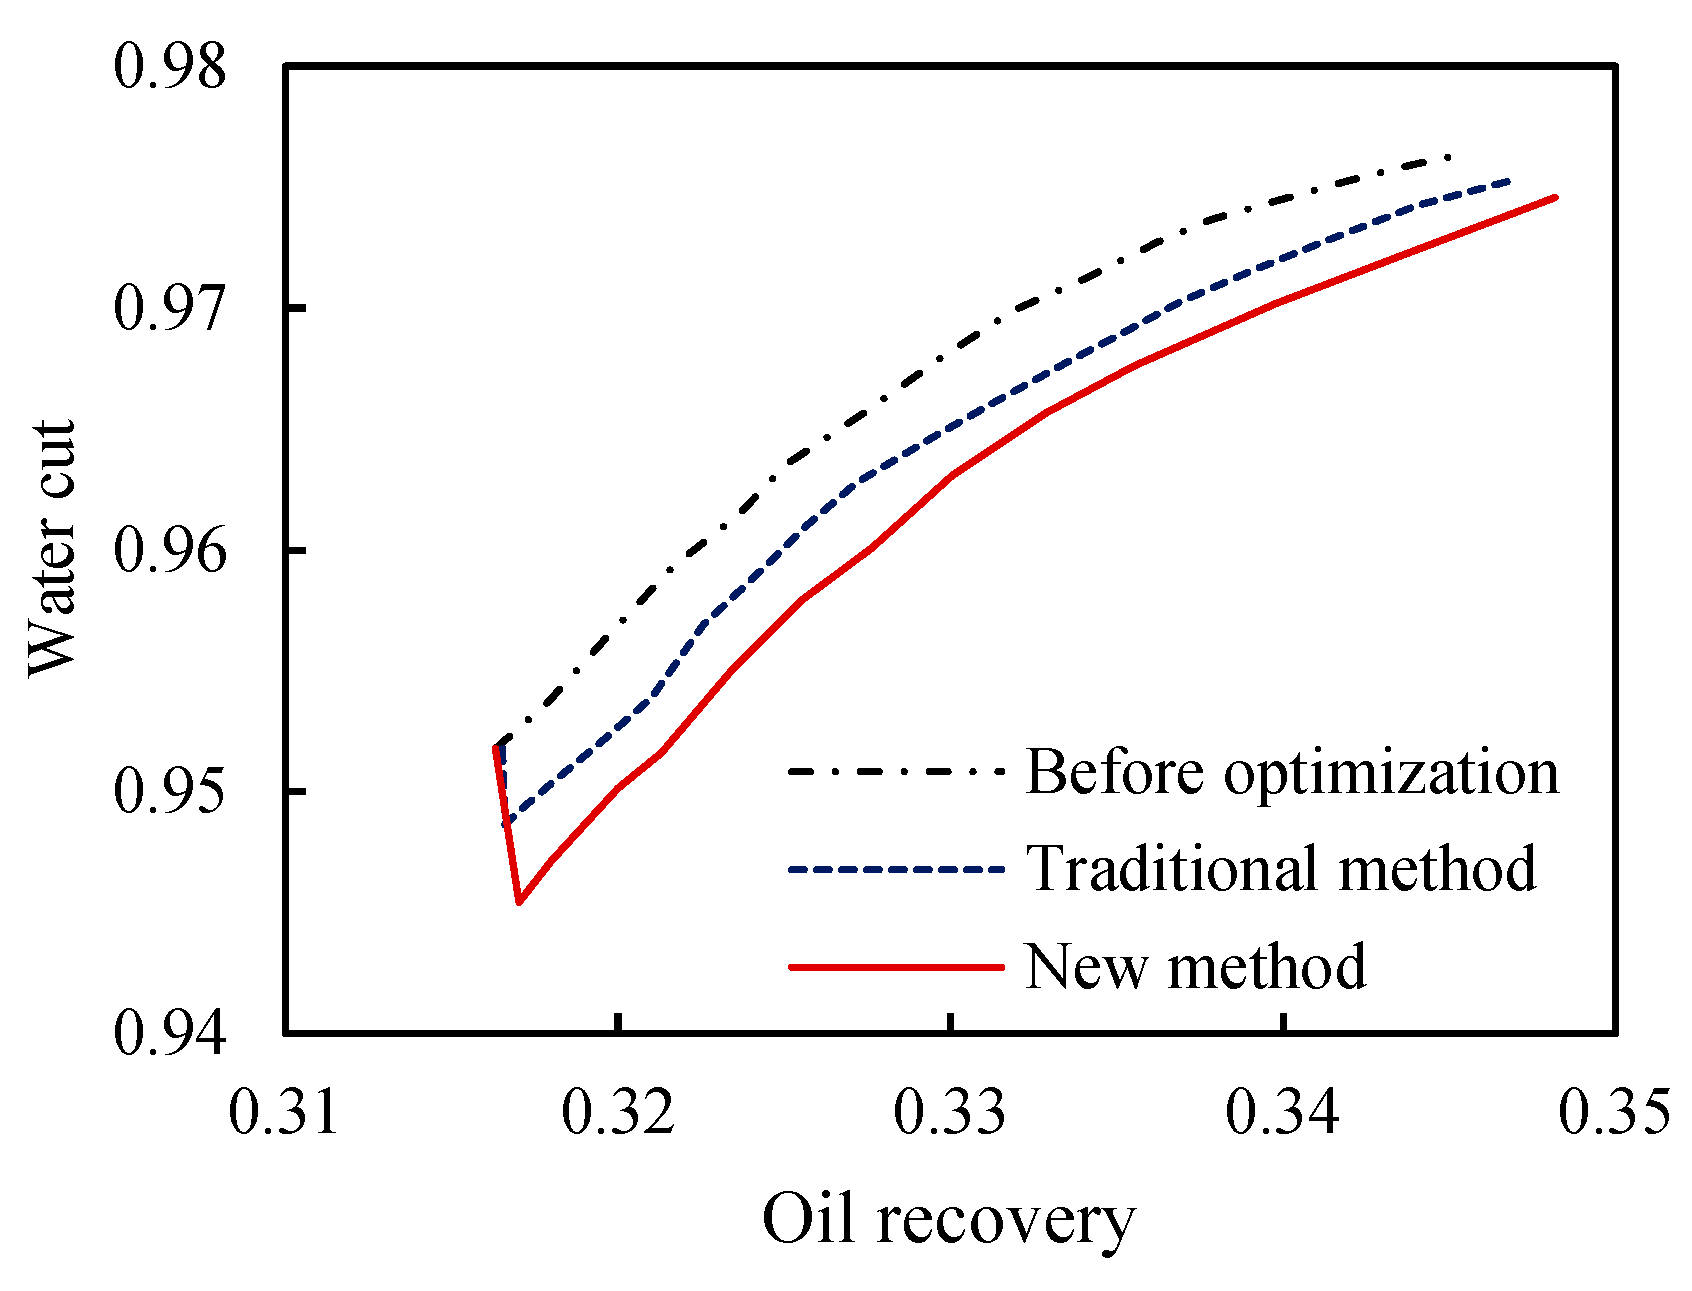
The relationship curves of water cut and oil recovery before and after optimization are shown in Figure 8. It can be seen that when the same water cut is reached, the oil recovery after optimization is higher than that before optimization, and the development effect of the target block is improved. Moreover, the reservoir development effect can be improved greatly by using the infill well location optimization method based on the remaining oil potential.
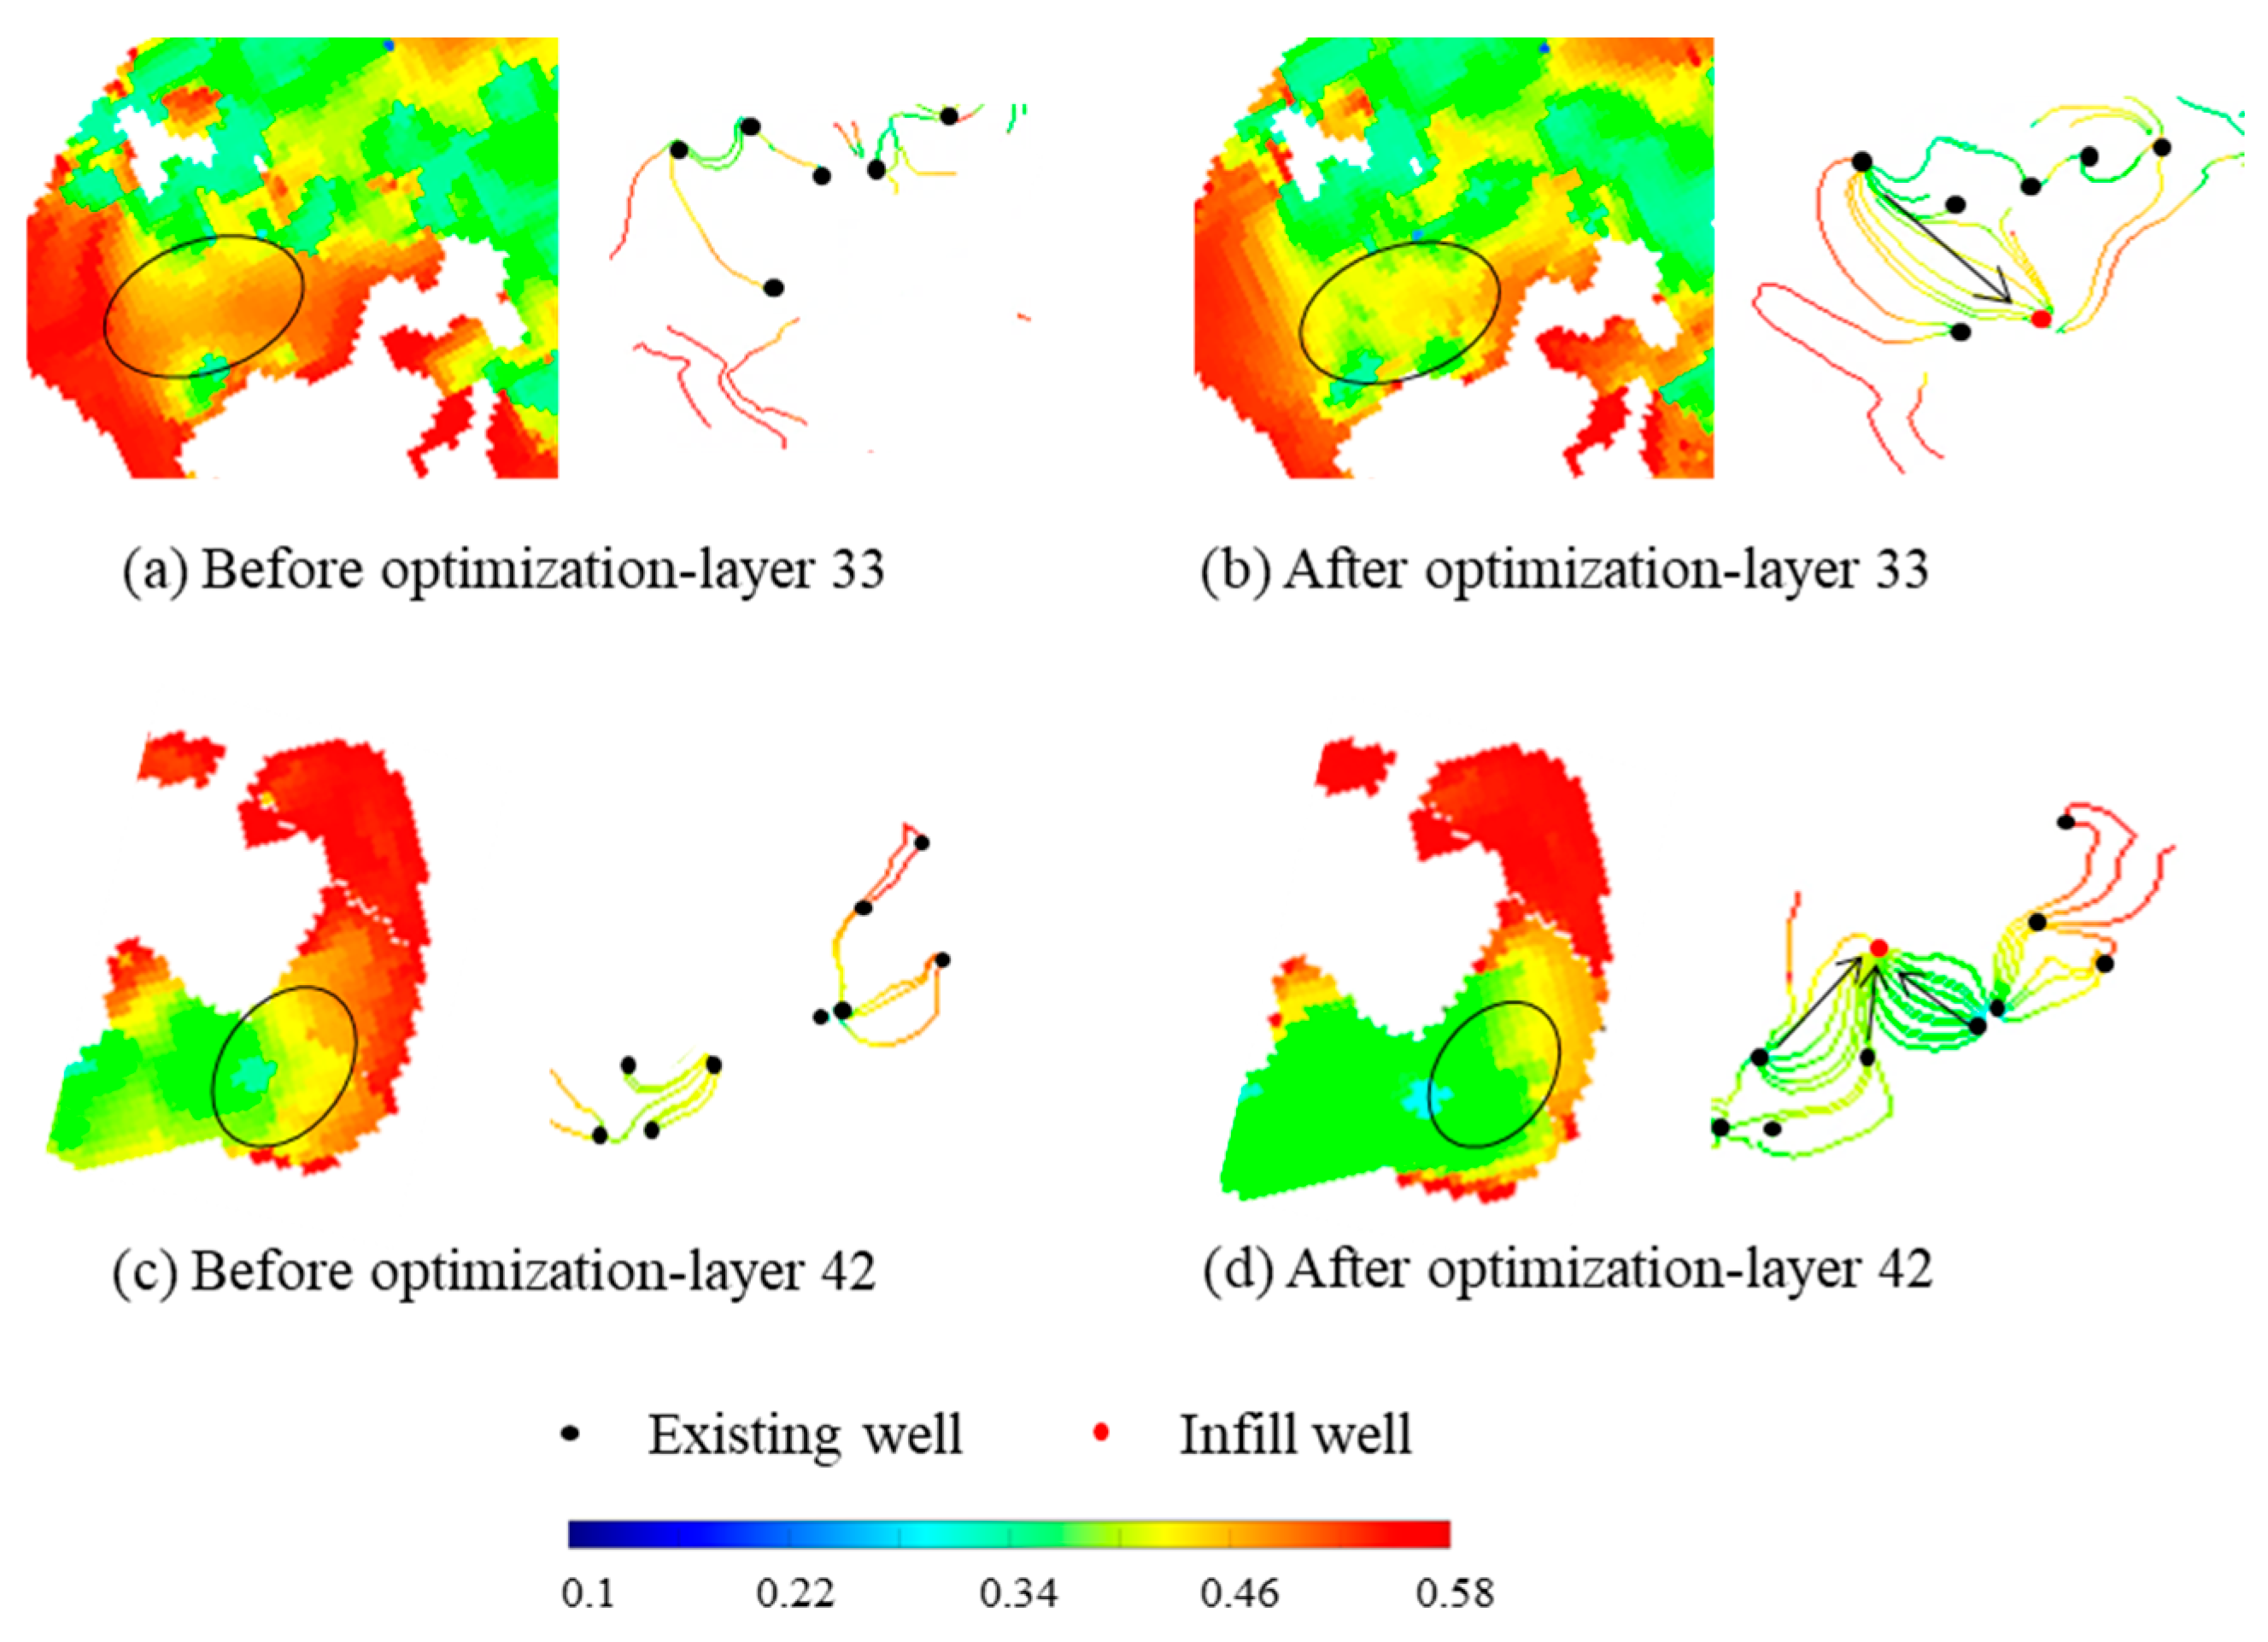
Table 2 shows the well location parameters of the optimized infill well of the new method. Figure 9 shows the remaining oil saturation distribution and streamline field distribution before and after optimization. It can be seen from the figure that after the well was encrypted, the remaining oil in the vicinity was significantly utilized. From the perspective of streamline distribution, the increase in the efficiency direction of a single well allows for more streamlines to flow to places with a high remaining oil saturation, which enables the remaining oil that cannot be replaced by the original flow line to be effectively utilized, the remaining oil distribution is more balanced, and the development effect becomes better.

5. Conclusions

This study comprehensively addresses the impacts of a reservoir’s physical properties, recoverable reserve abundance, and oil–water diversion capacity on the production potential of remaining oil in ultra-high water cut reservoirs. It establishes evaluation indices, including the unit conductivity coefficient, unit remaining oil dominant potential abundance, and unit oil content index, to assess the recoverable potential of remaining oil. By integrating the accelerated genetic algorithm and projection pursuit model, we determine the objective weight of each evaluation index and develop a quantitative evaluation method for remaining oil recoverable potential in ultra-high water cut reservoirs.
Building upon this foundation, we formulate a mathematical model for optimizing the well location of infill wells. This model optimizes the well location coordinates, well length, well inclination angle, and azimuth angle of infill wells. Field application demonstrates that relying solely on a single index, such as saturation, to describe the remaining oil recoverable potential may lead to contradictions or issues. This approach often struggles to effectively guide the potential tapping of remaining oil during the ultra-high water cut period. In contrast, the index for remaining oil recoverable potential enables evaluations across different regions, providing clear guidance for optimizing infill well locations.
In the future, studying the number of infill wells will be necessary to optimize the infill well system effectively. Additionally, this study should integrate well-pattern adjustments for comprehensive optimization, including well switching states, well types, and so forth.

Author Contributions

Conceptualization, Q.F.; methodology, C.L. and X.Z.; software, C.L. and S.L.; validation, C.L., W.Z., and S.L.; formal analysis, C.L. and S.L.; resources, C.L. and W.Z.; data curation, C.L.; writing—original draft preparation, C.L. and S.L.; writing—review and editing, Q.F. and X.Z.; visualization, X.Z. and S.L.; supervision, Q.F.; project administration, C.L.; funding acquisition, W.Z. All authors have read and agreed to the published version of the manuscript.

Funding

This work is supported by the State Major Science and Technology Projects of China (2016ZX05025-001) and Major Science and Technology Projects of CNOOC (KJGG2021-0501).

Data Availability Statement

The original contributions presented in the study are included in the article, further inquiries can be directed to the corresponding author.

Conflicts of Interest

The authors have received research grants from the CNOOC Research Institute Co., Ltd.

References

  1. Guo, J.; Yang, E.; Zhao, Y.; Fu, H.; Dong, C.; Du, Q.; Zheng, X.; Wang, Z.; Yang, B.; Zhu, J. A New Method for Optimizing Water-Flooding Strategies in Multi-Layer Sandstone Reservoirs. Energies 2024, 17, 1828. [Google Scholar] [CrossRef]
  2. Ng, C.S.W.; Ghahfarokhi, A.J.; Wiranda, W. Fast Well Control Optimization with Two-Stage Proxy Modeling. Energies 2023, 16, 3269. [Google Scholar] [CrossRef]
  3. Chen, H.; Feng, Q.; Zhang, X.; Wang, S.; Ma, Z.; Zhou, W.; Liu, C. A meta-optimized hybrid global and local algorithm for well placement optimization. Comput. Chem. Eng. 2018, 117, 209–220. [Google Scholar] [CrossRef]
  4. Chen, H.; Feng, Q.; Zhang, X.; Wang, S.; Zhou, W.; Liu, C. Well placement optimization for offshore oilfield based on Theil index and differential evolution algorithm. J. Pet. Explor. Prod. Technol. 2017, 8, 1225–1233. [Google Scholar] [CrossRef]
  5. Chen, H.; Feng, Q.; Zhang, X.; Wang, S.; Zhou, W.; Liu, F. Well Placement Optimization With Cat Swarm Optimization Algorithm Under Oilfield Development Constraints. J. Energy Resour. Technol. 2018, 141, 012902. [Google Scholar] [CrossRef]
  6. Sharifipour, M.; Nakhaee, A.; Yousefzadeh, R.; Gohari, M. Well placement optimization using shuffled frog leaping algorithm. Comput. Geosci. 2021, 25, 1939–1956. [Google Scholar] [CrossRef]
  7. Zhou, J.; Wang, H.; Xiao, C.; Zhang, S. Hierarchical Surrogate-Assisted Evolutionary Algorithm for Integrated Multi-Objective Optimization of Well Placement and Hydraulic Fracture Parameters in Unconventional Shale Gas Reservoir. Energies 2022, 16, 303. [Google Scholar] [CrossRef]
  8. Tavallali, M.; Karimi, I.; Teo, K.; Baxendale, D.; Ayatollahi, S. Optimal producer well placement and production planning in an oil reservoir. Comput. Chem. Eng. 2013, 55, 109–125. [Google Scholar] [CrossRef]
  9. Tavallali, M.S.; Karimi, I.A. Integrated oil-field management: From well placement and planning to production scheduling. Ind. Eng. Chem. Res. 2016, 55, 978–994. [Google Scholar] [CrossRef]
  10. Park, H.-Y.; Yang, C.; Al-Aruri, A.D.; Fjerstad, P.A. Improved decision making with new efficient workflows for well placement opti-mization. J. Pet. Sci. Eng. 2017, 152, 81–90. [Google Scholar] [CrossRef]
  11. Al Dossary, M.A.; Nasrabadi, H. Well Placement optimization using imperialist competition algorithm. J. Pet. Sci. Eng. 2016, 147, 237–248. [Google Scholar] [CrossRef]
  12. Yousefzadeh, R.; Sharifi, M.; Rafiei, Y. An efficient method for injection well location optimization using fast marching method. J. Pet. Sci. Eng. 2021, 204, 108620. [Google Scholar] [CrossRef]
  13. Wang, X.; Haynes, R.D.; He, Y.; Feng, Q. Well control optimization using derivative-free algorithms and a multiscale approach. Comput. Chem. Eng. 2018, 123, 12–33. [Google Scholar] [CrossRef]
  14. Wang, X.; Haynes, R.D.; Feng, Q. A multilevel coordinate search algorithm for well placement, control and joint optimization. Comput. Chem. Eng. 2016, 95, 75–96. [Google Scholar] [CrossRef]
  15. Akın, S.; Kok, M.V.; Uraz, I. Optimization of well placement geothermal reservoirs using artificial intelligence. Comput. Geosci. 2010, 36, 776–785. [Google Scholar] [CrossRef]
  16. Ding, S.; Jiang, H.; Li, J.; Liu, G.; Mi, L. Optimization of well location, type and trajectory by a modified particle swarm optimization algorithm for the PUNQ-S3 model. J. Ind. Intell. Inf. 2016, 4, 27–33. [Google Scholar] [CrossRef]
  17. Hamida, Z.; Azizi, F.; Saad, G. An efficient geometry-based optimization approach for well placement in oil fields. J. Pet. Sci. Eng. 2017, 149, 383–392. [Google Scholar] [CrossRef]
  18. Badru, O.; Kabir, C. Well placement optimization in field development. In In Proceedings of the SPE Annual Technical Conference and Exhibition? Denver, CO, USA, 5–8 October 2003; SPE-84191-MS. SPE: Richardson, TX, USA, 2003. [Google Scholar] [CrossRef]
  19. Onwunalu, J.E.; Durlofsky, L.J. A new well-pattern-optimization procedure for large-scale field development. SPE J. 2011, 16, 594–607. [Google Scholar] [CrossRef]
  20. Nasrabadi, H.; Morales, A.; Zhu, D. Well placement optimization: A survey with special focus on application for gas/gas-condensate reservoirs. J. Nat. Gas Sci. Eng. 2012, 5, 6–16. [Google Scholar] [CrossRef]
  21. Cheng, Y.; McVay, D.A.; Lee, W.J. A practical approach for optimization of infill well placement in tight gas reservoirs. J. Nat. Gas Sci. Eng. 2009, 1, 165–176. [Google Scholar] [CrossRef]
  22. Awotunde, A.A.; Naranjo, C. Well placement optimization constrained to minimum well spacing. In In Proceedings of the SPE SPE Latin America and Caribbean Petroleum Engineering Conference, Maracaibo, Venezuela, 21–23 May 2014; SPE-169272-MS. SPE: Richardson, TX, USA, 2014. [Google Scholar] [CrossRef]
  23. Bellout, M.C.; Ciaurri, D.E.; Durlofsky, L.J.; Foss, B.; Kleppe, J. Joint optimization of oil well placement and controls. Comput. Geosci. 2012, 16, 1061–1079. [Google Scholar] [CrossRef]
  24. Rodrigues, H.; Prata, B.; Bonates, T. Integrated optimization model for location and sizing of offshore platforms and location of oil wells. J. Pet. Sci. Eng. 2016, 145, 734–741. [Google Scholar] [CrossRef]
  25. Udy, J.; Hansen, B.; Maddux, S.; Petersen, D.; Heilner, S.; Stevens, K.; Lignell, D.; Hedengren, J.D. Review of field development optimization of waterflooding, EOR, and well placement focusing on history matching and optimization algorithms. Processes 2017, 5, 34. [Google Scholar] [CrossRef]
  26. Islam, J.; Vasant, P.M.; Negash, B.M.; Laruccia, M.B.; Myint, M.; Watada, J. A holistic review on artificial intelligence techniques for well placement optimization problem. Adv. Eng. Softw. 2020, 141, 102767. [Google Scholar] [CrossRef]
  27. Malozyomov, B.V.; Martyushev, N.V.; Kukartsev, V.V.; Tynchenko, V.S.; Bukhtoyarov, V.V.; Wu, X.; Tyncheko, Y.A.; Kukartsev, V.A. Overview of Methods for Enhanced Oil Recovery from Conventional and Unconventional Reservoirs. Energies 2023, 16, 4907. [Google Scholar] [CrossRef]
  28. Da Cruz, P.S.; Horne, R.N.; Deutsch, C.V. The quality map: A tool for reservoir uncertainty quantification and decision making. SPE Reserv. Eval. Eng. 2004, 7, 6–14. [Google Scholar] [CrossRef]
  29. Ding, S.; Lu, R.; Xi, Y.; Yue, J.; Liu, G.; Reynolds, A.C.; Yu, H. Optimizing vertical and deviated wells based on advanced initialization using new productivity potential map. J. Pet. Sci. Eng. 2020, 198, 108263. [Google Scholar] [CrossRef]
  30. Liu, N.; Jalali, Y. Closing the loop between reservoir modeling and well placement and positioning. In In Proceedings of the SPE SPE Intelligent Energy International Conference and Exhibition, Amsterdam, The Netherlands, 11–13 April 2006; SPE-98198-MS. SPE: Richardson, TX, USA, 2006. [Google Scholar] [CrossRef]
  31. Ding, S.; Jiang, H.; Li, J.; Tang, G. Optimization of well placement by combination of a modified particle swarm optimization algorithm and quality map method. Comput. Geosci. 2014, 18, 747–762. [Google Scholar] [CrossRef]
  32. Molina, A.R.; Rincon, A.A. Exploitation plan design based on opportunity index analysis in numerical simulation models. In In Proceedings of the SPE SPE Latin America and Caribbean Petroleum Engineering Conference, Cartagena de Indias, Colombia , 31 May–30 June 2009; SPE-122915-MS. SPE: Richardson, TX, USA. [Google Scholar] [CrossRef]
  33. Karim, M.G.A.; Raub, M.R.B.A. Optimizing development strategy and maximizing field economic recovery through simulation opportunity index. In In Proceedings of the SPE SPE Reservoir Characterisation and Simulation Conference and Exhibition? Abu Dhabi, UAE, 9–11 October 2011 ; SPE-148103-MS. SPE: Richardson, TX, USA. [Google Scholar] [CrossRef]
  34. Varela-Pineda, A.; Hutheli, A.H.; Mutairi, S.M. Development of mature fields using reservoir opportunity index: A case study from a Saudi field. In In Proceedings of the SPE SPE Kingdom of Saudi Arabia Annual Technical Symposium and Exhibition, Al-Khobar, Saudi Arabia, 21–24 April 2014; SPE-172231-MS. SPE: Richardson, TX, USA. [Google Scholar] [CrossRef]
  35. Ataei, A.; Soni, S.; Chuah, B.; Huey, H.Y. Reservoir opportunity index—Advance in well and subsurface design for cost effective field development. In In Proceedings of the SPE SPE Asia Pacific Oil and Gas Conference and Exhibition, Adelaide, Australia, 14–16 October 2014; SPE-171460-MS. SPE: Richardson, TX, USA. [Google Scholar] [CrossRef]
  36. Geng, Z.; Jiang, H.; Chen, M.; Sun, M.; Zeng, Y. A new method for quantitative characterization on remaining oil potential in high water cut oil reservoirs. Pet. Geol. Recovery Effic. 2007, 6, 100–102. [Google Scholar]
  37. Ding, S.; Jiang, H.; Zhou, D.; Zhao, Y.; Kuang, X.; Wang, Q.; Wang, P. A new method for quantitatively evaluating the remaining oil potential of reservoir at medium-high water-cut stage and its application. Complex Hydrocarb. Reserv. 2016, 9, 41–45. [Google Scholar]
  38. Yu, S.; Lu, H. An integrated model of water resources optimization allocation based on projection pursuit model—Grey wolf optimization method in a transboundary river basin. J. Hydrol. 2018, 559, 156–165. [Google Scholar] [CrossRef]
  39. Sawyerr, B.; Adewumi, A.; Ali, M. Real-coded genetic algorithm with uniform random local search. Appl. Math. Comput. 2013, 228, 589–597. [Google Scholar] [CrossRef]
  40. Yu, X.; Li, X.; Wu, S. Dynamic evaluation of water resources sustainability in the Pearl River Delta based on the combined weight-cloud model. J. Water Resour. Water Eng. 2023, 34, 75–83. [Google Scholar]
  41. Isebor, O.J.; Durlofsky, L.J.; Ciaurri, D.E. A derivative-free methodology with local and global search for the constrained joint optimization of well locations and controls. Comput. Geosci. 2013, 18, 463–482. [Google Scholar] [CrossRef]
  42. Humphries, T.D.; Haynes, R.D.; James, L.A. Simultaneous and sequential approaches to joint optimization of well placement and control. Comput. Geosci. 2013, 18, 433–448. [Google Scholar] [CrossRef]
  43. Audet, C.; Dzahini, K.J.; Kokkolaras, M.; Le Digabel, S. Stochastic mesh adaptive direct search for blackbox optimization using prob-abilistic estimates. Comput. Optim. Appl. 2021, 79, 1–34. [Google Scholar] [CrossRef]
Figure 1. Sketch of optimization variables for infill well placement (Red solid line represents the well trajectory, and blue dashed lines represents the projection of the well trajectory in three directions).
Energies 17 03492 g001
Figure 2. Flowchart of PSO-MADS optimization.
Energies 17 03492 g002
Figure 3. Flowchart of infill well location optimization method based on remaining oil recoverable potential evaluation.
Energies 17 03492 g003
Figure 4. Distribution map of the remaining oil in the main layer NmIL.
Energies 17 03492 g004
Figure 5. Distribution map of evaluation indicators in main layer NmIL. (a) Unit conductance coefficient, (b) unit remaining oil dominant potential abundance, and (c) oil cut of each grid unit.
Energies 17 03492 g005
Figure 6. Residual oil recoverable potential map of main layer NmIL.
Energies 17 03492 g006
Figure 7. Convergence curve of infilling well placement optimization.
Energies 17 03492 g007
Figure 8. Comparison curve of water cut and oil recovery between optimized and before well infilling projects.
Energies 17 03492 g008
Figure 9. Residual oil saturation and streamline distribution before and after optimization (Black circles represent the comparison areas).
Energies 17 03492 g009
Table 1. Economic parameters for NPV.
ParametersValue
Oil price Co, USD/m3400
Water production cost Cw, USD/m320
Water injection cost CI, USD/m340
Cost of drilling well Cd, USD/m100,000
Annual discount rate b0.1
Table 2. Optimal parameters of infilling well placements.
Infill Well NameHeelWell Length/mAzimuth Angle/°Inclined Angle/°
IN1(7, 88, 1)19524436
IN2(28, 74, 1)22010846
IN3(32, 73, 1)15300
IN4(19, 31, 1)15400
IN5(20, 41, 1)197−6037
IN6(27, 35, 1)192−11636
Disclaimer/Publisher’s Note: The statements, opinions and data contained in all publications are solely those of the individual author(s) and contributor(s) and not of MDPI and/or the editor(s). MDPI and/or the editor(s) disclaim responsibility for any injury to people or property resulting from any ideas, methods, instructions or products referred to in the content.