Article

Research on the Coordinated Trading Mechanism of Demand-Side Resources and Shared Energy Storage Based on a System Optimization Model

1
Wudian New Energy Co., Ltd. of Wuhu City, Wuhu 241012, China
2
Sichuan Energy Internet Research Institute, Tsinghua University, Chengdu 610000, China
3
China Power Gharmony Energy Technology Co., Ltd., Beijing 102488, China
*
Author to whom correspondence should be addressed.
Energies 2024, 17(14), 3378; https://doi.org/10.3390/en17143378
Submission received: 16 May 2024 / Revised: 30 June 2024 / Accepted: 7 July 2024 / Published: 10 July 2024

Abstract

:
With the development of the economy and society, the importance of a secure and stable electricity supply continues to increase. However, the power grid is facing the test of excess installed capacity, the waste of renewable energy, and a low comprehensive utilization rate. This problem stems from the inconsistent peak–valley differences between power production and consumption, and the lack of clear electricity price signals, which disrupts the safe and stable operation of the power market. This paper combines the interactive transactions among clean energy power generation companies, users, and energy storage, explores how the system optimization model can be reflected in the power market through regulatory measures, and formulates the optimal output scheme of the system under the constraints of clean energy power generation forecast data, user base load forecast data, demand-side resource regulation ability, and energy storage system regulation ability to achieve the goals of comprehensive clean energy power consumption and minimum cost for users. A comprehensive analysis of the proposed model was conducted using actual data from a certain province in China, the results show that the consumption of clean energy will increase by 3% to full consumption and the total cost of users will be 32% lower than that of time-of-use (TOU) power prices, which proves the potential of the proposed joint optimization model in absorbing clean energy and the effectiveness of the market mechanism.

1. Introduction

In order to promote the positive absorption of clean energy, many countries have implemented a series of policies to stimulate the development of clean energy, including a carbon tax policy [1], a clean energy subsidy policy [2], a green certificate system [3] and a renewable energy quota system [4]. In order to ensure a reasonable return on clean energy, most countries have adopted measures such as fixed electricity prices and preferential access to power grids to ensure affordable consumption of clean energy. The fixed-price model usually requires grid companies to buy clean energy first at a price higher than the average or market price, with the difference made up by government funds or split among electricity users. The fixed-price model ensures the reasonable income of clean energy but inhibits its vitality to participate in the electricity market. Priority access refers to the preferential opening of grid channels to clean energy. At present, the domestic power market mechanism is still inclined to clean energy, but the uncontrollable power generation of clean energy makes it unable to compete with thermal power.
The participation of clean energy in the electricity market cannot be separated from the cooperative regulation of users and energy storage. There are numerous research studies on demand resources participating in power system regulation, mainly including power demand management methods, incentive mechanisms, market participation mechanisms, and other subdivided fields. Quan Shengming made a comparative analysis of the successful experience of the New York Power Dispatching Center, the PJM market operator, the New England Power Dispatching Center, and the California Power Dispatching Center in introducing the demand-side response mechanism, and provided corresponding enlightenment based on the actual problems faced by China [5]. Research on incentive mechanisms mainly focuses on the impact of price on the response behavior of users using demand-side resources. Wu Weihua sorted out the development status of demand-side response, analyzed the relevant international research on demand-side response, and summarized the two existing implementation methods of demand-side response: price and incentive. Finally, suggestions are put forward according to the current situation of demand-side development in China, based on the study of the relationship and influence between the two implementation methods of demand-side response and the operation of the power system [6]. The research on market mechanisms mainly focuses on the mechanism of demand-side participation response under the current situation of power market construction. Wang Liying pointed out that power demand response is a means of multi-energy supply and demand balance. In order to minimize the daily operating cost of the multi-energy cooperative system, the optimal operation model of the multi-energy cooperative system under the price-based demand response mechanism was constructed. It is verified that this model can significantly improve the economy of the whole system [7].
The application of energy storage is considered to be the best means to realize fast dynamic matching between power supply and demand [8]. However, most energy storage users do not have the ability to build energy storage systems because of the large scale of investment and long period of investment return. In addition, due to the lack of a mature business model, energy storage system investors did not obtain the ideal income, which restricted the development of energy storage systems. In order to solve these problems, domestic and foreign scholars put forward the business model of “shared energy storage”, which improves the utilization rate and income level of the energy storage system using “renting instead of buying”, sharing the income from saving electricity, virtual power plant and community energy storage [9,10,11], and enhances its ability to participate in the adoption of renewable energy by providing services to more energy storage users. However, due to the lack of market trading mechanisms at this stage, market participants need to face greater uncertainty in electricity prices and electricity demand. Therefore, economic optimization algorithms such as the Model Predictive Control Approach [12] and the Two-Stage Stochastic P-Robust Approach [13] are proposed to deal with uncertainty, but due to their complexity, only approximate solutions can be obtained.
In summary, the efforts of researchers can be divided into four aspects. First, the researchers aim to improve the public’s acceptance and awareness of clean energy, and analyze the impact of changes in public perception on the consumption of clean energy; second, researchers call for the implementation of direct economic stimulus policies (such as feed-in tariffs, power generation subsidies, green certificates, etc.) and indirect support policies (such as carbon taxes) that are conducive to the development of clean energy power; third, researchers actively explore the reform plan of the electricity market and cultivate a mature power market system; and fourth, due to the uncertainty and high computational complexity of complex power systems, iterative optimization can often only be used to find approximate solutions instead of optimal solutions.
Even though the development of clean energy electricity has made remarkable achievements so far, some problems that restrict its long-term development should not be ignored. The first problem is that it fails to effectively play the role of scattered social capital. The high cost of clean energy power installations determines the market barrier to entry. However, the long-term development of clean energy power cannot only rely on these channels. The entry of scattered social capital can reduce the financing cost of clean energy power construction [14]. How to attract social capital to invest in clean energy power construction is currently a hot topic for experts and scholars at home and abroad [15,16]. Existing research results show that a stable investment environment [17], a sound financial system [18], and clear income channels are important influencing factors for attracting social capital. Second, the existing power system is not yet able to accommodate a high proportion of clean energy access. Centralized optimization through large power grids faces practical problems such as high construction costs and high computational complexity. For this reason, distributed energy bases and park microgrids under a highly market-oriented competition mode are more conducive to the consumption of clean energy power, the uncertainty of the power system is reduced and easier to calculate under the determined market condition parameters, and the exact solution can be obtained under the complex system instead of the approximate solution. Third, the absorption way to adapt to the characteristics of clean energy power generation is not mature. Therefore, domestic and foreign experts and scholars focus on the demand side [19], hoping to intervene in the demand-side electricity consumption to adapt to the output characteristics of clean energy power. At present, the research fields of scholars include electric vehicles [20], intelligent buildings, virtual power plants [21], household energy management [22], chemical energy storage [23], etc. Although there are some successful cases for reference, how to consume large-scale and different types of clean energy electricity modes still needs to be further studied. Fourth, the market mechanism and trading mode suitable for the long-term development of clean energy power are still to be explored. In general, the installed scale of clean energy power expands rapidly, but it is quickly eliminated by the market when the market mechanism and trading mode are not mature, resulting in a waste of resources [24]. Experts have expounded the market mechanism and trading mode from different perspectives [25], which has laid a good foundation for subsequent research. However, the existing research focuses on the macro level, which is of limited reference value to market players. More research on the micro level needs to be further explored.
Based on the issues and limitations of the above research, this article designs a new model of user-side resources and shared energy storage under the policy background of China, in order to jointly absorb clean energy. Firstly, the decomposition mechanism of energy consumption and energy storage cost under the condition of multiple clean energy supplies and a multi-user cross-use energy storage system is established. Secondly, a system optimization model is established in which the demand-side resources and shared energy storage systems co-consume clean energy with the goal of maximizing user benefits. Finally, based on the actual data of a province in China, the proposed model is comprehensively analyzed to compare the income difference between the proposed model and the existing clean energy consumption approaches.
On the basis of previous research, this paper innovatively establishes a trading model for the coordinated consumption of clean energy by demand-side resources and shared energy storage and proposes an energy storage service mechanism for the orderly deployment of shared energy storage systems in accordance with the principles of safety and economy. The effectiveness of the model is verified by accurately solving the prediction data of clean energy power generation, user baseload prediction data, demand-side resource response capacity data, and energy storage system operation data. The research framework of this paper is shown as Figure 1:

2. Transaction Mode Design under the New Mode

2.1. Design of Trading Mechanism

Due to the immaturity of China’s inter-provincial market-based trading model, most of the cross-regional energy dispatch is still pre-planned. The provincial power systems can be approximated as regional self-balancing after deducting the national export plan in advance. At the same time, due to the existence of China’s renewable energy consumption responsibility system, the Chinese government places more emphasis on territorial responsibility for renewable energy consumption, which also puts forward higher requirements for the regional self-balancing mechanism.
In the context of China’s reality, the main goal of this article is to achieve localized consumption of new energy as much as possible under the premise of profitability, in order to achieve an on-site balance of renewable energy consumption. Since the fact that regional self-balancing consumption is more stringent for provinces with abundant renewable energy compared to the situation of free cross-border energy flow, it can better verify the effectiveness of the model and achieve optimal matching supply of electricity while meeting the constraints of relevant indicators for grid operation.
Sharing energy storage service providers can ensure the smooth implementation of Clean Energy Collaborative consumption transactions by suppressing the fluctuation of the power system. When the power generation output exceeds the maximum regulation capacity of user demand and demand-side resources, the excess power can be stored in the energy storage system. Similarly, when the generation output value is lower than the minimum operating load level of user demand and demand-side resources, the power demand can also be obtained from the energy storage system. The shared energy storage service provider gains profit and obtains a return on investment by providing the right to use the energy storage equipment for these two types of users.
The main body participating in the collaborative consumption transaction can also participate in the excess consumption trading market and the green certificate trading market. The excessive consumption trading market is mainly aimed at users, who can sell the excessive renewable energy quota index to obtain additional income. The green certificate trading market is mainly aimed at clean energy power generation companies, especially non-water renewable energy power generation companies, whose green power certificates can be sold to obtain additional income.
At present, the cost of shared energy storage is priced through a market-based mechanism [26], and users can participate in the bidding for the power and capacity of energy storage equipment to obtain the right to use energy storage for a period of continuous time, and its charging and discharging power can be flexibly adjusted according to the needs of users [27]. Since the price of power rights and capacity rights of energy storage is determined by market-based bidding, the final pricing is closely related to market conditions. Based on the research in the above literature, this paper proposes the price calculation method of power right and capacity right as shown in formula (1):
Q S S n j = V S S n j r e s S S n t 1 P S S n j × Q ( T S S n j )
where R A N K S S n j is the dispatching sequence of shared energy storage service provider i in the j th quotation and V S S n j is its adjustment ability; r e s S S n t 1 is the historical response level, which is obtained from the comprehensive score of the historical level performance of the energy storage quotient, of which the value is in [0, 1]; P S S n j is its service price; R A N K ( T S S n j ) is the order of declaration time.
× ” means such a calculation logic: when clearing, first calculate the capacity, price, and historical response level ratio of the applicant, so as to obtain the comprehensive indicators of its economy and applicability. The internal logic of the above indicators is as follows: in the case of the same adjustment capacity, the lower the price, the higher the comprehensive index coefficient, and the higher the ranking; in the case of the same price, the greater the adjustment ability, the higher the comprehensive index coefficient, and the higher the ranking. If the comprehensive indicators of the two declaration entities are the same, they will be ranked according to their declaration time, and the earlier the time is, the higher the ranking will be.
The maximum regulating demand capacity of the next day consists of two parts: one is the pre-use regulating capacity of the shared energy storage system in the collaborative consumption trading mode, which comes from the mismatch of load on the power generation side and the power side; and the other is the safety margin of the system, which is determined by the work experience of power dispatching personnel, and can float up a certain proportion based on the pre-use adjustment capacity according to historical data.

2.2. Decomposition of Electricity Quantity and Energy Storage Cost

2.2.1. Decomposition of Clean Energy Consumption

The decomposition of electricity consumption is an important basis for subsequent settlement, which follows the following principles: after obtaining the overall optimization results of the system, the dispatching organization decomposes the electricity consumption according to the total electricity consumption of each user and the power system supply state at the time of electricity consumption. The specific steps are as follows:
(1) Calculate the proportion of various types of clean energy generation in the initial time of the power system:
e s o l a r t = 1 = E s o l a r t = 1 E T o t a l t = 1 ,   e w i n d t = 1 = E w i n d t = 1 E T o t a l t = 1
where E s o l a r t = 1 and E w i n d t = 1 are the photovoltaic and wind power output of the system at the initial time, respectively; E T o t a l t = 1 is the total power generation of the system at the initial time; e s o l a r t = 1 and e w i n d t = 1 are the proportion of photovoltaic power generation and wind power generation, respectively, among which e s o l a r t = 1 + e w i n d t = 1 = 1 .
(2) The initial distribution of the user’s power consumption composition is made according to the ratio of photovoltaic power generation and wind power generation at the initial time, which meets the following formula:
E u ( n ) s o l a r t = 1 = E u ( n ) t o t a l t = 1 e s o l a r t = 1 ,   E u ( n ) w i n d t = 1 = E u ( n ) t o t a l t = 1 e w i n d t = 1
E u ( n ) s o l a r t = 1 , E u ( n ) w i n d t = 1 is the initial distribution of photovoltaic and wind power consumption of user u ( n ) .
(3) After subtracting the power allocated to users from the initial power generation, the residual amount of photovoltaic power generation and wind power generation stored in the system at the initial time is calculated:
E u ( n ) s o l a r t = 1 = E u ( n ) t o t a l t = 1 e s o l a r t = 1 ,   E u ( n ) w i n d t = 1 = E u ( n ) t o t a l t = 1 e w i n d t = 1
E n s s o l a r t = 1 = E s o l a r t = 1 E u ( n ) s o l a r t = 1 ,   E n s w i n d t = 1 = E w i n d t = 1 E u ( n ) w i n d t = 1
E u ( n ) s o l a r t = 1 = E u ( 1 ) s o l a r t = 1 + E u ( 2 ) s o l a r t = 1 + ... + E u ( n 1 ) s o l a r t = 1 + E u ( n ) s o l a r t = 1
E u ( n ) w i n d t = 1 = E u ( 1 ) w i n d t = 1 + E u ( 2 ) w i n d t = 1 + ... + E u ( n 1 ) w i n d t = 1 + E u ( n ) w i n d t = 1
where E n s s o l a r t = 1 and E n s w i n d t = 1 are the storage of photovoltaic and wind power at the initial time of the system; E u ( n ) s o l a r t = 1 and E u ( n ) w i n d t = 1 are the total consumption of PV and wind power allocated to users at the initial time.
(4) To calculate the proportion of power generation structure of the system when t = 2. The total power supply of the system at t = 2 includes the total new generation and the accumulated total storage capacity at the last time of the system.
e s o l a r t = 2 = E s o l a r t = 2 + E n s s o l a r t = 1 E N E W t = 2 + E S T O R A G E t = 1 ,   e w i n d t = 2 = E w i n d t = 2 + E n s w i n d t = 1 E N E W t = 2 + E S T O R A G E t = 1
where e s o l a r t = 2 is the proportion of photovoltaic power generation at t = 2; E s o l a r t = 2 is the photovoltaic power generation output of the system at t = 2; E n s s o l a r t = 1 is the total photovoltaic power stored at t = 1; E N E W t = 2 is the total new generation output of the system at t = 2; and E S T O R A G E t = 1 is the total stored power at t = 1. The same is true for wind power.
E N E W t = 2 = E s o l a r t = 2 + E w i n d t = 2
E S T O R A G E t = 1 = E n s s o l a r t = 1 + E n s w i n d t = 1
(5) To calculate the user’s power structure allocation at t = 2:
E u ( n ) s o l a r t = 2 = E u ( n ) t o t a l t = 2 e s o l a r t = 2 ,   E u ( n ) w i n d t = 2 = E u ( n ) t o t a l t = 2 e w i n d t = 2
where E u ( n ) s o l a r t = 2 and E u ( n ) w i n d t = 2 are the photovoltaic and wind power consumption allocated by u ( n ) users at t = 2.
(6) To calculate the new photovoltaic power generation and wind power generation storage power of the system at t = 2. The storage capacity of photovoltaic power generation is equal to the total photovoltaic power of the system at t = 2 minus the photovoltaic consumption allocated to users; the storage capacity of wind power is equal to the total amount of system wind power at t = 2 minus the wind power consumption allocated to users:
E n s s o l a r t = 2 = ( E s o l a r t = 2 + E n s s o l a r t = 1 ) E u ( n ) s o l a r t = 2
E n s w i n d t = 2 = ( E w i n d t = 2 + E n s w i n d t = 1 ) E u ( n ) w i n d t = 2
E u ( n ) s o l a r t = 2 = E u ( 1 ) s o l a r t = 2 + E u ( 2 ) s o l a r t = 2 + ... + E u ( n 1 ) s o l a r t = 2 + E u ( n ) s o l a r t = 2
E u ( n ) w i n d t = 2 = E u ( 1 ) w i n d t = 2 + E u ( 2 ) w i n d t = 2 + ... + E u ( n 1 ) w i n d t = 2 + E u ( n ) w i n d t = 2
where E n s s o l a r t = 2 and E n s w i n d t = 2 are the photovoltaic and wind power reserves of the system at t = 2; and E u ( n ) s o l a r t = 2 and E u ( n ) w i n d t = 2 are the total consumption of photovoltaic and wind power allocated to users at t = 2.
(7) Repeat steps (4)~(6) to calculate the corresponding data at t = 3, t = 4, ..., t = 23, t = 24.
(8) To calculate the total consumption of photovoltaic power generation and wind power generation.
E u ( n ) s o l a r = E u ( n ) s o l a r t = 1 + E u ( n ) s o l a r t = 2 + ... + E u ( n ) s o l a r t = 23 + E u ( n ) s o l a r t = 24
E u ( n ) w i n d = E u ( n ) w i n d t = 1 + E u ( n ) w i n d t = 2 + ... + E u ( n ) w i n d t = 23 + E u ( n ) w i n d t = 24
where E u ( n ) s o l a r and E u ( n ) w i n d are the total consumption of PV and wind power of user u ( n ) , respectively.

2.2.2. Decomposition of Energy Storage

Calculation method of operation state data of energy storage system
(1) To determine the call sequence of the energy storage system. According to the calculation method in Section 2.1 about trading mechanism design, the calling order of the energy storage system can be determined, and the calling matrix is obtained as follows:
R A N K = R V O L 1 R V O L 2 ... R V O L n 1 R V O L n
where R V O L n is the capacity value of the energy storage system whose dispatching order is n.
(2) According to the output value of the energy storage system at each time calculated in Section 2.2.1, the following output matrix can be obtained:
E S T O R A G E T = E S T O R A G E t = 1 E S T O R A G E t = 2 ... E S T O R A G E t = 23 E S T O R A G E t = 24
(3) To dispatch the energy storage equipment in sequence and calculate the output value of each energy storage equipment. The output value of each energy storage equipment is
E k t = R V O L k , j = 1 k R V O L k < E S T O R A G E t j = 1 k R V O L k E S T O R A G E t , j = 1 k R V O L k E S T O R A G E t 0   ,   j = 1 k 1 R V O L k E S T O R A G E t
Furthermore, the data matrix of the operation state of the energy storage system at all times is as follows:
E R A N K T = E 1 t = 1 E 2 t = 1 ... E n t = 1 E 1 t = 2 E 2 t = 2 ... E n t = 2 ... ... ... ... E 1 t = 24 E 2 t = 24 ... E n t = 24

3. System Optimization Model under New Mode

The participation enthusiasm of users is particularly important for the implementation of the joint curve tracking mode, which is in line with the common economic logic, that is, to create value for users first can make the market prosperous, and then drive the development of the upstream and downstream industries. Therefore, the following will focus on the modeling and analysis of the above-mentioned user benefits. The modeling logic is shown in Figure 2.

3.1. Objective Function

The goal of users’ participation in tracking the clean energy generation curve transaction is to maximize the net income. Combined with the analysis in the previous chapter, the optimization objective function is obtained as follows:
max R m = ( P 1 P 2 ) Q m + R C E S N
When the net income R m is greater than the expected income of users, the scheme is feasible. The expected revenue of users is generally regarded as the amount of electricity saving that can be obtained under the time-of-use tariff scheme.

3.2. Constraints

System Component Constraints

The characteristics of demand-side resources mainly include adjustability, transferability and interruptibility, which determine the applicability of its participation in clean energy consumption. This section analyzes several common demand-side resource adjustable capacity constraints.
(1) Electrical devices
Considering the operation characteristics of electrical equipment, the user-side electrical equipment is divided into three categories: rigid load, transferable load, and interruptible load.
Rigid load: The operation time of this kind of load is relatively fixed, and cannot be interrupted. It can only realize small-scale load shedding within the specified operation time. The operation constraints of such loads are as follows:
t e n d , a 1 t s t a r t , a 1 + 1 T a 1 T s t a r t , a 1 = t s t a r t , a 1 < t e n d , a 1 = T e n d , a 1 N o f f , a 1 = 0
where T s t a r t , a 1 and T e n d , a 1 are the earliest start time and the latest shutdown time allowed for electrical equipment a 1 ; t s t a r t , a 1 and t e n d , a 1 are the starting and closing time of actual operation; T a 1 is the shortest running time required to complete the work for electrical equipment a 1 ; N o f f , a 1 is the maximum number of interruptions allowed in a job for equipment a 1 ; λ a 1 , i is the running state variable in the i -th period for equipment a 1 .
Transferable load: The operation time of this kind of load can be adjusted within a certain range, but it is not allowed to be interrupted during operation. The operation constraints are as follows:
t e n d , a 2 t s t a r t , a 2 + 1 T a 2 T s t a r t , a 2 < t s t a r t , a 2 < t e n d , a 2 < T e n d , a 1 λ a 2 = 1         i [ t s t a r t , a 2 , t e n d , a 2 ] N o f f , a 1 = 0
Interruptible load: This kind of load is allowed to start and stop in the process of operation, and it will return to the original working state after stopping for a period of time. However, frequent start-up and stop or long-time standby will affect the service life of the equipment. Therefore, we need to restrict the maximum number of interruptions N o f f and maximum interrupt time T o f f .
k = 1 n o f f , a 3 + 1 ( t e n d , a 3 k t s t a r t , a 3 k + 1 ) T a 3 T s t a r t , a 3 t s t a r t , a 3 1 < t e n d , a 3 n o f f , a 3 + 1 T e n d , a 3 t s t a r t , a 3 k < t e n d , a 3 k t s t a r t , a 3 k + 1 t e n d , a 3 k + T o f f , a 3   ,   1 k n o f f , a 3 + 1 λ a 3 , i = 0           ,           i [ t e n d , a 3 k , t s t a r t , a 3 k + 1 ] λ a 2 , i = 1           ,           i [ t s t a r t , a 3 k , t e n d , a 3 k ] 0 n o f f , a 3 N o f f , a 3
where n o f f , a 3 is the actual interrupt times of the interruptible device a 3 ; k is the operation condition of the equipment before the k -th interruption, where k = n o f f , a 3 + 1 represents the operation condition after the last interruption.
(2) Electric vehicles
The charging power and charging time of electric vehicles can be adjusted without affecting the travel of users so that the load can be transferred. The charging power of a single electric vehicle P E V t can be expressed as follows:
P E V t = P E V , t i n t t e n d 0 , t < t i n   or   t > t e n d
t e n d = t i n + t Δ
t Δ = ( S O C e S O C 0 ) E / ( η P E V )
where P E V is the rated charging power of electric vehicle battery; t i n and t e n d , respectively, indicate the time when the electric vehicle is connected to the power grid and the end of charging; S O C e is the battery state of charge expected by the vehicle owner; S O C 0 is the state of charge of the battery when the electric vehicle is connected to the power grid; η is the charging efficiency; t Δ is the charging time; E is the battery capacity of the electric vehicle.
The regulation capacity of electric vehicles Q E V is mainly related to the number of electric vehicles N and charging time t Δ , which meets the following equation:
Q E V = N t = 1 t Δ P E V t
(3) Energy storage system
The real-time power of the energy storage system P E S S t can be expressed as Equation (30). Considering the need to fully track the clean energy generation curve and avoid deviation assessment, the charging and discharging power and system capacity of the energy storage system needs to meet the following requirements:
P E S S t = P ( t ) + , P E S S t 0 P ( t ) , P E S S t < 0
P E S S max P E S S t G E S S t = 1 T P ( t ) + t = 1 T P ( t ) + = t = 1 T P ( t )
Among them, P ( t ) + and P ( t ) are the instantaneous charging power and discharging power of the energy storage system; the subindex “ E S S ” represents the energy storage system, P E S S is the minimum charging and discharging power of the energy storage system, G E S S is the capacity of the energy storage system.
Equation (31) shows that the minimum charging and discharging power of the energy storage system should meet the maximum charging and discharging power in use. The minimum charging and discharging power of the energy storage system shall meet the maximum charging and discharging power when in use; the minimum capacity of the energy storage system needs to meet the maximum storage capacity to ensure the full consumption of clean energy and the safety of users’ electricity consumption. The charging capacity of the energy storage system is equal to the discharging capacity; that is, when the user ends the service of energy storage, the energy storage system will return to the initial state, and there is no surplus capacity.

4. Case Study

In response to the national clean and low-carbon development, a province in China has vigorously supported the development of wind power and photovoltaic industry. At present, the installed capacity of wind power in the province has exceeded 10 GW and the installed capacity of photovoltaic has exceeded 7 GW. But its clean energy consumption still lags behind, accounting for less than 10% of the province’s total electricity consumption, making it difficult to meet the province’s renewable energy quota targets. In order to promote clean energy consumption in the province, the provincial power trading center intends to organize clean energy generators, energy storage service providers, and related users to conduct incremental clean energy consumption transactions.
This paper assumes that there are two clean energy power producers, A and B, involved in the transaction. A is a photovoltaic power generation company and B is a wind power generation company. A total of 10 suppliers participated in the bidding for energy storage services. And a total of six users participated in the transaction, which included a farmers’ wholesale market, a senior office building, a pharmaceutical factory, a large supermarket, a school, and an electric bus station hub center.
In order to verify the effectiveness of the model on a long-term scale, we consider different system load rates and market conditions comprehensively. The example uses the output curves and load curves of each market entity at 24 time points per day for the past year of 2023 to interact with the energy storage system and analyze the overall consumption and profit distribution situation. For the convenience of argumentation and analysis, the presented example results have averaged the annual data in the daily dimension. The decision variables in the above model are the output values of the central air conditioning system, electric vehicle, and energy storage system, the formula is a linear expression of the above variables, and the model is a mixed integer linear programming problem. The CPLEX solver is used for the model optimization.

4.1. Parameter Setting

(1) Clean energy incremental power generation curve
The next-day incremental generation forecast for the two participating clean energy generators is shown in Figure 3. It can be seen that photovoltaic power generation and wind power generation are complementary, and the fluctuation of the total power generation curve superimposed by the two is smaller than that of the photovoltaic curve, which slows down the regulation pressure of the power system. However, due to the more concentrated period of photovoltaic power generation, the total power generation curve is greatly affected by photovoltaic power generation and still shows obvious peak and valley differences. The adjustable resources on the demand side of the user are required to actively participate in the response; meanwhile, the energy storage service providers are required to adjust the difference between supply and demand of the service balance system.
(2) Base load of different users
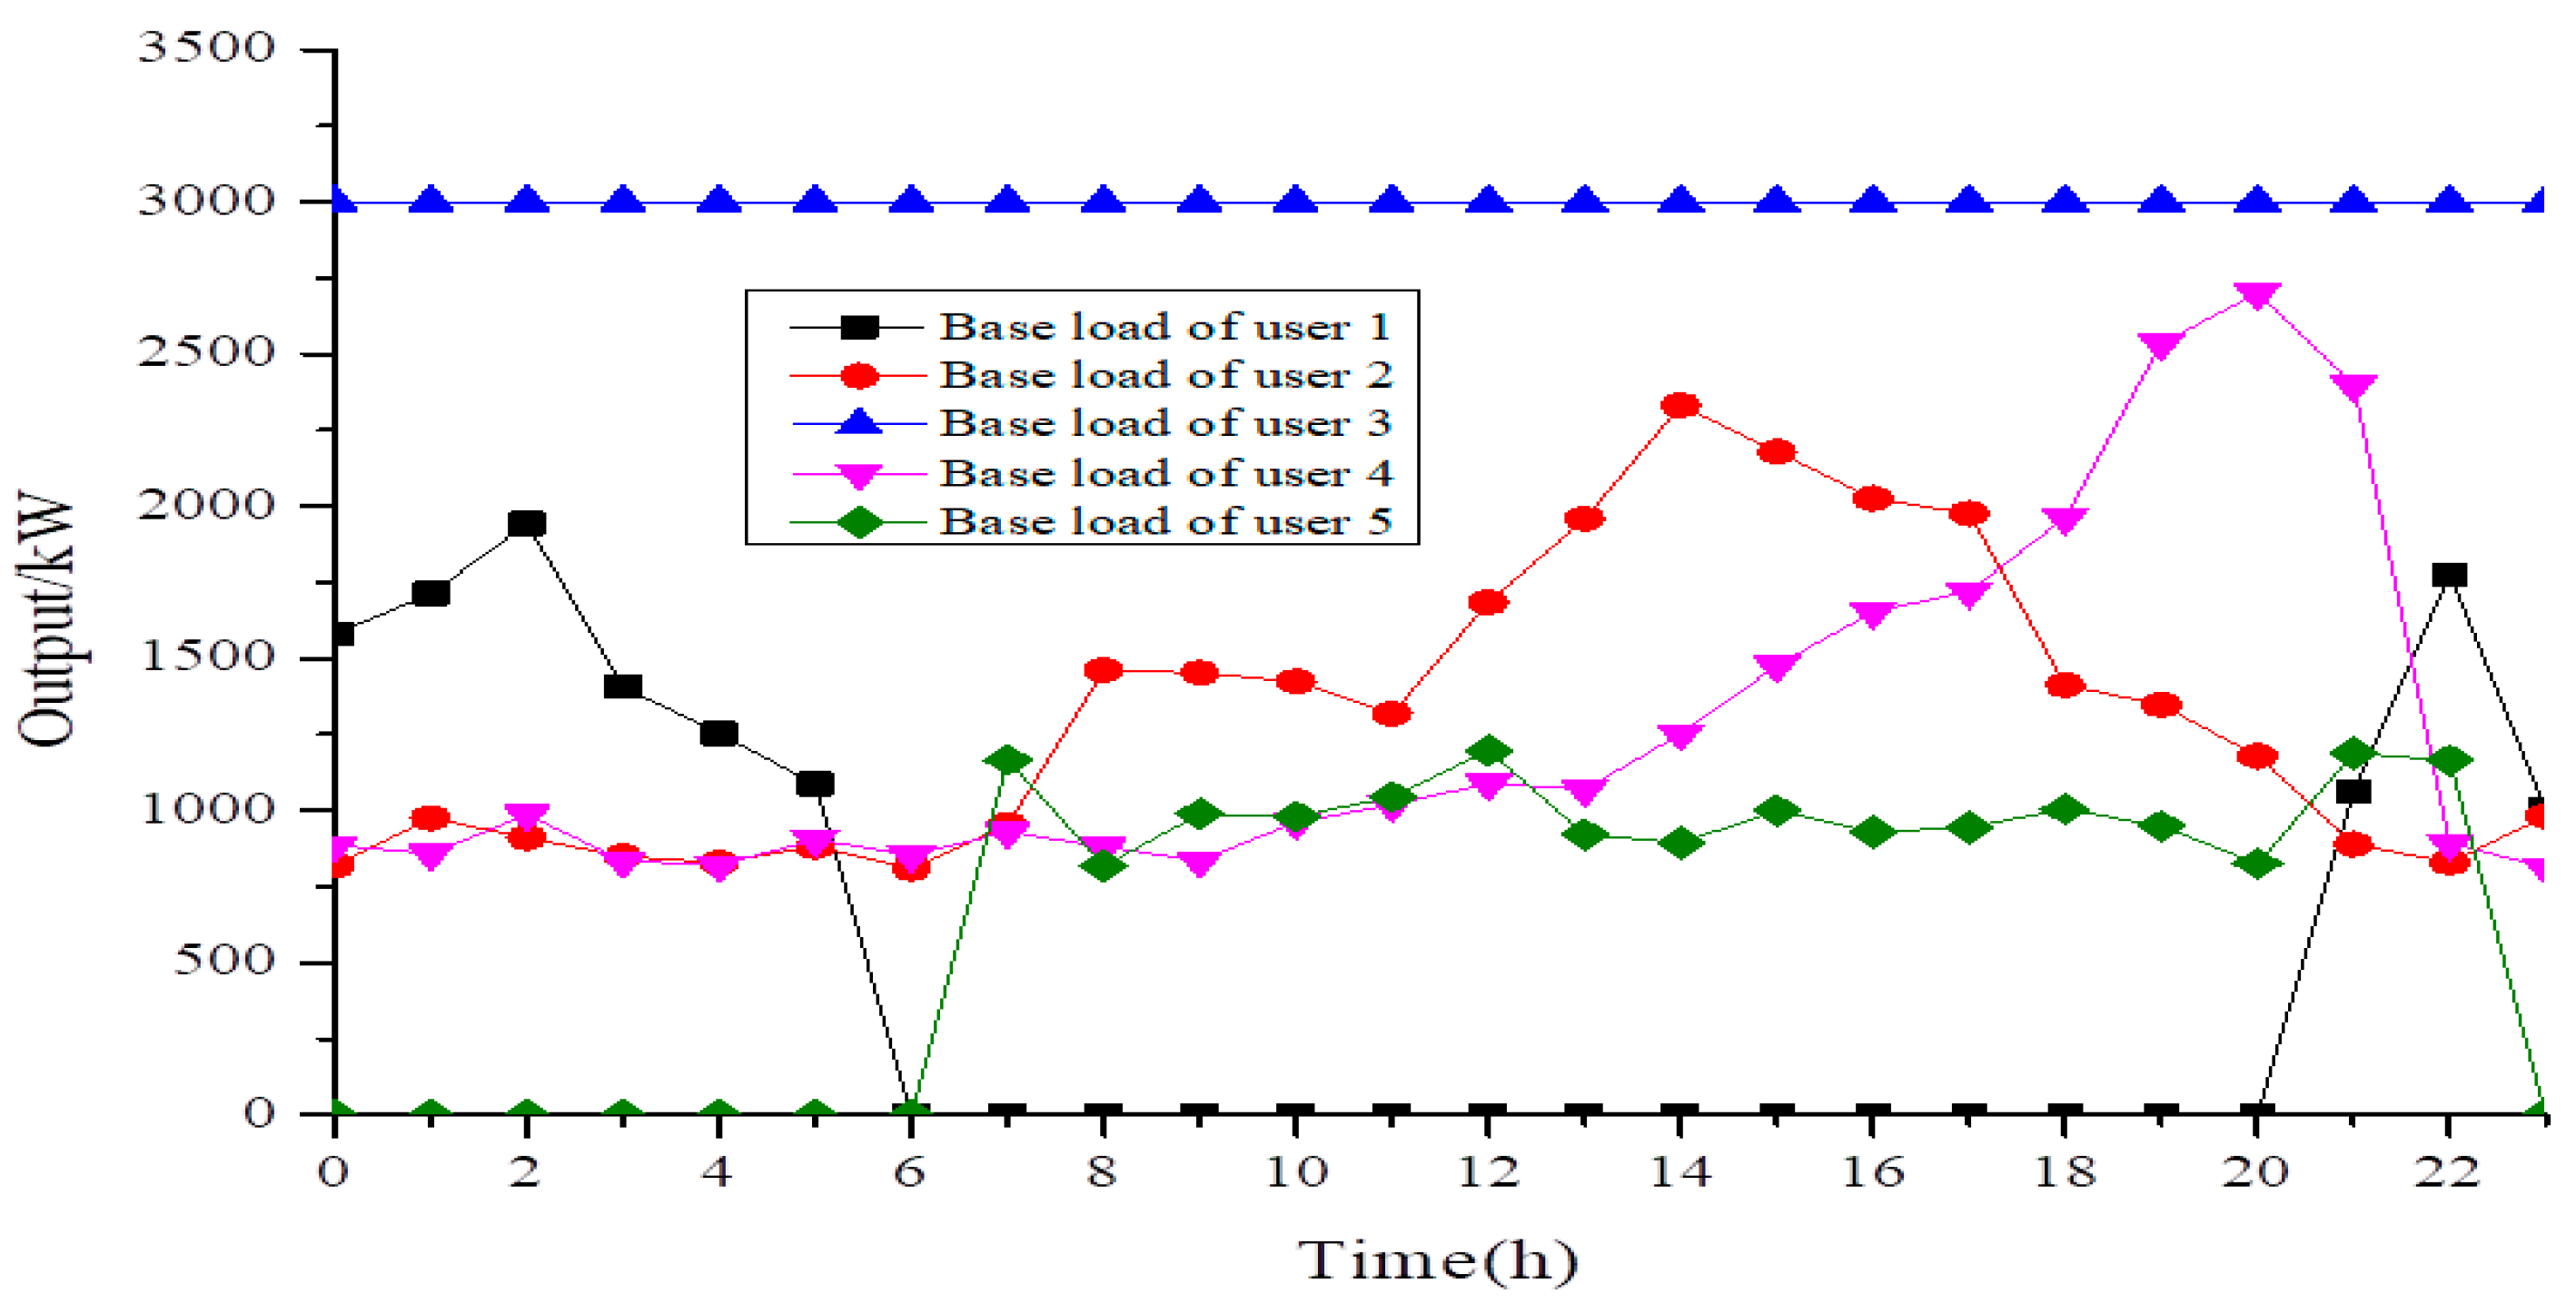
The next day, a base load of the five electricity participants in the transaction is shown in Figure 4. It can be observed that the five power consumption subjects show great differences in power consumption characteristics, especially in the time period of power consumption and load fluctuation.
In terms of electricity consumption time, the electricity consumption time of user 1 (farmers’ wholesale market) is concentrated between 21:00 and 5:00 the next morning. The electricity consumption time of user 2 (office building) is concentrated between 13:00 and 16:00; user 3 (pharmaceutical factory) has no centralized power consumption time, and the load distribution is very uniform, which is mainly determined by its own special power consumption properties; the power consumption time of user 4 (large shopping mall) is concentrated between 19:00 and 21:00; and the power consumption of user 5 (school) is concentrated between 7:00 and 22:00.
In terms of load fluctuation, the load fluctuation of user 1 and user 5 is relatively stable. The load of user 2 and user 4 fluctuated greatly, while the load of user 3 was the most stable with almost no fluctuation.
In terms of total electricity consumption, user 1 and user 5 have the same total electricity consumption level; user 2 and user 4 have the same total power consumption level; and user 3 has the largest total electricity consumption, accounting for 44.27% of the user’s total base charge electricity consumption.
(3) Base load of different users
The main response resources of users participating in collaborative transactions are air conditioners (AC) and electric vehicles (EV), and the upper and lower load limits, adjustable time, and adjustable duration are shown in Table 1. In terms of load variability, user 1’s demand-side response resource load has the largest range of variability. The range of demand-side response resource load changes of user 2, user 3, and user 5 is roughly the same. User 4 has the smallest range of load variation on the demand side and the lowest load limit among all users. As a special type of response resource, the load of electric vehicles is always equal to a fixed value; that is, the load of electric vehicles has no change range and is always equal to 0 or rated power.
In terms of total adjustment capacity, the total adjustment capacity of demand-side resources of user 1, user 3, and user 5 is roughly the same, and the total adjustment capacity of demand-side resources of user 2 is slightly less. User 4 has the least total adjustment capacity of demand-side resources. The demand-side resource of electric vehicles has the largest total adjustment capacity.
(4) User catalog electricity price
The current catalog electricity price system of the province where the case is located is summarized in Appendix A. After the investigation, Table 2 shows the catalog electricity prices of each electricity consumption entity participating in the collaborative transaction.
(5) User catalog electricity price
According to the ancillary service market rules currently being piloted in the province where the case is located, the price of the capacity right of the energy storage system is set at 1 CNY/kW.

4.2. Bidding Results of Energy Storage Service

There are 10 participants in bidding for energy storage service. The relevant bidding result is shown in Table 3. In order to ensure the smooth operation of the system, the energy storage service providers with a historical response index below 0.6 are not allowed to participate in the bidding. The higher the ranking index is, the higher the regulation ability of the energy storage system, the better the economy, and the better the historical performance. Therefore, the higher the ranking index of the paticipants, the higher the priority of the energy storage service.

4.3. System Optimization Results of Collaborative Absorption

By inputting the forecast data of user load, renewable energy generation, and the parameters in Table 1, Table 2 and Table 3 into the model, the curve tracking scheme can be solved under the condition of maximizing net return, and the specific data can be shown in the table in Appendix A.
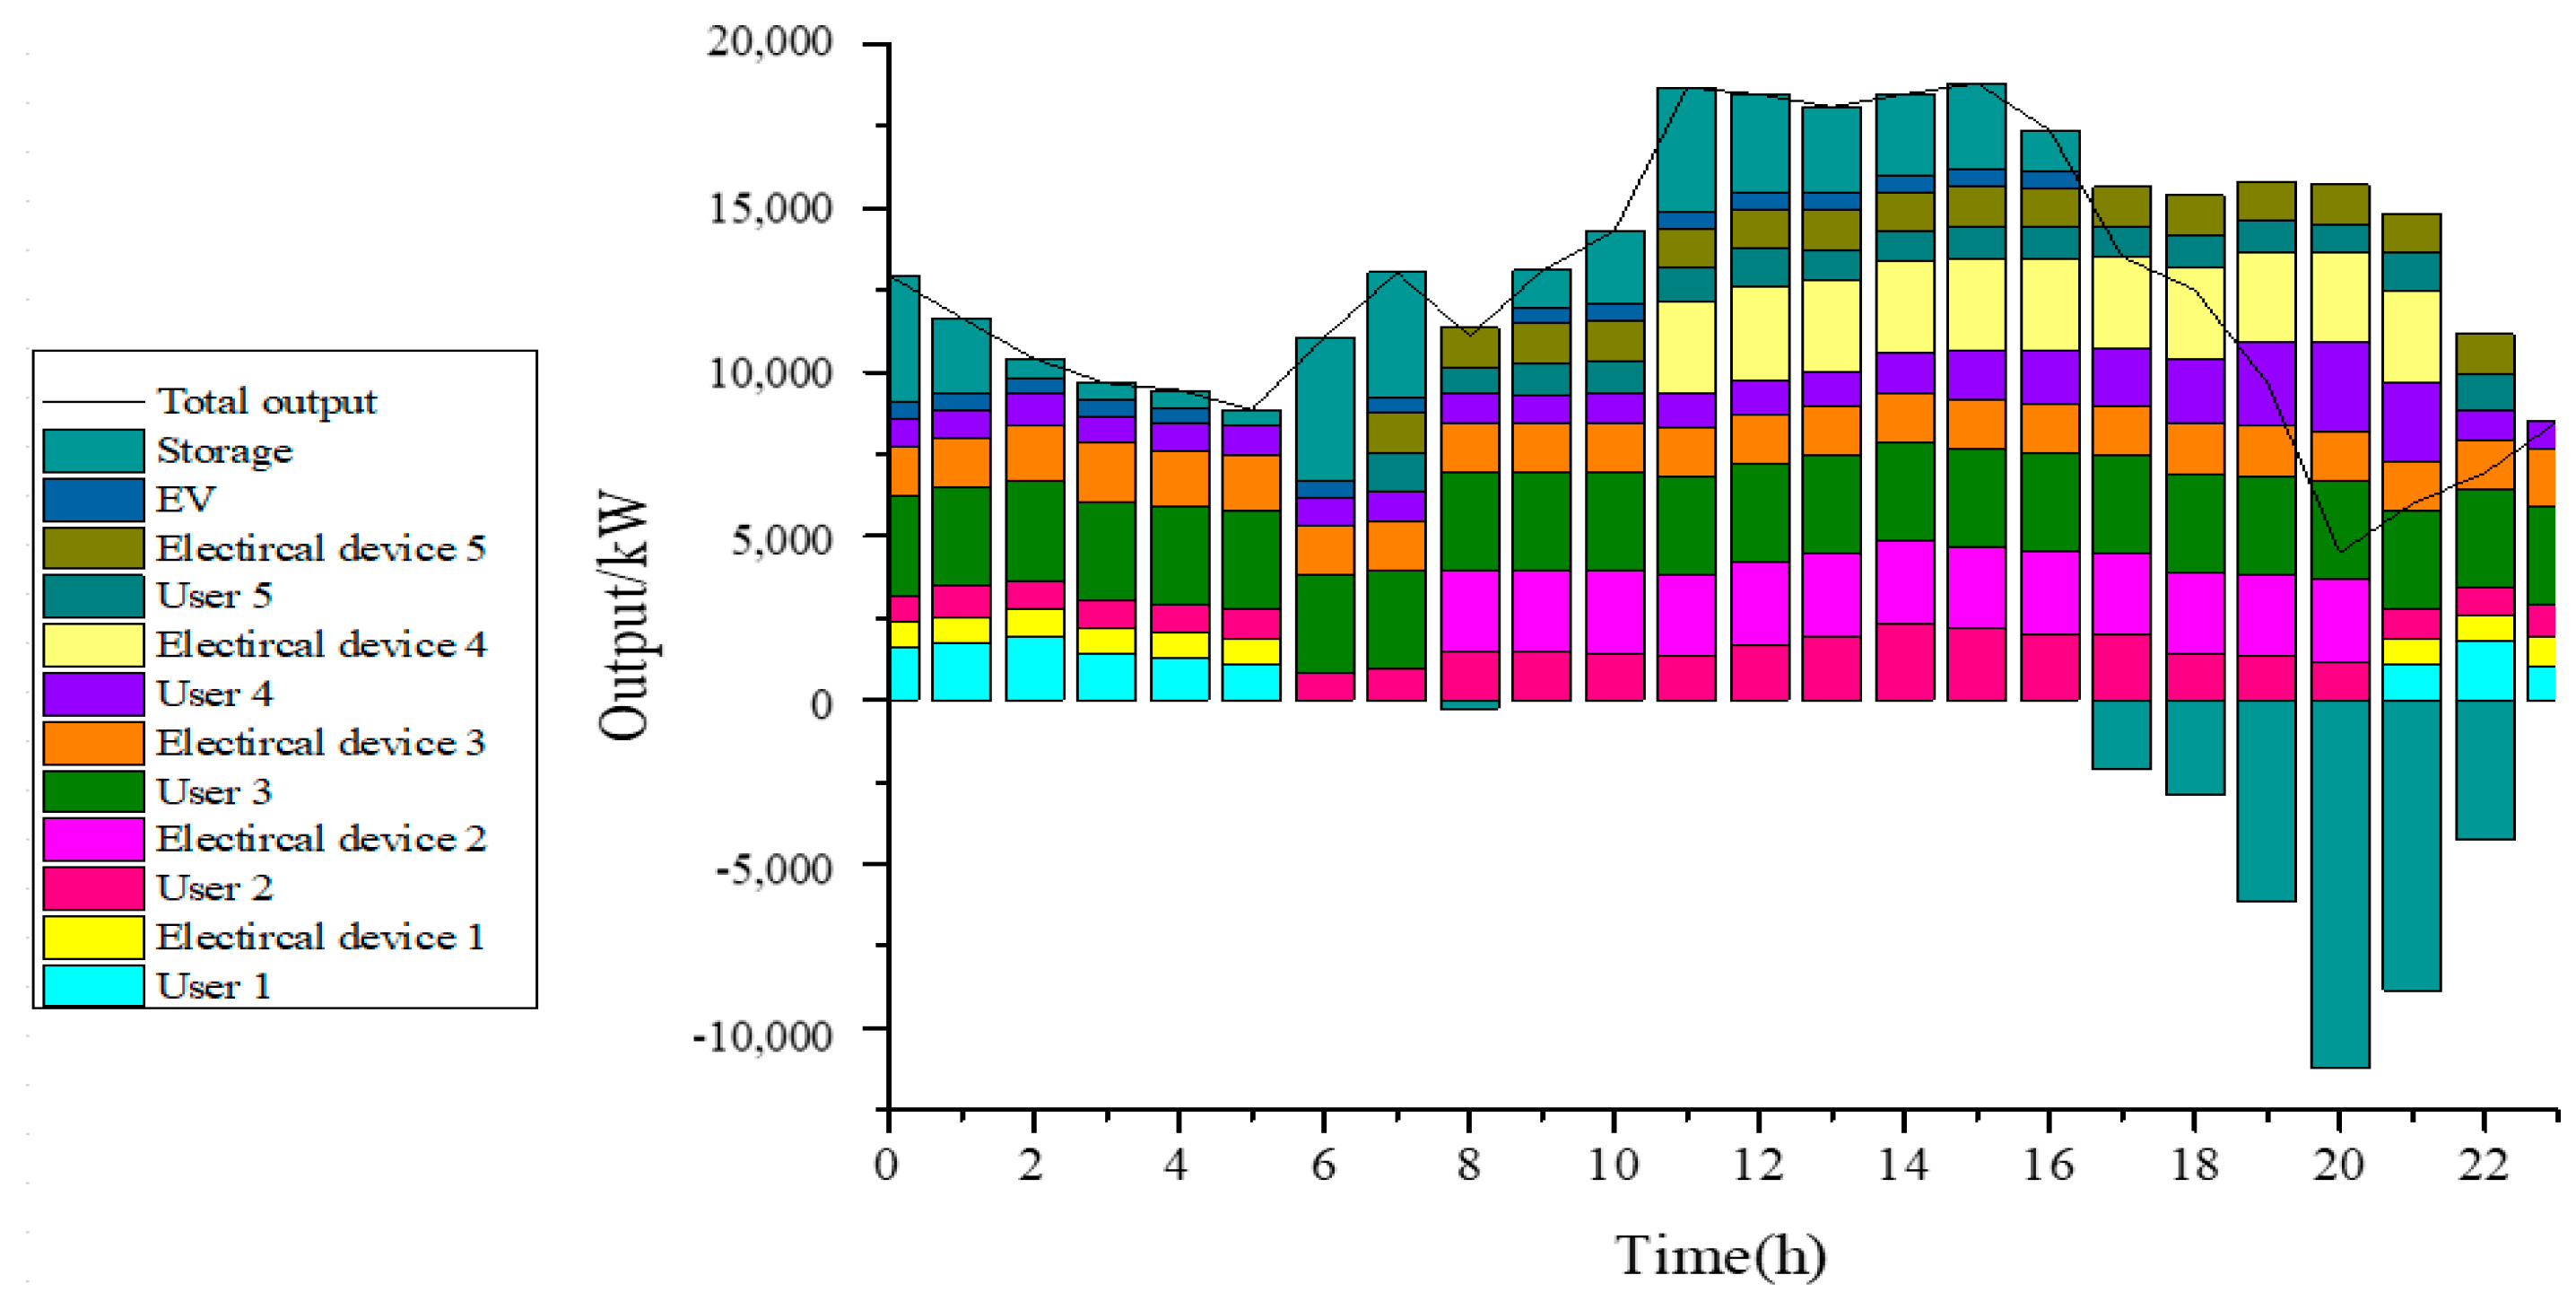
It can be seen from Figure 5 that under the function of energy storage service, clean energy power generation is stored by the system when there is a surplus (0:00~17:00) and released when there is a shortage (18:00~23:00). It is more conducive to system balance when multiple types of users participate in consumption transactions. The power consumption period of user 1 is concentrated between 21:00 and 5:00 in the morning of the next day, which is the peak of wind power generation. Therefore, user 1 participates in the consumption to alleviate the impact of incremental wind power generation on the system. The power consumption period of users 2, 4, and 5 is concentrated between 8:00 and 22:00, which is consistent with photovoltaic power generation most of the time, alleviating the impact of incremental photovoltaic power generation on the system. Although the electricity consumption of user 3 is relatively stable and its ability to participate in the adjustment of system fluctuations is not good, the electricity consumption of user 3 accounts for the highest proportion (37%) of the total electricity consumption of the user, which plays a key role in the full absorption of incremental clean energy.

4.4. Settlement Results

(1) Distribution and settlement analysis of clean energy consumption
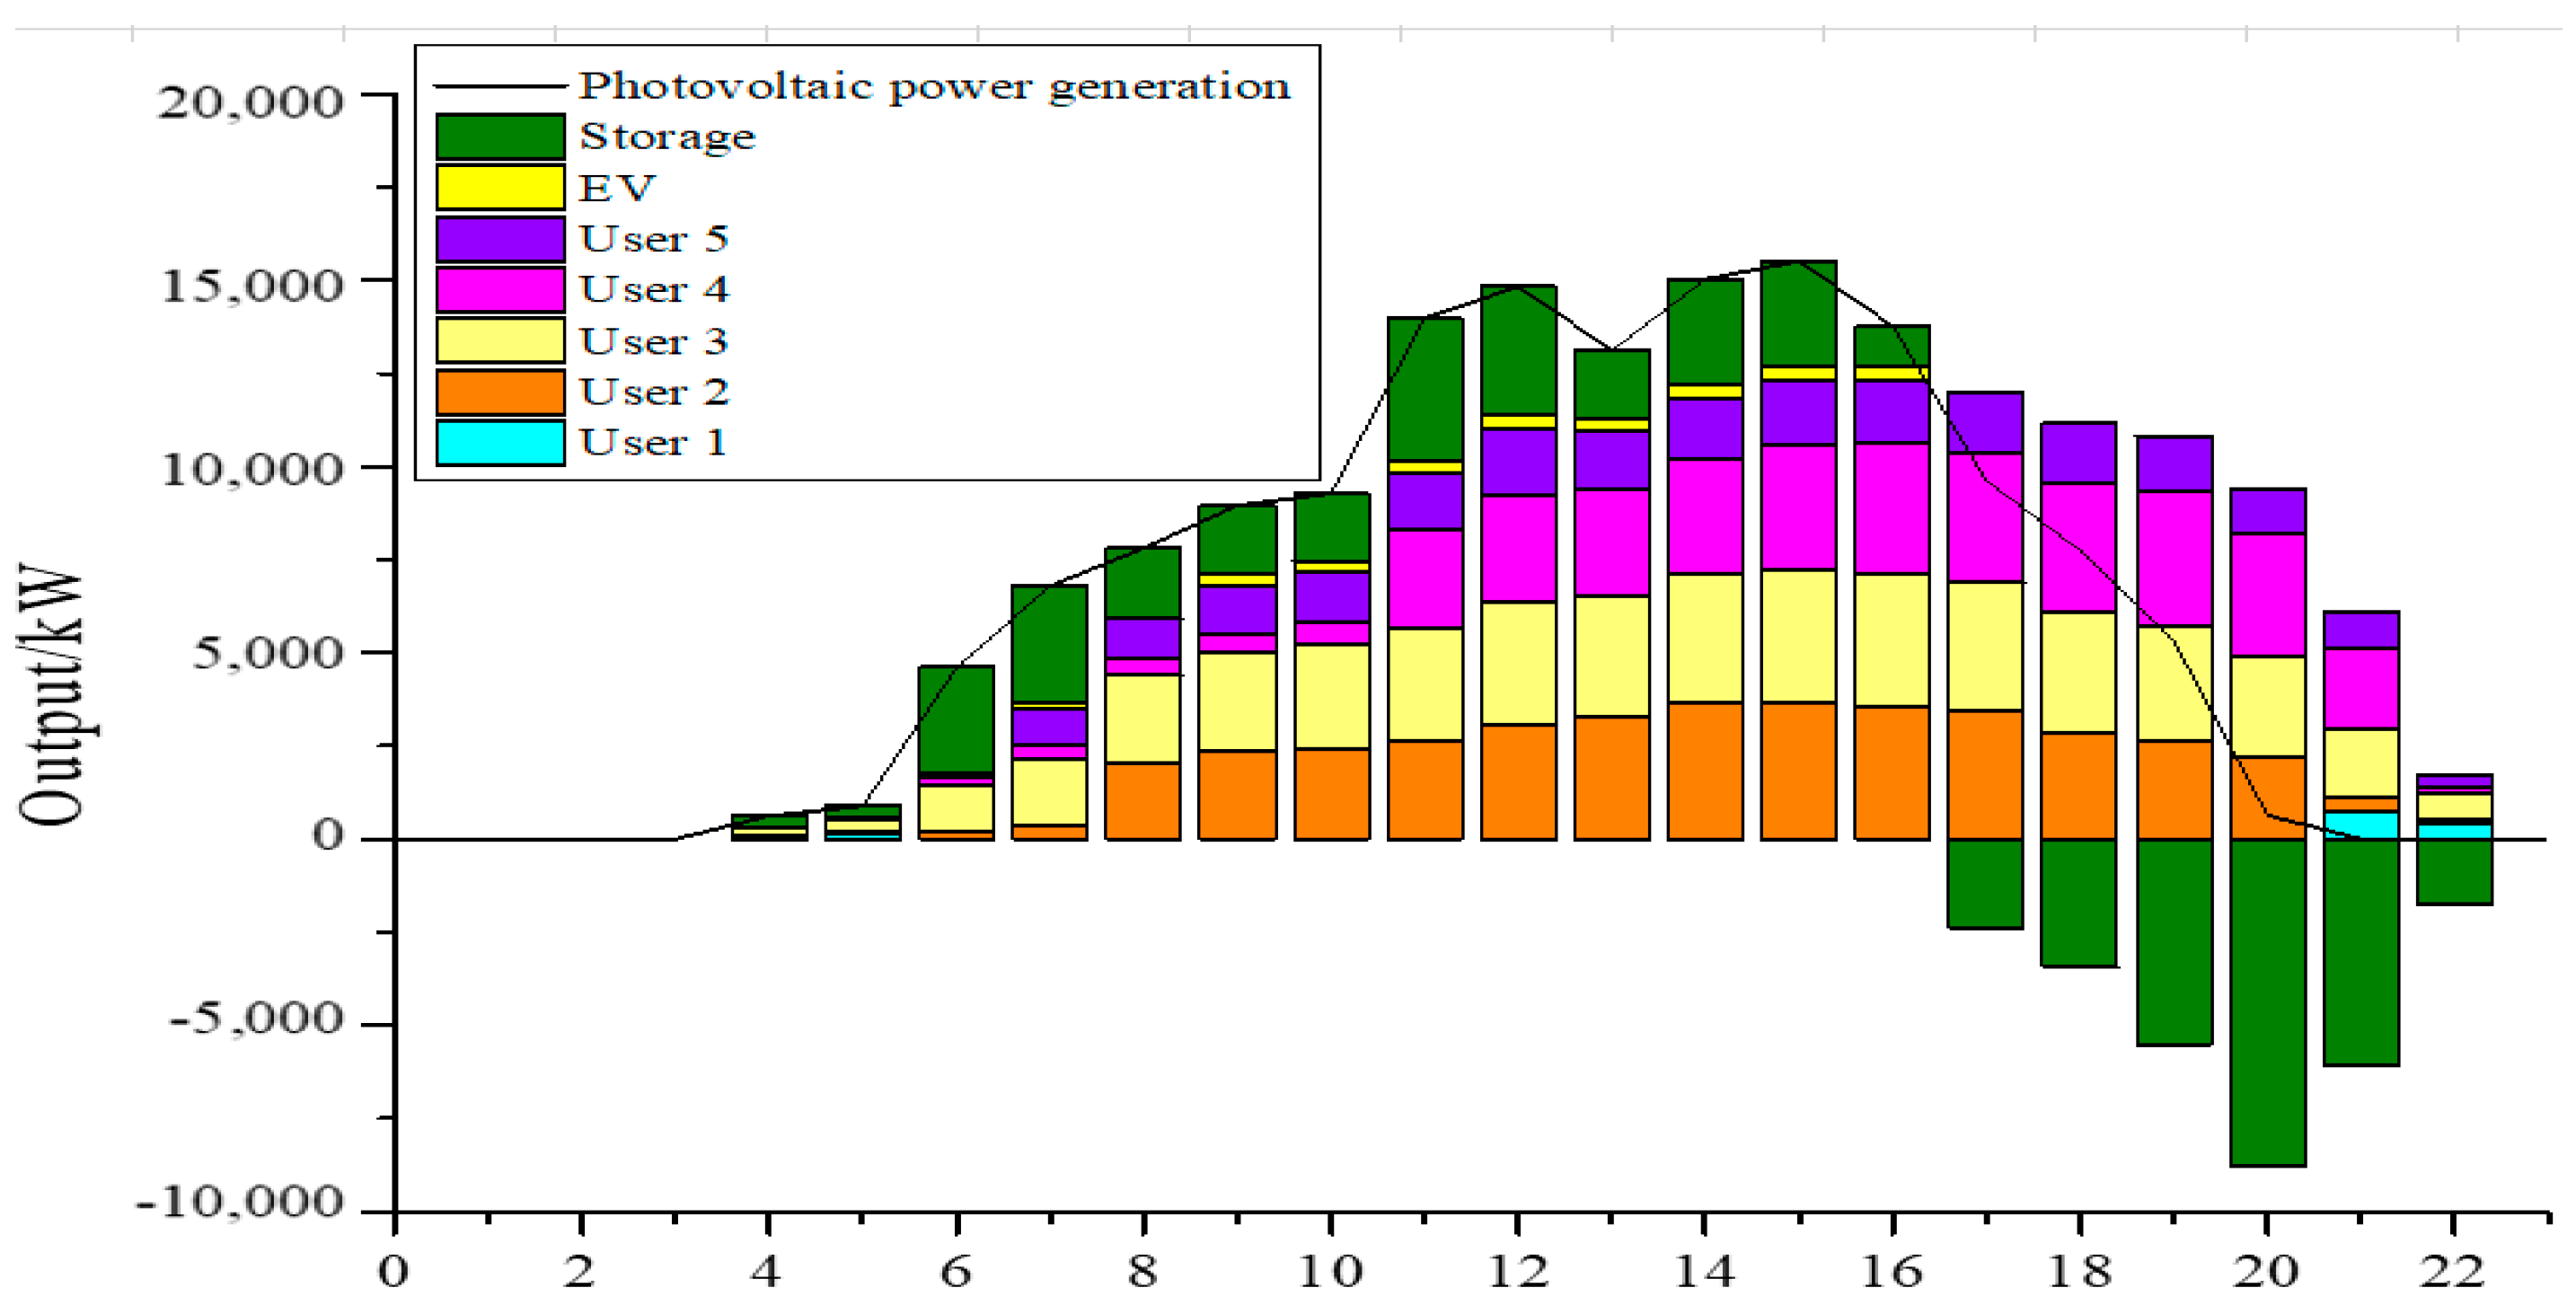
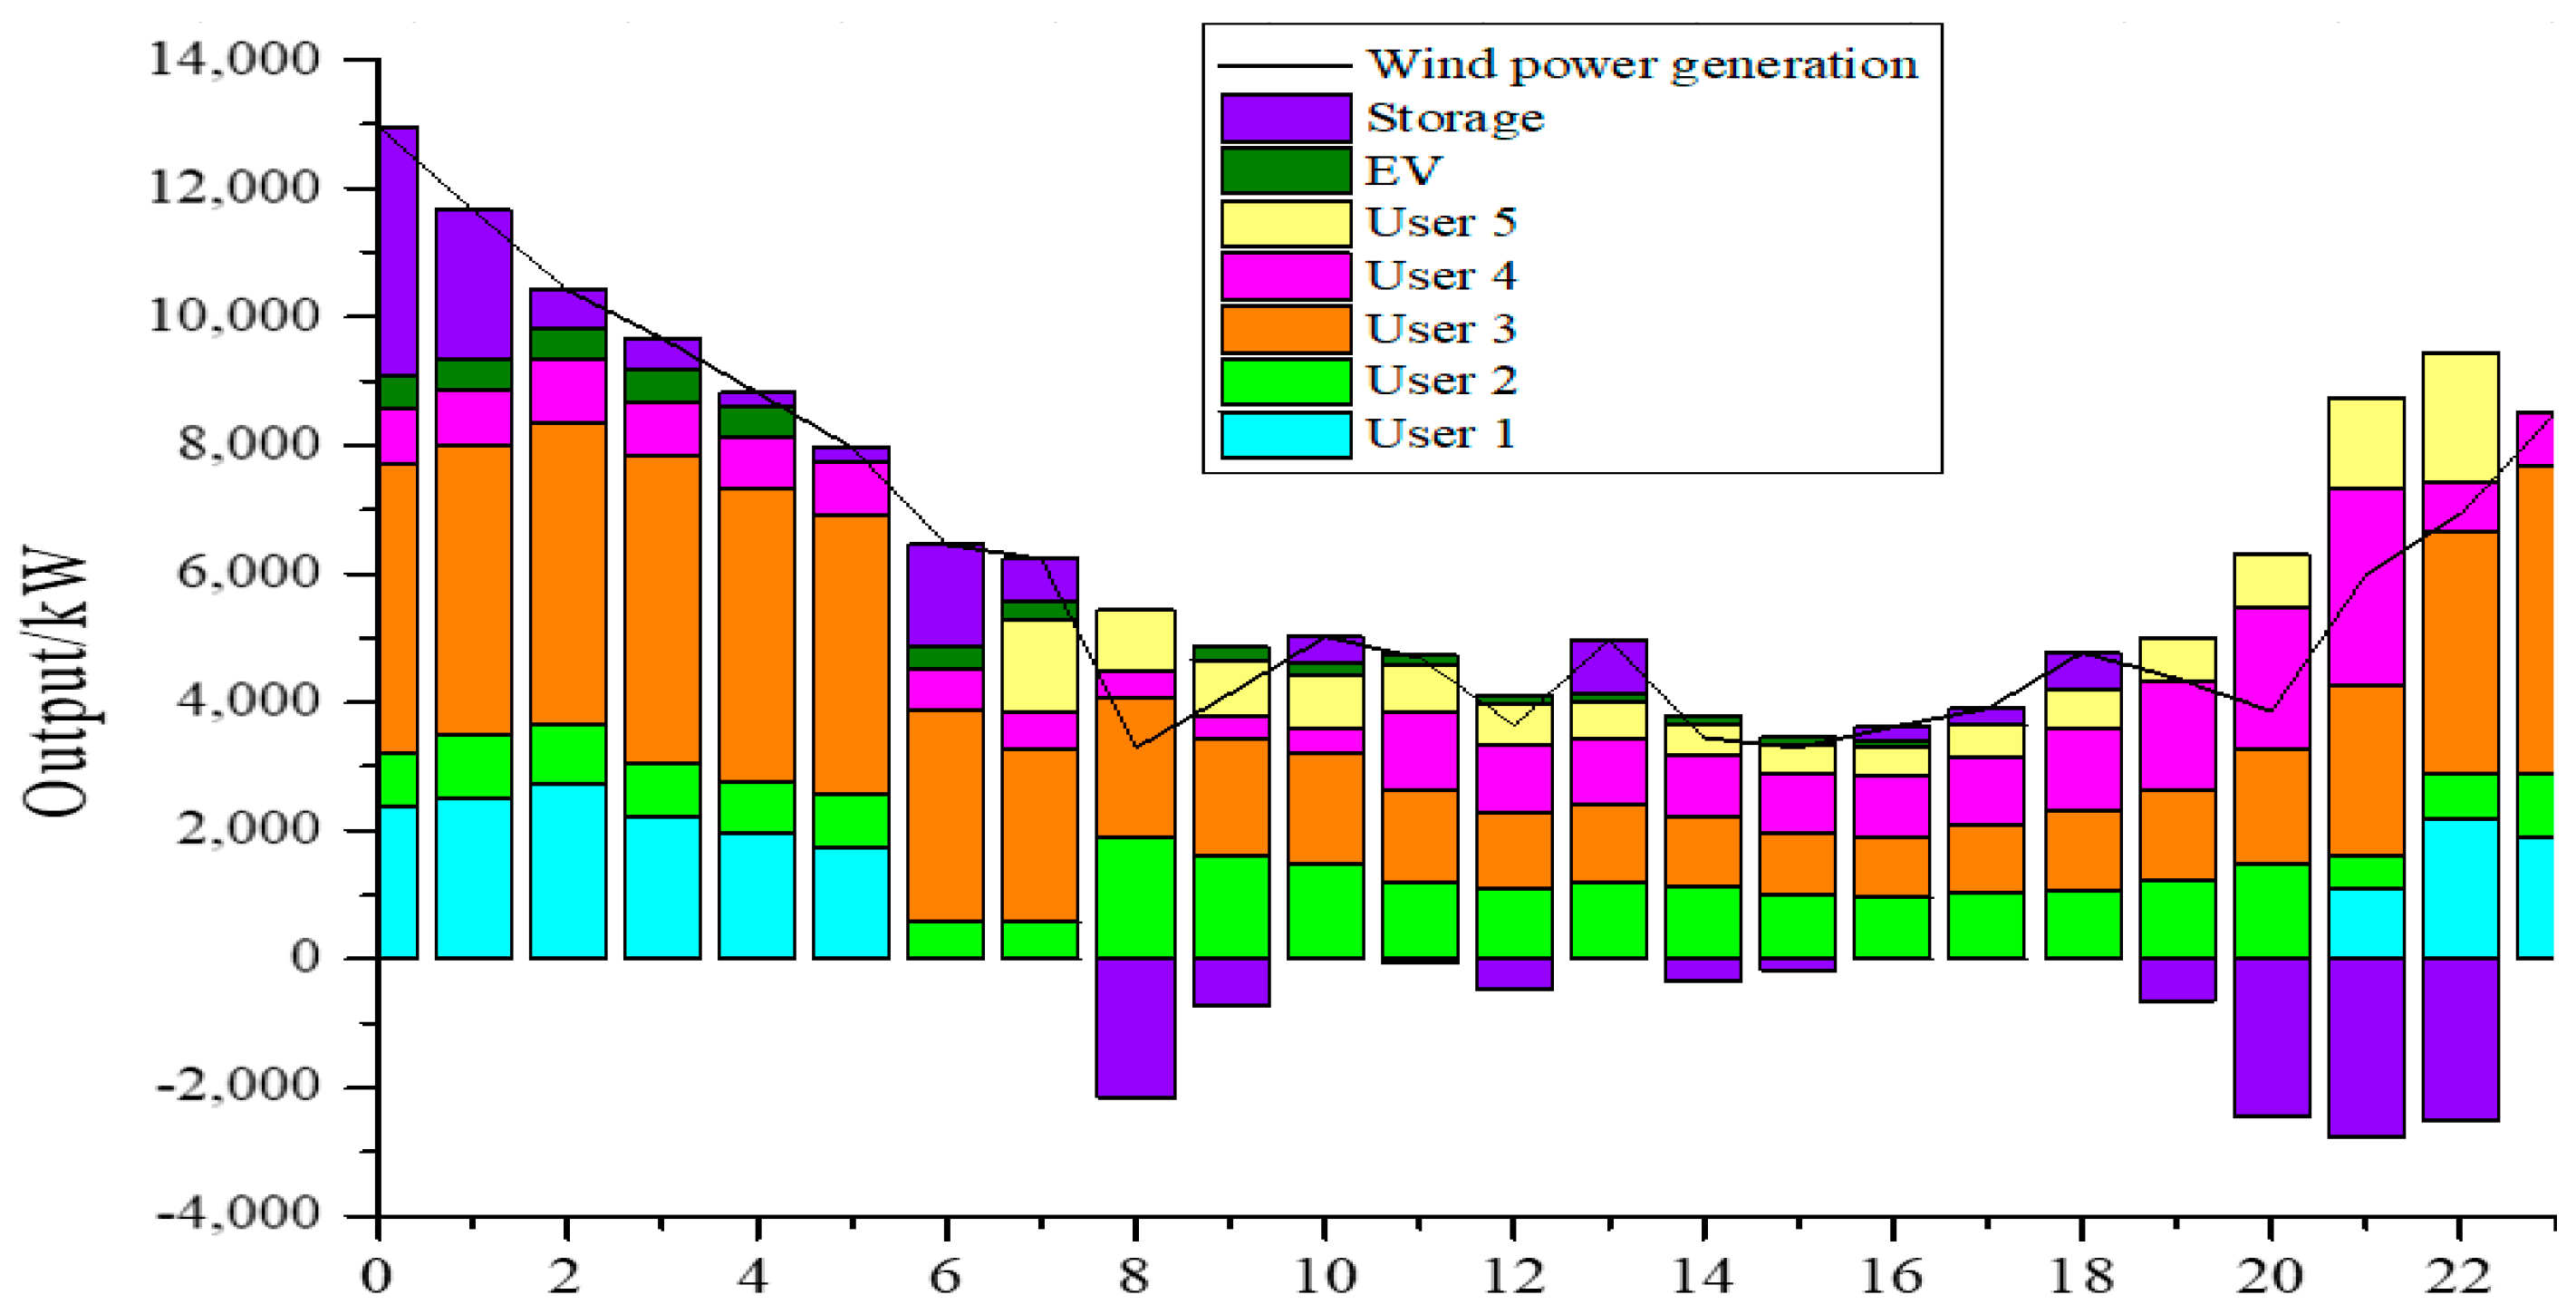
According to the electricity distribution mechanism of clean energy consumption, the electricity of clean energy in the deal was decomposed, and the decomposition results as shown in Figure 6 and Figure 7 were obtained. The detailed decomposition amount is shown in Table 4. It can be observed that at the peak of photovoltaic power generation, user 2 and user 4 consumed photovoltaic incremental power generation in time. The energy storage system stores electricity when the photovoltaic power generation is surplus (6:00–16:00), and releases it at the peak time (17:00–22:00) of the electricity consumption. Meanwhile, at the peak time of wind power generation, user 1 and user 3 consume wind power increment in time. The energy storage system stores electricity (0:00–5:00) when the wind power generation is surplus, and releases it at the peak time (21:00–23:00) of power consumption.
The electricity consumption time of user 1 is mostly concentrated at night, which is very consistent with the peak period of wind power generation. Therefore, the total consumption of wind power accounts for 93% of its total consumption. user 2, user 4, and user 5 also present this characteristic. The time period of their electricity consumption is mostly consistent with the time of photovoltaic power generation, so their consumption of photovoltaic power generation accounts for about 60% of their total consumption.
For user 3, whose load does not fluctuate, the main factor affecting the decomposition result is the power supply state of the system. At the peak time of photovoltaic power generation, the total base charge of the system is at a high level, and the surplus of photovoltaic power supply is reduced. Therefore, user 3 is assigned to less photovoltaic power generation. At the peak time of wind power generation, the total base load of the system is low, and the surplus of wind power supply increases. At this time, user 3 is allocated to more wind power generation. In general, the amount of wind power consumption assigned to user 3 is higher than the amount of photovoltaic power consumption.
An EV charging station is a special kind of subject. As a user, it has no fixed base charge constraint. As a demand-side response resource, its load has a fixed power output constraint and depends on the power supply of the system. In other words, the remaining period of wind power generation in the system is more than the remaining period of photovoltaic power generation, so more wind power generation is allocated to electric vehicles (57.31% > 42.69%).
From the perspective of total consumption, the users’ decomposed proportion of consumption is shown in Table 5. The proportion of wind power consumption of user 1, user 3, and EV is greater than the proportion of total consumption, while the proportion of photovoltaic power consumption of user 2, user 4, and user 5 is greater than the proportion of total consumption, which is consistent with the above analysis results.
(2) Energy storage cost allocation and settlement analysis
1) Operating state data calculation of energy storage system
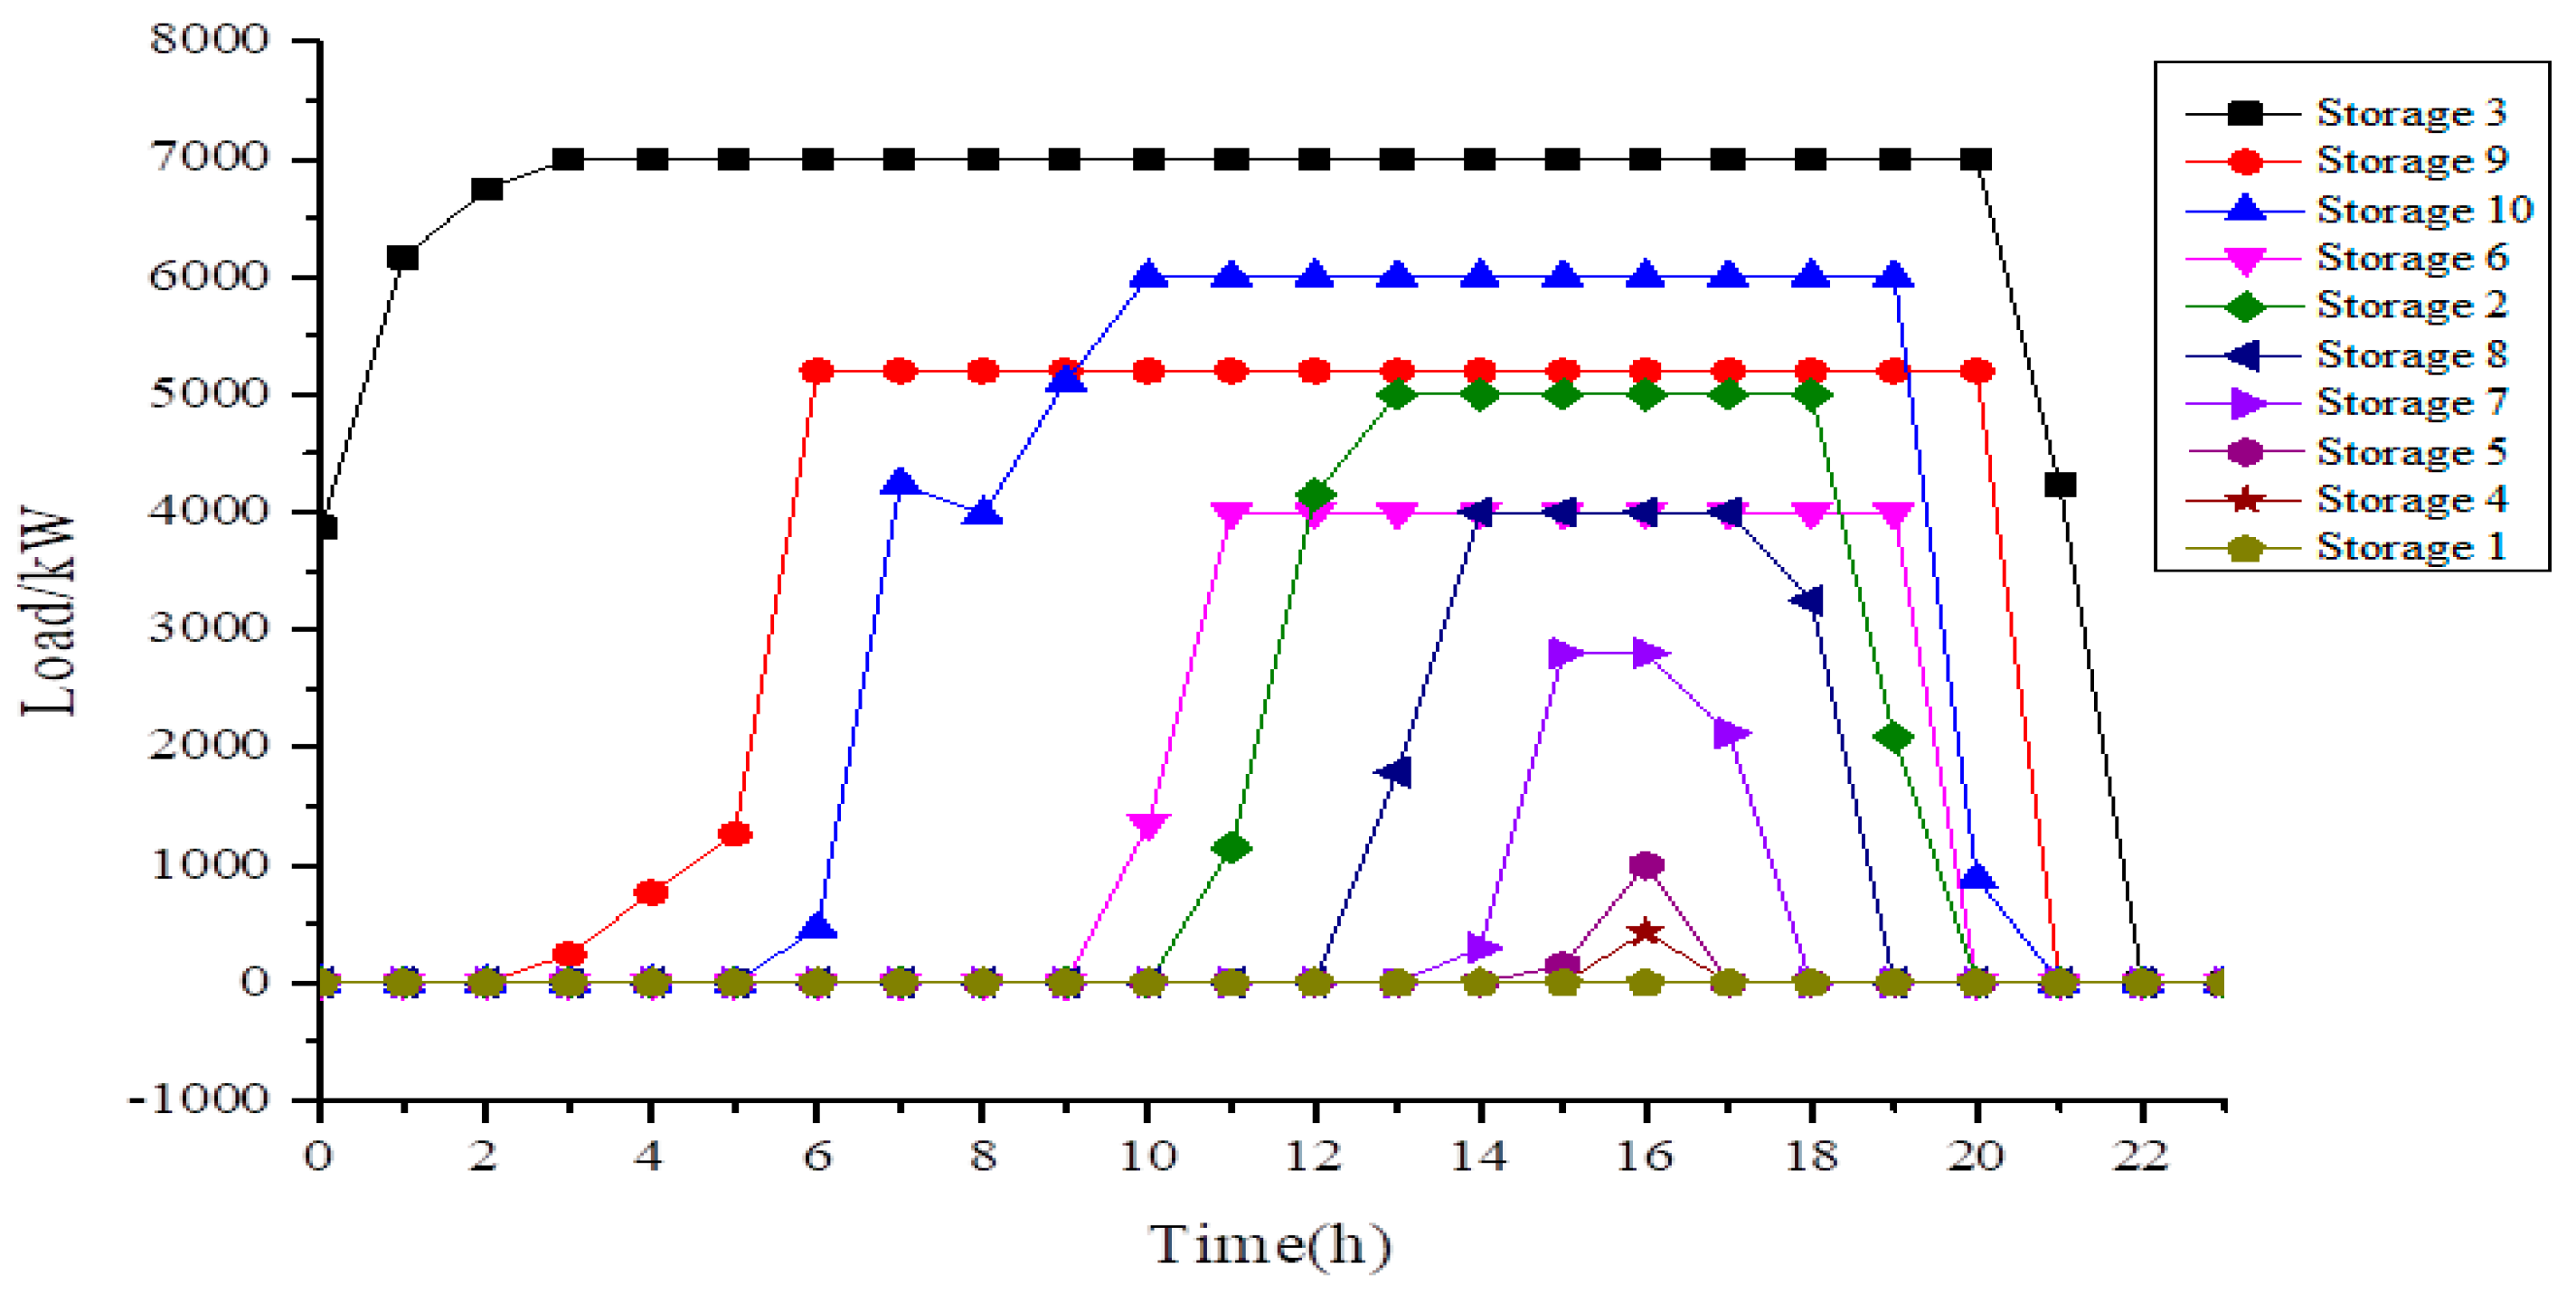
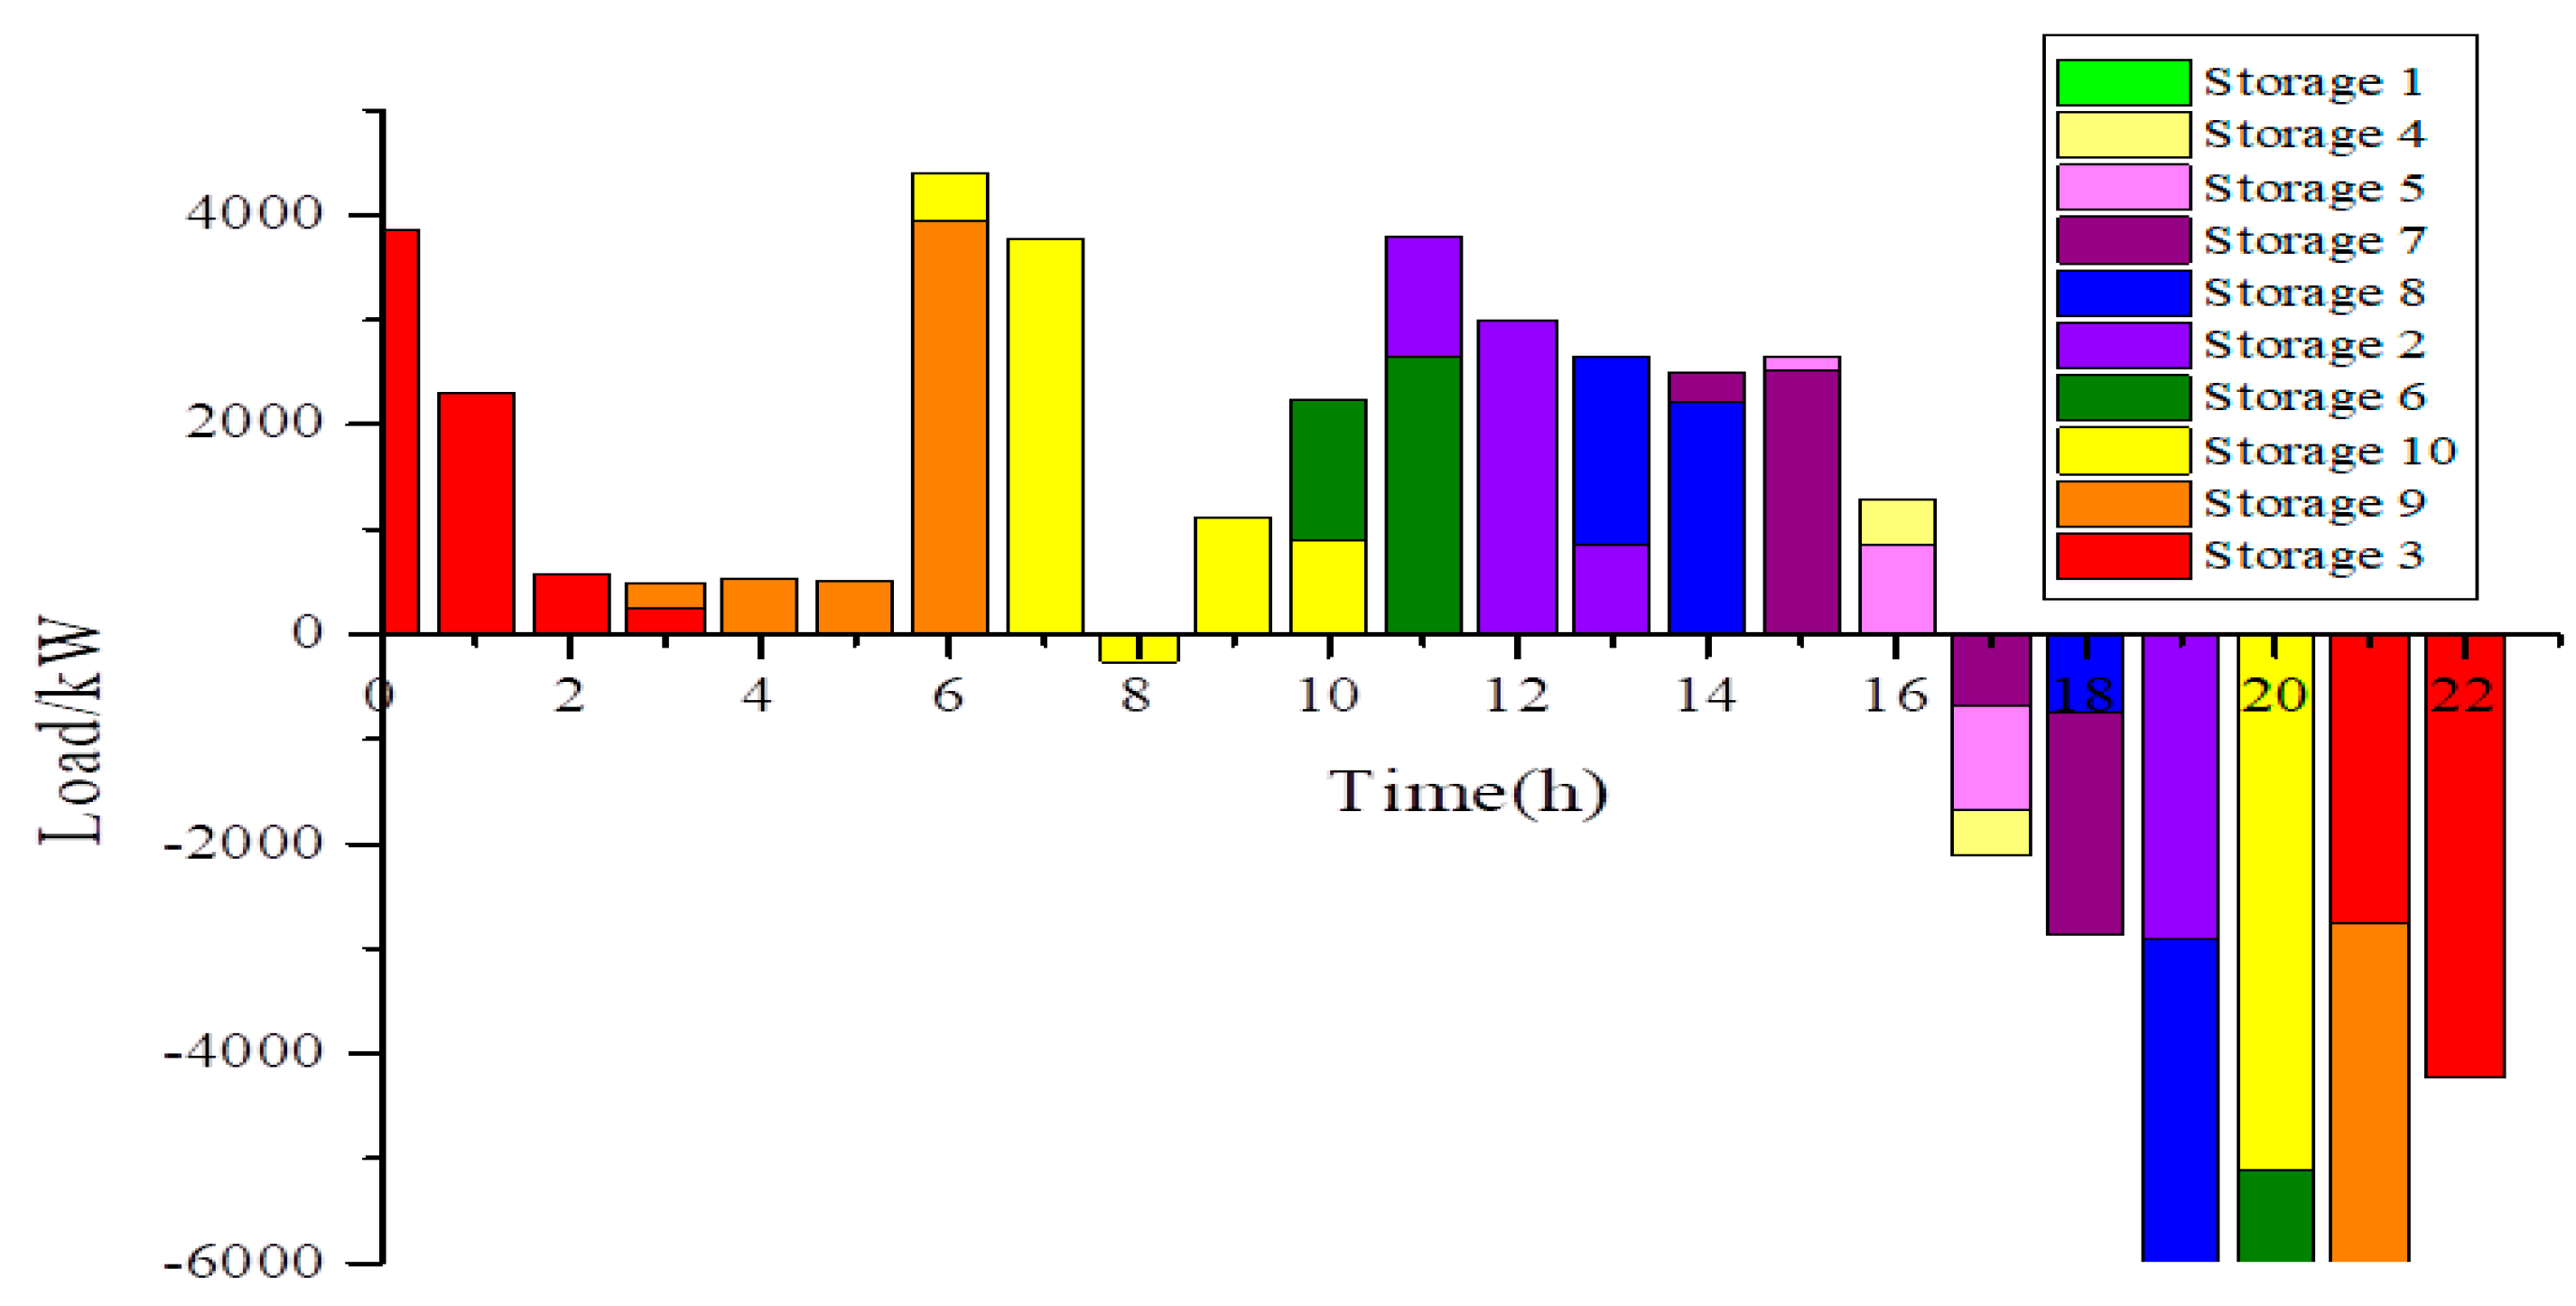
The real-time load status of each energy storage system is plotted as shown in Figure 8, and the load change status is shown in Figure 9. It can be observed that when the system needs to be charged, the bid-winning energy storage system is called in turn. When the former energy storage system reaches the maximum energy storage capacity, the next energy storage system is started. When the system needs to discharge, the “last in first out” method is adopted to discharge successively, and the electricity of the previous energy storage system is discharged after the electricity of the next energy storage system is started.
2) Cost allocation of energy storage system
According to the cost-sharing calculation method of energy storage per kilowatt hour, the cost-sharing results of each subject are shown in Table 6.
The total cost per kilowatt hour of the energy storage system is 8026.84 CNY, which shall be shared 1:1 between the generating side and the consuming side, and each side shall bear 50%. There is no electricity left in the energy storage system at the end of the trading day, so the charging amount of the energy storage system is equal to the discharge amount. In the case that the energy storage system does not carry out price discrimination on both sides of the generator and user, the cost per kilowatt hour shall be apportioned 1:1. If the energy storage system has an electricity balance or the energy storage supplier charges the power generation side and the power consumption side according to different standards, the apportionment ratio will change accordingly.
The cost-sharing ratio of energy storage per kilo hour on the power generation side is approximately 4:1. The main reason for the huge cost gap is the different characteristics of photovoltaic power generation and wind power generation, as well as the sequential call to the energy storage system. Daily trading starts at 0:00, when wind power generation is at its peak, and the surplus wind power is stored in energy storage systems (Nos. 3, 9, and 10) with large capacities and relatively low prices. At the peak of photovoltaic power generation, the remaining photovoltaic power generation can only be stored in other energy storage systems in turn, resulting in photovoltaic power providers bearing more energy storage cost per kilowatt hour.
As shown in Table 7, the apportionment of energy storage cost per kilowatt hour on the user side is mainly due to the large difference in the power characteristics of users. The electricity consumption time of user 1 is mostly concentrated at night when the power system is in the stage of oversupply and the kilowatt-hour cost of the energy storage system is borne by the power generation side. Therefore, the kilowatt-hour cost of the energy storage system of user 1 takes a very small proportion. The power consumption time of user 2, user 4 and user 5 is concentrated in the daytime. Although the photovoltaic power generation in the system is constantly rising at this time, the system is in the phase of supply less than demand most of the time due to the large user base charge, and the cost per kilowatt hour of the energy storage system is borne by the user side. Moreover, the electricity base charge of user 4 is at a high level in the peak period of electricity consumption, and it relies on the energy storage system for energy supply, so it bears more per-kilowatt-hour cost of the energy storage system. Although user 2 and user 5 also use electricity during peak hours, their total amount is less than that of user 4, so the cost per kilowatt hour of user 2 and user 5 is slightly lower than that of user 4. As the base charge of user 3 is relatively stable, it cannot be transferred during the peak period of electricity consumption, and its power base is large, so it also bears more energy storage cost per kilowatt hour. As a special participant, electric vehicles mainly play the role of absorbing and responding to the surplus clean energy power generation in the system. Therefore, their loads are all in the period when the supply of the power system exceeds the demand. At this time, the power generation side bears the cost per kilowatt hour of energy storage, so electric vehicles do not have to bear the cost per kilowatt hour of energy storage system. From a practical point of view, electric vehicles actively participate in the consumption of excess power generation and reduce load in the shortage of power generation, which plays a positive role in the operation of the power system. Therefore, there is no need to bear the kilowatt-hour cost of the energy storage system.

4.5. Income Analysis of Each Subject

(1) Revenue analysis
The summary of revenue is shown in Table 8.
(2) Revenue analysis of clean energy generators
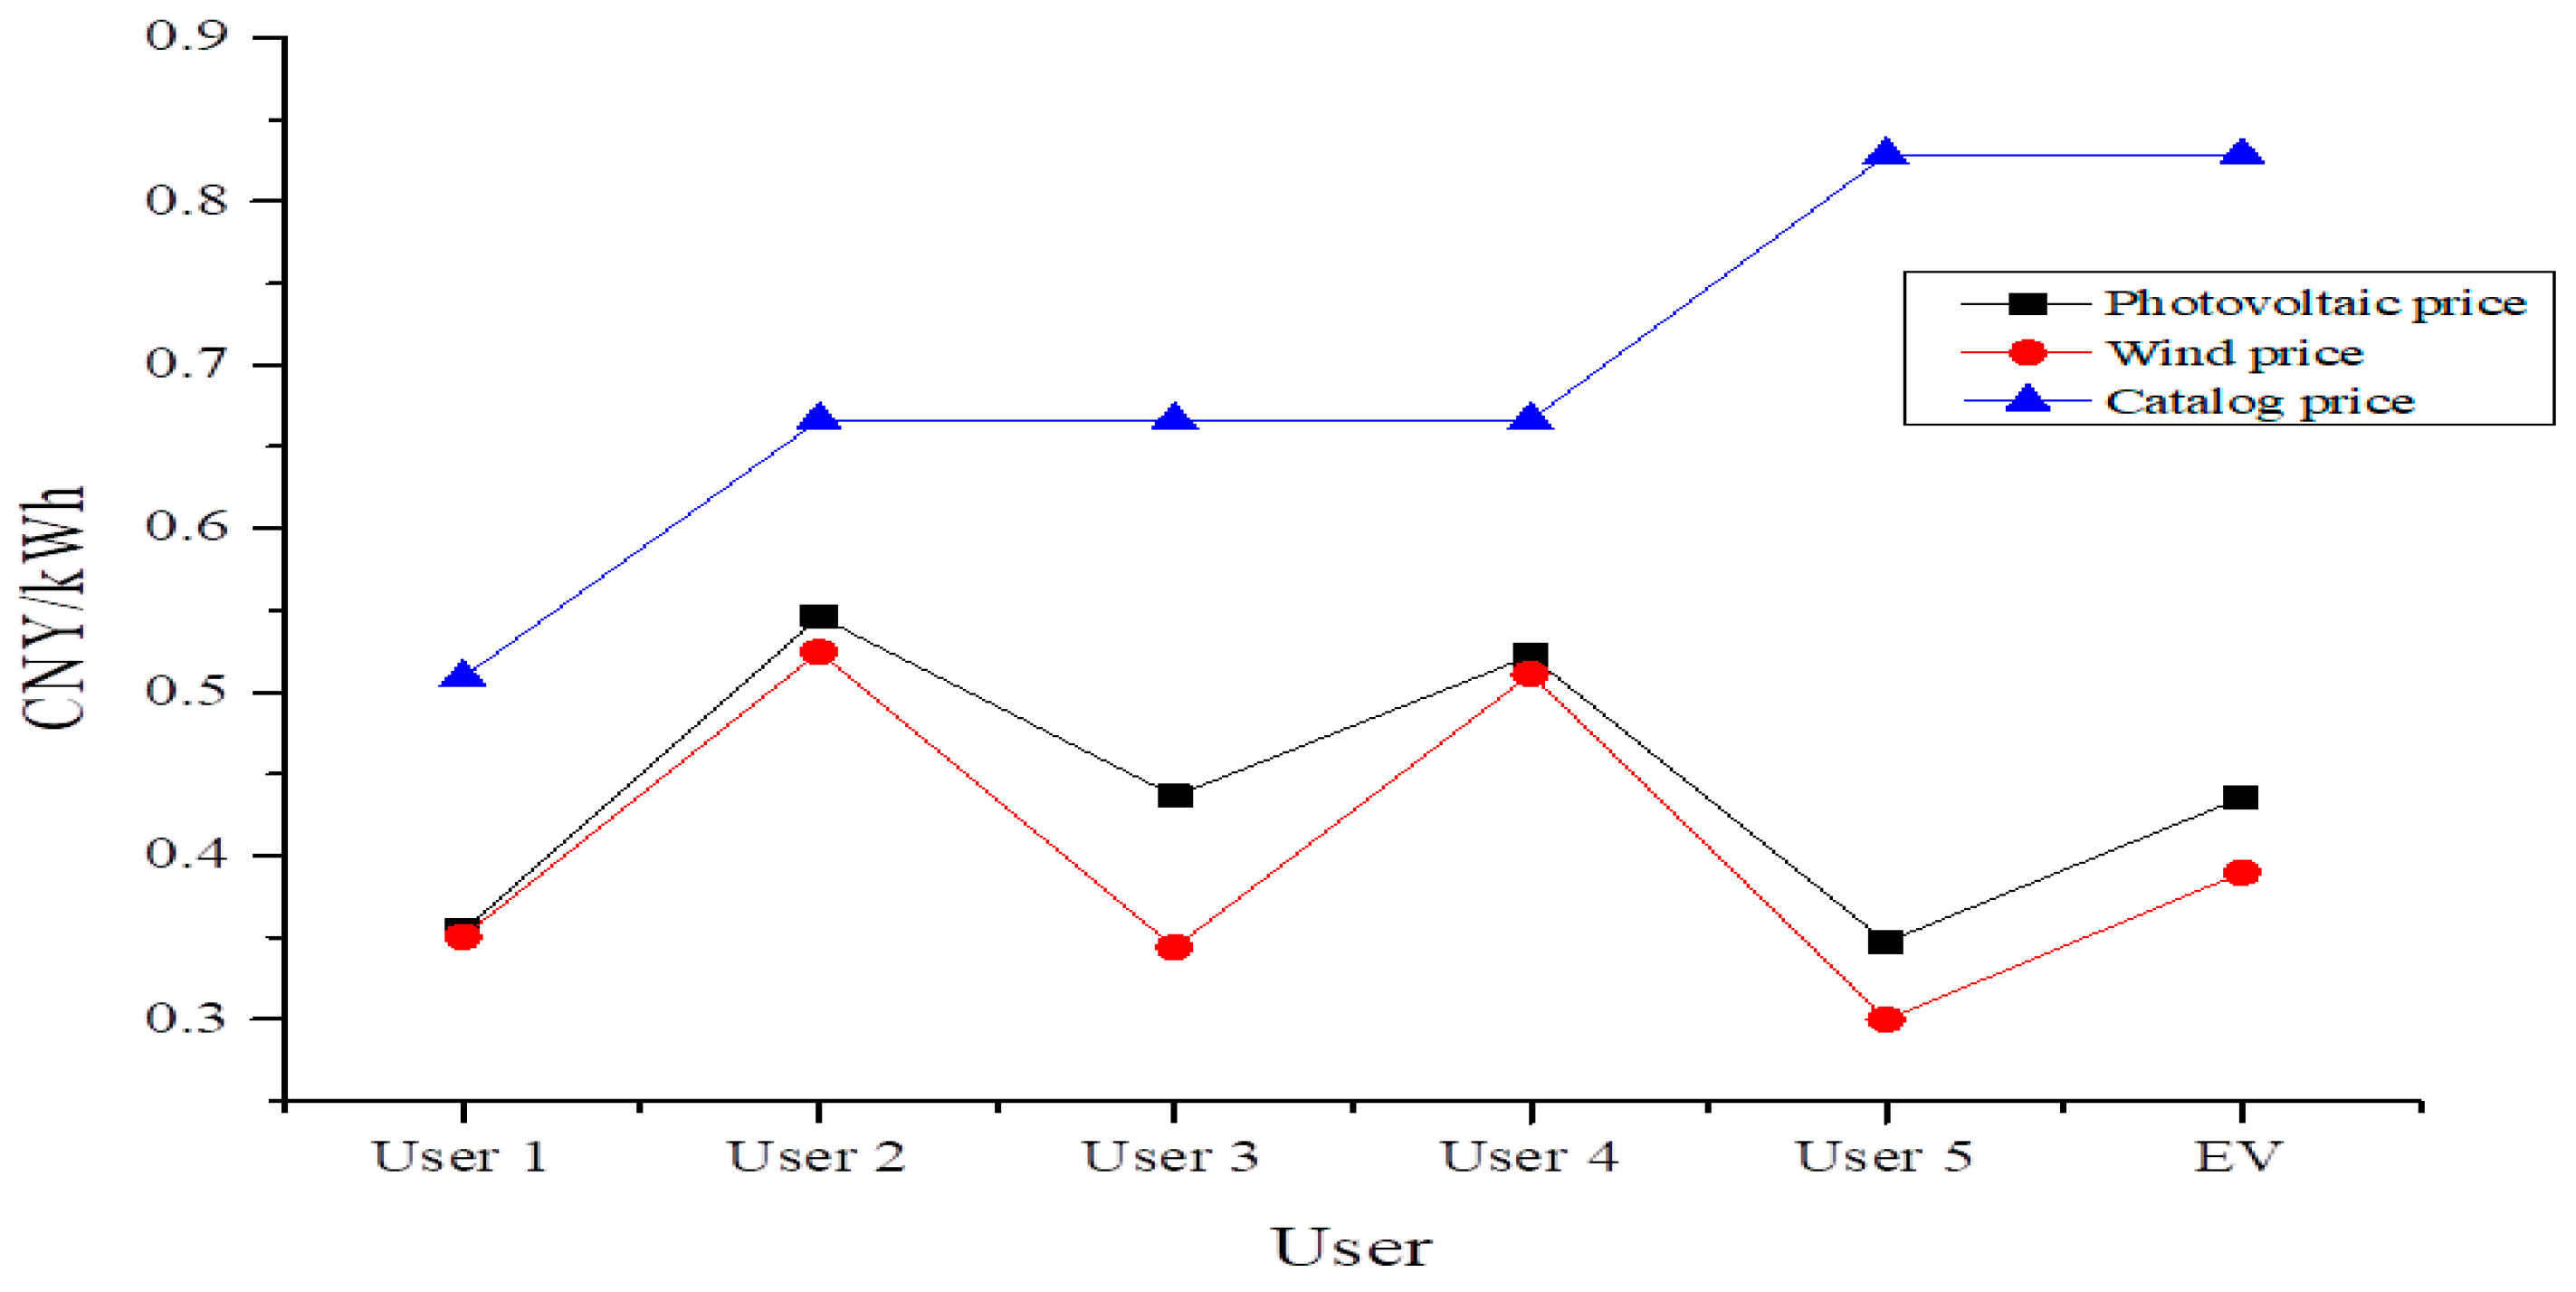
The revenue for clean energy power generation entities is shown in Table 9. The synergized deal added 148,560 kWh of photovoltaic power and wind power, respectively. In the case of the same consumption amount, there is a certain gap in the electricity fee income between the two, which is mainly related to the clean energy industrial structure and the cost of each clean energy generator. The wind power industry is relatively mature and has a large number of installations. But the photovoltaic power generation industry is in the early stage of development, and the scale is small. This leads to fierce price competition for wind power in the face of market bidding, and wind power generators will attract customers with greater incentives (see Figure 10). The mature development of the industry makes the average cost and marginal cost of wind power generation lower than the corresponding cost of photovoltaic power generation, which can give users a greater preferential space in the bidding.
(3) Revenue analysis of energy storage service provider
The settlement data of each time point is summarized in Table 10 shown below. The total revenue of energy storage providers is closely related to their capacity and kilowatt-hour price quotes. The larger the capacity is, the higher the revenue will be under the given capacity cost compensation coefficient. The higher the kilowatt-hour cost quotation, the greater the gain of the kilowatt-hour cost. However, it is worth noting that, according to the energy storage service quotation mechanism, the larger the capacity, the higher the ranking of the energy storage service providers, and the higher the probability of winning the bid; the higher the price, the lower the ranking of energy storage service providers, and the lower the probability of winning the bid. Therefore, under the constraint of the lowest income, the energy storage service providers with large capacity can quote the highest price possible, while the energy storage service providers with small capacity should carefully evaluate the price and lower the quotation to ensure that they win the bid.

4.6. Comparison with the TOU Power Price Mode

Table 11 shows the TOU power prices in Province J. If users participate in the TOU response, it is assumed that its adjustable resources are running at the lowest load, and the electric vehicle only consumes electricity during normal and low hours.
Table 12 summarizes the electricity consumption and expenses of each user in the TOU power price mode and the collaborative consumption mode. Benefiting from the preferential bilateral negotiated electricity price, users under the collaborative consumption mode increased their consumption of 7674 kWh (3%) of clean energy electricity, but saved 68,454.89 CNY (32%) of electricity bills. Among the users, only the EVs have increased their spending after participating in the coordinated consumption, which is due to the fact that in the TOU power price mode, the EVs can respond only during the valley time, when the electricity price is lower than the bilaterally negotiated electricity price. Therefore, electric vehicles, which can flexibly change the load with the electricity price, are more willing to participate in the TOU power price mode to enjoy greater electricity price discounts.

5. Conclusions and Policy Implications

In this paper, the transaction mode of demand-side resources and shared energy storage synergistic consumption of clean energy can fully tap the regulatory potential of demand-side resources and optimize allocation in combination with shared energy storage, so as to provide certain support for the realization of immediate response to clean energy output. The main research results of this paper are as follows:
(1) A trading mechanism of demand-side resources and shared energy storage was proposed to synergistically absorb clean energy, and an optimization model aimed at maximizing user benefits was established. The results show that the degree of similarity and difference between the user’s power consumption characteristics and the clean energy power generation curve has a strong impact on the model results, which directly determines the user’s dependence on the energy storage system, and thus affects the user’s energy storage cost and final net income.
(2) The important role of demand-side resources in synergistic absorption is verified, and it is proposed that users should fully tap the adjustment ability of their own demand-side resources and evaluate them when planning schemes, which can effectively reduce unnecessary energy storage costs and increase net benefits.
(3) The income improvement of the new mode is compared with the existing clean energy consumption model. It is found that compared with the TOU demand response mode, the user-tracking clean energy curve mode is more flexible, has more diversified choices and price decision-making rights, and can obtain the corresponding clean energy quota indicators, so as to obtain greater economic benefits.
It should be noted that we assume that all market players choose market behavior according to the principle of economic optimization, so we do not take into account the user’s usage habits or comfort and other factors in the modeling, which is indeed a very ambitious and important topic. A user’s usage habits and comfort in market transactions will be regarded as an important research direction in the future.

Author Contributions

Methodology, X.L. (Xiuping Li); software, L.Y. and X.L. (Xiaohu Luo); validation, L.Y.; formal analysis, X.L. (Xiuping Li); data curation, X.L. (Xiuping Li), X.Y., J.F. and Y.L.; writing—original draft preparation, X.L. (Xiuping Li) and Y.X.; writing—review and editing, X.L. (Xiaohu Luo) and J.F.; visualization, Y.X. and X.Y.; project administration, X.L. (Xiaohu Luo). All authors have read and agreed to the published version of the manuscript.

Funding

This research received no external funding.

Data Availability Statement

The original contributions presented in the study are included in the article, further inquiries can be directed to the corresponding author.

Conflicts of Interest

Authors Xiuping Li, Li Yang and Yi Xu were employed by the company Wudian New Energy Co., Ltd. Authors Xi Yang, Jugang Fang and Yuhao Lu were employed by the company China Power Gharmony Energy Technology Co., Ltd. The remaining authors declare that the research was conducted in the absence of any commercial or financial relationships that could be construed as a potential conflict of interest.

Parameters

VariablesInterpretationVariablesInterpretation
Q S S n j dispatching sequence of shared energy storage service provider i in the jth quotation T s t a r t , a 1 the earliest start time allowed for electrical equipment a 1
V S S n j shared energy storage service provider’s adjustment ability T e n d , a 1 the latest shutdown time allowed for electrical equipment a 1
r e s S S n t 1 historical response level t s t a r t , a 1 starting time of actual operation for electrical equipment a 1
P S S n j shared energy storage service provider’s service price t e n d , a 1 closing time of actual operation for electrical equipment a 1
Q ( T S S n j ) the order of declaration time T a 1 the   shortest   running   time   required   for   electrical   equipment   a 1
E s o l a r t = 1 photovoltaic power output N o f f , a 1 maximum   number   of   interruptions   allowed   in   a   job   for   electrical   equipment   a 1
E w i n d t = 1 wind power output λ a 1 , i running   state   variable   in   the   i - th   period   for   electrical   equipment   a 1
E T o t a l t = 1 total power generation of the system n o f f , a 3 actual interrupt times of interruptible device a 3
e s o l a r t = 1 proportion of photovoltaic power generation P E V t charging power of a single electric vehicle
e w i n d t = 1 proportion of wind power generation S O C e battery state of charge expected by the vehicle owner
E u ( n ) s o l a r t = 1 the initial distribution of photovoltaic power S O C 0 initial state of charge
E u ( n ) w i n d t = 1 the initial distribution of wind power η charging efficiency
E n s s o l a r t = 1 storage of photovoltaic power at the initial time t Δ charging time
E n s w i n d t = 1 storage of wind power at the initial time E battery capacity of electric vehicle
E N E W t = 2 total new generation output of the system at t = 2 P ( t ) + instantaneous charging power
E S T O R A G E t = 1 total stored power at t = 1 P ( t ) instantaneous discharging power
R V O L n capacity value of the energy storage system P E S S minimum charging and discharging power
R m the net income G E S S capacity of the energy storage system

Appendix A

Table A1. Optimized output result for each subject (kW).
Time
(h)
Photovoltaic WindUser 1Air Conditioning 1User 2Air Conditioning 2User 3Air Conditioning 3User 4Air Conditioning 4User 5Air Conditioning 5EVEnergy Storage
0 0 12,950 1579 800 819 0 3000 1500 886 0 0 0 500 3866
1 0 11,650 1713 800 975 0 3000 1500 858 0 0 0 500 2304
2 0 10,410 1943 800 911 0 3000 1692 987 0 0 0 500 577
3 0 9660 1406 800 849 0 3000 1777 835 0 0 0 500 493
4 630 8820 1253 800 829 0 3000 1723 820 0 0 0 500 525
5 890 7960 1087 800 882 0 3000 1677 904 0 0 0 0 500
6 4610 6450 0 0 809 0 3000 1500 853 0 0 0 500 4398
7 6800 6230 0 0 954 0 3000 1500 930 0 1167 1200 500 3779
8 7810 3290 0 0 1461 2500 3000 1500 881 0 818 1200 0 −260
9 8960 4140 0 0 1452 2500 3000 1500 836 0 988 1200 500 1124
10 9290 5020 0 0 1424 2500 3000 1500 961 0 980 1200 500 2245
11 13,990 4690 0 0 1318 2500 3000 1500 1019 2800 1045 1200 500 3798
12 14,830 3640 0 0 1684 2500 3000 1500 1089 2800 1197 1200 500 3000
13 13,120 4970 0 0 1958 2500 3000 1500 1069 2800 921 1200 500 2642
14 15,030 3450 0 0 2331 2500 3000 1500 1253 2800 894 1200 500 2502
15 15,520 3290 0 0 2179 2500 3000 1500 1477 2800 1000 1200 500 2654
16 13,770 3620 0 0 2025 2500 3000 1500 1653 2800 929 1200 500 1283
17 9630 3900 0 0 1976 2500 3000 1500 1720 2800 945 1200 0 −2111
18 7740 4770 0 0 1412 2500 3000 1500 1963 2800 1005 1200 0 −2870
19 5300 4370 0 0 1347 2500 3000 1500 2535 2800 949 1200 0 −6161
20 640 3860 0 0 1179 2500 3000 1500 2701 2800 826 1200 0 −11,206
21 0 5990 1064 800 889 0 3000 1500 2398 2800 1188 1200 0 −8849
22 0 6930 1776 800 830 0 3000 1500 893 0 1165 1200 0 −4234
23 0 8500 1001 906 981 0 3000 1800 812 0 0 0 0 −0
Table A2. Real-time load of each energy storage system (kW).
Time
(h)
Total Electricity
Demand
Energy
Storage 3
Energy
Storage 9
Energy
Storage 10
Energy
Storage 6
Energy
Storage 2
Energy
Storage 8
Energy
Storage 7
Energy
Storage 5
Energy
Storage 4
Energy
Storage 1
038663866000000000
161706170000000000
267476747000000000
37241700024100000000
47766700076600000000
582667000126600000000
612,664700052004640000000
716,4437000520042430000000
816,1837000520039830000000
917,3077000520051070000000
1019,5527000520060001352000000
1123,3507000520060004000115000000
1226,3507000520060004000415000000
1328,9927000520060004000500017920000
1431,494700052006000400050004000294000
1534,148700052006000400050004000280014800
1635,431700052006000400050004000280010004310
1733,3207000520060004000500040002120000
1830,4507000520060004000500032500000
1924,2897000520060004000208900000
2013,083700052008830000000
2142344234000000000
2200000000000
23(0)(0)000000000
Table A3. Total cost of each energy storage system (CNY).
Time
(h)
Total Electricity
Demand
Energy
Storage 3
Energy
Storage 9
Energy
Storage 10
Energy
Storage 6
Energy
Storage 2
Energy
Storage 8
Energy
Storage 7
Energy
Storage 5
Energy
Storage 4
Total
0162.370.000.000.000.000.000.000.000.000.00162
196.770.000.000.000.000.000.000.000.000.0097
224.250.000.000.000.000.000.000.000.000.0024
310.6120.210.000.000.000.000.000.000.000.0031
40.0044.140.000.000.000.000.000.000.000.0044
50.0042.000.000.000.000.000.000.000.000.0042
60.00330.4656.140.000.000.000.000.000.000.00387
70.000.00457.260.000.000.000.000.000.000.00457
80.000.0031.460.000.000.000.000.000.000.0031
90.000.00136.000.000.000.000.000.000.000.00136
100.000.00108.05105.460.000.000.000.000.000.00214
110.000.000.00206.54202.400.000.000.000.000.00409
120.000.000.000.00528.000.000.000.000.000.00528
130.000.000.000.00149.60295.680.000.000.000.00445
140.000.000.000.000.00364.3254.100.000.000.00418
150.000.000.000.000.000.00461.1016.870.000.00478
160.000.000.000.000.000.000.0097.1343.960.00141
170.000.000.000.000.000.00125.12114.0043.960.00283
180.000.000.000.000.00123.75390.080.000.000.00514
190.000.000.000.00512.34536.250.000.000.000.001048
200.000.00619.16312.00367.660.000.000.000.000.001299
21116.17436.80106.840.000.000.000.000.000.000.00660
22177.830.000.000.000.000.000.000.000.000.00177
230.000.000.000.000.000.000.000.000.000.000
Total588.00873.601514.92624.001760.001320.001030.40228.0087.920.008027
Table A4. Electricity bill breakdown results (CNY).
Time
(h)
Total CostPower Generation SignsUsers SignsPhotovoltaic WindUser 1User 2User 3User 4User 5EVPower Generation Users
0162.37100.00162.370.000.000.000.000.000.00162.370.00
196.77100.0096.770.000.000.000.000.000.0096.770.00
224.25100.0024.250.000.000.000.000.000.0024.250.00
330.82100.0030.820.000.000.000.000.000.0030.820.00
444.141024.6219.510.000.000.000.000.000.0044.140.00
542.001024.8217.180.000.000.000.000.000.0042.000.00
6386.6010247.71138.890.000.000.000.000.000.00386.600.00
7457.2610378.1579.110.000.000.000.000.000.00457.260.00
831.46010.000.000.0010.9712.462.445.590.000.0031.46
9136.0010136.000.000.000.000.000.000.000.00136.000.00
10213.5110173.4440.070.000.000.000.000.000.00213.510.00
11408.9410408.940.000.000.000.000.000.000.00408.940.00
12528.0010528.000.000.000.000.000.000.000.00528.000.00
13445.2810306.94138.340.000.000.000.000.000.00445.280.00
14418.4210418.420.000.000.000.000.000.000.00418.420.00
15477.9810477.980.000.000.000.000.000.000.00477.980.00
16141.0910118.1022.990.000.000.000.000.000.00141.090.00
17283.08010.000.000.0081.0181.4481.8138.80.000.00283.08
18513.83010.000.000.00130.70150.34159.1373.70.000.00513.83
191048.59010.000.000.00254.81298.06353.371420.000.001048.59
201298.82010.000.000.00304.24372.13454.911680.000.001298.82
21659.82010.000.0082.8839.53200.09231.131060.000.00659.82
22177.83010.000.0041.0313.2271.6814.2237.70.000.00177.83
230.00000.000.000.000.000.000.000.000.000.000.00
Total8026.84//3243.11770.31123.91834.471186.211297.015720.004013.424013.42
Table A5. Output of each user under TOU price (kW).
Time
(h)
Photovoltaic WindUser 1Air Conditioning 1User 2Air Conditioning 2User 3Air Conditioning 3User 4Air Conditioning 4User 5Air Conditioning 5EVEnergy Storage
015798008190300015008860005000 500 3866
117138009750300015008580005000 500 2304
219438009110300015009870005000 500 577
314068008490300015008350005000 500 493
412538008290300015008200005000 500 525
510878008820300015009040005000 0 500
6008090300015008530005000 500 4398
700954030001500930011678005001200 500 3779
8001461250030001500881081880001200 0 −260
9001452250030001500836098880001200 500 1124
10001424250030001500961098080001200 500 2245
1100131825003000150010192800104580001200 500 3798
120016842500300015001089280011978005001200 500 3000
13001958250030001500106928009218005001200 500 2642
14002331250030001500125328008948005001200 500 2502
150021792500300015001477280010008005001200 500 2654
16002025250030001500165328009298005001200 500 1283
170019762500300015001720280094580001200 0 −2111
1800141225003000150019632800100580001200 0 −2870
190013472500300015002535280094980001200 0 −6161
200011792500300015002701280082680001200 0 −11,206
21106480088903000150023982800118880001200 0 −8849
221776800830030001500893011658005001200 0 −4234
2310018009810300015008120005000 0 −0
Total12,822720031,47432,50072,00036,00030,33330,80016,01712,800750012,822720031,474

References

  1. Moz-Christofoletti, M.A.; Pereda, P.C. Winners and losers: The distributional impacts of a carbon tax in Brazil. Ecol. Econ. 2021, 183, 106945. [Google Scholar] [CrossRef]
  2. Xie, Y.; Wu, D.; Zhu, S. Can new energy vehicles subsidy curb the urban air pollution? Empirical evidence from pilot cities in China. Sci. Total Environ. 2021, 754, 142232. [Google Scholar] [CrossRef] [PubMed]
  3. Wang, H.; Zhao, X.-G.; Ren, L.-Z.; Lu, F. An agent-based modeling approach for analyzing the influence of market participants’ strategic behavior on green certificate trading. Energy 2021, 218, 119463. [Google Scholar]
  4. Tan, Q.; Ding, Y.; Zheng, J.; Dai, M.; Zhang, Y. The effects of carbon emissions trading and renewable portfolio standards on the integrated wind–photovoltaic–thermal power-dispatching system: Real case studies in China. Energy 2021, 222, 119927. [Google Scholar] [CrossRef]
  5. Quan, S.; Lu, J.; Xie, C.; Zeng, M.; Tian, K. International experience of demand side response mechanism and its enlightenment to China. Power Demand Side Manag. 2009, 11, 73–76. [Google Scholar]
  6. Wu, W.; Pang, J.; Chen, G.; Wang, X. Review on the development of power demand side response. Electron. Meas. 2014, 3, 86–94. [Google Scholar]
  7. Wang, L.; Zeng, M.; Zhao, J.; Li, B.; Wang, Y. Research on Optimal Operation of Multi-energy Collaborative System Considering Power Demand Response. Electr. Power Eng. Technol. 2021, 40, 9. [Google Scholar]
  8. Lu, H.; Du, J.; Zhang, H.; Guo, X.; Du, J.; Zhang, Y.; Li, C.; Dong, L.; Chen, Y. High energy storage capacitance of defluorinated polyvinylidene fluoride and polyvinylidene fluoride blend alloy for capacitor applications. J. Appl. Polym. Sci. 2020, 137, 49055. [Google Scholar] [CrossRef]
  9. Wu, L.; Yue, F.; Song, A.; Qiu, T.; Dong, D.; Luo, R.; Fan, X.; Li, X. Comparative analysis of business models of distributed energy storage. Energy Storage Sci. Technol. 2019, 8, 960–966. [Google Scholar]
  10. Wang, Z.M.; Gu, C.H.; Li, F.R.; Bale, P.; Sun, H.B. Active demand response using shared energy storage for household energy management. IEEE Trans. Smart Grid 2013, 4, 1888–1897. [Google Scholar] [CrossRef]
  11. Liu, J.; Chen, X.; Xiang, Y. Optimal allocation of energy storage and investment benefit of electricity selling companies under market mechanism considering sharing mode. Power Syst. Technol. 2020, 44, 1740–1750. [Google Scholar]
  12. Hosseini, S.M.; Carli, R.; Dotoli, M. Robust Optimal Demand Response of Energy-efficient Commercial Buildings. In Proceedings of the 2022 European Control Conference (ECC), London, UK, 12–15 July 2022; pp. 1–6. [Google Scholar]
  13. Kim, H.; Kim, M.; Lee, J. A two-stage stochastic p-robust optimal energy trading management in microgrid operation considering uncertainty with hybrid demand response. Int. J. Electr. Power Energy Syst. 2021, 124, 106422. [Google Scholar] [CrossRef]
  14. Egli, F.; Steffen, B.; Schmidt, T.S. A dynamic analysis of financing conditions for renewable energy technologies. Nat. Energy 2018, 3, 1084–1092. [Google Scholar] [CrossRef]
  15. Yilanci, V.; Ozgur, O.; Gorus, M.S. The asymmetric effects of foreign direct investment on clean energy consumption in BRICS countries: A recently introduced hidden cointegration test. J. Clean. Prod. 2019, 237, 117786. [Google Scholar] [CrossRef]
  16. Paramati, S.R.; Ummalla, M.; Apergis, N. The effect of foreign direct investment and stock market growth on clean energy use across a panel of emerging market economies. Energy Econ. 2016, 56, 29–41. [Google Scholar] [CrossRef]
  17. Polzin, F.; Migendt, M.; Täube, F.A. Paschen von Flotow. Public policy influence on renewable energy investments—A panel data study across OECD countries. Energy Policy 2015, 80, 98–111. [Google Scholar] [CrossRef]
  18. Ji, Q.; Zhang, D. How much does financial development contribute to renewable energy growth and upgrading of energy structure in China? Energy Policy 2019, 128, 114–124. [Google Scholar] [CrossRef]
  19. Xu, F.; Tu, M.; Li, L.; Zhang, Y.; Leng, Y.; Chang, L. Grid-wide integrated power generation plan model and solution to promote clean energy consumption. Power Syst. Autom. 2019, 43, 185–208. (In Chinese) [Google Scholar]
  20. Pradhan, S.; Ale, B.B.; Amatya, V.B. Mitigation potential of greenhouse gas emission and implications on fuel consumption due to clean energy vehicles as public passenger transport in Kathmandu Valley of Nepal: A case study of trolley buses in Ring Road. Energy 2005, 31, 1748–1760. [Google Scholar] [CrossRef]
  21. Elgamal, A.H.; Kocher-Oberlehner, G.; Robu, V.; Andoni, M. Optimization of a multiple-scale renewable energy-based virtual power plant in the UK. Appl. Energy 2019, 256, 113973. [Google Scholar] [CrossRef]
  22. Tian, S.; Chang, S. An agent-based model of household energy consumption. J. Clean. Prod. 2020, 242, 118378. [Google Scholar] [CrossRef]
  23. van der Roest, E.; Snip, L.; Fens, T.; van Wijk, A. Introducing Power-to-H3: Combining renewable electricity with heat, water and hydrogen production and storage in a neighbourhood. Appl. Energy 2020, 257, 114024. [Google Scholar] [CrossRef]
  24. Li, J.; Hu, Y.; Chi, Y.; Liu, D.; Yang, S.; Gao, Z.; Chen, Y. Analysis on the synergy between markets of electricity, carbon, and tradable green certificates in China. Energy 2024, 302, 131808. [Google Scholar] [CrossRef]
  25. Shi, L.; Zhou, L.; Pang, B.; Yan, Y.; Zhang, F.; Liu, J. Design idea of market mechanism for promoting clean energy consumption in China. Autom. Electr. Power Syst. 2017, 41, 83–89. [Google Scholar]
  26. Sun, C.; Zheng, T.; Chen, L. Energy storage sharing mechanism based on combinatorial double auction. Power Syst. Technol. 2020, 44, 1732–1739. (In Chinese) [Google Scholar]
  27. Yang, J.; Xia, Y.; Wang, Y. Clearing model and pricing rules of energy storage rights in electricity market. Power Syst. Technol. 2020, 44, 1750–1759. (In Chinese) [Google Scholar]
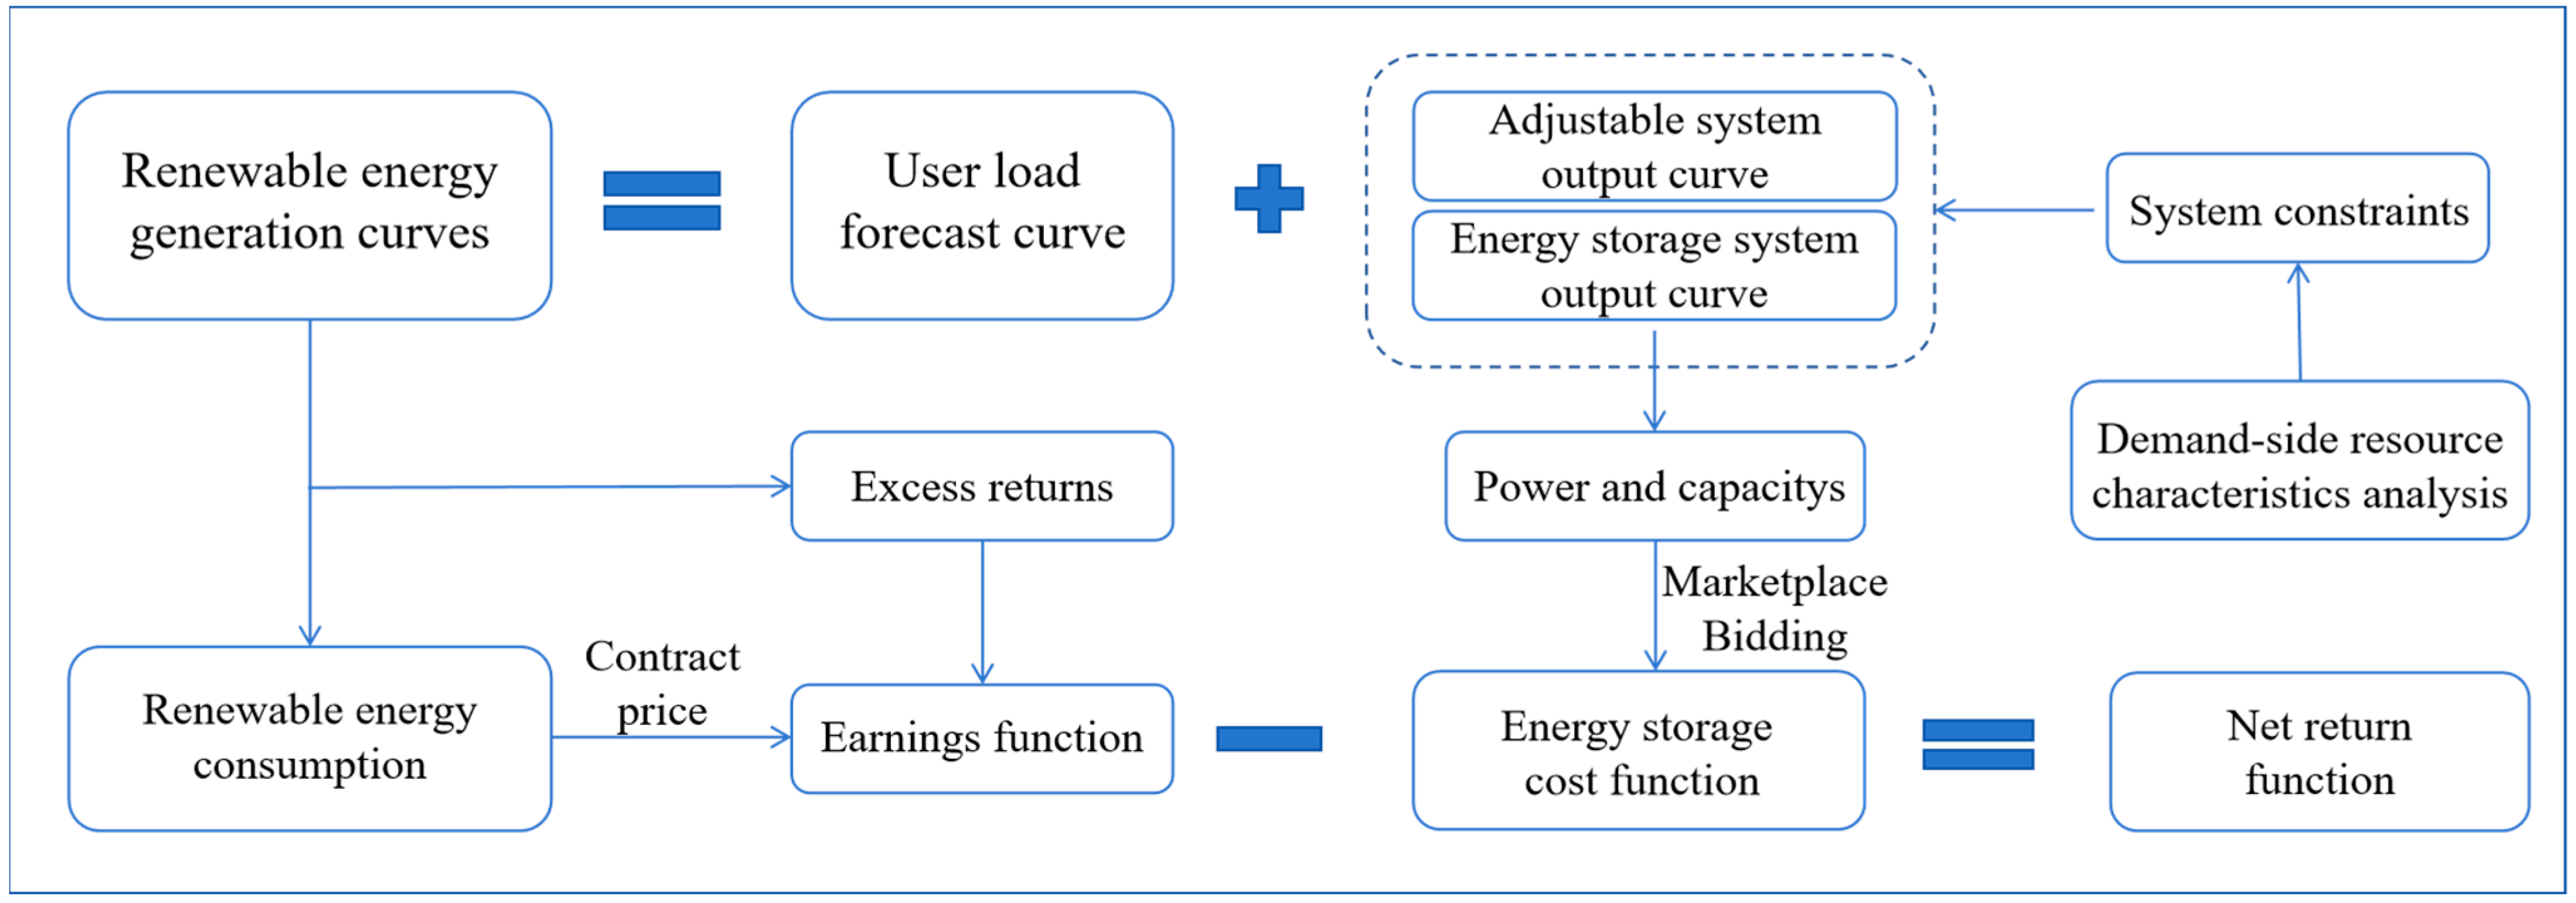
Figure 1. The framework of research.
Energies 17 03378 g001
Figure 2. Modeling logic.
Energies 17 03378 g002
Figure 3. Clean energy incremental power generation curve.
Energies 17 03378 g003
Figure 4. Base load of different users.
Energies 17 03378 g004
Figure 5. System optimization results of collaborative absorption.
Energies 17 03378 g005
Figure 6. Photovoltaic power generation decomposition results.
Energies 17 03378 g006
Figure 7. Wind power generation decomposes results.
Energies 17 03378 g007
Figure 8. The load of each energy storage system.
Energies 17 03378 g008
Figure 9. Output of each energy storage system.
Energies 17 03378 g009
Figure 10. Clean energy entities negotiate prices bilaterally.
Energies 17 03378 g010
Table 1. Survey data on the responsiveness of demand-side resources.
Demand-Side ResourcesAC 1AC 2AC 3AC 4AC 5EV
Lower load limit (kW)800250015002800800500
upper load limit (kW)15002800180030001200500
Adjustable time21:00–5:008:00–20:0000:00–23:5911:00–21:007:00–22:0000:00–23:59
Adjustable duration (h)91324111624
Table 2. User catalog electricity price.
UserUser 1User 2User 3User 4User 5EV
Catalog electricity (CNY/kWh)0.50900.66640.66640.66640.81830.8283
Table 3. Bidding results of energy storage service.
IndexCapacity (kW/kWh)Price (CNY/kWh)Historical ResponseRanking IndexRank
11000/20000.1400.805714.2910
25000/10,0000.1760.9928,125.005
37000/14,0000.0420.90150,000.001
41000/20000.1020.646274.519
51000/20000.1140.907894.748
64000/80000.0780.6332,307.694
72800/56000.1840.8512,934.787
84000/80000.1650.7718,666.676
95200/10,4000.0840.9458,190.482
106000/12,0000.1210.8441,652.893
Table 4. The amount of electricity consumed by each user is decomposed and summarized.
Total Generation (kW)297,120Photovoltaic Power Generation (kW)148,560Wind Power Generation (kW)148,560
user 120,128user 11379user 118,749
user 263,974user 239,009user 224,965
user 3109,168user 346,545user 362,623
user 461,133user 436,652user 424,481
user 535,217user 521,772user 513,445
EV7500EV3202EV4298
Table 5. The proportion of clean energy consumed by each user.
User 1User 2User 3User 4User 5EV
Photovoltaic consumption0.93%26.26%31.33%24.67%14.66%2.16%
Wind consumption12.62%16.80%42.15%16.48%9.05%2.89%
Total consumption6.77%21.53%36.74%20.58%11.85%2.52%
Table 6. The apportionment of electricity cost of each entity.
Power Generator
Allocation (CNY)
Electricity User Allocation (CNY)
4013.42 (50.00%)4013.42 (50.00%)
PhotovoltaicWinduser 1user 2user 3user 4user 5EV
3243.11
(80.81%)
770.31
(19.19%)
123.91
(3.09%)
834.47
(20.79%)
1186.21
(29.56%)
1297.01
(32.32%)
571.81
(14.25%)
0.00
(0.00%)
Total Cost (CNY)8026.84
Table 7. Summary data of hourly electricity cost at each time point.
Time
(h)
Total Cost (CNY)Time
(h)
Total Cost (CNY)Time
(h)
Total Cost (CNY)
0162.37831.4616141.09
196.779136.0017283.08
224.2510213.5118513.83
330.8211408.94191048.59
444.1412528.00201298.82
542.0013445.2821659.82
6386.6014418.4222177.83
7457.2615477.98230.00
Table 8. Summary of revenue.
IndicatorsUnitSummary
Total consumptionkWh297,120
Total costCNY129,618.17
Initial costCNY201,748.50
Cost savingCNY72,130.33
Capacity costCNY37,000
Electricity costCNY8026.84
Storage costCNY45,026.84
Table 9. Revenue summary of clean energy power generation entities.
IndicatorsUnitSummary
Photovoltaic consumptionkWh148,560
Wind consumptionkWh148,560
Photovoltaic revenueCNY70,210.11
Wind revenueCNY59,408.06
Table 10. Revenue analysis of each energy storage service provider.
Ranking
(Number)
Capacity
(kW/kWh)
Quotation (CNY/kWh)Capacity Cost Compensation Factor (CNY/kW)Revenue from Capacity (CNY)Revenue from Electricity
(CNY)
Total Revenue
(CNY)
1 (3)7000/14,0000.04217000588.007588.00
2 (9)5200/10,4000.08415200873.606073.60
3 (10)6000/12,0000.121160001514.927514.92
4 (6)4000/80000.07814000624.004624.00
5 (2)5000/10,0000.176150001760.006760.00
6 (8)4000/80000.165140001320.005320.00
7 (7)2800/56000.184128001030.403830.40
8 (5)1000/20000.11411000228.001228.00
9 (4)1000/20000.1021100087.921087.92
10 (1)1000/20000.140110000.001000.00
Table 11. TOU power price list of J province.
TimePeak Time
(08:00–11:00, 15:00–21:00)
Shoulder Time
(12:00–16:00, 22:00–23:00)
Valley Time
(00:00–7:00)
Price (CNY/kWh)1.06970.64180.3139
Table 12. Comparison of electricity consumption and expenses under different modes.
Electricity Consumption in TOU Mode (kWh)Total Spending in TOU Mode (CNY)Electricity Consumption in Synergistic Mode (kWh)Total Spending in Synergistic Mode (CNY)Changes in Electricity Consumption (kWh)Changes in Expenditures (CNY)
User 120,0229128.9420,1287767.92+106.00−1361.02
User 263,97452,642.8163,97436,744.950.00−15,897.86
User 3108,00074,839.95109,16848,700.39+1168.00−26,139.56
User 461,13350,529.1361,13334,614.460.00−15,914.67
User 528,81724,672.2135,21715,386.01+6400.00−9286.20
EV75003501.9075003646.310.00144.41
Disclaimer/Publisher’s Note: The statements, opinions and data contained in all publications are solely those of the individual author(s) and contributor(s) and not of MDPI and/or the editor(s). MDPI and/or the editor(s) disclaim responsibility for any injury to people or property resulting from any ideas, methods, instructions or products referred to in the content.