Technical Note

A Feasible Region-Based Evaluation Method for the Renewable Energy Hosting Capacity with Frequency Security Constraints

1
State Key Laboratory of Power Transmission Equipment Technology, Chongqing University, Chongqing 400044, China
2
Economic and Technological Research Institute of State Grid Shanxi Electric Power Co., Ltd., Taiyuan 030000, China
*
Author to whom correspondence should be addressed.
Energies 2024, 17(13), 3317; https://doi.org/10.3390/en17133317
Submission received: 25 April 2024 / Revised: 18 June 2024 / Accepted: 25 June 2024 / Published: 5 July 2024

Abstract

:
As renewable energy becomes more widespread, the uncertainty of its output poses serious challenges for peak and frequency regulation of the power system. Evaluating a grid’s capacity to integrate renewable energy sources can provide an early-warning and decision-making basis for grid operation and scheduling. This paper presents a method for evaluating the hosting capacity of renewable energy, considering frequency security constraints. Introducing the system frequency nadir constraint into a system ensures that the frequency does not drop to a dangerous level in the event of power disturbances. The analytical characterization relation equation for the system frequency nadir constraint is constructed based on polynomial chaos expansion (PCE) theory. Furthermore, with the goal of minimizing the reduction in renewable energy, considering multiple flexible resources, like demand response (DR), Combined Heat and Power (CHP), energy storage, and Power-to-Gas (P2G), a renewable energy hosting capacity evaluation model that considers frequency security and flexibility resources is established. Finally, based on the concept of the feasible region, the maximum hosting capacity of a system’s renewable energy is visualized using the progressive vertex enumeration method. It identifies the safe operating region for renewable energy output that meets the safety constraints of power grid operations. The simulation results were validated using a modified IEEE 39 bus system.

1. Introduction

The global development of renewable energy is progressing rapidly, with a significant increase in the utilization of wind and solar power. This has led to a continuous increase in grids’ renewable energy penetration rate. Nevertheless, the unpredictability of renewable energy production may result in safety concerns, such as system frequency variations, voltage fluctuations due to line overload, and reduced dependability. In order to guarantee the secure and efficient integration of renewable energy into power grids, it is crucial to precisely assess a grid’s capacity limit for renewable energy integration. In recent years, the evaluation of the renewable energy hosting capacity has been primarily categorized into long-term and short-term evaluations, based on time frames.
The long-term evaluation, concentrating on strategic planning, includes an analysis of the hosting capacity of renewable energy on a monthly, quarterly, and yearly basis. It requires thorough examination of the long-term parameters, such as the spatial distribution of renewable energy resources, seasonal patterns, trends in installed capacity expansion, and oscillations in electricity consumption. In [1], geospatial methods, like Geographic Information Systems (GIS), were utilized by the researchers to pinpoint the appropriate locations in Ecuador where renewable energy facilities could potentially be established. The spatial evaluation of renewable energy potential was accomplished by conducting a statistical analysis of the findings, which served as a benchmark for national programs related to planning renewable energy. In [2], the analysis takes into account inter-provincial connections and various limitations, resulting in the development of a comprehensive model for planning renewable energy at the province level. This model includes both the minimum cost of generation and the distance required for scheduling renewable energy. In [3], a probability model for solar power generation was constructed using Markov chains, based on historical data. The projected solar power generation sequence was utilized in the economic dispatch model to determine the hosting capacity of renewable energy.
The evaluation of the renewable energy hosting capacity in the short-term primarily focuses on the immediate or temporary (hourly or daily) operating conditions of a power grid, as well as the methods for handling temporary variations in renewable energy production [4]. In order to ensure the safety of a system, the greatest amount of renewable energy that can be produced while still meeting operational limitations is commonly employed as the measure of a system’s capacity to host renewable energy sources [5]. The maximum threshold for installed wind power capacity was established in [6] by evaluating the maximum gearbox power that could be sustained within stability constraints, while considering the influence of different environmental circumstances. Meanwhile, [7] evaluated the highest capacity for solar (PV) access by determining the Optimal Power Flow (OPF), guaranteeing the maximization of overall solar output while complying with network and physical limitations. To assess the hosting capacity of renewable energy more accurately, evaluation methods have commonly taken into account additional factors, such as short-circuit ratio constraints [8], the power flow constraints of transmission networks [9], as well as the stochastic nature of renewable energy, and the vulnerability of a system following its integration [10]. In study [11], a correlation was established between the spatial correlation coefficient and distance. This led to the development of a photovoltaic output probability model that considers spatial attributes. Additionally, a stochastic model was suggested to assess the capacity of solar power generation with the objective of maximizing the output of photovoltaic systems. Paper [12] introduced a technique for evaluating the highest possible capacity for hosting solar energy. This method considers the reliable functioning of on-load tap changers and static reactive power compensators, even when there is uncertainty about the power production and load-hosting capacity. Reference [13] considered steady-state voltage limitations to assess the maximum distributed energy penetration rate of a system. A short-term evaluation is advantageous for controlling generator output, managing generation boundary scheduling, and promptly responding to risky circumstances in a power system [14].
This paper focuses on the short-term evaluation of the renewable energy hosting capacity. Current short-term evaluation methods do not sufficiently consider the frequency security and stability difficulties generated by the intermittent and volatile nature of large-scale renewable energy. Much research has included frequency security limitations in scheduling models. In [15], a power system unit commitment model was created that takes into account frequency security limitations. Paper [16] examined the impact of variations in the distribution of frequency regulation resources on inter-regional frequency dynamics disparities. A distributionally resilient unit commitment model was proposed, which considers the full process of the frequency response. A dynamic frequency response model with load-side inertia was presented in [17], and an optimization model for installed wind power capacity, considering the dynamic frequency constraints and load-side inertia, was proposed. However, these models do not take into account the frequency constraint at the lowest point, which can lead to inaccurate simulations of the energy hosting capacity evaluation and fail to accurately represent the true system boundary conditions. In order to account for the frequency constraint at the lowest point, prior research [18,19] has distinguished the frequency deviation from the system governor reaction, and depicted the frequency profile as a parabolic function. Subsequently, this function has been employed to ascertain the lowest point of a system’s frequency. In [20], a new frequency-constrained unit commitment model that considers different governor response characteristics was proposed. The system frequency regulation transfer function model has been simplified, as described in references [21,22,23,24], to derive a low-order frequency response model. This model offers equations for frequency deviation and power perturbation, and provides a direct correlation between the system frequency deviation, system power perturbation, and system frequency regulation parameters through a process of fitting. Nevertheless, it should be noted that these methods may distort the system transfer function during simplification, rendering the model unsuitable for more complex frequency regulation systems. If the security constraints related to frequency are considered in the renewable energy hosting capacity evaluation, but the constraints related to the frequency nadir are not fully considered, it may lead to inaccurate simulation results for the renewable energy hosting capacity evaluation. This, similarly, may fail to effectively reflect the system boundary conditions, thus affecting the effective hosting capacity of renewable energy.
To summarize, there are three problems with the existing evaluation of the short-term potential for hosting renewable energy. First and foremost, the present research does not adequately consider the safety and stability limits related to frequency. The formidable nonlinearity and intricacy of the nadir point frequency constraint also present difficulties for implementing frequency security constraints. Furthermore, although there has been much research on how flexible resources might improve the capacity of renewable energy hosting [25,26,27,28,29], there is a dearth of comprehensive analyses quantifying the specific impact of different forms of flexible resources on this capacity. Finally, the present research measures the hosting capacity of a system by utilizing the maximum threshold of the total number of renewable energy units, without taking into account the interconnection between different renewable energy sources. This oversight results in an excessively optimistic evaluation of the capacity to accommodate renewable energy.
In response to these limitations, our study introduces a novel framework that not only quantifies the impact of various flexible resources on the renewable energy hosting capacity, but also incorporates frequency stability constraints and coupling relationships between the outputs of renewable energy units, providing a more nuanced and accurate assessment of a system’s renewable hosting capabilities. This approach bridges the identified gaps and makes a contribution to renewable energy integration. The main contributions of this paper can be summarized as follows:
  • The evaluation process incorporates frequency security constraints, including the frequency change rate, steady-state frequency deviation, frequency standby, and frequency nadir point. The polynomial chaos expansion (PCE) theory is employed to address the challenging frequency nadir constraint by integrating the step-response integral. This technique fulfils the intricate demands of power systems.
  • An evaluation model is constructed to accurately quantify the promotional effect of various flexible resources, such as demand response (DR), energy storage, thermal storage, Combined Heat and Power units (CHP), and Power-to-Gas units (P2G), on the hosting capacity of renewable energy.
  • Using progressive vertex enumeration, a safe area is formed for the viable output of renewable energy. This is achieved while ensuring that the security restrictions for power grid operation are met. The construction takes into account the coupling correlation characteristics of the renewable energy units. This guarantees that the system can accommodate renewable energy in a manner that is safer, more adaptable, and more dependable.
The remainder of this paper is organized as follows. Section 1 introduces the analytical expression of a system’s dynamic frequency constraints and the analytical method for the nadir point frequency constraint based on PCE. Section 2 proposes a renewable energy hosting capacity evaluation model that incorporates frequency security constraints. Section 3 elaborates on the method for characterizing the safe feasible region for the hosting capacity of renewable energy. Case studies are conducted in Section 4. Finally, Section 5 presents the conclusions.

2. Analytical Method for Characterizing System Dynamic Frequency Constraints

Frequency stability pertains to the capacity of a power system to uphold a consistent frequency and reestablish power equilibrium following a significant imbalance triggered by an unforeseen event. The steady-state frequency deviation, the maximum rate of change of frequency (RoCoF), and the frequency nadir of a system following a disturbance are significant parameters for evaluating the frequency stability of the system. The procedure for computing each of these three indicators is detailed below.

2.1. Maximum RoCoF Constraints

Systems with higher inertia experience a slower reduction in frequency and have a lesser likelihood of low-frequency load shedding during power disturbances. Hence, it is imperative to guarantee that a system’s maximum RoCoF remains below the specified threshold [23].
R o C o F max , t = P L o s s f 0 2 ( i B i , t P i max H i + c P c C H P , max H c )
R o C o F max , t R o C o F max , lim
where R o C o F max , t is the maximum RoCoF; R o C o F max , lim is the limit value for the maximum RoCoF; P Loss is the power deficit; f 0 is the rated frequency; H is the inertia time constant for each type of unit; and P i max , P c C H P , max are the maximum generation capacity of the thermal units and CHP units, respectively. B i , t is a binary variable that controls the ON–OFF state of the unit.

2.2. Steady-State Frequency Deviation Constraints

Differential frequency regulation is the main form of frequency regulation. Consequently, the process of frequency restoration will cease once the steady-state frequency is reached. An excessively large steady-state frequency difference will have a detrimental impact on the security and stability of power system operations. Hence, it is necessary to ensure that the steady-state frequency deviation of a system does not go above the specified limit [30].
Δ f ss = P Loss i B i , t P i max k i + c P c C H P , max k c + v P v , t P V , max k v + w P w , t W , max k w
Δ f ss = Δ f ss f 0 Δ f ss Δ f ss , lim
P i , t G , L = B i , t P t max k i ( Δ f ss ) P c , t C H P , L = P c C H P , max k c P v , t P V , L = P v , t P V , max k v P w , t W , L = P w , t W , max k w
where k is the regulation power of each type of unit; Δfss is the steady-state frequency deviation; Δfss,lim is the limit value of the steady-state frequency deviation; the superscript “*” indicates the per-unit value; P i , t G , L , P c , t C H P , L , P v , t P V , L , P w , t W , L are the frequency regulation standby capacity of the thermal units, CHP units, PV plants, and wind farms, respectively; and P v , t P V , max , P w , t W , max are the maximum generation capacity of PV plants and wind farms.

2.3. Constructing Frequency Nadir Constraints Based on Polynomial Chaos Expansion

The frequency nadir constraint’s analytical expression is highly nonlinear because of the increase in the number and types of units in the system frequency response model [27]. This paper proposes an analytical method for characterizing the frequency nadir constraints of the system. The method considers multiple types of flexibility resources and is based on the idea of an open-loop analysis combined with the PCE method.
For a given power system and its operating state, the magnitude of the disturbed power is proportional to the change in system frequency [15]. In this paper, the frequency nadir constraint is translated into a comparison between the size of the maximum perturbation that the system can withstand when the system frequency reaches the nadir and the size of the actual perturbation. If the maximum perturbation that the system can withstand is greater than the actual perturbation, the system is considered to satisfy the frequency nadir constraint. Consequently, the frequency nadir constraint of the system is transformed into the following form:
P C D P d e f i c i t
where P C D is the boundary perturbation for a given system state, and P d e f i c i t is the actual perturbation to which the system is subjected.
In the steady-state operation of the generator, the mechanical torque, electromagnetic torque, and resistance torque generated by friction and wind resistance inside the generator are balanced with each other, and the rotor rotates at a constant speed. When the system is disturbed, the torque balance within the generator is disrupted, resulting in a transient process of torque change that is reflected in the system frequency, specifically the generator’s inertial response process. This process can be represented by the equivalent system rotor equation:
2 H s y s d Δ f ( t ) d t = Δ P m ( t ) Δ P e
where Δ f is the system frequency response, Δ P m is the mechanical power increment, Δ P e is the electrical power increment, and H s y s is the system inertia time constant. In the case of a boundary perturbation, Δ f = Δ f b o u n d a r y is the frequency response of the system under the boundary perturbation, and Δ P m = Δ P b o u n d a r y is the power change in the governor under the boundary perturbation, Δ P e = Δ P C D .
In the case of a boundary disturbance, the boundary response power of the system at the frequency nadir is equal to the boundary disturbance power:
Δ P b o u n d a r y ( t n a d i r ) = P C D
To facilitate the analysis, the increase in mechanical power was modeled using a constant ramp rate [18]. The mechanical power increment under an actual perturbation is shown below:
Δ P m ( t ) = P d e f i c i t t n a d i r t
In the case of actual perturbations, Δ P e = Δ P d e f i c i t . The process of frequency change can be determined from Equations (7) and (9).
Δ f ( t ) = P d e f i c i t 2 H ( 1 2 t n a d i r t 2 t )
The expression for the time when the frequency reaches its nadir t n a d i r can be derived by substituting t = t n a d i r into Equation (10).
t n a d i r = 4 H P d e f i c i t Δ f n max
If C g ( t ) is the step response of the unit transfer function G g ( s ) , then Δ f is used as the input for the governor g, and the governor response is calculated as follows [18]:
Δ P g P F R ( s ) = P d e f i c i t 2 H ( G g ( s ) t n a d i r s 2 G g ( s ) s )
Δ P g P F R ( t ) = P d e f i c i t 2 H ( C g ( t ) d t 2 t n a d i r C g ( t ) d t )
where Δ P g P F R is the governor response power of unit g.
The total system governor response is given by the following equation:
Δ P P F R ( t ) = g = 1 N G Δ P g P F R ( t )
At tnadir, it can be considered that [20]
Δ P P F R ( t n a d i r ) Δ P frontiers ( t n a d i r ) = P C D
The system’s frequency nadir constraint can be expressed as
Δ P P F R ( t n a d i r ) P d e f i c i t
The analytical characterization of the PCE [28] is used in this paper to determine the integral C s t e p , i d t of the step-response function of each governor. There is a complex and difficult-to-characterize nonlinear functional relationship C s t e p , i d t = f ( t ) between the governor step-response function and the frequency regulation response time t = [t1, …, tn]. The theory of PCE utilizes orthogonal polynomials to model an agent by mapping inputs to responses. This method can be applied to complex systems and approximated by a set of orthogonal polynomials for the expansion of C s t e p , i d t [31].
f ( t ) f P C E ( t ) = i = 1 N P a i φ i ( t )
where a i is the expansion factor, NP is the number of expansion terms, f P C E ( t ) is an agent model for C s t e p , i d t , and φ i ( t ) is the polynomial basis function.
A 1% frequency perturbation is applied to the frequency response simulation model of a system that contains multiple flexibility resources [18], such as thermal units, gas turbines, CHP units, and renewable energy units. This is performed to obtain the integral curve of the response of each frequency regulation resource. The acquired data are uniformly distributed in time by the Wiener–Askey criterion, and Legendre polynomials are used as the basis functions for the approximation [31].
P n ( x ) = 1 2 n n ! d n d x n ( x 2 1 ) n
After selecting the optimal basis function with which to construct the polynomial function, the expansion coefficients in Equation (17) must be calculated. The least squares method has been widely used for solving the undetermined coefficients of polynomial chaotic expansion terms due to its applicability. The main advantage of the least squares method is that an arbitrary number of points can be used to calculate the coefficients, as long as they are a representative sample of the random input vector XNP. A theoretical analysis of the convergence of the least squares minimization method was proven in [32]. Considering the above, this paper adopts the least squares method to solve for the coefficients of the expansion term. The unfolding coefficients a i are computed by minimizing the sum of the squares of the residuals for a set of responses t and fPCE(t) [33].
min ε ( A ) = f P C E ( t ) i = 1 N P a i φ i ( t ) 2       = ( f P C E ( t ) Φ A ) T ( f P C E ( t ) Φ A )
where A = [a1, a2, a3, …, aNP]T and Φi = φ i ( t ) , with i = {1, 2, …, NP}.
The coefficients of the polynomial chaos expansion are determined by Equation (19), using the partial derivatives of Equation (19).
C = Φ T Φ 1 Φ T f P C E ( t )
The equations for the step response and frequency regulation response of the governor can be derived using the determined basis functions and their related coefficients.

3. Evaluation Model for Renewable Energy Hosting Capacity with Frequency Security Constraints Considering Multiple Types of Flexible Resources

This section primarily develops a model for evaluating the hosting capability of renewable energy, considering frequency security restrictions and various forms of flexible resource models. The purpose of this is to efficiently accommodate renewable energy and guarantee the security and consistency of the system frequency.

3.1. Objective Function

The objective function is to minimize the amount of renewable energy curtailment in the system, as follows:
min t = 1 T ( w = 1 N W P w , t W , c u r + v = 1 N P V P v , t P V , c u r )
where P w , t W , c u r , P v , t P V , c u r represent the amount of renewable energy curtailed by wind farms w and photovoltaic power stations v at time t.

3.2. Constraints

3.2.1. Flexible Resource Operation Constraints

This study examines many types of flexible resources, such as DR, CHP, energy storage, and P2G. The operational limitations of each piece of equipment are as follows.
  • Constraints of DR
P d , t D R = P d , t + Δ q d , t
where P d , t , Δ q d , t are the node load at time t and DR, and P d , t D R is the equivalent load.
2.
Constraints of CHP and thermal storage systems
P c c h p , min P c , t c h p P c c h p , max
r c c h p , d w P c , t c h p P c , t 1 c h p r c c h p , u p
P c , t c h p = λ chp Q c , t c h p
Q c chp , min Q c , t chp Q c chp , max
E r , t c r E r , t 1 c r η r , c h Q r , t c h + η r , d i s Q r , t d i s = 0
0 Q r , t c h Q r c h , max 0 Q r , t d i s Q r d i s , max
E c r , min E r , t c r E c r , max
i N c h p Q i , t chp + r N c r Q r , t d i s r N c r Q r , t ch = Q t L
where P c , t c h p is the electrical power of the CHP unit; P c c h p , min and P c c h p , max are the lower and upper limits of the active power output of the CHP unit, respectively; r c c h p , d w and r c c h p , u p are the down- and up-ramp capability limits of the CHP unit, respectively; λ chp is the thermoelectric ratio; Q c , t c h p is the thermal power; E r , t c r and E r , t 1 c r represent the thermal storage capacity of the thermal storage system at time t and time t − 1, respectively; η r , c h and η r , d i s are the heat storage coefficient and the heat release coefficient, respectively; the lower and upper limits of the capacity of the r-th thermal storage system are E r c r , min and E r c r , max , respectively; the charge/discharge power of the r-th thermal storage device at time t are represented by Q r , t ch , Q r , t d i s ; and the total heat load power of the system at time t is Q t L .
3.
Constraints of energy storage systems
E e , t E e , t 1 η c h P e , t c h + 1 η d i s P e , t d i s = 0
0 P e , t c h P e c h , max 0 P e , t d i s P e d i s , max
E e , t E max E e , t A min E max
where P e , t c h , P e , t d i s are the charging and discharging power of the energy storage at time t; the maximum charging and discharging power for energy storage are represented by P e c h , max , P e d i s , max ; E e , t , E e , t 1 are the energy levels stored at time t and time t − 1, respectively; η c h and η d i s are, respectively, the charging and discharging efficiency; A min is the minimum percentage of energy stored; and E e max is the maximum energy storage capacity.
4.
Constraints of P2G
η P 2 G P p g , t P 2 G G p g , t P 2 G
G t min G p g , t P 2 G G t max
where G p g , t P 2 G is the gas power generated by P2G; P p g , t P 2 G is the electrical power consumed by P2G; and η P 2 G is the conversion efficiency of P2G.
5.
Constraints of thermal power units
P i min B i , t P i , t P i max B i , t r i d o w n , max P i , t P i , t 1 r i u p , max
B i , t B i , t 1 B i , τ , τ [ t , min { t + T i U 1 , T } ] B i , t 1 B i , t 1 B i , τ , τ [ t , min { t + T i D 1 , T } ]
where P i , t is the output of unit i at time t; the uphill/downhill climbing rate are r i d o w n , max and r i d o w n , min ; and the minimum start and stop times for thermal unit i are T i U and T i D , respectively.

3.2.2. Other Operation Constraints

6.
Renewable energy output constraints
0 P v , t P V P v , t P V , max
0 P w , t W P w , t W , max
where P v , t P V is the output of the v-th photovoltaic station at time t and P w , t W is the output of the w-th wind farm at time t.
7.
Branch flow constraints
P l min i = 1 N G G l , i P i , t + w = 1 N W G l , w P w , t W + v = 1 N P V G l , v P v , t P V + p 2 g = 1 N P 2 G G l , e P p 2 g , t P 2 G d = 1 N D G l , d P d , t D R + e = 1 N E S S G l , e ( P e , t c h P e , t d i s ) P l max
where G l , i ,   G l , g ,   G l , w ,   G l , v ,   G l , e ,   G l , d are the power transmission factors of the transmission line for each unit; P l max is the maximum transmission power of the line; N g , N W , N P V , N P 2 G , N D , N E S S are the thermal power units, wind farms, photovoltaic power stations, P2G units, and the quantity of demand response and energy storage.
8.
Total power balance constraint
i = 1 N G P i , t + w = 1 N W P w , t W + v = 1 N P V P v , t P V + e = 1 N E S S ( P e , t d i s P e , t c h ) + p 2 g = 1 N P 2 G P p 2 g , t P 2 G = d = 1 N D P d , t D R
Expanding on the frequency security constraints mentioned in Section 1, and incorporating the flexible resource operation constraints and power grid flow constraints, a model is developed to evaluate the hosting capacity of renewable energy while considering frequency security constraints. The model is constructed as follows:
min t = 1 T ( w = 1 N W P w , t W , c u r + v = 1 N P V P v , t P V , c u r ) s . t .       ( 1 ) ( 5 ) ,   ( 17 )   : frequency   security   constraints                   ( 21 ) ( 36 ) : flexible   resource   operation   constraints ( 37 ) ( 40 ) : other   constraints
The hosting capacity of renewable energy is evaluated by incrementally increasing the penetration rate of renewable energy in the network. This process enables the calculation of the maximum renewable energy penetration rate satisfying the frequency security constraints and the various flexible resource operation limitations, without the curtailment of renewable energy. The penetration rate of renewable energy is defined as the ratio of the total renewable energy output over a 24 h period to the total system load.

4. The Feasible Region of the Renewable Energy Hosting Capacity

Utilizing the developed renewable energy hosting capacity evaluation model, we aim to further examine the coupling characteristics of renewable energy across different regions and to precisely quantify and visualize the hosting capacity of renewable energy. This section characterizes the feasible region of the renewable energy hosting capacity based on the progressive vertex enumeration method, according to the distribution of renewable energy units in a grid. The renewable energy hosting capacity of each region in a power grid is measured by the volume of feasible regions, which also shows the renewable energy hosting capacity of a power grid from a macro perspective.

4.1. Definition of Feasible Region of Renewable Energy Hosting Capacity

The feasible region of the renewable energy hosting capacity of a grid system, which has a significant amount of renewable energy integration, consists of different combinations of wind power and photovoltaic output power. These combinations must match the nonlinear operation limitations of the power grid in each region [34,35]. The feasible zone can be represented mathematically as:
Ω = { P R N : Eq ( 1 ) ( 5 ) , ( 17 ) ( 21 ) ( 36 ) , ( 37 ) ( 40 ) }
where P R = [ P i R ] indicates the sum of the renewable energy unit output of each region, i.e., the renewable energy hosting capacity of the grid.
The determination of the attainable scope of the renewable energy hosting capacity might be regarded as a projection dilemma. The operational constraints of the power grid are projected onto the power output vectors of the renewable energy units in each region. For a given set of power inputs within the feasible region, there exists at least one feasible operating state that does not violate the safety constraints of the power grid. According to the quantified feasible region of the renewable energy hosting capacity, the power grid can achieve safer and more flexible access of renewable energy.

4.2. The Progressive Vertex Enumeration Method to Determine the Feasible Region of the Renewable Energy Hosting Capacity

The feasible region of the renewable energy hosting capacity can be characterized as a polytope. By solving a set of nonlinear programming problems to find the boundary vertices, the connecting vertices can characterize the feasible region. The basic idea of the progressive vertex enumeration method is to search for new boundary points by translating each hyperplane of the current approximation polytope outward along its normal direction. Polytopes of higher accuracy are constructed from the newly obtained vertices and previous vertices, and iteratively extended until a preset accuracy is satisfied. The specific steps of this algorithm are as follows.
  • Constructing an initial polytope
The following nonlinear programming problem is used to search for vertices on the i-th axis of the feasible region plane.
max   A P i R s . t .   ( 1 ) ( 5 ) , ( 17 ) ( 21 ) ( 36 ) ( 37 ) ( 40 )
Firstly, let A = 1 and A = −1, respectively, solving the nonlinear programming problem (44) to obtain the optimal solution P i max , P i min . The initial polytope is composed of a set of vertices J ( 0 ) = { P i max , P i min ( i ) } . The j-th boundary of a polytope can be characterized as A j ( 0 ) P R = b j ( 0 ) through two vertices. Therefore, the initial polytope can be represented as Ω ( 0 ) { A ( 0 ) P R b ( 0 ) } . Ω ( 0 ) denotes the initial polytope. A(0) and b(0) are parameters of the initial polytope.
2.
Updating the polytope iteratively
For the k-th iteration, the j-th boundary of the polytope needs to be moved in the direction of the normal to find more vertices of the polytope boundary. The solution P i , k max for the nonlinear programming problem (44) is the new vertex found at the j-th boundary in the k-th iteration. P i , k max and the previously found boundary vertices form a new set of points J ( k + 1 ) = { P i , k max ( i ) } J ( k ) . The new polytope Ω ( k + 1 ) is composed of the updated point sets J t ( k + 1 ) . Through each iteration, more boundary vertices can be searched for, making the resulting polyhedron more precise.
3.
Iterative convergence criterion
The difference between the new polytope and the previous polytope can be reflected through changes in volume. When the volume difference between adjacent polytopes is less than the preset threshold, the iterative calculation can be terminated. Otherwise, continue to perform step 2 to find new vertices.
δ V = V ( Ψ ( k + 1 ) ) V ( Ψ ( k ) ) V ( Ψ ( k ) ) ε
where ε is the threshold at which the iteration calculation terminates and V ( Ψ ( k ) ) represents the volume of the polyhedron at the k-th iteration. Figure 1 shows the flowchart for the feasible region calculation process.

5. Case Study

This section validates the efficacy of the proposed feasible space evaluation method for the renewable energy hosting capacity with frequency security constraints. The validation was conducted through a modified IEEE 39 case and an actual power grid. The simulation experiment was executed on a 64-bit computer equipped with an AMD Ryzen 7 5800H and Radeon Graphics operating at 3.20 GHz and 32 GB RAM. The Python 3.9 platform was utilized for the solution, invoking the GUROBI 10.1 solver.
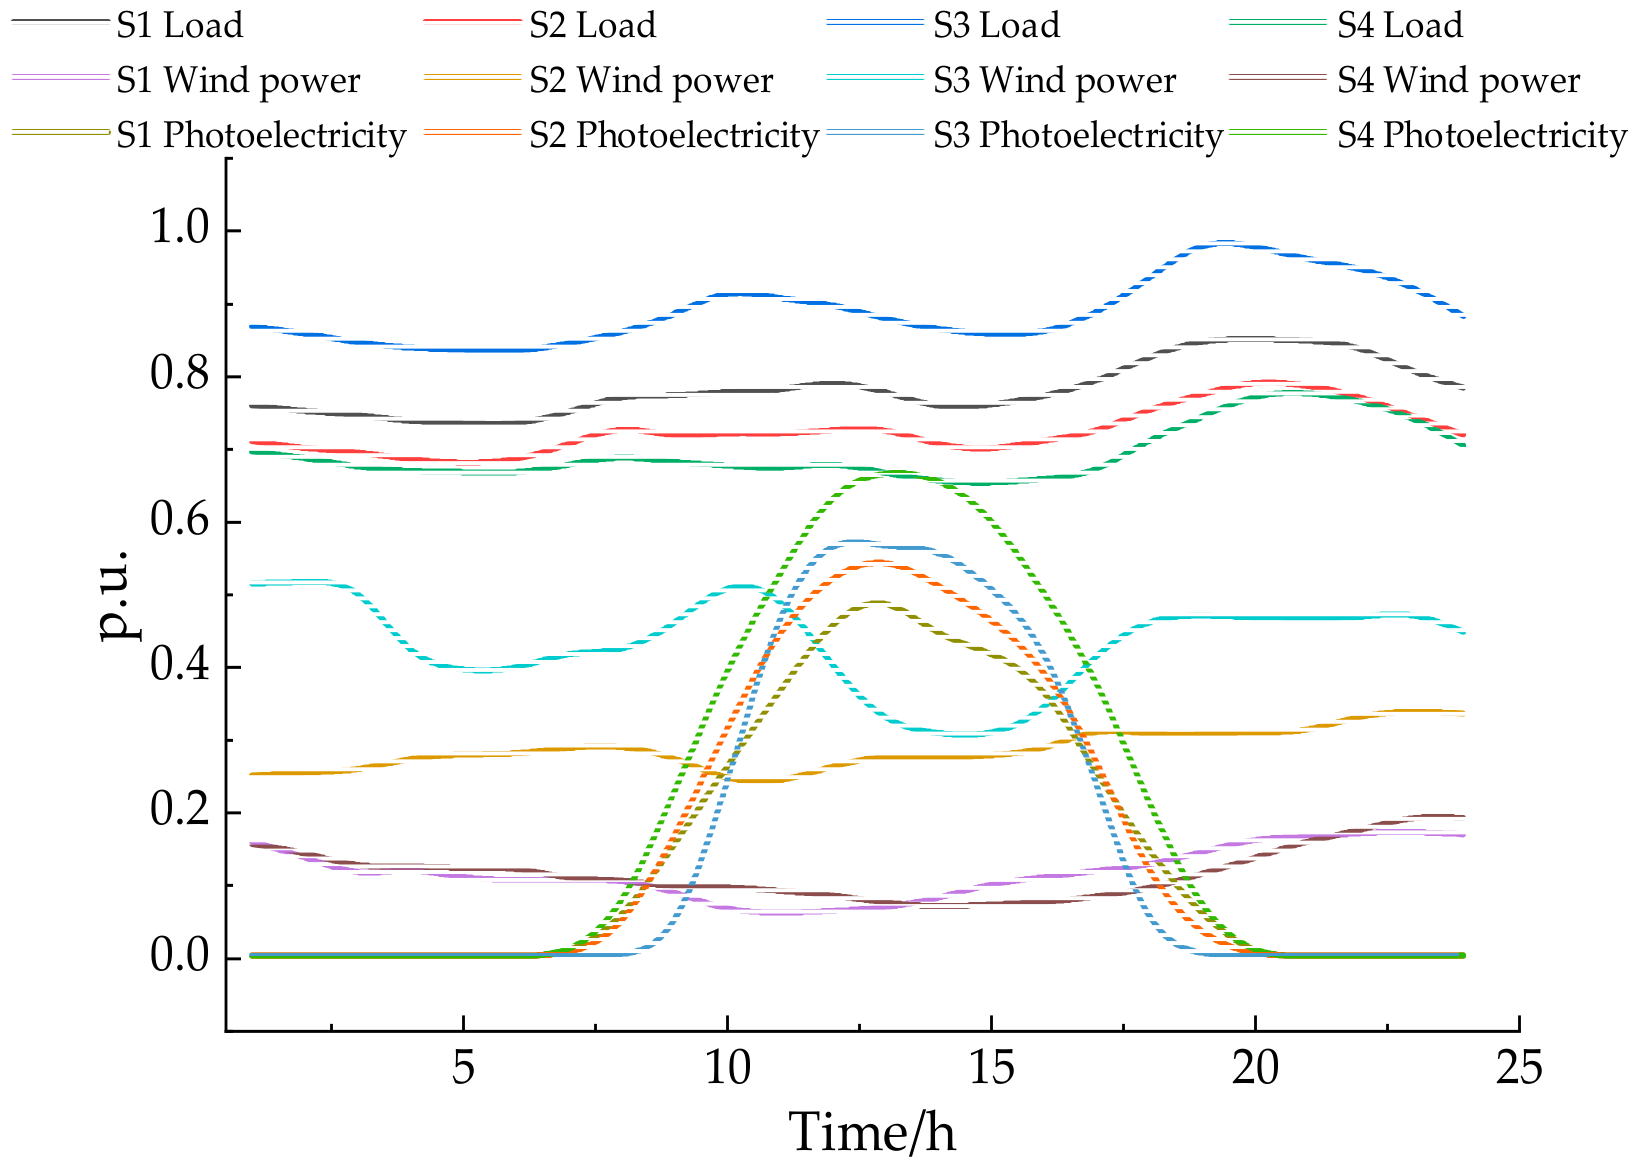
The network topology is depicted in Figure 2 where the number is the bus number. The actual power grid consists of 44 buses, 47 lines, 22 conventional units, 41 renewable energy stations, 13 energy storage facilities, and 14 CHP units. The load and wind power output curves were generated by a process of clustering, using actual data from a specific site in 2022. The four scenarios, namely S1, S2, S3, and S4, are depicted in Figure 3.
This study investigates the potential of a system to host renewable energy across four different scenarios.
  • M 1: The flexibility resources and frequency security constraints are taken into account.
  • M 2: Only frequency security constraints are considered [17].
  • M 3: Only flexible resources are considered [27].
  • M 4: Neither flexibility resources nor frequency security constraints are considered [13].
Table 1 presents an analysis of the highest possible rate at which renewable energy output can be integrated under the different scenarios, taking into account both frequency security restrictions and the absence of restricting renewable energy.
The analysis shows that the penetration rate of renewable energy is closely related to the frequency stability and security constraints. When the frequency stability and security constraints are considered, the average maximum penetration rate, without curtailing energy, is 11% lower than when these constraints are not considered. Specifically, S3, which has the highest load and renewable energy output, experiences the greatest decrease of 15%. Conversely, S4, with the minimum load and renewable energy output, sees the smallest decrease of 9%. This analysis reveals that the integration of renewable energy into the grid necessitates adherence to the constraints pertaining to system frequency safety. The failure to meet these constraints could result in frequency constraints violation, thereby preventing the access of renewable energy by the grid.
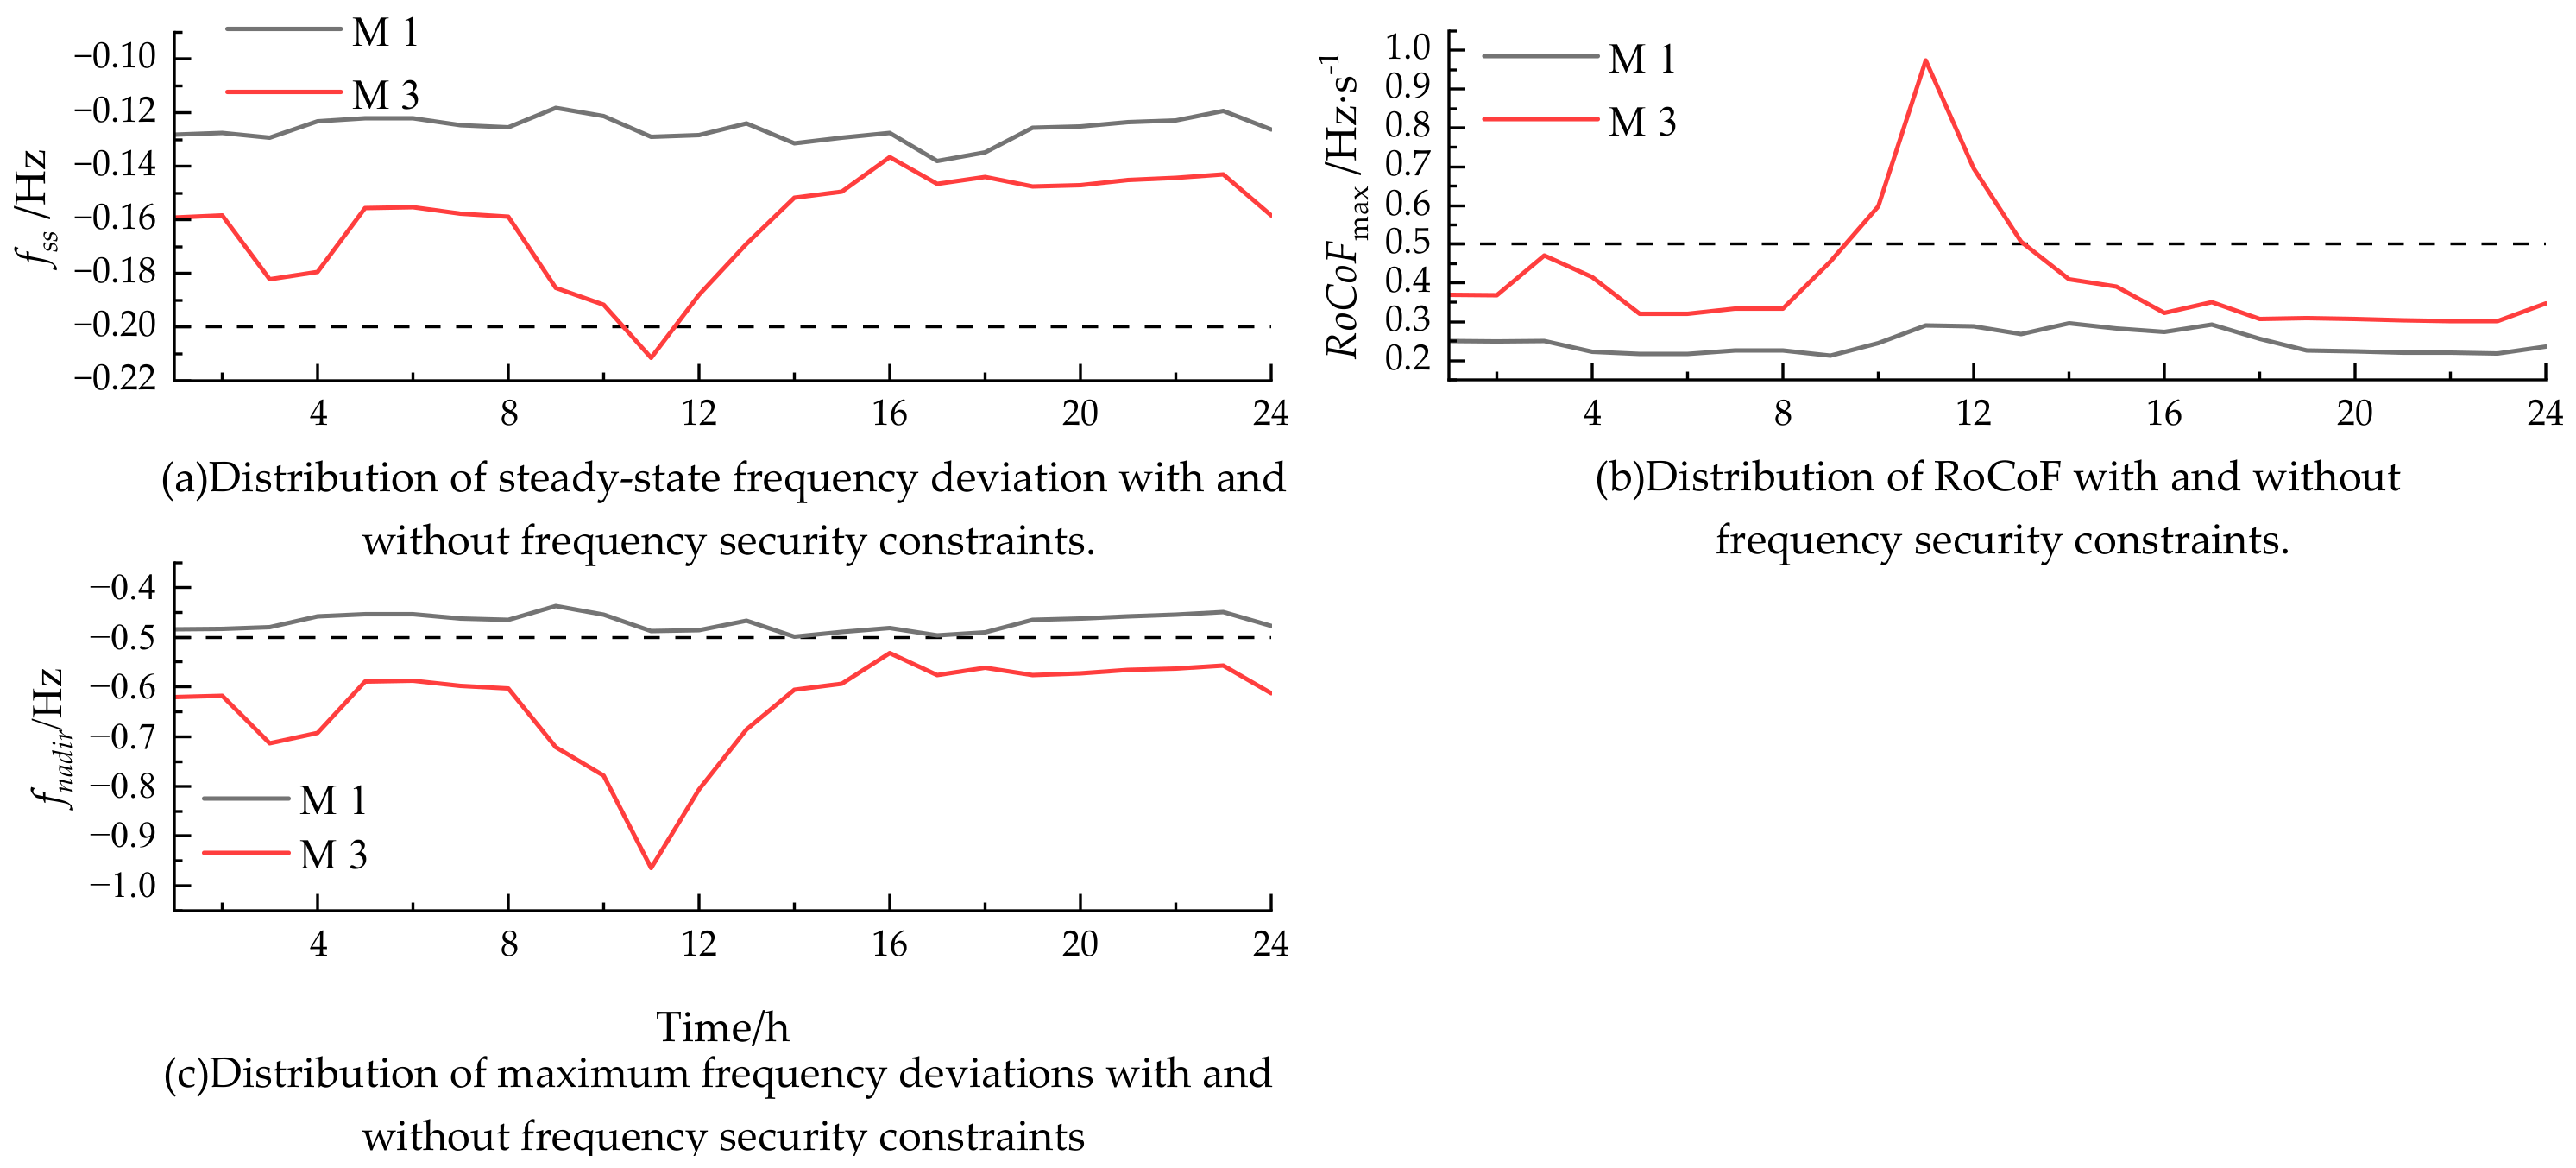
In addition, a comparison analysis was performed on the frequency response indicators under M 1 and M 3 to verify the effectiveness of the suggested method for solving the frequency nadir point constraint using PCE.
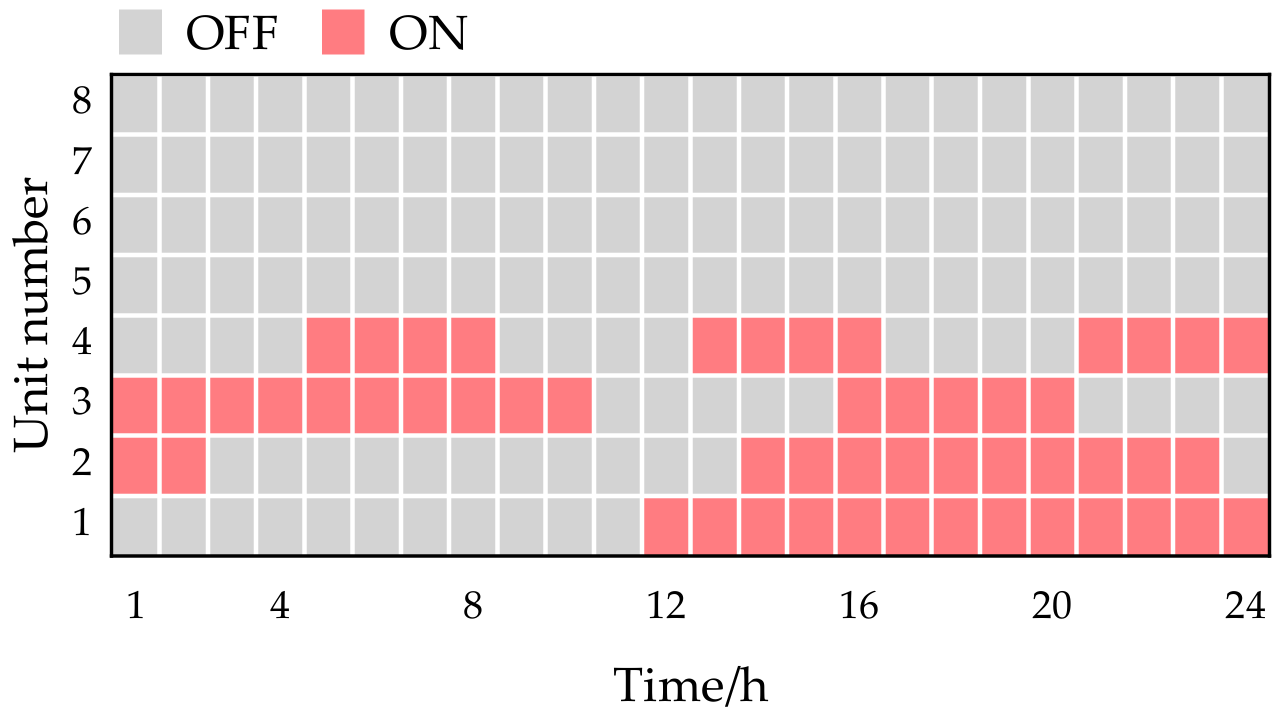
Figure 4a–c demonstrate that when frequency security constraints are not considered, the steady-state frequency and RoCoFmax can exceed their limits during periods of high renewable energy penetration. This is due to the significant increase in PV power generation during the midday hours, which causes a system perturbation. Additionally, fewer thermal generating units are switched on, resulting in insufficient resources for total inertia and frequency regulation. This shows that neglecting the frequency security constraints results in the system failing to always meet the maximum frequency deviations constraint. From Figure 4, it is evident that the maximum frequency deviations indicator has more transgressing time segments than the other two indicators. This highlights the significance of the maximum frequency deviations indicator for ensuring the frequency safety of the system. This suggests that the system lacks a sufficient frequency regulation capability to satisfy the constraint. Figure 5 and Figure 6 demonstrate that taking frequency security constraints into account increases the total number of thermal units turned on during the transgressing time period to meet the constraints.
A more extensive examination of the correlation between frequency security constraint indicators and the rate of renewable energy penetration was carried out by comparing the fluctuations in the RoCoFmax and steady-state frequency deviations at different levels of renewable energy penetration in S2, as illustrated in Figure 7. The analysis suggests a correlation between the RoCoFmax, steady-state frequency deviations, and the rate at which renewable energy is being integrated into the system. More precisely, a RoCoFmax of 0.179 is equivalent to a renewable energy penetration rate of 11%. As the rate of penetration increases, the RoCoFmax gradually increases, whereas the steady-state frequency deviations show a decreasing trend. The difficulty in maintaining frequency stability arises from the increase in renewable energy sources and disturbances. Based on the previous analysis, it is clear that frequency security limits have a major impact on the hosting capacity of renewable energy.
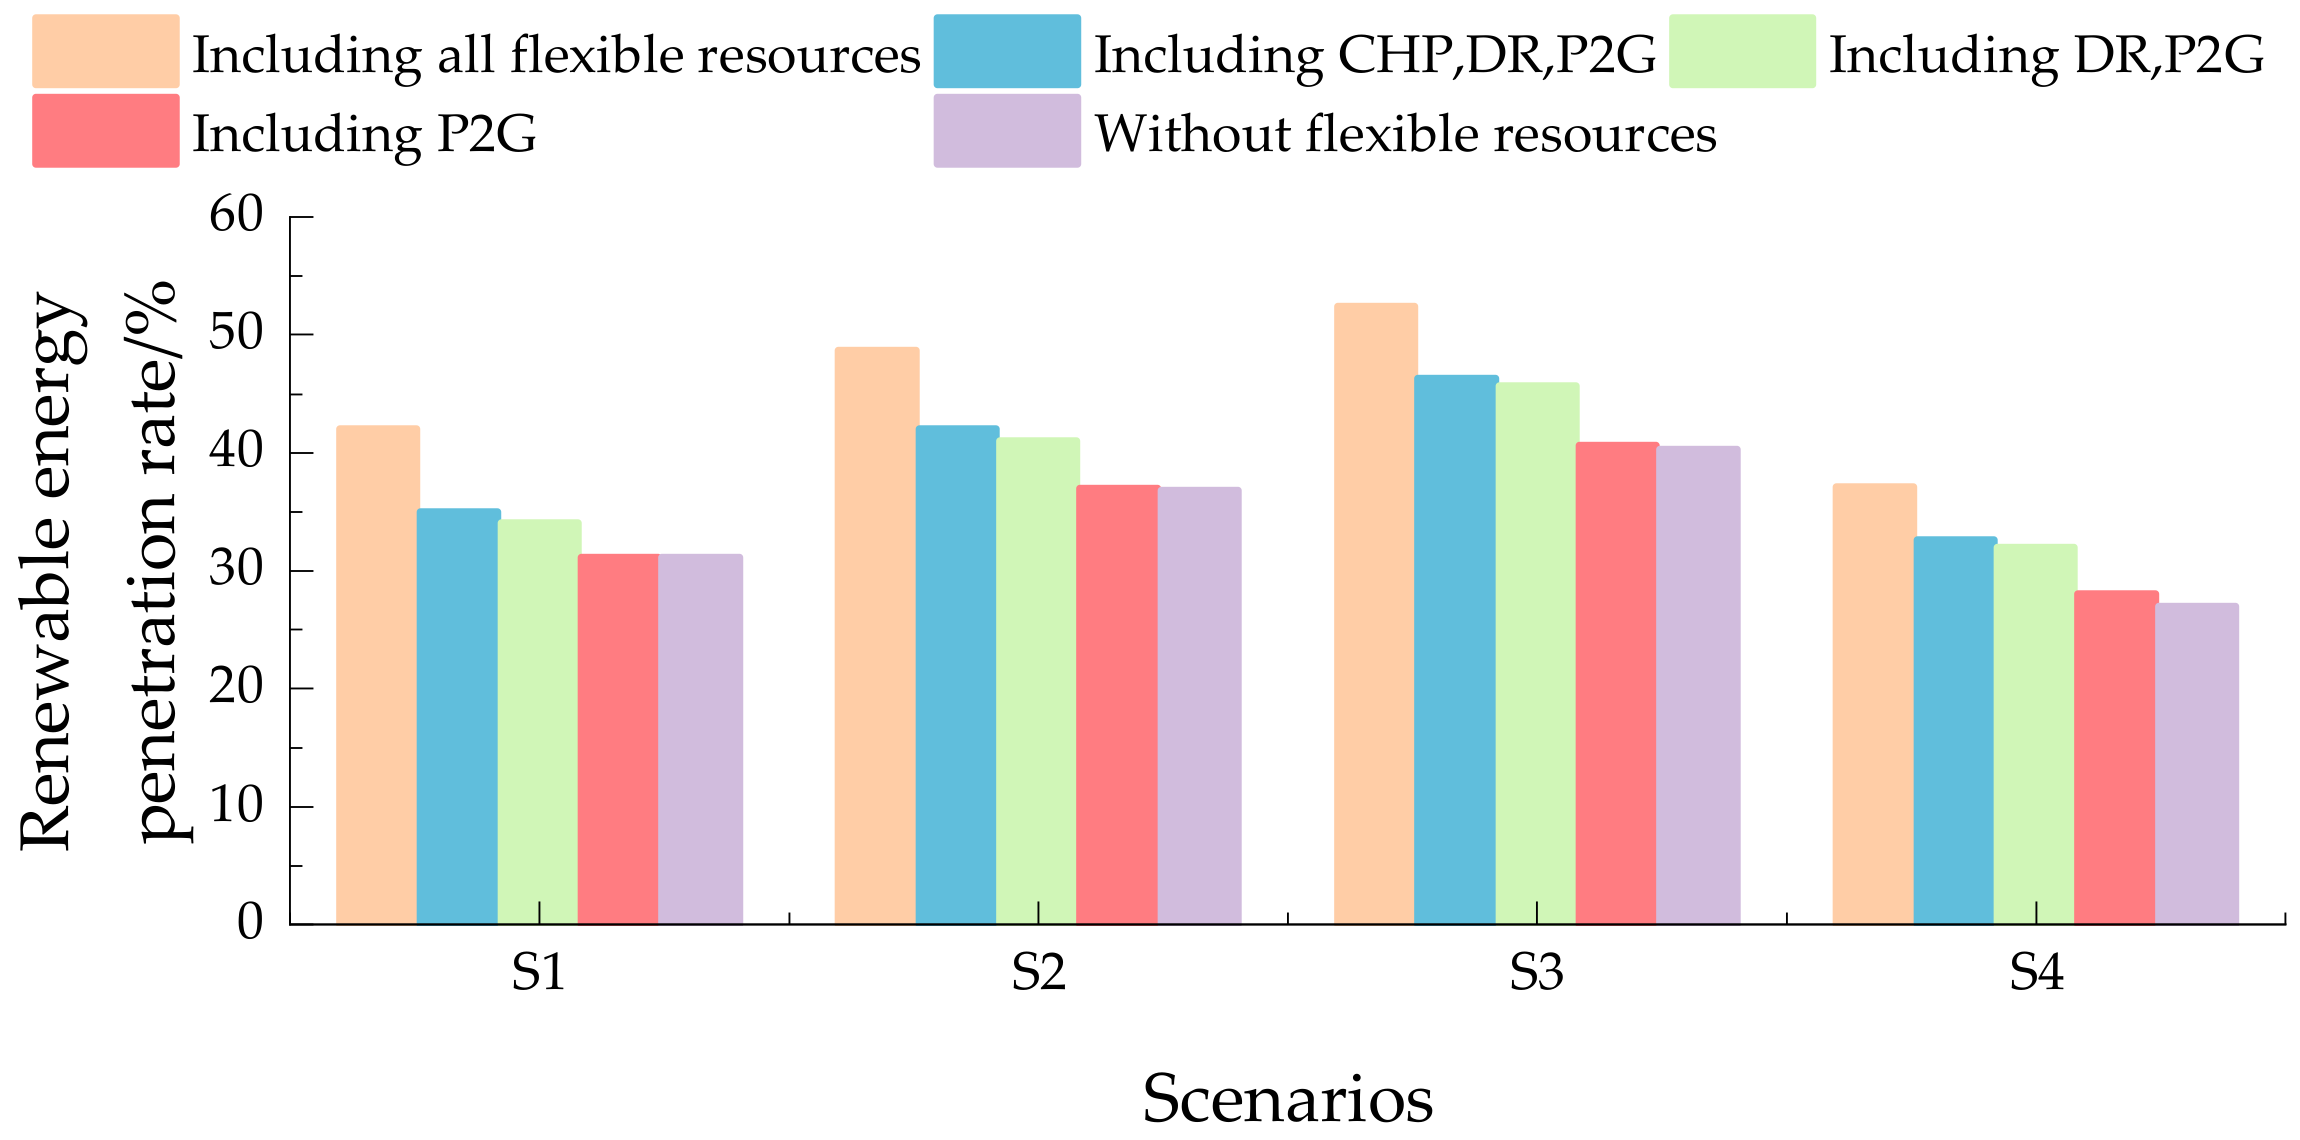
Figure 8 demonstrates how various flexible resources impact the ability to accommodate renewable energy in M 3. Energy storage devices can enhance the renewable energy penetration rates in the different scenarios by 7%, 6.7%, 6.1%, and 4.5%, respectively. DR can enhance the adoption of renewable energy by increasing the penetration rate by 2.9%, 4%, 5.1%, and 4%, respectively. CHP units have a limited impact on the hosting capacity of renewable energy, due to their inability to meet specific heat requirements.
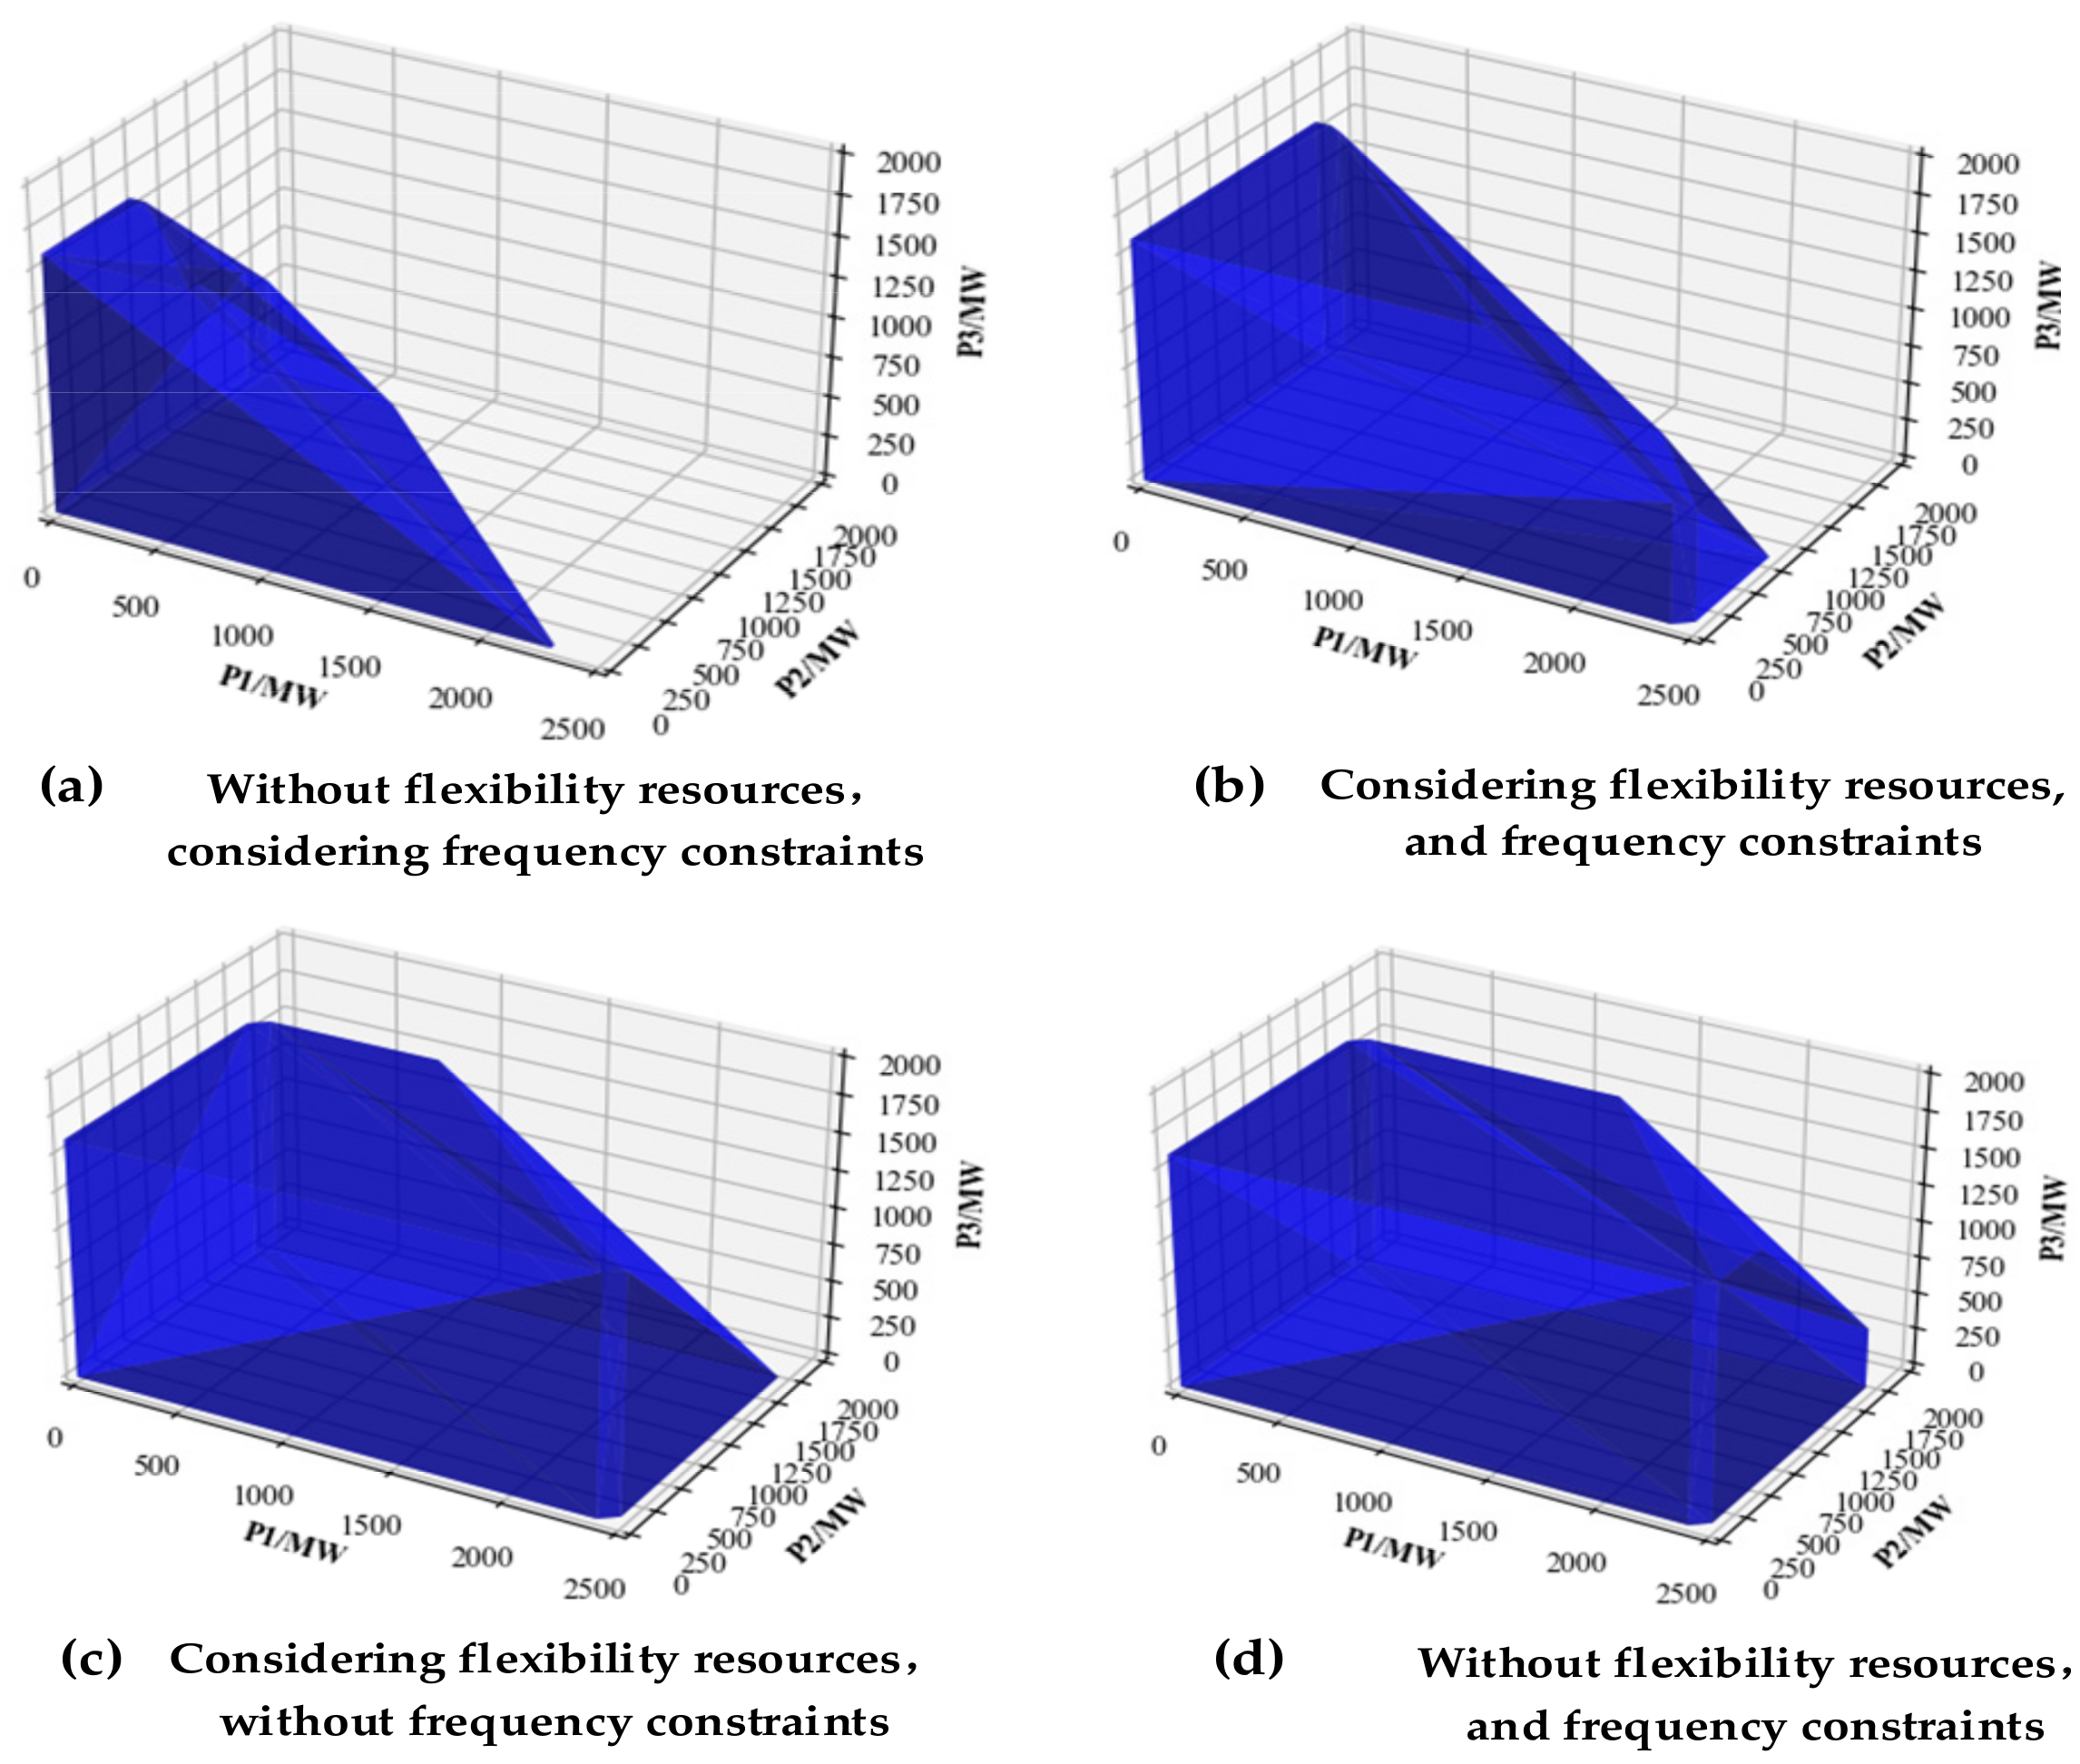
Figure 9 illustrates an irregular polytope representing the feasible region of the renewable energy hosting capacity. Unlike the evaluation of the highest possible capacity for hosting renewable energy, which only determines the maximum limit for the total amount of renewable energy, the feasible region of the renewable energy hosting capacity not only precisely measures and visually represents a power grid’s ability to accommodate renewable energy, but also demonstrates the interconnectedness of renewable energy across the different regions of a power grid.
As shown in Figure 9a,b, considering the synergistic effect of DR, energy storage, and other flexible resources to stabilize load and renewable energy fluctuations, the feasible region volume of the renewable energy carrying capacity of the power grid is increased by 109%, which improves the ability of the system to absorb renewable energy. Compared with (b) and (d), the volume of the feasible region of the renewable energy hosting capacity of the power grid is reduced by 35%. After adding frequency security constraints to the renewable energy hosting capacity evaluation model, it is necessary to meet the total inertia demand of the system, so that the number of thermal power units is increased, and the hosting capacity space of renewable energy is compressed.
To validate the efficacy of the proposed method on real-world systems, it is tested using an actual power grid. M1 and M3 are used for comparing the impact of frequency security constraints on the renewable penetration rate. Table 2 illustrates the penetration rate of renewable energy in the actual power grid, both with and without frequency safety constraints. Figure 10 depicts the feasible region of the renewable energy hosting capacity of the actual power grid.
Table 2 shows that the penetration rate of renewable energy in the actual power grid is closely related to the frequency stability and security constraints. When the frequency stability and security constraints are considered, the average maximum penetration rate, without curtailing energy, is 7.17% lower than when these constraints are not considered. Figure 10 further visualizes the limits of the renewable energy carrying capacity between the different regions, highlighting that the frequency security constraints considerably influence the maximum output boundary of renewable energy.
This analysis reveals that the integration of renewable energy into a grid necessitates adherence to the constraints pertaining to system frequency safety. The failure to meet these constraints could result in frequency constraints violation, thereby preventing the access to renewable energy by a grid.

6. Conclusions

This work combines frequency security restrictions and numerous flexibility resources to create a new evaluation model. This model is specifically intended to assess a power grid’s potential to accommodate renewable energy sources while adhering to the limitations of frequency security and stability. The following are the conclusions:
  • Utilizing a PCE fitting strategy significantly boosts the solving efficiency of the models incorporating a nadir point frequency constraint. A comparative analysis of four case studies reveals that our model outperforms traditional methods by providing a more precise evaluation of the renewable energy hosting capacity, considering both frequency security constraints and flexible resource models. The incorporation of these factors allows for a comprehensive evaluation that existing methods often overlook, leading to a more realistic estimation of grid capabilities.
  • As renewable energy penetration grows, so does the risk of the system frequency exceeding safe deviation limits. Our model underscores the critical need to account for frequency security constraints when evaluating the renewable energy hosting capacity. By addressing these constraints, our approach prevents potential issues, such as the overestimation of the hosting capacity observed in methodologies that neglect frequency safety considerations. This clear identification of the frequency constraints ensures a thorough and safe evaluation.
  • The progressive vertex enumeration approach properly counts and visualizes the renewable energy hosting capacity of a power grid, reflecting the coupling features of renewable energy. The interdependence of the output from renewable energy units throughout each period is explained, and the capacity of the distribution network to host renewable energy is graphically monitored.
While our work has made notable contributions, there are still several areas for potential improvement. (a) Uncertainty factors have not yet been taken into account in the current frequency security constraints. (b) The progressive vertex enumeration method, as referenced in [36], aims to find vertices by optimizing in all directions within the feasible region. However, as the dimensions increase, the number of search directions grows exponentially, which complicates the characterization of high-dimensional feasible regions. Future work will focus on improving the renewable energy hosting capacity evaluation model, supplementing the uncertainty of line and equipment failures to demonstrate their effects on the renewable energy consumption space [37]. In addition, the umbrella constraint identification algorithm will also be investigated in future research, because the efficiency of constructing a feasible region can be improved by eliminating system redundancy constraints through this algorithm [38].

Author Contributions

Conceptualization, Z.Z.; methodology, Z.Z. and Y.W.; software, Q.R.; validation, H.D.; formal analysis, H.Z. and H.L.; investigation, Q.R., Y.W. and H.L.; resources, Q.R. and H.L.; data curation, H.Z. and H.D.; writing—original draft preparation, Z.Z. and H.Z.; writing—review and editing, Z.Z., Q.R., Y.W., J.Y., H.L. and H.D.; visualization, Y.W. and H.D.; project administration, J.Y.; funding acquisition, J.Y. All authors have read and agreed to the published version of the manuscript.

Funding

This research was supported by the science and technology project of State Grid Shanxi Electric Power Company, “Research on Key Technologies of New Grid Planning Considering the Cost Transmission Chain of New Energy absorption (52053323000Z)”.

Conflicts of Interest

Authors declare that the research was conducted in the absence of any commercial or financial relationships that could be construed as a potential conflict of interest.

References

  1. Cevallos-Sierra, J.; Ramos-Martin, J. Spatial assessment of the potential of renewable energy: The case of Ecuador. Renew. Sustain. Energy Rev. 2018, 81, 1154–1165. [Google Scholar] [CrossRef]
  2. Fan, J.L.; Wang, J.X.; Hu, J.W.; Wang, Y.; Zhang, X. Optimization of China’s provincial renewable energy installation plan for the 13th five-year plan based on renewable portfolio standards. Appl. Energy 2019, 254, 113757. [Google Scholar] [CrossRef]
  3. Zargar, R.H.M.; Moghaddam, M.H.Y. Development of a Markov-Chain-Based Solar Generation Model for Smart Microgrid Energy Management System. IEEE Trans. Sustain. Energy 2020, 11, 736–745. [Google Scholar] [CrossRef]
  4. Dubey, A.; Santoso, S. On Estimation and Sensitivity Analysis of Distribution Circuit’s Photovoltaic Hosting Capacity. IEEE Trans. Power Syst. 2017, 32, 2779–2789. [Google Scholar] [CrossRef]
  5. Zhao, Z.; Xue, Y.; Liu, Z.; Zheng, W.; Duan, S.; Yu, L. A novel estimation method for maximum PV hosting capacity in radial distribution networks using bus voltage and electrical distance. Electr. Power Syst. Res. 2023, 224, 109791. [Google Scholar] [CrossRef]
  6. Dong, X.; Kang, C.; Ding, Y.; Wang, C. Estimating the wind power integration threshold considering electro-thermal coupling of overhead transmission lines. IEEE Trans. Power Syst. 2019, 34, 3349–3358. [Google Scholar] [CrossRef]
  7. Ding, T.; Kou, Y.; Yang, Y.; Zhang, Y.; Yan, H.; Blaabjerg, F. Evaluating maximum photovoltaic integration in district distribution systems considering optimal inverter dispatch and cloud shading conditions. IET Renew. Power Gener 2016, 11, 165–172. [Google Scholar] [CrossRef]
  8. Ding, K.; Chen, B.; Qin, J. Evaluation Method of Consumption Ability of New Large Scale Energy Clusters Connected to Weak Grids. Electr. Power Constr. 2023, 44, 86–94. [Google Scholar]
  9. Zhu, J.; Shi, K.; Li, Q.; Yu, R.Y.; Xia, J.R.; Yuan, Y. Time Series Production Simulation and Renewable Energy Accommodation Capacity Evaluation Considering Transmission Network Power Flow Constraints. Grid Technol. 2022, 46, 1947–1955. [Google Scholar]
  10. Yifan, L.; Xinyan, F.; Bo, W.; Zhenhua, C. Risk Assessment of New Energy Consumption Capacity Considering Node Vulnerability. Grid Technol. 2020, 44, 4479–4486. [Google Scholar]
  11. Wu, H.; Yuan, Y.; Zhu, J.; Qian, K.; Xu, Y. Potential Assessment of Spatial Correlation to Improve Maximum Distributed PV Hosting Capacity of Distribution Networks. J. Mod. Power Syst. Clean Energy 2021, 9, 800–810. [Google Scholar] [CrossRef]
  12. Wang, S.; Chen, S.; Ge, L.; Wu, L. Distributed Generation Hosting Capacity Evaluation for Distribution Systems Considering the Robust Optimal Operation of OLTC and SVC. IEEE Trans. Sustain. Energy 2016, 7, 1111–1123. [Google Scholar] [CrossRef]
  13. Ayres, H.; Freitas, W.; De Almeida, M.; Da Silva, L. Method for determining the maximum allowable penetration level of distributed generation without steady-state voltage violations. IET Gener. Transm. Distrib. 2010, 4, 495–508. [Google Scholar] [CrossRef]
  14. Meibom, P.; Barth, R.; Hasche, B.; Brand, H.; Weber, C.; O’malley, M. Stochastic optimization model to study the operational impacts of high wind penetrations in Ireland. IEEE Trans. Power Syst. 2011, 26, 1367–1379. [Google Scholar] [CrossRef]
  15. Cardozo, C.; Capely, L.; Dessante, P. Frequency constrained unit commitment. Energy Syst. 2017, 8, 31–56. [Google Scholar] [CrossRef]
  16. Pérez-Illanes, F.; Álvarez-Miranda, E.; Rahmann, C.; Campos-Valdés, C. Robust unit commitment including frequency stability constraints. Energies 2016, 9, 957. [Google Scholar] [CrossRef]
  17. Abiari, H.; Daemi, T.; Saeid, S.A. Frequency-constrained unit commitment under uncertain PFR of energy storage systems. J. Energy Storage 2023, 73, 108848. [Google Scholar] [CrossRef]
  18. Liu, L.; Li, W.; Ba, Y.; Shen, J.; Jin, C.; Wen, K. An analytical model for frequency nadir prediction following a major disturbance. IEEE Trans. Power Syst. 2020, 35, 2527–2536. [Google Scholar] [CrossRef]
  19. Egido, I.; Fernandez-Bernal, F.; Centeno, P.; Rouco, L. Maximum frequency deviation calculation in small, isolated power systems. IEEE Trans. Power Syst. 2009, 24, 1731–1738. [Google Scholar] [CrossRef]
  20. Zhang, Y.; Guo, Q.; Zhou, Y.; Sun, H. Frequency-constrained unit commitment for power systems with high renewable energy penetration. Int. J. Electr. Power Energy Syst. 2023, 153, 109274. [Google Scholar] [CrossRef]
  21. Paturet, M.; Markovic, U.; Delikaraoglou, S.; Vrettos, E.; Aristidou, P.; Hug, G. Stochastic unit commitment in low-inertia grids. IEEE Trans. Power Syst. 2020, 35, 3448–3458. [Google Scholar] [CrossRef]
  22. Ahmadi, H.; Ghasemi, H. Security-constrained unit commitment with linearized system frequency limit constraints. IEEE Trans. Power Syst. 2014, 29, 1536–1545. [Google Scholar] [CrossRef]
  23. Zhang, Z.; Zhou, M.; Wu, Z.; Liu, S.; Guo, Z.; Li, G. A frequency security constrained scheduling approach considering wind farm providing frequency support and reserve. IEEE Trans. Sustain. Energy 2022, 13, 1086–1100. [Google Scholar] [CrossRef]
  24. Nguyen, N.; Bera, A.; Mitra, J. Energy storage to improve reliability of wind integrated systems under frequency security constraint. IEEE Trans. Ind. Appl. 2018, 54, 4039–4047. [Google Scholar] [CrossRef]
  25. Lu, X.; Li, K.; Xu, H.; Wang, F.; Zhou, Z.; Zhang, Y. Fundamentals and business model for resource aggregator of demand response in electricity markets. Energy 2020, 204, 117885. [Google Scholar] [CrossRef]
  26. Tang, W.; Li, Z.; Yu, Z.; Qian, T.; Lian, X.; Chen, X. Cost-optimal operation and recovery method for power distribution systems considering multiple flexible resources and logistics restrictions. Sustain. Energy Technol. Assess. 2022, 49, 101761. [Google Scholar] [CrossRef]
  27. Yu, S.; Zhou, S.; Qin, J. Layout optimization of China’s power transmission lines for renewable power integration considering flexible resources and grid stability. Int. J. Electr. Power Energy Syst. 2022, 135, 107507. [Google Scholar] [CrossRef]
  28. Hungerford, Z.; Bruce, A.; MacGill, I. The value of flexible load in power systems with high renewable energy penetration. Energy 2019, 188, 115960. [Google Scholar] [CrossRef]
  29. Rahimi, M.; Ardakani, F.J.; Olatujoye, O. Improving flexible optimal scheduling of virtual power plants considering dynamic line rating and flexible supply and demand. Int. J. Electr. Power Energy Syst. 2023, 150, 109099. [Google Scholar] [CrossRef]
  30. Wang, T.; Miao, S.; Yao, F.; Liu, Z.; Zhang, S. Day-ahead and Intra-day Joint Dispatch Strategy of High Proportion Wind Power System Considering Dynamic Frequency Response Constraints. Proc. CSEE 2023, 45, 1–19. [Google Scholar]
  31. Shen, D.; Wu, H.; Liang, H.; Qiu, Y.; Xie, H.; Gan, D. Accurate Polynomial Approximation of Bifurcation Hypersurfaces in Parameter Space for Small Signal Stability Region Considering Wind Generation. IEEE Trans. Power Syst. 2022, 37, 4512–4524. [Google Scholar] [CrossRef]
  32. Migliorati, G.; Nobile,, F.; von Schwerin, E.; Tempone, R. Approximation of quantities of interest in stochastic PDEs by the random discrete L2 projection on polynomial spaces. SIAM J. Sci. Comput. 2013, 3, A1440–A1460. [Google Scholar]
  33. Pan, C.; Hu, B.; Shao, C.; Xu, L.; Xie, K.; Wang, Y.; Anvari-Moghaddam, A. Reliability-Constrained Economic Dispatch with Analytical Formulation of Operational Risk Evaluation. IEEE Trans. Power Syst. 2024, 39, 4422–4436. [Google Scholar] [CrossRef]
  34. Zhang, D.; Zhao, J.; Dai, W.; Wang, C.; Jian, J.; Shi, B.; Wu, T. A feasible region evaluation method of renewable energy accommodation capacity. Energy Rep. 2021, 7, 1513–1520. [Google Scholar] [CrossRef]
  35. Dai, W.; Liu, Z.; Goh, H.H.; Luo, C.; Shi, B.; Xia, W. A constraint equivalent model of heat network for combined heat and power systems cooperation considering uncertainties. Electr. Power Syst. Res. 2023, 222, 109504. [Google Scholar] [CrossRef]
  36. Zhang, T.; Wang, J.; Wang, H.; Ruiyang, J.; Li, G.; Zhou, M. On the Coordination of Transmission-Distribution Grids: A Dynamic Feasible Region Method. IEEE Trans. Power Syst. 2023, 38, 1857–1868. [Google Scholar] [CrossRef]
  37. Sun, B.; Dai, W.; Zhang, D.; Goh, H.H.; Zhao, J.; Shi, B.; Wu, T. An Effective Spinning Reserve Allocation Method Considering Operational Reliability with Multi-Uncertainties. IEEE Trans. Power Syst. 2024, 39, 1568–1581. [Google Scholar] [CrossRef]
  38. Ardakani, A.J.; Bouffard, F. Identification of Umbrella Constraints in DC-Based Security-Constrained Optimal Power Flow. IEEE Trans. Power Syst. 2013, 28, 3924–3934. [Google Scholar] [CrossRef]
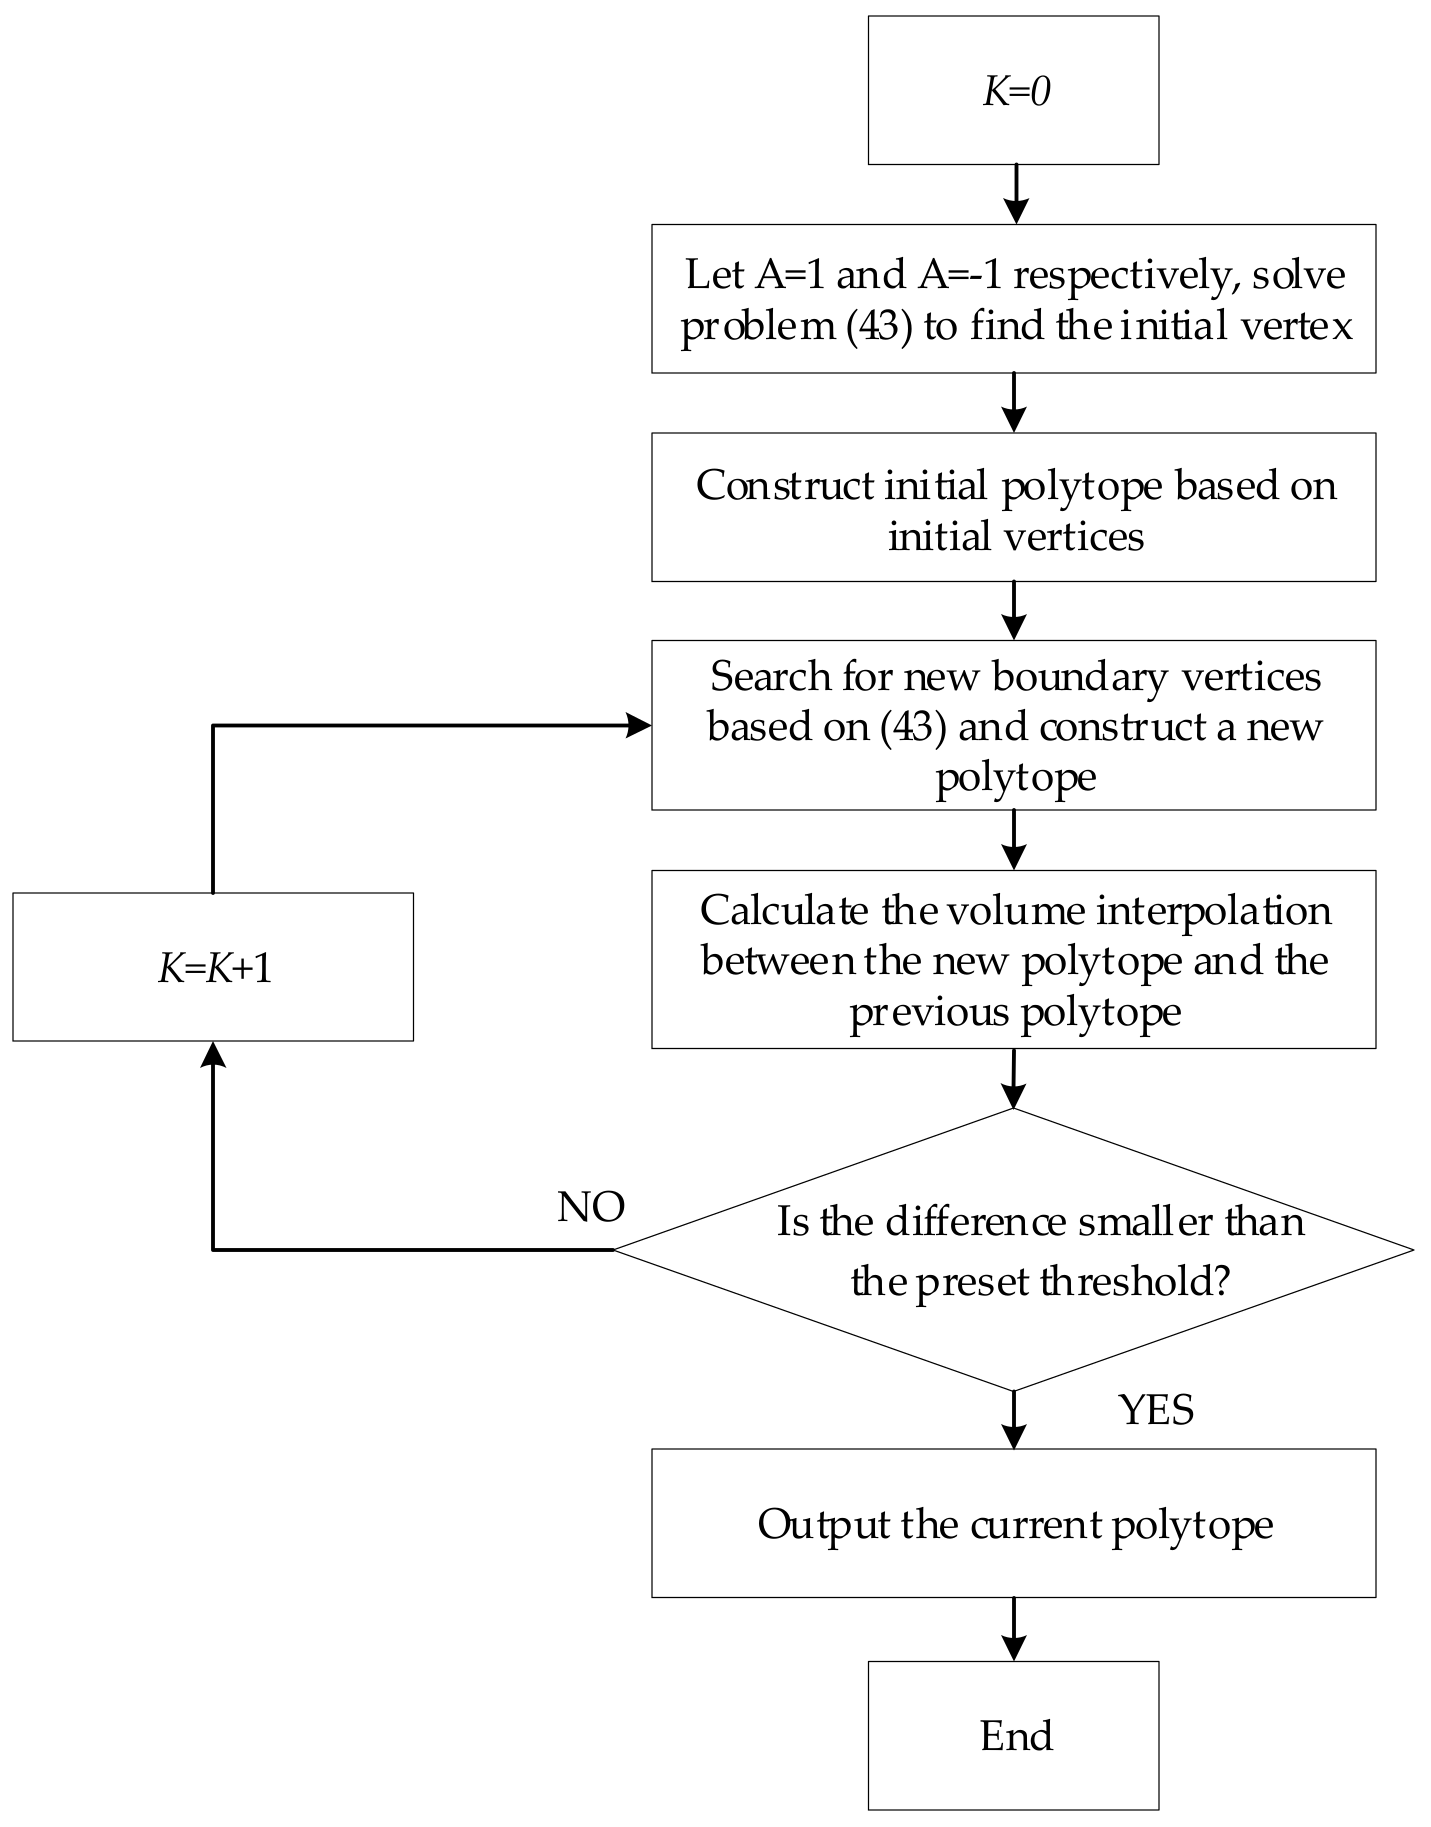
Figure 1. The flowchart of the feasible region calculation process.
Energies 17 03317 g001
Figure 2. Modified IEEE39 topology diagram.
Energies 17 03317 g002
Figure 3. Typical scenario data.
Energies 17 03317 g003
Figure 4. Frequency safety indicators.
Energies 17 03317 g004
Figure 5. ON and OFF conditions of thermal power units without considering frequency constraints.
Energies 17 03317 g005
Figure 6. ON and OFF conditions of thermal power units considering frequency constraints.
Energies 17 03317 g006
Figure 7. The relationship between frequency safety indicators and the penetration rate of renewable energy.
Energies 17 03317 g007
Figure 8. Penetration rate of renewable energy output under different conditions.
Energies 17 03317 g008
Figure 9. The feasible region of the renewable energy hosting capacity.
Energies 17 03317 g009
Figure 10. The feasible region of the renewable energy hosting capacity in an actual power grid.
Energies 17 03317 g010
Table 1. The penetration rate of renewable energy, under and not under frequency security constraints, in the different scenarios.
S1S2S3S4
Renewable energy penetration rate (%)Without frequency security constraints526067.745.7
Considering frequency security constraints4248.752.437.1
Table 2. The penetration rate of renewable energy, under and not under frequency security constraints, in an actual power grid.
S1S2S3S4
Renewable energy penetration rate/%Without frequency security constraints56.0755.0363.4152.72
Consider frequency security constraints51.9445.4755.3645.78
Disclaimer/Publisher’s Note: The statements, opinions and data contained in all publications are solely those of the individual author(s) and contributor(s) and not of MDPI and/or the editor(s). MDPI and/or the editor(s) disclaim responsibility for any injury to people or property resulting from any ideas, methods, instructions or products referred to in the content.