Abstract
In a Magnetically Coupled Resonant Wireless Power Transfer (MCR-WPT) system, the magnetic coupling coil is one of the key factors that determines the system’s output power, transmission efficiency, anti-offset capability, and so on. This article proposes a coil parameter optimization method for a wireless power transfer system based on crowding distance division and adaptive genetic operators. Through optimizing the design of decision variables, such as the numbers of transmitting and receiving coil turns, the spacings between transmitting and receiving coil turns, the inner radii of the transmitting and receiving coils, and the vertical distance of the coil, the best transmission performance can be achieved. This study improves the NSGA-II algorithm through proposing a genetic operator algorithm for average crowding and high crowding populations based on adaptive operators, as well as a genetic operator algorithm for low crowding populations based on information entropy. These improved algorithms avoid problems inherent to traditional genetic operators such as fixed genetic proportions, do not easily cause the algorithm to fall into a local optimal solution, and show better convergence in the ZDT1–ZDT3 test functions. The optimization design method in this article is not only independent of commercial software such as ANSYS Maxwell 2021 R1, but can also significantly improve the calculation speed compared with traditional simulation software.
1. Introduction
With the advent of the Internet era, small portable terminals represented by wearable devices, smart home wireless sensor networks, and implantable biological medical devices are becoming increasingly popular. However, the battery life of intelligent terminals remains limited due to their limited energy density, requiring frequent charging. The application of wireless power transfer technology effectively solves the problems of an inconsistent power supply interface between electrical equipment, poor dustproof and waterproof ability, the potential for ignition when plugged in and out, and wired charging and wiring limitations, which has brought increasing attention to this technology, forming a multi-interdisciplinary research hotspot [1]. The design and optimization of the magnetic coupling coil can affect the transmission efficiency and stability of the whole system. In an MCR-WPT (Magnetically Coupled Resonant Wireless Power Transfer) system, the magnetic coupling coil is regarded as one of the key factors determining the output power, system transmission efficiency, and system stability. However, there are many issues with WPT technology, such as the many factors affecting the output power and transmission efficiency in the coil, the coupled coil configuration and coil misalignment having great impacts on the system, and coil optimization being reliant on ANSYS Maxwell 2021 R1 and other professional electromagnetic simulation software, thus requiring long operation times, among other issues.
In recent years, there have been many studies focused on WPT technology. Professor Chris Mee and his team at the University of Michigan in the United States achieved wireless vehicle charging below the 200 kHz resonant frequency, with a transmission power of 2–6 kW and a transmission efficiency of up to 94%. Oak Ridge National Laboratory in the United States achieved 90% transmission efficiency, with 20 kW wireless charging power. Sushree S. Biswal and his team at the Silesian Technical University used a theoretical model based on reflected load theory and a lumped circuit model to study the characteristics of power transfer. Their results revealed the correlations between the maximum power transfer capacity, the coil mass factor, and the coupling coefficient under different power load conditions, allowing the parameters of the design coil to be optimized [2]. Rakesh K. Goyal and his research team at Batna Institute of Technology in India carried out a detailed analysis and experimental design of a wireless power transmitter and receiver based on solenoid and spiral coils, and they found that the power transmission efficiency reaches its maximum at the resonant frequency. The performance of the proposed WPT was further studied, and a laboratory model was established for experimental verification. The results indicated that the WPT systems based on spiral coils have a good effect [3]. Jong-Wook Lee and his research team at Kyung Hee University in South Korea extracted matching conditions from the equivalent circuit model of a magnetically coupled wireless power transmission system. The efficiency was improved through changing the coupling factor between the load and the inner resonator. With this technology, the efficiency of 60 cm and 1 m distances is increased by 46.2% and 29.3%, respectively. The maximum efficiency at 15 cm is 92.5% [4]. The Korea Advanced Institute of Science and Technology (KAIST) conducted the first wireless charging test for SUV vehicles, with an output power of 15 kW and a transmission efficiency of 71%. Subsequently, they studied the possibility of the dynamic and continuous charging of electric buses during driving. KAIST proposed to determine the relationships between factors such as the battery capacity of electric vehicles, the number of transmitters in the wireless power transmission system, and the vertical gap based on the particle swarm optimization algorithm. In addition, many scholars have carried out relevant studies on the factors influencing MCR-WPT systems, parameter optimization for the design of medium- and high-distance magnetic coupling coils, the material of the magnetic coupling coil, and the optimization of the transmission efficiency when the magnetic coupling coil is misaligned [5,6,7,8,9,10,11].
In order to ensure a relatively stable output of the Dynamic Wireless Power Transfer (DWPT) systems within a certain coupling coefficient range, the existing methods mainly focus on three aspects: control strategies [12,13,14], coupling mechanism design [15,16], and compensation topology parameter design [17,18].
However, the optimization of the existing Magnetically Coupled Resonant Wireless Power Transfer systems mainly depends on simulation using finite element software, such as ANSYS Maxwell 2021 R1. In the design of magnetic coupling coils, although the magnetic field, electric field, and other related parameter data can be accurately simulated, the transmission efficiency of the system cannot be directly calculated and the simulation process is time-consuming. These shortcomings limit progress in the design of magnetic coupling coil parameters.
In this study, an optimal coil parameter design method based on an improved multi-objective NSGA-II algorithm is proposed. It includes four steps: the dynamic proportional improvement of the NSGA-II algorithm based on information entropy and adaptive operators, tests based on ZDT functions, the selection of optimized magnetic coupling coil parameters suitable for experiments using the improved algorithm, and a Maxwell–Simplorer joint simulation-based verification of the selected parameters. First, theoretical expressions for the output power and transmission efficiency of the system are derived based on the resonant circuit model, and the objective function of the multi-objective optimization algorithm is obtained. Second, according to the crowding characteristics of the traditional NSGA-II algorithm, the population is divided into two categories. In the high-crowding population, adaptive operators are used to dynamically adjust the proportion of crossover and mutation, while in the low-crowded population, the information entropy strategy is used to dynamically adjust the crossover and mutation proportions. The improved algorithm is tested using ZDT series functions. The results show that the improved multi-objective NSGA-II algorithm has better convergence ability than the traditional NSGA-II algorithm.
Finally, the coil was modeled using Maxwell software 2021 R1 and imported into the Simplorer 2021 R1 software for the verification of electromagnetic co-simulation. The results indicate that the magnetic coupling coil designed with the improved multi-objective NSGA-II algorithm meets the design and application requirements.
Compared with the ANSYS Maxwell 2021 R1 simulation software, the method proposed in this study has independent computing capability, as it does not rely on the Maxwell 2021 R1 software. At the same time, this method fills the shortcomings of the Maxwell 2021 R1 software in terms of power and transmission efficiency calculation, and improves the limitation that Maxwell can only consider a single objective function. In addition, the NSGA-II algorithm can significantly shorten the design time, when compared with the Maxwell simulation. At the same time, compared with the traditional NSGA-II algorithm, the improved algorithm has better convergence ability and can reduce the redundancy of the solution set, thus generating a more concise and representative solution set.
2. Theoretical Basis of Coil Parameter Optimization
2.1. SS-Type Inductive Wireless Power Transfer System
Common resonant circuits can be divided into the following four structures, according to the different connection methods of the circuit: SS-type inductive wireless power transmission systems, in which the transmitting coil, the receiving coil, and the compensation network are all connected in series; SP-type inductive wireless power transmission systems, in which the transmitting coil and the compensation network are connected in series, and the receiving coil and the compensation network are connected in parallel; PP-type inductive wireless power transmission systems, in which the transmitting coil, the receiving coil, and the compensation network are all connected in parallel; and PS-type inductive wireless power transmission systems, in which the transmitting coil and the compensation network are connected in parallel, and the receiving coil and the compensation network are connected in series [19].
Due to the subsequent optimization of the coil parameters, the main considerations are the output power and the transmission efficiency of the coil. Therefore, among the four models, the SS-type inductive wireless power transmission system was considered more suitable for subsequent analysis.
The definitions of the notation used for the SS-type inductive wireless power transfer system model in Figure 1 are provided in Table 1.
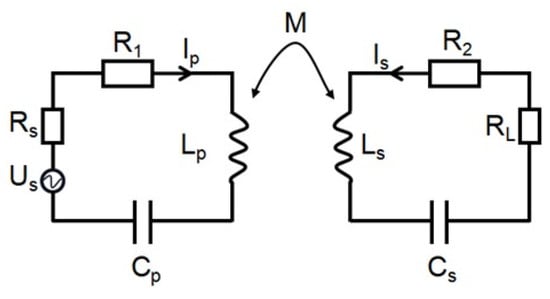
Figure 1.
SS-type inductive wireless power transfer system.

Table 1.
Notation used for SS-type inductive wireless power transfer system model.
The KVL equation for the SS-type inductive wireless power transfer system established in Figure 1 is written as follows:
where ω represents the frequency (in Hz). In subsequent simulation modeling, the transmitting coil and receiving coil meet the requirements that the coil centers are directly opposite, and both are coaxial with the z-axis in the three-dimensional coordinate system. Therefore, the following relationship holds [20]:
where is defined as the number of turns of the transmitting coil, is defined as the number of turns of the receiving coil, is defined as the outside radius of the coil at the transmitting end, is defined as the outside radius of the coil at the receiving end, is the Vacuum magnetic permeability, and Z is defined as the vertical alignment distance between the two coils.
In particular, in order to illustrate the degree of coupling between loops when the self-inductance of the transmitting and receiving coils is known, the mutual inductance is usually expressed using the coupling coefficient :
When resonance occurs, the capacitive reactance and inductive reactance in the transmitter and receiver loops are equal in magnitude but opposite in sign, thus canceling each other out. We have the following equations:
At this time, the loop current of the receiving end and the transmitting end is
The input power P1 and output power P2 of the system are
Therefore, the transmission efficiency is
2.2. Non-Dominated Sorting Genetic Algorithm II
The parameter optimization of a wireless power transfer coil involves multiple objectives, such as improving the energy transmission efficiency and increasing the output power. The NSGA-II algorithm can generate a set of optimal solutions under multiple decision variables, such as coil spacing, number of turns, and coil inner diameter, according to a certain optimization strategy under the condition of satisfying multiple objectives at the same time. The most suitable solution is then selected from the NSGA-II optimization results based on practical application scenarios, coil space constraints, industry standards, and other considerations. Compared with the traditional genetic algorithm, which only considers a single target, NSGA-II retains more elite individuals through non-dominated ranking and adopts the crowding distance division strategy to ensure the diversity of the population, allowing the optimization algorithm to achieve higher accuracy in the case of multiple targets.
2.2.1. Non-Dominated Sorting
In the case of multiple objective functions, the optimal solution is found according to the Pareto frontier solutions. The population can be divided into multiple levels through non-dominated sorting, where the first level is the set of all Pareto frontier solutions [21]. The dominance relation of NSGA-II refers to that in a multi-objective optimization problem: for two individuals, p and q, if all fitness values of individual p are not inferior to those of individual q, and at least one fitness value is superior to individual q, then p is considered to dominate q. This domination relation is a strong dominance relation; that is, p must be at least as good as q in all objective functions, and must be better than q in a certain objective function. The dominance relationship used in this article is the dominance relationship for finding the minimum value; that is, finding the minimum value of the negative function, which is the maximum value of the positive function [22,23].
Non-dominated sorting is a sorting method used in multi-objective genetic algorithms, which divides individuals in a population into different levels. The individuals at each level are non-dominated; that is, no individuals in this level will be dominated by individuals in other layers. Table 2 shows the pseudo-code for finding the first level in non-dominated sorting [11].

Table 2.
Pseudo-code of non-dominated sorting adopted in this paper.
2.2.2. Crowding Distance Calculation
The crowding distance in the NSGA-II algorithm refers to the evaluation of the density of individuals in a multi-objective optimization problem to avoid over-concentration in any part of the non-inferior solution space, thus improving the diversity of the algorithm. The calculation of the crowding distance is usually based on the distance between individuals in the target and solution spaces. As the mixing degree between different individuals varies, their crowding distances also differ. The crowding distance can be used as an evaluation metric in the sorting and selection stages of the NSGA-II algorithm, in order to determine which individuals should be selected for the next generation [24]. The crowding distance diagram is shown in Figure 2.
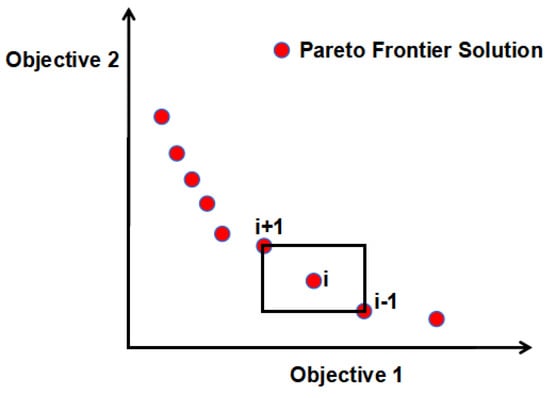
Figure 2.
Schematic diagram of crowding distance.
In Figure 2, take the ith individual as an example. The crowding distance d is calculated using the following formula [25]:
For each objective function , its algorithm process is as follows:
- (1)
- Calculate the objective function (i.e., fitness) of each individual and sort them from large to small. Let be the maximum fitness of the arranged individuals and be the minimum fitness of the arranged individuals;
- (2)
- The crowding distance between the individuals corresponding to and is specified as infinite;
- (3)
- Calculate d according to Formula (13), where d is valued between 0 and 1, and the individuals whose crowding distance is set to infinity are eliminated and will not participate in the next iteration.
2.2.3. Genetic Operators
In NSGA-II, selection, crossover, and mutation are the basic genetic operators, which are used to generate the next generation of individuals in order to improve the population quality and convergence speed from generation to generation. The purpose of the selection operation is to filter and screen the population according to the fitness function (i.e., objective function) of each individual, thereby selecting outstanding individuals as parents. The crossover operation randomly cuts the chromosomes (i.e., independent variables Xi, i = 1, 2, ..., n) of individuals p and q, then exchanges the corresponding parts to generate two new individuals. Crossover is often used to increase the diversity of the population and promote the convergence speed of the population. The mutation operation involves randomly selecting a gene position (independent variable) in the chromosomes (i.e., independent variables Xi, i = 1, 2, ..., n) of individuals p and q, and randomly generating an independent variable to generate a new individual. Mutation operations are often used to increase the diversity of the population and help to jump out of the local optimal solution in the search space. NSGA-II maintains the diversity and convergence of the population through selection and crossover operations, while increasing the diversity of the population through mutation operations, thereby enabling the population to better search the global Pareto front in the solution space.
The selection method used in this article is the binary tournament selection method, the crossover method is single-point crossover, and the mutation method is uniform mutation. The binary tournament selection method has low time complexity, high efficiency, the ability to operate in parallel, and independence. The selection of chromosomes is only related to the relative size of the fitness values between chromosomes, and has nothing to do with the absolute size. This selection approach is highly consistent with the principles of the NSGA-II algorithm [26]. The biggest advantage of single-point crossover is that, if the relationship between adjacent loci can provide better individual traits and higher individual fitness, then the possibility of a single-point crossover destroying such individual traits and reducing individual fitness is minimal, and it will not cause major damage to the excellent genes of the parent generation. At the same time, it can improve the search ability of the genetic algorithm, which is suitable for situations where there are many chromosomes, as in the wireless power transfer system considered in this article [27]. The advantage of uniform mutation is that, while new genes are generated, the genes changed by basic position mutations are still the genes existing in the original population, which greatly increases the breadth of mutation and is conducive to the search for optimal solutions [28].
The function definition of the tournament selection method is shown in Table 3, and the principles of single-point crossover and uniform mutation are shown in Figure 3 and Figure 4, respectively.

Table 3.
Tournament selection method.
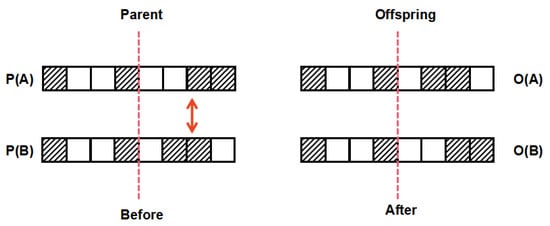
Figure 3.
Schematic diagram of the single-point crossover operation.
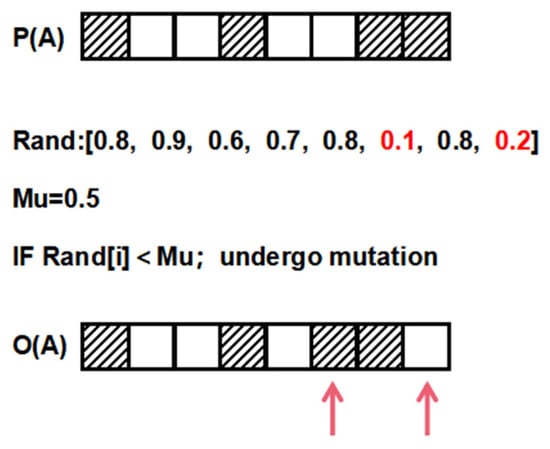
Figure 4.
Schematic diagram of the uniform mutation operation.
3. The Genetic Algorithm Considering Crowding Based on Adaptive Operators and Information Entropy
3.1. The Adaptive Genetic Operator Considering Crowding Distance
Crossover and mutation operations are classic steps in genetic algorithms, which can significantly increase the diversity of the population. However, traditional genetic algorithms use fixed proportions in the crossover and mutation operations, which not only violates the laws of nature, but can also easily lead to optimal solutions being missed when applying the algorithm.
For this reason, this study draws on the crowding distance calculation method to adjust the crossover and mutation proportions in such a way that they change with an increase in the number of iterations, thus improving the convergence of the Pareto front. The typical manifestation of the local optimal solution in the NSGA-II algorithm is that the solution is too dense or too scattered. We need to perform denser genetic operations in the solution-dense area and, correspondingly, only perform coarser genetic operations in the solution-dispersed area. The level of crowding reflects the degree of dispersion or the density of the solution. Therefore, we first divide the population according to the density or dispersion of the solution, and propose a population division method based on the average crowding distance to divide the population into two categories: low crowding and high crowding. Population division provides a theoretical basis for selecting denser or coarser genetic operations for different populations.
Regarding the problems related to fixed crossover and mutation proportions in the NSGA-II algorithm, the academic community has also carried out a large number of related studies and developed the concept of adaptive operators, which provides a new research idea for improving the NSGA-II algorithm. As an important concept in information theory, information entropy can manipulate the degree of individual diversity. When individual diversity is low, the maintenance of diversity can be enhanced through corresponding mechanisms. Introducing information entropy into the NSGA-II algorithm can enhance the maintenance ability of population diversity and avoid excessive convergence to a specific solution space.
Intensive genetic operations are required in denser areas. The algorithm uses an approach based on information entropy to calculate the crossover and mutation proportions in low-crowded populations. In the same way, in order to perform rougher genetic operations in areas where solutions are more dispersed, the algorithm uses improved crossover proportion and mutation proportion adaptive algorithms, based on adaptive operators in highly crowded populations.
3.1.1. High Crowding Distance Population Genetic Operator Based on Adaptive Operator
In order to perform rougher genetic operations in areas where solutions are more dispersed, the algorithm uses improved crossover and mutation proportion adaptive algorithms based on adaptive operators in highly crowded populations. According to the literature [29], the ranges for the crossover and mutation proportions are [0.4, 0.8] and [0.001, 0.1], respectively. In a highly crowded population, the number of solutions is smaller and the solutions are more dispersed. Considering the simulation of natural laws [30] and the convergence of the algorithm, in the early stage of iteration, the crossover and mutation proportions are larger, making the population structure richer and helping to find the optimal solution more quickly. The higher the number of iterations, the smaller the crossover and mutation proportions, and the algorithm tends to become more stable. The genetic operator based on the adaptive operator is shown below [29], where is the maximum number of iterations, is the current number of iterations, is the crossover operator, is the mutation operator, is the crowding degree of the gth generation population, and is the average crowding degree of all generations.
3.1.2. Low Crowding Distance Population Genetic Operator Based on Information Entropy
Intensive genetic operations are required in areas with dense solutions. In low-crowding populations, the algorithm uses an approach based on information entropy to calculate the crossover proportion and mutation proportion. The information entropy H is a measure used to express the uncertainty of information, which is one of the most important concepts of information theory. Generally, the larger the value of H, the higher the uncertainty of the information. The information entropy of the NSGA-II algorithm population is defined as follows in Formula (18):
where , is the number of populations, and is the number of individuals included in population . The population is divided into two equal parts, according to the crowding distance, and m is used to represent the number of individuals in the same range of the population in the optimization objective. When m = 1, it means that only one individual in the population falls within this range; that is, the optimal solution in this range is this individual and, so, H (i.e., the information entropy) takes the minimum value of 0. When m = N, it means that all individuals in the population fall within this range; that is, the uncertainty of the optimal solution in this range is the largest at this time and, so, takes the maximum value of .
The theoretical analysis shows that the higher the crowding degree, the fewer solutions, the smaller the value of m, the smaller the uncertainty of the solution being the optimal solution, and the smaller the information entropy. At this time, the crossover and mutation proportions should be increased to make the population structure richer. To the contrary, the larger the value of m, the smaller the crossover and mutation proportions should be, and the more stable the population. The genetic operator of population evolution after introducing the information entropy mechanism is as follows [31]:
where is the crossover operator, is the mutation operator, and and are random numbers within [0, 1].
As the design information entropy is in the range of lower crowding distance, = pop1 can be determined, where pop1 is the number of populations when the crowding distance is less than the average crowding distance. In the early stage of the iteration, the similarity of individuals in the population is low, so the crossover proportion can be increased appropriately to accelerate the evolution process. In the middle of the iteration, increasing the mutation proportion can prevent the algorithm from falling into local optima. In the later stage of the iteration, the individual similarity is high. In order to make the algorithm gradually converge, the crossover proportion is appropriately reduced. According to the above principles, the crossover operator is approximated as a decreasing function model within the evolutionary generations, while the mutation operator is approximated as a Cauchy distribution model [31]:
where g is the current evolutionary generation, G is the total number of evolutionary generations, is a random number in the range [0, 1], is the scale parameter (according to the calculation formula of the scale parameter ), and is the vertex coordinate; that is, the maximum value of the variation proportion is 0.1. In summary, the final crossover operator and mutation operator of the improved algorithm are
3.1.3. Algorithm Process
According to the previous theoretical analysis, in the NSGA-II algorithm proposed in this article, the formulas for calculating the crossover operator and mutation operator , according to the crowding distance classification, are as follows:
The process of the improved NSGA-II algorithm is as follows:
- (1)
- Population initialization: randomly generate an initial population according to the design requirements (i.e., randomly generate the values of independent variables).
- (2)
- Calculate fitness: calculate the fitness of the individual based on the generated population (i.e., calculate the value of the objective function).
- (3)
- Fast non-dominated sorting: through the calculation of dominance relationships, individuals are divided into levels through fast non-dominated sorting, where is the number of individuals in the population.
- (4)
- Calculate the crowding distance: for each level of individuals, calculate the crowding distance.
- (5)
- Population classification: according to the calculated crowding distance, the population is divided into two categories—a low-crowding distance population that is less than the average crowding distance, and a high-crowding distance population that is equal to or greater than the average crowding distance.
- (6)
- Selection: Perform selection operations based on the level and crowding distance, select outstanding individuals, and form a new population . A binary tournament selection method is used in this study, in which an individual with a higher level is selected first and, if the levels are the same, the individual with a greater crowding distance is selected.
- (7)
- Crossover and mutation: using the improved crossover and mutation operators, crossover and mutation operations are performed on the selected population to generate a new offspring population .
- (8)
- Merge populations: the parent population and the offspring population are merged into a new population .
- (9)
- Determine the number of iterations: if the number of iterations g reaches the maximum number of iterations G, jump out of the loop; otherwise, go to step 1 to start a new cycle.
3.2. ZDT Function Testing
When improving a multi-objective algorithm, it is necessary to test the performance of the improved algorithm. This test helps to avoid situations in which the convergence performance of the improved algorithm is worse than that of the original algorithm. At present, commonly used performance testing functions include MOP series functions, ZDT with bias constraints, and DILZ series functions, among others. The ZDT test functions are suitable for the situation where two objective functions are considered and, so, the ZDT1–ZDT3 test functions were chosen to test the performance of the improved NSGA-II algorithm.
The ZDT series of functions was proposed by Zitzler et al., and are currently the most widely used objective function test sets. They are characterized by a variable number of decision variables, high flexibility, and short Pareto front drawing time, and the function performance can be obtained relatively quickly. Table 4 provides the expressions for the ZDT1–ZDT3 functions.

Table 4.
ZDT series functions.
The Inverted Generational Distance (IGD) is a commonly used evaluation index for multi-objective optimization algorithms. The advantage of IGD is that it can comprehensively consider the distance between the solution set generated by the algorithm and the real frontier, and is not affected by the size or distribution of the solution set. It can provide an assessment of the overall performance of the algorithm in multi-objective optimization problems. Therefore, IGD is widely used to compare the performance of multi-objective optimization algorithms. The smaller its value, the higher the quality of the Pareto solution and the better the convergence of the algorithm [32].
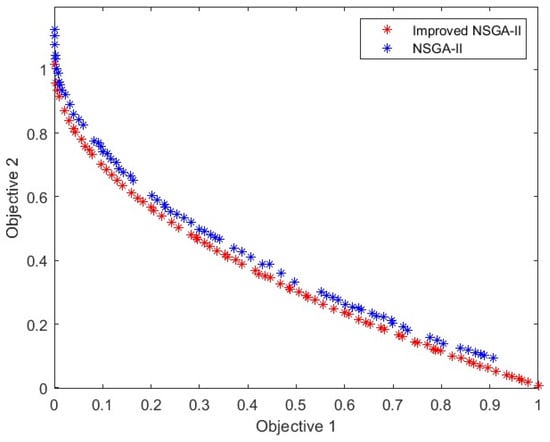
Figure 5.
Pareto front of the ZDT1 test function.
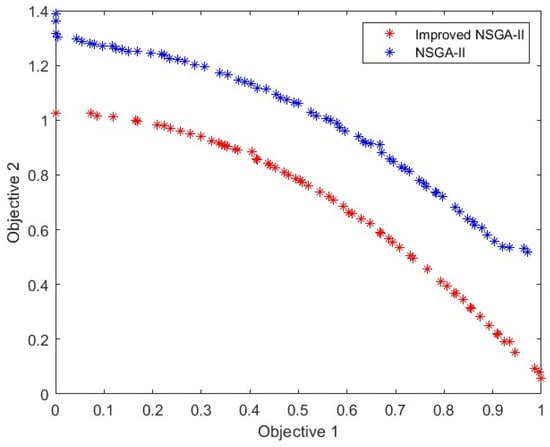
Figure 6.
Pareto front of the ZDT2 test function.
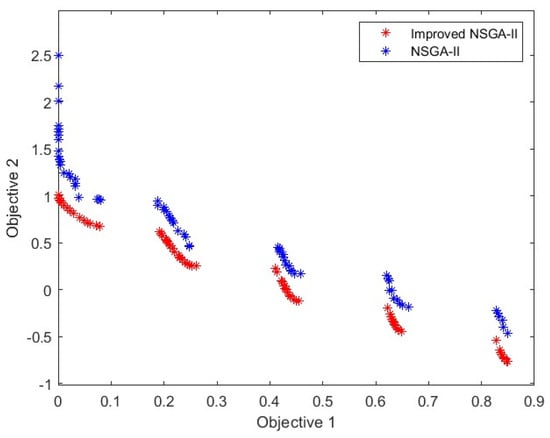
Figure 7.
Pareto front of the ZDT3 test function.
Table 5 provides the IGD values for the different test functions.

Table 5.
IGD values of different test functions.
The performance test of the improved NSGA-II algorithm was carried out based on the ZDT series functions. It can be seen from Figure 6, Figure 7 and Figure 8 and Table 5 that the Inverted Generational Distance (IGD) values of the improved algorithm were reduced by 82.2%, 97.1%, and 95.9%, respectively. These results indicate that, under the same number of iterations and populations, the improved algorithm has better convergence ability than the traditional NSGA-II algorithm.
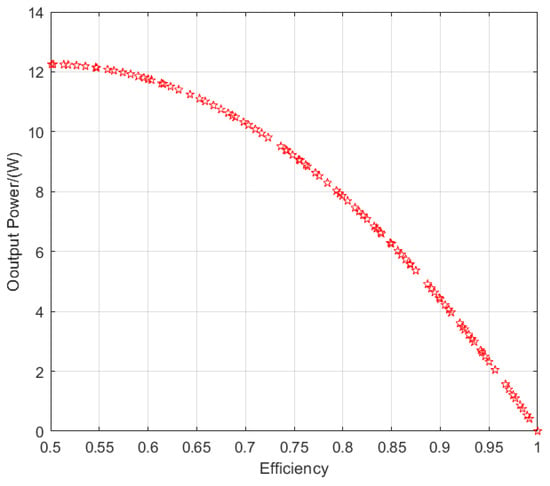
Figure 8.
Pareto first-level solution set of coil parameters obtained with improved algorithm.
4. Optimization Verification of Coil Parameters Based on Improved NSGA-II Algorithm
4.1. Objective Function and Constraint Conditions for Coil Parameter Optimization
In actual design and simulation, the load and the internal resistance of the power supply are known, and the internal resistance of the receiving coil and the internal resistance of the transmitting coil are negligible compared to the internal resistance of the power supply. Therefore, by putting Formula (2) into Formulas (11) and (12), we obtain Formulas (30) and (31) for the output power and transmission efficiency of the MCR-WPT system, respectively.
Here,
For subsequent experimental verification, the wire diameter of the transmitting coil in this article is set as and the wire diameter of the receiving coil is .
The objective function is defined as
The range of the magnetic coupling transmitting coil turns is [1, 25], that for the receiving coil turns is [1, 25], that for the transmitting coil turn spacing is [0 mm, 10 mm], that for the receiving coil turn spacing is [0 mm, 10 mm], that for the inner radius of the transmitting coil r1 is [5 mm, 300 mm], that for the inner radius of the receiving coil r2 is [5 mm, 300 mm], and that for the vertical distance of the coil Z is [5 mm, 20 mm].
The constraints are as follows:
4.2. Parameter Optimization Algorithm Results
The coil was designed using copper wires. The magnetic permeability of copper is and, for the resonant frequency, we adopted the standard of the Ministry of Industry and Information Technology of China of MHz. According to the previous theoretical analysis results, the internal resistance of the receiving coil and the internal resistance of the transmitting coil are negligible, compared to the internal resistance of the resistor. For convenience, the internal resistance of the power supply was set to , the load to , and the effective value of the voltage to 7 V.
According to Formulas (31) and (32), combined with the above analysis, the improved multi-objective NSGA-II algorithm was compiled using the Matlab platform, in which the population number was set to 100 and the number of iterations was 150 generations. The obtained Pareto front solution is shown in Figure 8. The Pareto front solution obtained using the traditional NSGA-II algorithm with the same multi-objective function, decision variables, population number, and number of iterations is shown in Figure 9. Comparing Figure 8 and Figure 9, it can be clearly seen that the improved algorithm overcomes the problem of missing local optimal solutions in the traditional NSGA-II algorithm.
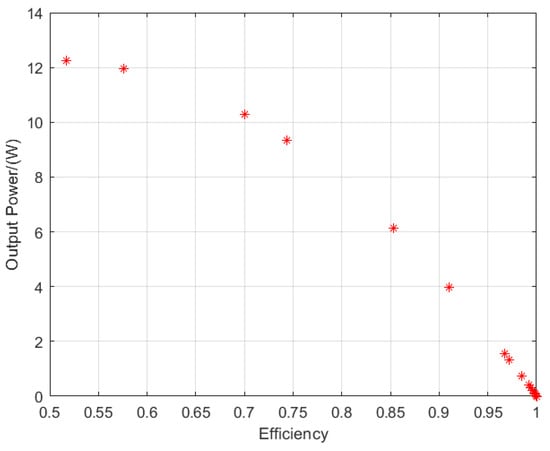
Figure 9.
Pareto first-level solution set of coil parameters obtained with the traditional NSGA-II algorithm.
Based on the actual application scenario, coil space limitations, industry standards, and other considerations on the Pareto curve, the most appropriate solution was selected from the optimization results; in particular, the data chosen from the Pareto solution set are listed in Table 6.

Table 6.
Optimized magnetic coupling coil parameters.
4.3. Simulation Verification
The optimal coil parameters for the MCR-WPT system were verified through experiments, based on the research results in Section 4.1. The verification process adopted joint use of ANSYS Maxwell 2021 R1, ANSYS Simplorer, and other tools to build the SS-type inductive wireless power transmission system model.
The eddy current field in the ANSYS Maxwell 2021 R1 software is suitable for simulating problems such as electromagnetic induction and eddy current heating, the static field is suitable for simulating problems such as electrostatic induction and magnetic field distribution, and the transient field is suitable for simulating problems such as applied and instantaneous currents. In practical applications, changes in the electromagnetic field may contain characteristics of these three field types at the same time and, so, it is necessary to choose an appropriate simulation solution according to the specific situation.
This section verifies the transmission efficiency of the system based on the SS-type inductive wireless power transmission system model. The steps to establish the circuit model were as follows:
- (1)
- Solve the coil parameters using the eddy current field. According to the optimal coil of the MCR-WPT system obtained in the previous section, the model was established in ANSYS Maxwell 3D. The self-inductances Lp and Ls of the transmitting coil and the receiving coil in the Maxwell eddy current field were calculated, then put into Formulas (6) and (7) to calculate the resonant capacitances Cp and Cs of the transmitting end and the receiving end, as well as the transmitting coil and receiving coil resistances R1 and R2. At this time, all the solution parameters of the coil were solved using ANSYS Maxwell 3D.
- (2)
- Link the transient field. Establish the same coil parameter model as in step (1), set the windings at the cutting positions of the transmitting coil and receiving coil, and select the current mode as external current mode in preparation for the subsequent importing of the model into Simplorer.
- (3)
- ANSYS Maxwell 2021 R1 and ANSYS Simplorer 2021 R1 joint simulation. Import the coil model established by the transient field into ANSYS Simplorer. The established SS-type inductive wireless power transmission system model is shown in Figure 10, where E1 denotes the voltage source, C1 is the resonant capacitance of the transmitting end, C2 is the resonant capacitance of the receiving end, Rs1 is the internal resistance of the power supply, Rs2 is the internal resistance of the transmitting coil, Rs3 is the internal resistance of the receiving coil, and RL is the circuit load. The parameters were set according to the calculation and simulation results obtained in step (1). A transient solver TR based on time domain analysis was added, and the sweep time was set 0.5 ms.
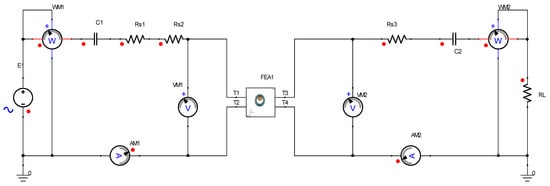 Figure 10. SS circuit simulation diagram built using Simplorer.
According to the circuit construction diagram in Figure 10, the transmission efficiency is defined as
where WM1 is the input power and WM2 is the output power.
The output and input power curves are shown in Figure 11 (the red curve in the figure is the input power, while the green curve is the output power), and the transmission efficiency calculated using Simplorer is shown in Figure 12.
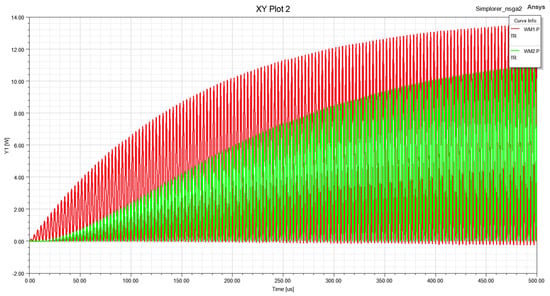
Figure 11.
Input and output power curves.

Figure 12.
Calculation results obtained with the Simplorer 2021 R1 software.
Analyzing these images, the following conclusions can be drawn:
The phase of the power at the transmitting and receiving ends is the same, indicating that resonance occurs under this parameter design. According to the Simplorer calculations, the output power of the MCR-WPT system is 7.74 W and the transmission efficiency is 80.87%. There is a partial error between the results and the theoretical transmission efficiency of 83% and output power of 7.82 W obtained using the improved NSGA-II algorithm. The reason for this is that, in the theoretical expression of efficiency of the NSGA-II algorithm, the internal resistance of the transmitting coil and the receiving coil is ignored. Therefore, it can be considered that the magnetic coupling coil optimized using the improved NSGA-II algorithm meets the design requirements. From the perspective of simulation time, the time to jointly simulate a set of solutions using ANSYS Maxwell and ANSYS Simplorer is 736 s. Assuming that there are 60 sets of solutions, it would take 44,160 s. However, using the algorithm-based parameter optimization method proposed in this article, this process only takes 45 s, thus shortening the solution time by about 1000 times.
5. Conclusions
In this study, we first derived theoretical expressions for the system output power and transmission efficiency based on the SS-type inductive wireless power transmission system model, and provided constraints and objective functions for the subsequent improvement of the NSGA-II algorithm. Next, the crossover and mutation operators in the NSGA-II algorithm were dynamically and proportionally improved through the introduction of adaptive operators and information entropy. The improved algorithm was tested using ZDT functions and the IGD index. The test results demonstrated that the improved NSGA-II algorithm has better convergence ability. Subsequently, the Pareto curve of the transmission efficiency and the output power of the SS-type inductive wireless power transmission system were obtained based on the improved NSGA-II algorithm. Then, based on the actual application scenario, coil space limitations, industry standards, and other considerations, the most appropriate solution on the Pareto curve was selected from the optimization results. In order to facilitate subsequent verification, a point from the Pareto front was selected to perform electromagnetic Maxwell–Simplorer joint simulation for verification. The simulation results indicate that the magnetic coupling coil optimized using the improved NSGA-II algorithm met the design requirements, and the improved NSGA-II algorithm is approximately 1000 times faster than the professional software, in terms of solution time.
Author Contributions
Conceptualization, H.Z.; writing—review and editing, X.S.; software, P.S.; validation, L.W.; project administration, Y.H.; methodology, Z.Y.; writing—original draft preparation, H.Y. All authors have read and agreed to the published version of the manuscript.
Funding
This research was funded by 2024 Shanghai Educational Science Research Project, grant number C2024184; 2023 CHINA ASSOCIATION OF CONSTRUCTION EDUCATION Teaching and Research Project Key Projects, grant number 2023054.
Data Availability Statement
The original contributions presented in the study are included in the article, further inquiries can be directed to the corresponding author.
Conflicts of Interest
Author Peng Sui was employed by the company China Mobile Group Heilongjiang Company Limited. The remaining authors declare that the research was conducted in the absence of any commercial or financial relationships that could be construed as a potential conflict of interest.
References
- Ma, Y. Application of wireless power transmission technology. In AIP Conference Proceedings; AIP Publishing LLC: Melville, NY, USA, 2019; Volume 2073, p. 020041. [Google Scholar]
- Biswal, S.S.; Kar, D.P.; Samal, S.K.; Bhuyan, S. Investigation of correlation of design parameters in wireless power transfer system. IET Sci. Meas. Technol. 2021, 15, 427–433. [Google Scholar] [CrossRef]
- Goyal, R.K.; Gautam, U.; Behera, R.K. A novel design of magnetically coupled circuits for wireless power transfer with improved waveforms. In Proceedings of the IEEE International Conference on Industrial Technology, Cape Town, South Africa, 25–28 February 2013. [Google Scholar]
- Duong, T.P.; Lee, J.W. Experimental Results of High-Efficiency Resonant Coupling Wireless Power Transfer Using a Variable Coupling Method. IEEE Microw. Wirel. Compon. Lett. Publ. IEEE Microw. Theory Tech. Soc. 2011, 21, 442–444. [Google Scholar] [CrossRef]
- Chen, W.-X.; Chen, Z.-P. Optimization on the transmission distance and efficiency of magnetic resonant WPT system. In Proceedings of the CSAA/IET International Conference on Aircraft Utility Systems (AUS 2018), Guiyang, China, 19–22 June 2018; Nanjing Engineering Institute of Aircraft System, Aviation Key Laboratory of Science and Technology on Aero Electrome-Chanical System Integration: Nanjing, China, 2018. [Google Scholar]
- Ahn, D.; Hong, S. Effect of Coupling between Multiple Transmitters or Multiple Receivers on Wireless Power Transfer. IEEE Trans. Ind. Electron. 2012, 60, 2602–2613. [Google Scholar] [CrossRef]
- Jolani, F.; Yu, Y.; Chen, Z. A Planar Magnetically Coupled Resonant Wireless Power Transfer System Using Printed Spiral Coils. IEEE Antennas Wirel. Propag. Lett. 2014, 13, 1648–1651. [Google Scholar] [CrossRef]
- Miwa, K.; Mori, H.; Kikuma, N.; Hirayama, H.; Sakakibara, K. A consideration of efficiency improvement of transmitting coil array in wireless power transfer with magnetically coupled resonance. In Proceedings of the Wireless Power Transfer (WPT), Perugia, Italy, 15–16 May 2013. [Google Scholar]
- Dinis, J.; Cardoso, A.J.M. Wide Bandgap Semiconductor-Based Converters for EV and HEV Magnetically Coupled Resonant Wireless Power Transfer. In Proceedings of the 2021 Sixteenth International Conference on Ecological Vehicles and Renewable Energies (EV-ER), Monte-Carlo, Monaco, 5–7 May 2021. [Google Scholar]
- Gao, P.; Tian, Z.; Pan, T.; Wu, J.; Gui, W. Transmission efficiency analysis and optimization of magnetically coupled resonant wireless power transfer system with misalignments. AIP Adv. 2018, 8, 085016. [Google Scholar] [CrossRef]
- Deb, K.; Agrawal, S.; Pratap, A.; Meyarivan, T. A Fast Elitist Non-dominated Sorting Genetic Algorithm for Multi-objective Optimization: NSGA-II. In Proceedings of the International Conference on Parallel Problem Solving from Nature, Paris, France, 18–20 September 2000. [Google Scholar]
- Li, Z.; Zhu, C.; Jiang, J.; Song, K.; Wei, G. A 3kW wireless power transfer system for sightseeing car supercapacitor charge. IEEE Trans. Power Electron. 2017, 32, 3301–3316. [Google Scholar] [CrossRef]
- Li, H.; Li, J.; Wang, K.; Chen, W.; Yang, X. A maximum efficiency point tracking control scheme for wireless power transfer systems using magnetic resonant coupling. IEEE Trans. Power Electron. 2015, 30, 3998–4008. [Google Scholar] [CrossRef]
- Berger, A.; Agostinelli, M.; Vesti, S.; Oliver, J.A.; Cobos, J.A.; Huemer, M. A Wireless Charging System Applying Phase-Shift and Amplitude Control to Maximize Efficiency and Extractable Power. IEEE Trans. Power Electron. 2015, 30, 6338–6348. [Google Scholar] [CrossRef]
- Huh, J.; Lee, S.W.; Lee, W.Y.; Cho, G.H.; Rim, C.T. Narrow-width inductive power transfer system for online electrical vehicles. IEEE Trans. Power Electron. 2011, 26, 3666–3679. [Google Scholar] [CrossRef]
- Choi, S.Y.; Jeong, S.Y.; Gu, B.W.; Lim, G.C.; Rim, C.T. Ultraslim S-type power supply rails for roadway-powered electric vehicles. IEEE Trans. Power Electron. 2015, 30, 6456–6468. [Google Scholar] [CrossRef]
- Feng, H.; Cai, T.; Duan, S.; Zhao, J.; Zhang, X.; Chen, C. An LCCcompensated resonant converter optimized for robust reaction to large coupling variation in dynamic wireless power transfer. IEEE Trans. Ind. Electron. 2016, 63, 6591–6601. [Google Scholar] [CrossRef]
- Feng, H.; Cai, T.; Duan, S.; Zhang, X.; Hu, H.; Niu, J. A dualside-detuned series-series compensated resonant converter for wide charging region in a wireless power transfer system. IEEE Trans. Ind. Electron. 2018, 65, 2177–2188. [Google Scholar] [CrossRef]
- Bo, Z. Principle of Wireless Power Transmission; Science Press: Beijing, China, 2018. [Google Scholar]
- Qiao, Z.; Guo, G.; Guo, K.; Li, R.; Liu, T.; Yu, K.; Jia, Y.; Pei, D. Analysis of factors influencing efficiency in magnetically-coupled resonant wireless power transfer system. J. Henan Univ. Eng. 2019, 31, 50–52+62. [Google Scholar]
- Rodriguez, A.; Falcarin, P.; Ordonez, A. Energy optimization in wireless sensor networks based on genetic algorithms. In Proceedings of the 2015 SAI Intelligent Systems Conference (IntelliSys), London, UK, 10–11 November 2015; pp. 470–474. [Google Scholar]
- AbiarKashani, M.; Vaghasloo, Y.A.; AghaMirsalim, M. Optimal design of high-pressure fuel pipe based on vibration response and strength using multi-objective genetic algorithm. Struct. Multidiscip. Optim. 2021, 64, 935–956. [Google Scholar] [CrossRef]
- Gong, Y.; Otomo, Y.; Igarashi, H. Multi-objective topology optimization of magnetic couplers for wireless power transfer. Int. J. Appl. Electromagn. Mech. 2020, 64, 325–333. [Google Scholar] [CrossRef]
- Verma, S.; Pant, M.; Snasel, V. A Comprehensive Review on NSGA-II for Multi-Objective Combinatorial Optimization Problems. IEEE Access 2021, 9, 57757–57791. [Google Scholar] [CrossRef]
- Zhao, X.; Li, P.; Fu, B. Primary Frequency Regulation Control Strategy with Wind-Storage Cooperation Based on Multi-Objective Optimization. South. Power Syst. Technol. 2022, 16, 68–76. [Google Scholar]
- Zhao, Y. Research and Implementation of Parameter Adaptive Shop Scheduling Algorithm Based on Reinforcement Learning. Master’s Thesis, Chongqing University, Chongqing, China, 2022. [Google Scholar]
- Ren, R. Research on the Reliability of Fatigue Life of Contact Parts Based on Genetic Algorithm. Master’s Thesis, Northwestern Polytechnical University, Xi’an, China, 2007. [Google Scholar]
- Zhang, Z. Research on Short-term Prediction Method of Significant Wave Height. Master’s Thesis, Tianjin University, Tianjin, China, 2019. [Google Scholar]
- Zhou, Y.; Hu, X.; Jiang, D.; Li, H. Research on Optimization Algorithm of Workshop Scheduling Based on Improved NSGA-II. Comput. Eng. Appl. 2021, 57, 274–281. [Google Scholar]
- Wang, J.; Li, Y. Seismic trace fast matching pursuit based on genetic algorithm and orthogonal time-frequency atom. Oil Geophys. Prospect. 2016, 51, 881–888+893. [Google Scholar]
- Wei, Y. Research on Optimal Dispatching Strategy of Active Distribution Network with the Participation of Multi-Stakeholders. Master’s Thesis, North China Electric Power University, Beijing, China, 2020. [Google Scholar]
- Zhang, K.; Liu, M. Manipulator Multi-Object Optimal Trajectory Planning Based on Adaptive Penalty MOEA/D Algorithm. Mach. Des. Manuf. 2024, 5, 102–106+112. [Google Scholar] [CrossRef]
Disclaimer/Publisher’s Note: The statements, opinions and data contained in all publications are solely those of the individual author(s) and contributor(s) and not of MDPI and/or the editor(s). MDPI and/or the editor(s) disclaim responsibility for any injury to people or property resulting from any ideas, methods, instructions or products referred to in the content. |
© 2024 by the authors. Licensee MDPI, Basel, Switzerland. This article is an open access article distributed under the terms and conditions of the Creative Commons Attribution (CC BY) license (https://creativecommons.org/licenses/by/4.0/).