Article

Determination of Sodium Ion Diffusion Coefficient in Tin Sulfide@Carbon Anode Material Using GITT and EIS Techniques

1
Faculty of Chemistry, Gdańsk University of Technology, Narutowicza 11/12, 80-233 Gdańsk, Poland
2
Advanced Materials Center, Gdańsk University of Technology, Narutowicza 11/12, 80-233 Gdańsk, Poland
*
Author to whom correspondence should be addressed.
Energies 2024, 17(13), 3233; https://doi.org/10.3390/en17133233
Submission received: 21 May 2024 / Revised: 17 June 2024 / Accepted: 30 June 2024 / Published: 1 July 2024
(This article belongs to the Section D: Energy Storage and Application)

Abstract

:
The electroanalytical behavior of SnSx (x = 1, 2) encapsulated into a carbon phase was studied using the galvanostatic intermittent titration technique (GITT) and electrochemical impedance spectroscopy (EIS). These techniques are widely utilized in battery systems to investigate the diffusion of alkali metal cations in anode and cathode materials depending on the concentration of ions in the host material. Here, we report different calculation methods showing how the applied model affects the derived diffusion coefficient. The calculated value of the apparent chemical diffusion coefficient of sodium ions ( D N a + ) is in the range of 1 × 10⁻¹⁰ to 1 × 10⁻¹⁵ cm2/s depending on the technique, mathematical protocol, geometry of the electrode material, and applied potential.

1. Introduction

Sodium-ion batteries (SIBs) have gained attention as viable substitutes for lithium-ion batteries (LIBs) due to several factors. Firstly, they offer a potential solution to concerns regarding the scarcity and expense of lithium, as sodium is more abundant and widely available. This abundance of sodium could potentially lead to lower production costs for batteries, making them more accessible and affordable on a larger scale [1]. Additionally, SIBs present opportunities for large-scale energy storage applications, such as grid-level storage for renewable energy sources like solar and wind power. However, challenges remain in optimizing the performance and longevity of SIBs compared to LIBs, particularly in terms of energy density and cycle life. Nonetheless, ongoing research and development efforts are focused on overcoming these hurdles, indicating a promising future for sodium-ion technology in the realm of energy storage [2,3]. The resemblance between sodium and lithium presents a compelling case for integrating sodium into lithium-based technologies seamlessly. By substituting lithium ions for sodium ions in cathode materials, it is possible to create electrode materials with comparable properties. For instance, compounds like NaFePO4, NaNi0.6Co0.05Mn0.35O2, and Na3V2(PO4)2F3 exhibit similar electrochemical characteristics to their lithium counterparts [4]. This similarity not only streamlines the transition from lithium to sodium technology but also allows for the utilization of existing infrastructure and expertise in lithium-ion battery manufacturing. Moreover, leveraging sodium-based materials in lithium technologies facilitates a smoother transition toward sodium-ion batteries, offering a potential pathway to address concerns surrounding lithium scarcity and cost without compromising performance or reliability. As research and development in this field progress, further optimizations and innovations are expected, solidifying the position of sodium-ion technology as a viable alternative to lithium-ion batteries. However, the variance in ionic radius size, with lithium measuring 0.76 Å and sodium 1.02 Å, plays a pivotal role in dictating the transport properties of ions within the host material. This discrepancy fundamentally alters how ions move through the crystal lattice of the electrode material. Larger ionic radii, such as that of sodium, generally result in slower diffusion rates compared to those of smaller ions like lithium. Size disparity can also influence the structural stability of the host material, potentially leading to phase transitions or structural distortions during charge and discharge cycles. Therefore, precise measurements of ion transport of sodium ions for SIBs are of utmost importance. The utilization of electrochemical techniques such as the galvanostatic intermittent titration technique (GITT) and electrochemical impedance spectroscopy (EIS) coupled with modeling and simulation are widely used in studies of the mass, charge transport, and charge transfer properties of ions [5]. These techniques are advantageous over non-electrochemical methods. The reason for that is that the diffusion coefficient is directly related to the current and voltage that are measured in the system. In particular, the GITT is most often applied as it is believed to be one of the most reliable techniques [6,7]. This technique combines two stages: (1) coulometric titrations followed by (2) open circuit potential (OCP) and was originally implemented by Weppner and Huggins [8]. The results are correct if a full equilibrium state is reached in the bulk after each titration step. Usually, it is achieved as relatively low currents are applied for a short time and a relatively long time is used after each incremental charge or discharge. Moreover, only one phase is expected to occur after intercalation or deintercalation. If a two-phase system appears, then the calculated chemical diffusion coefficient is indistinct, and the calculated D is rather an effective measurement of the long- and short-range interactions between intercalated species and the host material [9]. It is a reason why there are differences, even of some orders of magnitude, in the diffusion data for identical materials [10,11].
Here, we show and discuss different mathematical models in the application of GITT measurements for determining the apparent chemical sodium diffusion coefficient ( D N a + ) in a tin sulfide base electrode material embedded into a carbon phase. We applied different protocols as well as different geometries to the calculations. We compared the results from the GITT with the results calculated from EIS analysis.

2. Experimental Protocol

2.1. Synthesis of SnSx@C

Anhydrous SnCl4 (3.1 g) (POCH, Gliwice, Poland), starch (2.36 g) (Sigma Aldrich, St. Louis, MO, USA), and thioacetamide (0.96 g) (Chemat, Gdańsk, Poland) were mixed with ethylene glycol (100 mL) (POCH, Gliwice, Poland) and placed in a Teflon liner inside an autoclave for 20 h at 150 °C. After cooling to room temperature, the powder was separated and washed several times with acetone. The dried material was pyrolyzed at 600 °C for 6 h in an Ar atmosphere. This material is denoted as SnSx@C_sp.

2.2. Material Characterization

A digital microscope (VHX-700, Keyence, Osaka, Japan) was used to investigate the morphology of the electrode material and the thickness of the film layer. The particle size distribution of the pristine material was measured by multi-angle dynamic light scattering (Zetasizer Nano ZS particle analyzer, Malvern Panalytical, Malvern, UK).

2.3. Electrode Preparation

The electrodes were assembled from a slurry containing an 8:1:1 weight ratio of SnSx@C_sp/binder (polyvinylidene fluoride (Solef® 6020, Solvay, Belgium))/carbon black (Super P®, Timcal Ltd., Bodio, Switzerland) in NMP (N-methyl-2-pyrrolidinone, AlfaAesar, Ward Hill, MA, USA) solvent. The slurry was deposited onto a metallic current collector (copper foil from Schlenk Metallfolien GmbH & Co KG, Roth, Germany) and dried at room temperature for 24 h. Discs of 10 mm diameter were cut and dried at 110 °C for 24 h under a dynamic vacuum in an oven (Glass Oven B-595, Büchi, Flawil, Switzerland). The mass loading of the electrode material was around 3 mg/cm2.

2.4. Electrochemical Measurements

The electrochemical tests were performed in a three-electrode pouch cell using sodium metal as a counter and a reference electrode, and the investigated material as a working electrode. A total of 1 M NaPF6 in EC:DMC wt. ratio 1:1 (Merck, Darmstadt, Germany) was the electrolyte, and glass fiber (Schleicher&Schüll, Dassel, Germany) was used as the separator. A galvanostat/potentiostat (ATLAS 1361 MPG&T, Gdańsk, Poland) within the potential range from 0.01 V to 3 V versus Na/Na+ was used for the first charging/discharging test.

2.5. GITT

The galvanostatic intermittent titration technique (GITT) analyses were performed with a current pulse of 25 mA/g for 30 min, followed by an open circuit voltage period of 4 h, for electrode materials after the 1st charging/discharging cycle.
The reason for applying a low current was that both the sodium concentration gradient and the potential difference across the electrode material were small. This allows for simplifying the modelling so that the electrode material consists of single particles immersed in the electrolyte. Such an approach is known as the single particle model (SPM) [12]. This model assumes that there is an even distribution of the current flow through the electrode over all the active material. As a result, the ion diffusion flux, including transportation, and side reactions within the particles is uniform. Because the SPM does not take into account the concentration and distribution of the potential change in the electrolyte phase, one must apply relatively small current densities to fulfill the requirements for the SPM approach.
However, one must be aware that the energy storage mechanism in SIBs, similar to that in LIBs, belongs to the pseudo-two-dimensional (P2D) model [13]. This model is very precise in terms of sodium-ion intercalation and deintercalation at the microscale and answers the questions related to concentration and ohmic polarization within SIBs.
Due to the complexity of the P2D model, the SPM model was applied to derive the sodium diffusion coefficient from GITT data.
The spherical geometry or planar geometry of the particles was taken into account for the mathematical derivation of the protocols. To calculate the diffusion coefficient, Fick’s second law must be solved:
c i ( x , t ) t = D 2 c i ( x , t ) x 2
with the initial and boundary conditions
ci(x,t = 0) = c0 for 0 ≤ x ≤ L (where L = l for planar, and L = rsp for spherical geometry)
D c i x x = 0 = j S
c i x x = L = 0
The condition in Equation (4) is because at the electrode material/current collector interface for planar geometry or in the middle of the particle for spherical geometry, the boundary of the sample is assumed to be not permeable for ions. It is known that the concentration of ions affects the value of the diffusion coefficient. However, by applying a small current pulse followed by a long relaxation time, the change in sodium concentration might be neglected.
The change of half-cell potential during a single step of the GITT is shown in Figure 1.
When we perform the single GITT step, we will observe the change in cell voltage from E0 to E2, including an IR drop seen as a potential increase (E1E0). Additionally, the voltage increase from E1 to E2 is attributed to the development of the diffusion overvoltage. Switching off the current is seen as the second IR drop to the potential of E3, followed by relaxation time with the new quasi-equilibrium potential E4. Neglecting both IR drops during the single GITT step, the cell voltage change can be written as
E t = E e q ( x i t )
where xi(t) is the change of the stoichiometry of ions during a pulse:
x i t = c i ( t ) c m a x = x 0 + 2 j S D c m a x f ( τ )
with cmax as the sodium density of the fully sodiated host material, and f(τ) as the function related to the diffusion length time regime ( τ   L 2 D ).
Applying the Weppner and Huggins [8] method, Equations (5) and (6) can be expressed as
d E d t = d E e q ( x ) d x d x i d t = 2 π j S D c m a x d E e q ( x ) d x
that gives a well-known formula for the diffusion coefficient
D = 4 π j S c m a x d E e q / d x d E / t 2
Assuming that sodium concentration is close to equilibrium after relaxation time, d E e q / d x is equal to ΔEs = E4 − E0, and j S c m a x can be presented in the form V m A t p , where Vm is the volume of the intercalated material, A is the electrochemically active surface of the electrode material, and tp is the pulse duration, Equation (8) can be rewritten to
D = 4 π V m A t p Δ E s d E / t 2
Taking into account spherical particle geometry or planar geometry, Equation (9) can be split into
D = 4 π r p 3 t p Δ E s d E / t 2       f o r   s p h e r i c a l   p a r t i c l e
D = 4 π L t p Δ E s d E / t 2       f o r   p l a n a r   g e o m e t r y
If the cell voltage (E) is dependent on t during the current pulse and shows straight-line behavior, Equations (10) and (11) can be even more simplified to the formulae
D = 4 9 π r p t p Δ E s Δ E t 2       f o r   s p h e r i c a l   p a r t i c l e s
D = 4 π L t p Δ E s Δ E t 2       f o r   p l a n a r   g e o m e t r y
where ΔEt = E2E1.

2.6. Calculation Procedure

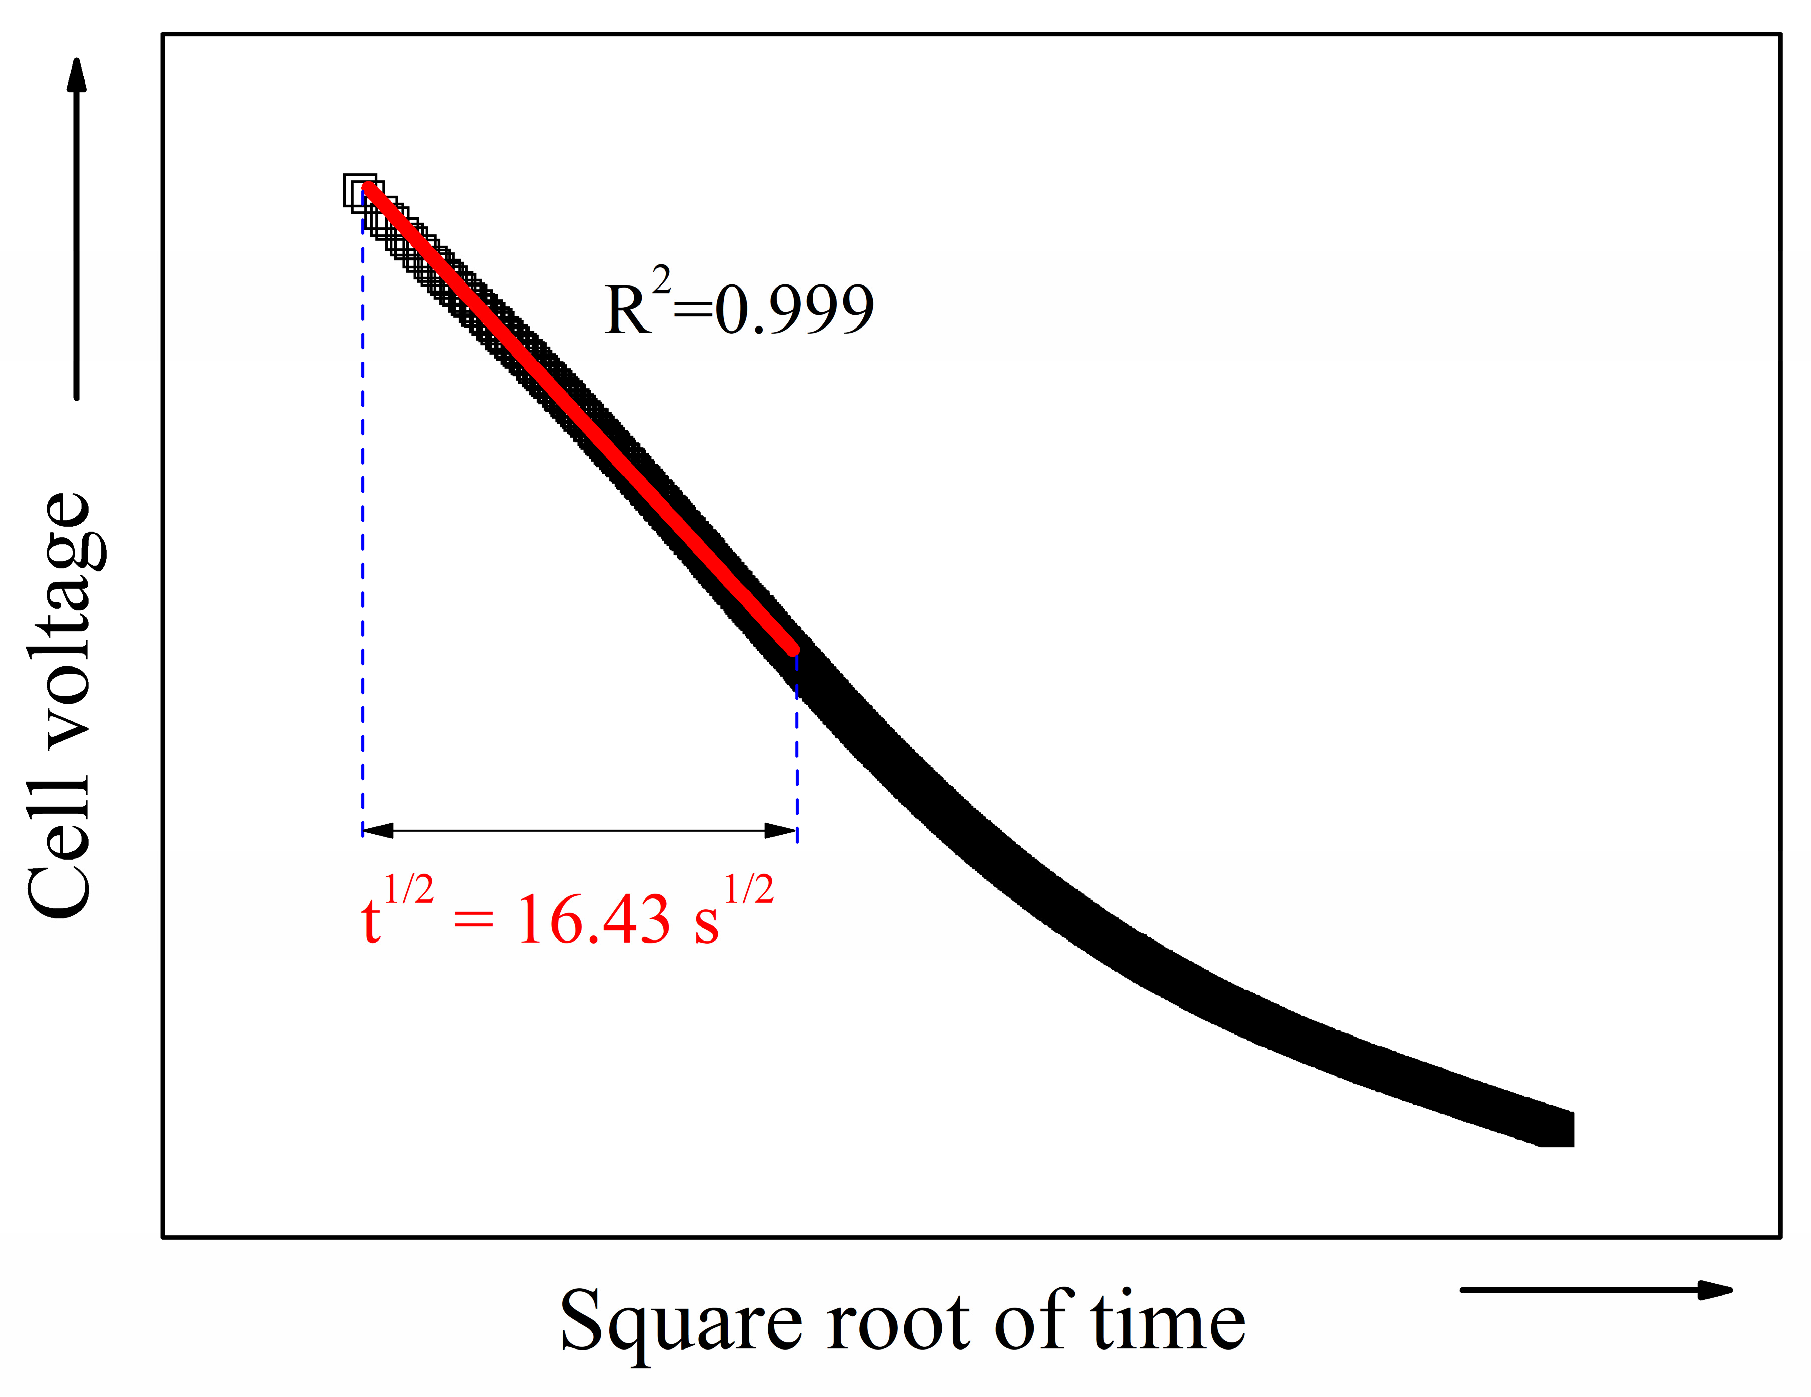
Different protocols were used to calculate the apparent sodium chemical diffusion coefficient. The most simplified approach used for spherical (S1) and planar (P1) geometries was used with Equations (12) and (13), respectively. A more precise calculation of D N a + was based on Equation (10) (S2) and Equation (11) (P2). In this approach, a plot E = f( t ) from E0 to E2 was performed. From this plot, the slope of the straight line from the first 15% of the data points (i.e., 270 s) that obeyed the condition τ L 2 D was used for the calculations (see Figure 2).
The issue related to the proper determination of the potential E1, see Figure 1, might be a challenge due to the charging time of the double layer at the electrolyte/electrode material interface. For the same reason, it is difficult to accurately determine the potential E3. Thus, we modified Equations (12) and (13) to
D = 4 9 π r p t p Δ E s ( E 3 E 0 ) 2       f o r   s p h e r i c a l   p a r t i c l e s
D = 4 π L t p Δ E s ( E 3 E 0 ) 2       f o r   p l a n a r   g e o m e t r y
The reason for this approach is that IR drop values before (E1E0) and after (E2E3) current pulse were expected to be the same. Calculation procedures from Equation (14) and from Equation (15) refer to the spherical (S3) and planar (P3) geometries, respectively.

2.7. EIS

Electrochemical impedance (EIS) measurements were performed using a potentiostat with an integrated impedance analyzer (BioLogic VSP 2078, Seyssinet-Pariset, France) in the frequency range of 100 kHz to 10 mHz and an amplitude of 10 mV for electrode material in the potential range of 0.05 V to 1.5 V vs. Na/Na+.
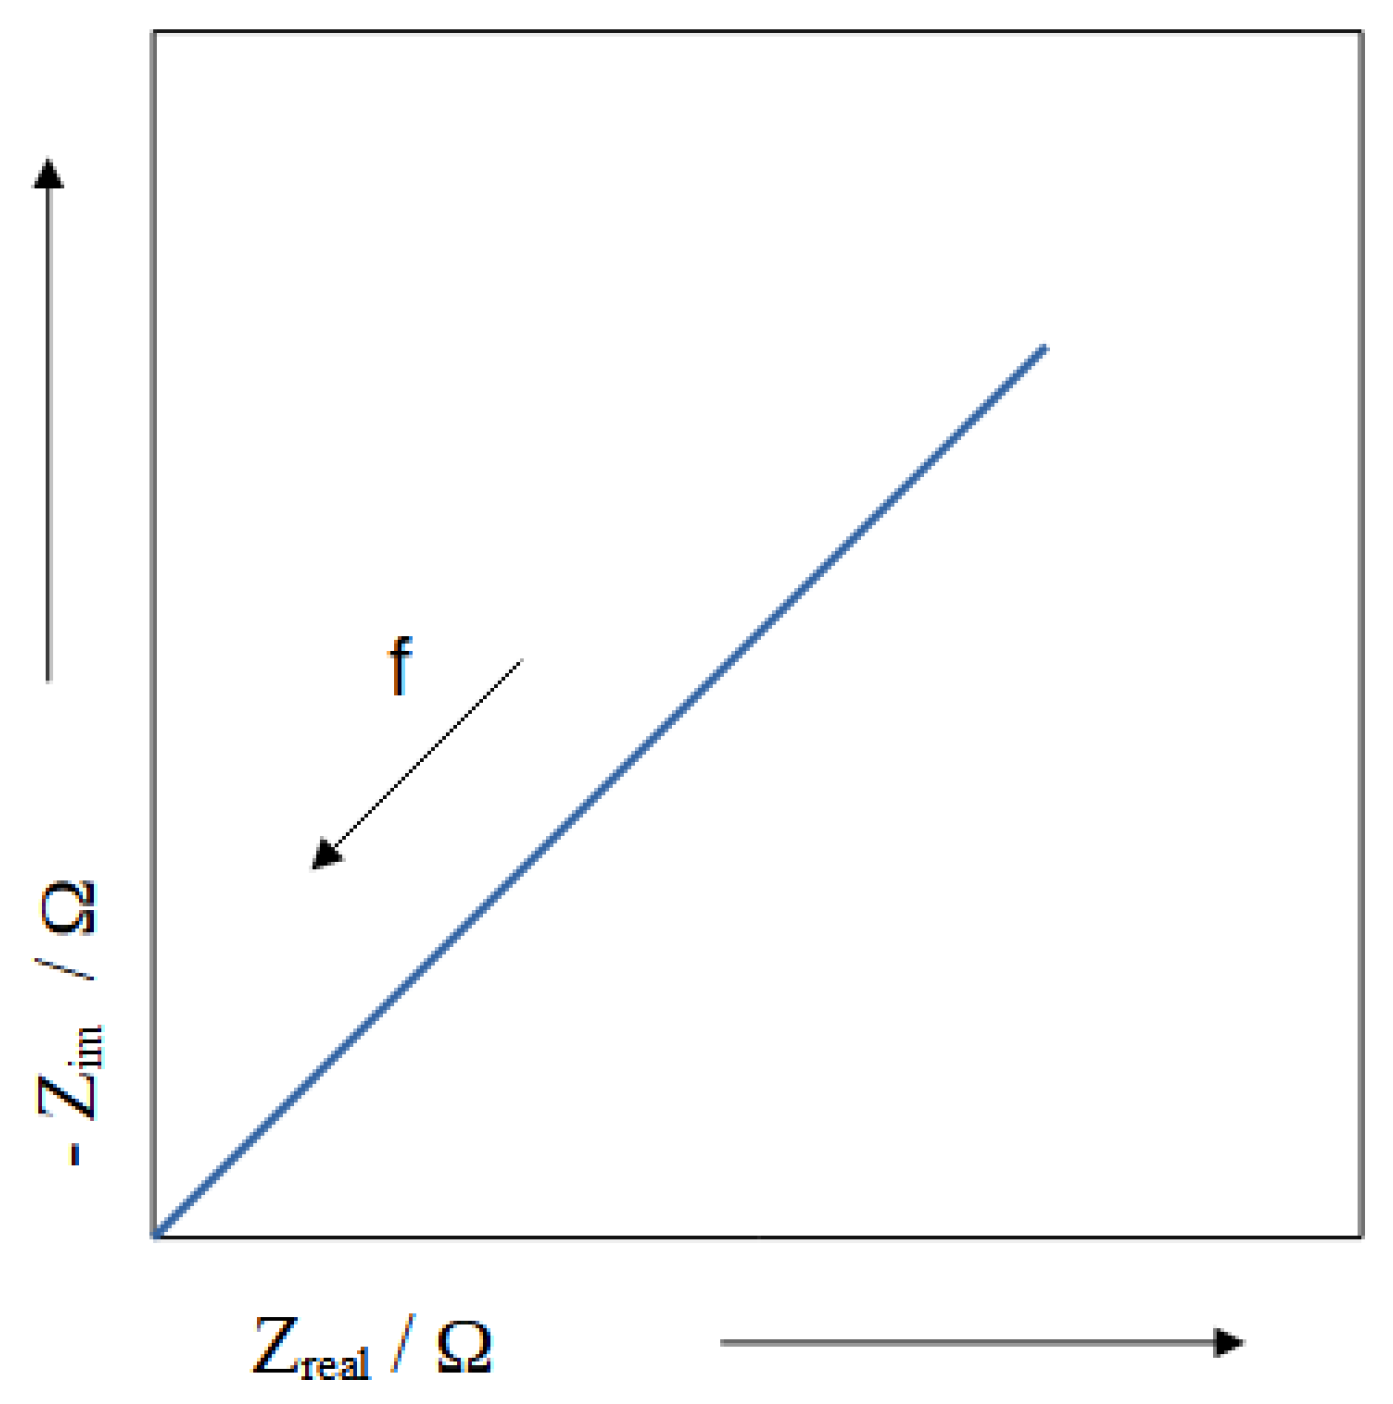
The Warburg impedance element may be used to calculate the diffusion coefficient. Similarly to in the GITT technique, EIS measurements also obey Fick’s second law (see Equation (1)). The graphical representation of the Warburg impedance on a Nyquist plot is seen as a straight line with a slope of 45° (see Figure 3).
The mathematical formula of the Warburg impedance, ZW, is expressed as
Z W = σ W j ω
where pre-factor σW is known as the Warburg coefficient.
For specific ions, σW is given in a form
σ W = R T 2 A n 2 F 2 c i D i
where R is the gas constant (8.314 [J/mol·K]), T is temperature [K], A is the electrode/electrolyte contact area [cm2], n is the number of transferred electrons, F is the Faraday constant (96,500 [C/mol]), ci stands for the concentration of the ions in the solution [mol/cm3], and Di is defined as the diffusion coefficient [cm2/s].
The value of σW can be easily calculated from the relation between the real part (Zreal) and ω according to the equation
Z r e a l = σ W ω 0.5 2
The diffusion coefficient can be calculated from EIS measurements only if the following are satisfied:
(i)
Semi-infinitive diffusion is applied, i.e., ω D i L 2 ;
(ii)
The solution is infinitely dilute;
(iii)
Diffusion takes place to the planar surface geometry;
(iv)
Convection and migration are neglected and only diffusion current occurs;
(v)
Diffusion obeys Fick’s law.
In this manuscript, we assumed that the above conditions are fulfilled and the sodium ion transport through the thickness of the electrode is fast enough.

3. Results and Discussion

A photo of the milled SnSx@C_sp material with particle size distribution and the measured thickness of the film layer is shown in Figure 4a and Figure 4b, respectively. The image in Figure 4a depicts the distribution of particle sizes within the milled SnSx@C_sp material, providing a clear visualization of the range and uniformity of the particles. The particle size analysis indicates that the average size of the spherical particles for the procedures S1, S2, and S3 was approximately 1.7 µm in diameter.
In Figure 4b, the thickness of the film layer is measured and shown, highlighting a consistent thickness of 33.5 µm. This measured thickness was used in the calculations for procedures P1, P2, and P3 to ensure accurate modeling and analysis. The uniformity in both particle size and film thickness is crucial for the consistency and reliability of the experimental results, as variations could significantly impact the performance and characteristics of the material.

Electrochemical Properties

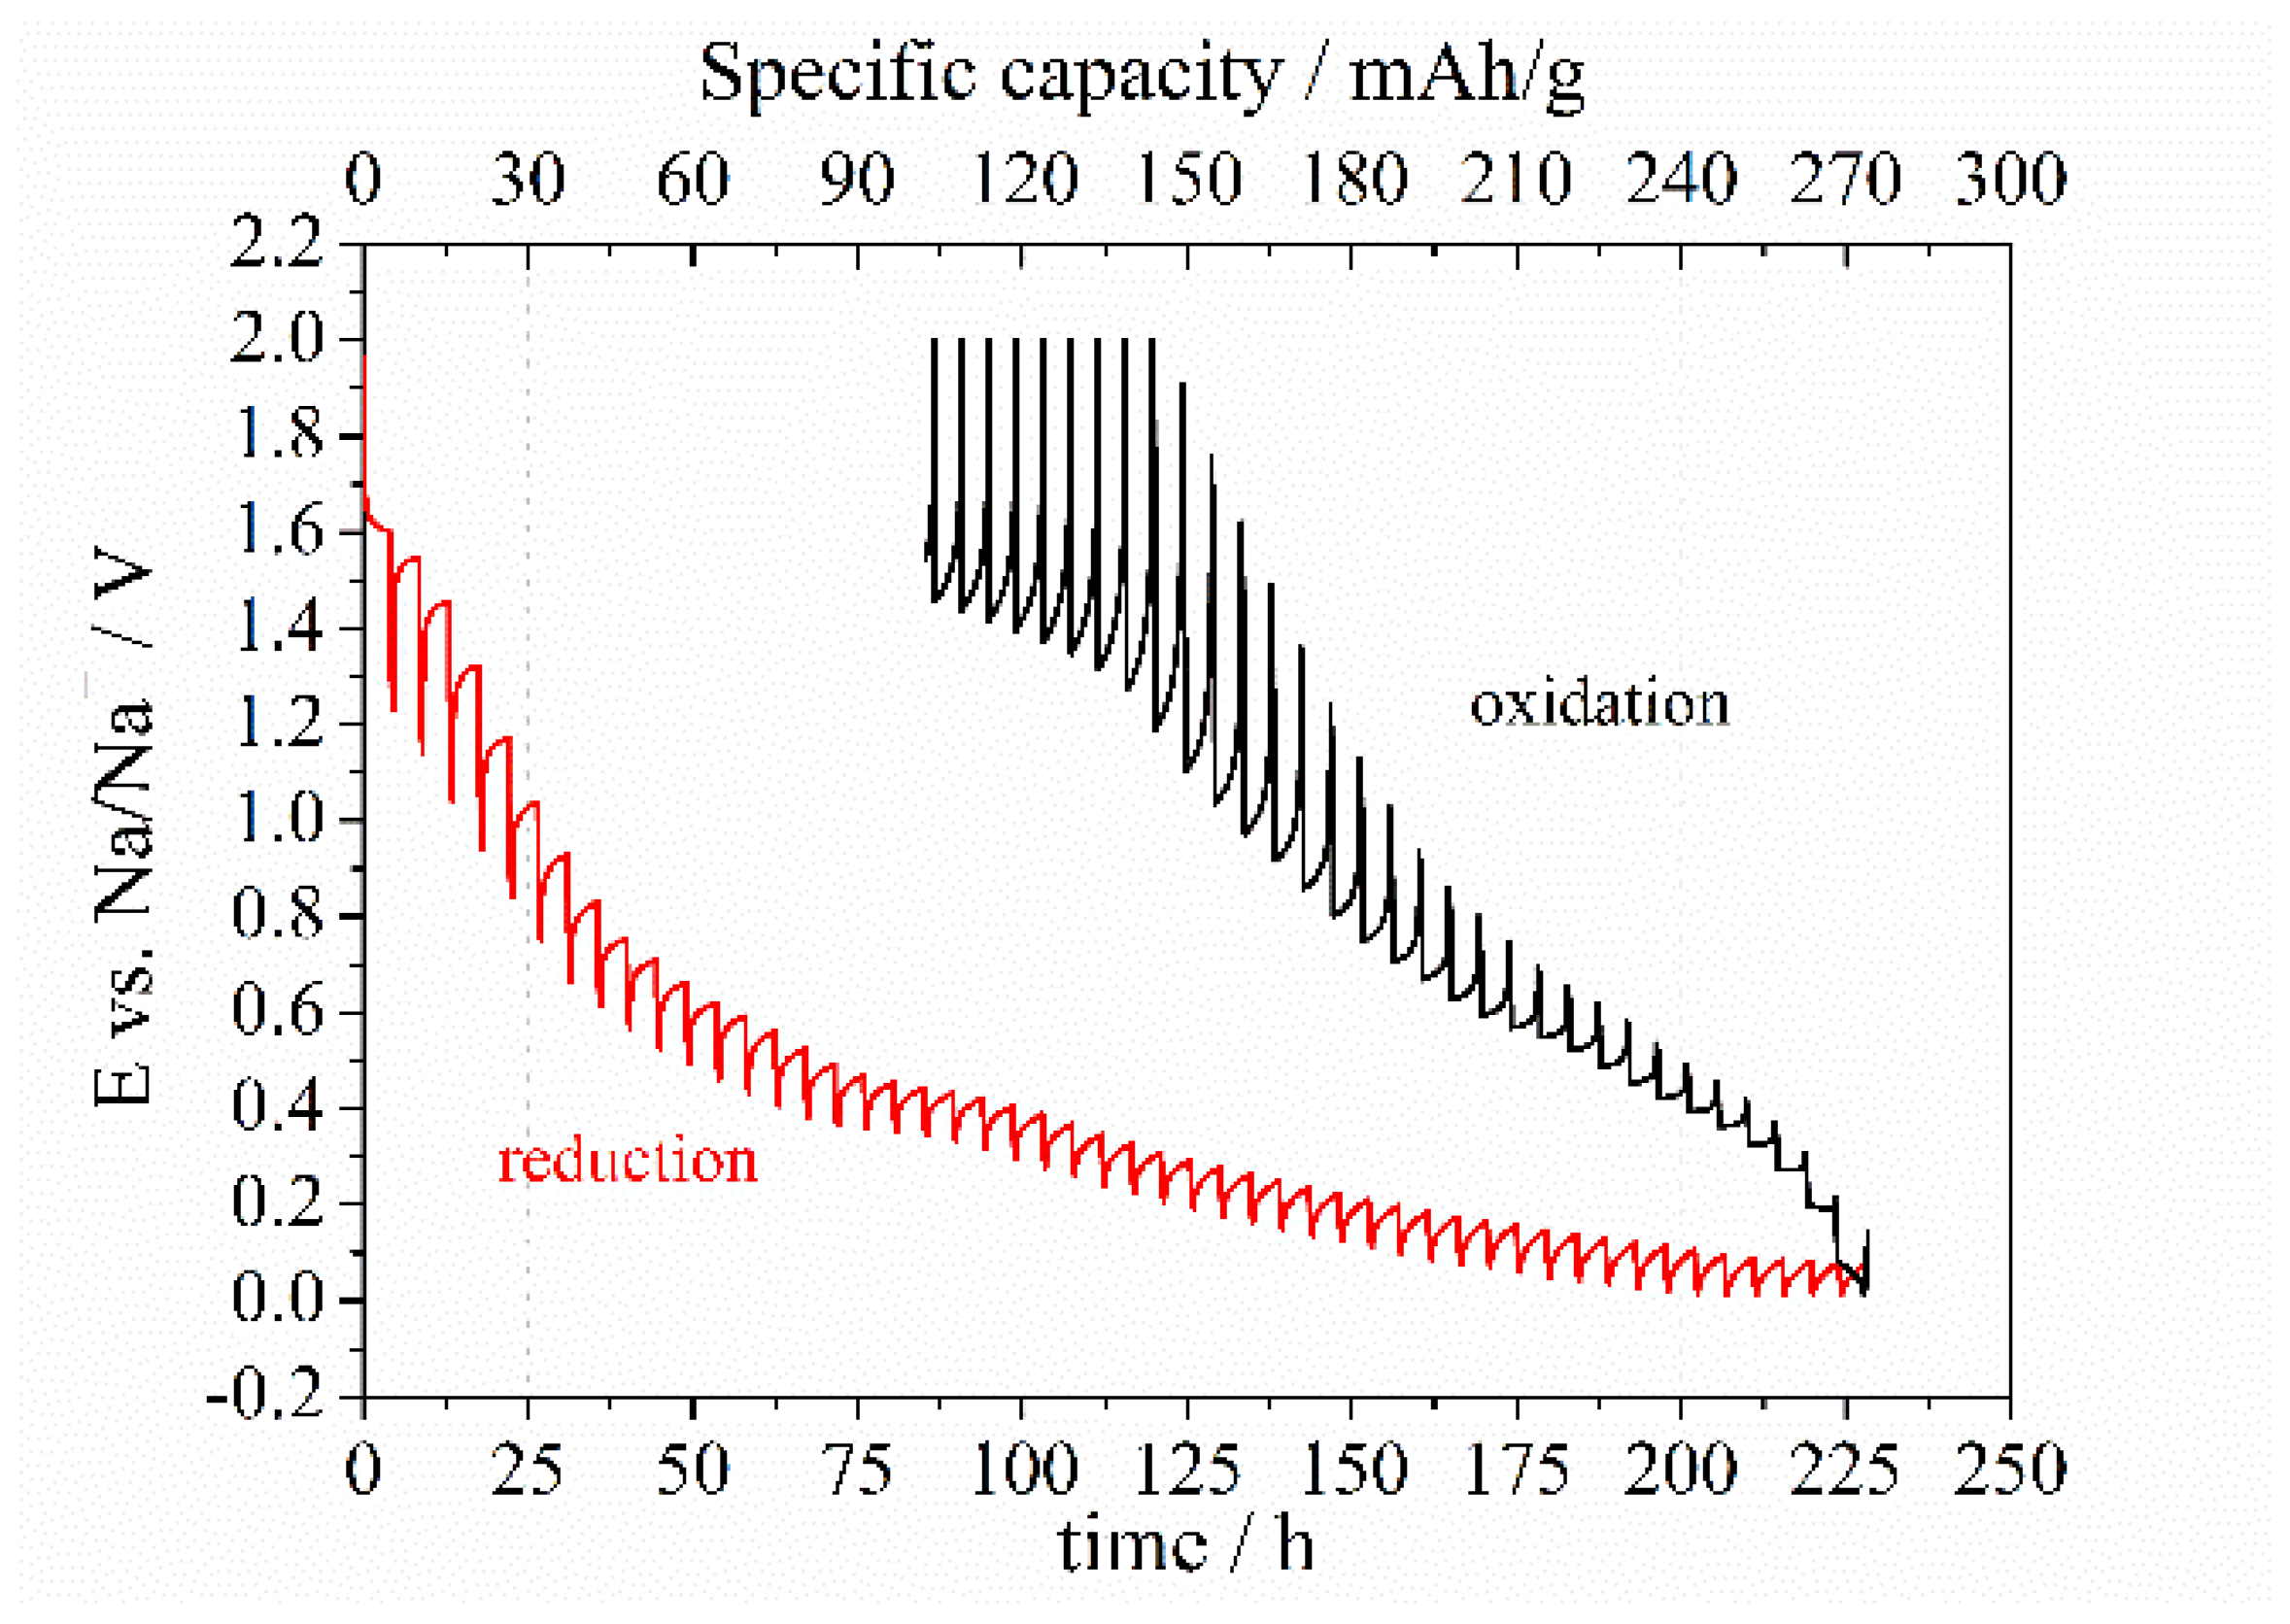
A typical plot of GITT measurements for the SnS@C_sp electrode material during charging and discharging is shown in Figure 5. This plot illustrates the voltage response of the electrode material as a function of time, highlighting the distinct plateaus that correspond to different stages of sodium-ion intercalation and deintercalation.
The shape of the potential response confirms sodium ion insertion into the host material and suggests the degree of sodiation affects intercalation kinetics and the corresponding overvoltage. In addition, the specific capacity of 270 mAh/g during charging was higher than the specific capacity after deintercalation (140 mAh/g). This difference is very likely due to the cut-off procedure that was set to 2 V.
The potentials after IR drop, E1 and E3, were taken from GITT data 4 s after the pulse current was applied and 4 s after the relaxation period started. We assumed that the time delay of 4 s did not affect the total current pulse time. Thus, in all calculations for S1, P1, S3, and P3 protocols, we neglected this difference and took tp = 1800 s for calculations.
Figure 6 compares the apparent chemical diffusion coefficient of sodium ions for the spherical geometry approach. The value varies from 2.3 × 10⁻¹⁵ cm2/s to 1.0 × 10⁻¹¹ cm2/s depending on the potential and the applied protocol for the reduction process.
It is seen that the results overlapped for the S1 and S3 protocols and were in the range of 2.3 × 10⁻¹⁵ cm2/s to 1.0 × 10⁻¹³ cm2/s. This evidences that the potential difference when the current pulse was applied, including IR drop, was similar to the difference between potential E3 and quasi-equilibrium potential at the end of the relaxation time of the previous GITT step. In other words, (E2E1) ≈ (E3E0). The value of the apparent chemical diffusion coefficient for the S2 protocol was three orders of magnitude higher than for the S1/S3 protocols, and varies from 2.3 × 10⁻¹² cm2/s to 1.0 × 10⁻¹¹ cm2/s. The uncertainty in the estimation of the IR magnitude has a significant impact on the diffusion coefficient values calculated from procedures S1 and S3. Thus, the procedure S2 with excluded IR drop was expected to be more accurate.
In the case of discharging, see Figure 6b, the calculated diffusion values seemed to change in a very broad range from 5.1 × 10⁻¹⁵ cm2/s to 1.36 × 10−09 cm2/s. The highest values of the diffusion coefficient were recorded for the lowest potentials and diminished with the potential increase. Similarly for charging, the calculated values from protocol S2 for discharging were higher than those from protocols S1/S3. The shape of the curve = f(E) for the discharging process suggests that sodium ion deintercalation occurs much easier than sodium ion intercalation, i.e., at E = 0.2 V the values of the diffusion coefficient calculated from the S2 protocol are 3.49 × 10⁻¹¹ cm2/s and 1.36 × 10−09 cm2/s for charging and discharging, respectively. Such a phenomenon is known for the insertion/extraction of lithium ions into/from the host materials [14,15] and similar behaviour occurs during the sodiation process.
A direct comparison of the selected protocol evidenced that the only in the potential range from 0.3 V to 0.8 V were the values similar, (see Figure 6c). Below 0.3 V and above 0.8 V, one can see a decrease or increase in diffusion coefficient.
Starting from 2.0 V for charging, the D N a + increases until the content of sodium reaches a value at which further insertion is blocked due to the low mobility of sodium ions in the bulk. As a result, the diffusion coefficient starts to decrease gradually. As the amount of sodium still increases, we observed a more rapid decrease of D N a + . During discharging, we also observed a decrease in the value of the sodium diffusion coefficient with the potential increase. However, the observed phenomenon might be related to the fact that sodium removal from the structure is more favourable than insertion. We believe that a higher D N a + at a lower cell voltage for discharging is caused by the fact that the first ions to be extracted are ions closer to the electrode/electrolyte interface. As these ions are removed, the ions from the bulk are transported to occupy their spots. As a result, we observe a decrease of the diffusion coefficient values. This evidences that the chemical diffusion coefficient in layered sulphides depends on many factors such as applied potential, degree of sodiation, direction of the current flow that affects changes of the lattice parameters in the presence of sodium ions, phase transformation, and the electronic properties of the host material.
A similar shape of the curve of log( D N a + ) = f(E) was observed for protocols calculated for planar geometry, (see Figure 7).
The reliable values seem to be in the potential range from 0.3 V to 0.8 V (see Figure 7c), as was also observed for the S2 protocol (Figure 6c). This is reasonable, as the only difference between protocols is the dimension of the particles used in the calculations. In the planar geometry, the layer thickness was 32 µm, while for the spherical approach the average diameter of the particles was 1.7 µm. Taking into account that the values for planar geometry were in the range from 3.07 × 10⁻¹¹ cm2/s to 7.42 × 10−07 cm2/s for reduction and from 9.14 × 10⁻¹¹ cm2/s to 7.42 × 10−05 cm2/s for oxidation, the planar geometry approach was doubtful. The main difference between the S and P protocols is the value of the calculated diffusion coefficients of sodium ions. Depending on the applied protocol, this varies by about four orders of magnitude at the same potential, i.e., at E = 0.5 V (S1) = 3.37 × 10⁻¹⁴ cm2/s and (P1) = 4.29 × 10⁻¹⁰ cm2/s. The typical value of the diffusion coefficient of sodium ions into the electrode materials is in the range from 10−14 cm2/s to 10−08 cm2/s depending on the material [16,17,18]. The values in the order of 10−05 are expected to occur in aqueous systems [19]. This shows that the procedure is crucial in obtaining a correct estimation of the diffusion coefficient. It also evidences that the planar approach is not valid.
To analyze the GITT results in terms of which protocol is the most reliable, we performed EIS measurements in the potential range from 0.05 V to 2.0 V. In this approach, there was no need to know the thickness or particle size [20].
In Figure 8, we compare the apparent diffusion coefficient of sodium ions calculated from EIS with those of the S1 and S2 protocols from the GITT. One can see that the values calculated from EIS are in the range from 1.54 × 10⁻¹¹ cm2/s to 1.69 × 10⁻¹⁴ cm2/s and change with the cell voltage. The highest value of the diffusion coefficient was for E = 0.05 V and the lowest for E = 1.5 V. This tendency is in agreement with the phenomenon observed for deintercalation during the GITT, i.e., an increase with a potential decrease. It is noteworthy to mention that the values calculated from EIS are placed in between the results obtained from protocols S1 and S2 from the GITT. In the potential from 0.3 V to 0.8 V, the values are of one order of magnitude lower than those from the S2 protocol and one order of magnitude higher than those from the S2 protocol, for both reduction and oxidation. At potentials > 1.0 V, the shapes of the EIS and GITT curves for charging are similar, as are the shapes of the EIS and GITT curves for discharging for E < 0.4 V.
According to the results given in Figure 8, it seems that the value of the diffusion coefficient calculated from EIS is an average value of the values taken from the S1 and S2 protocols. This evidences that the GITT is a technique for which results are sensitive to changes of potential due to the applied current pulse and relaxation time as well as the parameter related to the geometry of the particles.

4. Conclusions

In the present study, we compared different calculation procedures used for determining the apparent chemical sodium diffusion coefficient from GITT and EIS measurements. Diffusion coefficients derived by the different procedures from GITT models can vary by more than an order of magnitude. Procedures 1 and 3 were based on the knowledge of the IR drop, and the obtained values overlapped. The lack of the exact knowledge of the IR drop resulted in the data calculated from protocols 1 and 3 being hard to apply, and the results were doubtful. Instead, procedure 2 was expected to be more reliable as the initial transition region obeyed the t behaviour. Moreover, it was shown that the value of the D N a + varied by a few orders of magnitude when the charging or discharging approach was applied. For all protocols, the diffusion of sodium ions was faster for the deintercalation process than for sodium ion insertion into the host. At low potentials with high sodiation degrees, the double layer charging time was not long enough for sodium ions to be intercalated and to allow sodium ions to be extracted. As a result, the calculated value of D N a + during deintercalation was too high in comparison with the intercalation process and could affect the GITT model. Additionally, by applying different geometries in the calculation process, we evidenced that planar geometry resulted in much higher values of D N a + in comparison with spherical geometry.
The utilization of electrochemical impedance spectroscopy did not agree much with the GITT results. This suggests that electrode thickness and particle geometry have a huge impact on sodium transport in the bulk electrode.

Author Contributions

Conceptualization, A.P.N.; Methodology, A.P.N.; Investigation, A.P.N., P.R., M.S. and K.T.; Resources, A.P.N.; Data curation, P.R.; Writing—original draft, A.P.N., M.S. and K.T.; Writing—review & editing, A.P.N., P.R., M.S. and K.T.; Visualization, A.P.N.; Supervision, A.P.N. All authors have read and agreed to the published version of the manuscript.

Funding

This research was funded by the Gdańsk University of Technology grant number DEC-36/1/2024/IDUB/III.4c/Tc under Technetium Talent Management Grants Program.

Data Availability Statement

The original contributions presented in the study are included in the article, further inquiries can be directed to the corresponding author.

Conflicts of Interest

The authors declare no conflict of interest.

References

  1. Ni, Q.; Bai, Y.; Wu, F.; Wu, C. Polyanion-type electrode materials for sodium-ion batteries. Adv. Sci. 2017, 4, 1600275. [Google Scholar] [CrossRef] [PubMed]
  2. Yabuuchi, N.; Kubota, K.; Dahbi, M.; Komaba, S. Research Development on Sodium-Ion Batteries. Chem. Rev. 2014, 114, 11636–11682. [Google Scholar] [CrossRef] [PubMed]
  3. Hwang, J.Y.; Myung, S.T.; Sun, Y.K. Sodium-ion batteries: Present and future. Chem. Soc. Rev. 2017, 46, 3529–3614. [Google Scholar] [CrossRef]
  4. Gupta, P.; Pushpakanth, S.; Haider, M.A.; Basu, S. Understanding the Design of Cathode Materials for Na-Ion Batteries. ACS Omega 2022, 7, 5605–5614. [Google Scholar] [CrossRef] [PubMed]
  5. Nickol, A.; Schied, T.; Heubner, C.; Schneider, M.; Michaelis, A.; Bobeth, M.; Cuniberti, G. GITT Analysis of Lithium Insertion Cathodes for Determining the Lithium Diffusion Coefficient at Low Temperature: Challenges and Pitfalls. J. Electrochem. Soc. 2020, 167, 090546. [Google Scholar] [CrossRef]
  6. Santos-Mendoza, I.O.; Vázquez-Arenas, J.; González, I.; Ramos-Sánchez, G.; Castillo-Araiza, C.O. Revisiting Electrochemical Techniques to Characterize the Solid-State Diffusion Mechanism in Lithium-Ion Batteries. Int. J. Chem. React. Eng. 2019, 17, 1–19. [Google Scholar] [CrossRef]
  7. Nowak, A.P.; Wicikowska, B.; Trzciński, K.; Lisowska-Oleksiak, A. Determination of chemical diffusion coefficient of lithium ions in ceramics derived from pyrolysed poly(1,2-dimethylsilazane) and starch. Procedia Eng. 2014, 98, 8–13. [Google Scholar] [CrossRef]
  8. Weppner, W.; Huggins, R.A. Determination of the Kinetic Parameters of Mixed-Conducting Electrodes and Application to the System Li3Sb. J. Electrochem. Soc. 1977, 124, 1569–1578. [Google Scholar] [CrossRef]
  9. Levi, M.D.; Gamolsky, K.; Aurbach, D.; Heider, U.; Oesten, R. Determination of the Li ion chemical diffusion coefficient for the topotactic solid-state reactions occurring via a two-phase or single-phase solid solution pathway. J. Electroanal. Chem. 1999, 477, 32–40. [Google Scholar] [CrossRef]
  10. Park, J.H.; Yoon, H.; Cho, Y.; Yoo, C.Y. Investigation of lithium ion diffusion of graphite anode by the galvanostatic intermittent titration technique. Materials 2021, 14, 4683. [Google Scholar] [CrossRef] [PubMed]
  11. Chen, Y.; Key, J.; O’Regan, K.; Song, T.; Han, Y.; Kendrick, E. Revealing the rate-limiting electrode of lithium batteries at high rates and mass loadings. Chem. Eng. J. 2022, 450, 138275. [Google Scholar] [CrossRef]
  12. Li, J.; Adewuyi, K.; Lotfi, N.; Landers, R.G.; Park, J. A single particle model with chemical/mechanical degradation physics for lithium ion battery State of Health (SOH) estimation. Appl. Energy 2018, 212, 1178–1190. [Google Scholar] [CrossRef]
  13. Xue, C.; Jiang, B.; Zhu, J.; Wei, X.; Dai, H. An Enhanced Single-Particle Model Using a Physics-Informed Neural Network Considering Electrolyte Dynamics for Lithium-Ion Batteries. Batteries 2023, 9, 511. [Google Scholar] [CrossRef]
  14. Wang, J.; Pameté, E.; Yan, S.; Zhao, W.; Zhang, J.; He, X.; Supiyeva, Z.; Abbas, Q.; Pan, X. Sodium-ion diffusion coefficients in tin phosphide determined with advanced electrochemical techniques. Electrochem. Commun. 2023, 150, 1–6. [Google Scholar] [CrossRef]
  15. Liu, J.; Yu, X.; Bao, J.; Sun, C.F.; Li, Y. Carbon supported tin sulfide anodes for potassium-ion batteries. J. Phys. Chem. Solids 2021, 153, 109992. [Google Scholar] [CrossRef]
  16. Nguyen, T.Q.; Breitkopf, C. Determination of Diffusion Coefficients Using Impedance Spectroscopy Data. J. Electrochem. Soc. 2018, 165, E826–E831. [Google Scholar] [CrossRef]
  17. Chandra, M.; Khan, T.S.; Shukla, R.; Ahamad, S.; Gupta, A.; Basu, S.; Haider, M.A.; Dhaka, R.S. Diffusion coefficient and electrochemical performance of NaVO3 anode in Li/Na batteries. Electrochim. Acta 2020, 331, 135293. [Google Scholar] [CrossRef]
  18. Quinzeni, I.; Fujii, K.; Bini, M.; Yashima, M.; Tealdi, C. Na+diffusion mechanism and transition metal substitution in tunnel-type manganese-based oxides for Na-ion rechargeable batteries. Mater. Adv. 2022, 3, 986–997. [Google Scholar] [CrossRef]
  19. Vitagliano, V.; Lyons, P.A. Diffusion Coefficients for Aqueous Solutions of Sodium Chloride and Barium Chloride. J. Am. Chem. Soc. 1956, 78, 1549–1552. [Google Scholar] [CrossRef]
  20. Ma, Z.; Peng, Y.; Wang, G.; Fan, Y.; Song, J.; Liu, T.; Qin, X.; Shao, G. Enhancement of electrochemical performance for LiFePO4 cathodes via hybrid coating with electron conductor carbon and lithium ion conductor LaPO4. Electrochim. Acta 2015, 156, 77–85. [Google Scholar] [CrossRef]
Figure 1. Schematic presentation of a single galvanostatic intermittent titration step.
Energies 17 03233 g001
Figure 2. Schematic presentation of the E = f( t ) plot for the reduction process.
Energies 17 03233 g002
Figure 3. Nyquist plot of the Warburg impedance.
Energies 17 03233 g003
Figure 4. Digital photo of the milled SnSx@C_sp material with the particle size distribution (a) and measured thickness of the electrode material layer (b).
Energies 17 03233 g004
Figure 5. GITT curves of the SnSx@C_sp electrode material at a 50 mA/g, 30 min pulse time followed by a 4 h relaxation period. The potential ranges from 0.01 mV to 2.0 V.
Energies 17 03233 g005
Figure 6. Derived diffusion coefficients using different calculation protocols for spherical particle geometry during (a) charging, (b) discharging, and (c) comparison of the calculated log D values from the S2 protocol.
Energies 17 03233 g006
Figure 7. Derived diffusion coefficients using different calculation protocols for planar geometry during (a) charging, (b) discharging, and (c) comparison with those calculated from the P2 protocol.
Energies 17 03233 g007
Figure 8. Comparison of diffusion coefficients calculated from the EIS and GITT protocols.
Energies 17 03233 g008
Disclaimer/Publisher’s Note: The statements, opinions and data contained in all publications are solely those of the individual author(s) and contributor(s) and not of MDPI and/or the editor(s). MDPI and/or the editor(s) disclaim responsibility for any injury to people or property resulting from any ideas, methods, instructions or products referred to in the content.