Abstract
In modern industrial plants, compressed air is the most commonly used energy source; however, it is a source of condensation, which is not desirable for pneumatic equipment. This article describes a model of compressed air drying based on the principle of a refrigeration dryer. However, instead of gas refrigerants, the method proposed is to use cooled compressed air as a cooling medium with a temperature below 273 K. The main objective is to study the possibility of replacing harmful refrigerant gases with a neutral type of coolant. To carry out this research, a test bench containing a plate heat exchanger and a throttling device was designed and manufactured. This study has yielded the following scientific results. Firstly, the Joule–Thompson effect was used during the experiments, which facilitated a reduction in the temperature of the compressed air to 255 K. Secondly, using the expanded air and a plate heat exchanger, the temperature of the main compressed air stream was reduced to 280 K, which is very close to the temperature provided by standard-refrigeration-type compressed air dryers. This suggests that it is possible to use compressed air energy to cool the main stream of warm compressed air after the compressor. In general, the temperature range ensures the compressed air quality at the level of class 4 in accordance with international standards.
1. Introduction
Compressed air is the most commonly used energy source in modern industrial enterprises [1]. The advantages of compressed air over other types of energy sources include its relative safety, ease of production, and the ability to accumulate and store it in high-pressure tanks [2]. Compressed air energy is commonly used for powering pneumatic equipment and tools.
Compressed air can also be used as part of a technological process, for example, for abrasive surface treatment, transporting bulk materials, cooling equipment, or cutting tools. However, compressed air is a source of large amounts of condensate, which is not desirable if trapped in pneumatic equipment, when in contact with abrasive materials, or in contact with food [3]. Therefore, in addition to basic parameters such as capacity and pressure, compressed air must meet certain quality parameters. One of the main quality parameters is the humidity level—the lower the humidity, the higher the quality of compressed air.
The quality of compressed air is classified according to the international standard ISO 8573-1:2010 [4], which separates quality classes based on humidity and is determined by the pressure dew point.
To solve the problem of removing water vapour from compressed air, special equipment is used, which includes cyclone separators, air aftercoolers, refrigeration dryers, membrane dryers, and cold or hot regeneration adsorption dryers [5]. The use of one or another type of equipment to reduce the humidity in compressed air depends on the technological requirements or economic feasibility. Each of the above-mentioned devices has its own maximum capacity to dry compressed air and achieve a certain dew point. Most production processes use compressed air with a dew point of +3 °C. To achieve this parameter, refrigeration dryers are usually used. Dehumidification is based on the principle of cooling compressed air, followed by the process of water vapour turning into liquid; then, the condensate is removed using separation devices. The main disadvantage of such dehumidifiers is the use of ozonating refrigerants R134 or R404 [6], which, moreover, easily leak through possible leaks in the refrigeration cycle, and afterwards the dehumidifier becomes inoperable and requires repair work.
Compressed air is produced by a compressor; however, the temperature of the compressed air after the compressor can reach 80 °C, which is unacceptable for use in compressed air dryers. Therefore, intermediate aftercoolers are used to reduce the compressed air temperature to a temperature of 10 °C higher than the ambient temperature.
After leaving the aftercooler, the compressed air contains residual moisture in the form of vapour, which condenses and settles in the system, leading to corrosion. That is why the use of dehumidifiers is necessary; however, the disadvantages of refrigeration dryers include the use of ozonating refrigerants R134 or R404 [7].
The following is a brief analysis of alternative refrigeration systems that can theoretically be used to implement compressed air cooling in pneumatic systems of industrial enterprises.
To reduce the load on electrical networks when cooling and conditioning large rooms or apartment buildings, the authors in [8] propose to use the method of expansion cooling, which allows the temperature of a liquid or gas to decrease as a result of its volume expansion or pressure reduction. This process can be realised by producing compressed air using air compressors during periods of low demand or high-renewable-energy production and then storing it in underground caves or high-pressure containers. The compressed air is then used to cool the premises using throttle expansions and heat exchangers without the need for standard air conditioning or ventilation systems. However, this process is only possible if there is significant renewable energy production and large-scale compressed air storage.
To achieve very low temperatures of around —140 °C in industrial applications, a Brayton cryocooler can be used, which uses nitrogen as the working fluid [9,10]. The Brayton cryocooler can be used for air conditioning, medical applications (e.g., storage of COVID-19 vaccines), and in the food industry to freeze various food products at very low temperatures. The Brayton refrigeration cycle is based on the principle of expanding compressed gas, in this case nitrogen, in a turbine. The main equipment that makes up the regenerative cycles is a compressor and a displacement piston, separated by an evaporator, a regenerator, and a condenser. The use of the Brayton cycle for cryogenic applications—combined with the use of nitrogen as the working fluid—seems promising in many respects but most research is focused on numerical design and optimisation proposals that are not supported by experimental data, and the cryogenic capacities tested for nitrogen Brayton cycles hardly exceed the cooling capacities of more than a few hundred watts, reaching cryogenic temperatures under steady-state conditions. Another significant disadvantage of the Brayton cryocooler is the high cost of the initial unit (turbine and centrifugal compressor), which can reach around EUR 70,000. The authors of the article [10] present the results of an energy analysis of the performance of the Brayton cryocooler prototype. To simulate the cooling effect, an electric heater with a power of 15.6 kW was installed in the design of the prototype, and the power of the electric motor for the operation of the piston compressor was 53.7 kW.
In study [11], the Hampson cryocooler is proposed to obtain low temperatures, which operates on the principle of a Joule–Thompson cryocooler and uses a spiral heat exchanger with argon as a working medium. The spiral heat-exchanger recuperator consists of three parts: an outer tube—a Monel alloy shell; an inner tube—a Monel alloy mandrel; and a stainless-steel capillary tube that spirals around the mandrel to carry high-pressure liquids. The heat exchanger also uses two types of fins with different geometrical parameters: firstly, fins with a dense fin pattern, and then the use of fins with a sparse pitch. This allows for a 9% increase in cooling capacity. The main disadvantage of the Hampson cryocooler is the mandatory use of hermetic gas cylinders with argon or nitrogen gases, which increases the cost of the cryocooler and requires special conditions of use.
Another interesting cooling process is discussed in the study [12]. The authors describe a model of a dehumidification process called Claridge–Culp–Liu (CCL), which is a new and efficient approach for removing water vapour from air using a combination of membrane separation, vacuum compression, and sub-atmospheric condensation. The basic theory behind this process is to separate water vapour from the humid air flowing through one side of a membrane by applying a partial vacuum to the opposite side of the membrane and, then, compressing the water vapour for saturation pressure at the humid-ambient-air thermometer temperature to facilitate condensation. The cooling process has a fundamental efficiency limit that approaches the Carnot limit but requires between 26% and 56% of the energy required for a Carnot vapour compression system. The condenser can be cooled by either ambient air or cooling tower water, as is commonly performed in a compression refrigeration system. A vacuum pump for this system is required to remove non-condensables from the original system as well as non-condensables that seep through the membrane during operation. The CCL dehumidification system has the following advantages: (1) No use of a HFC refrigerant. (2) Direct isothermal control of the setpoint humidity coefficient. (3) Maximum capacity occurs at designed conditions. (4) The system generates clean water extracted from the air as a by-product. However, effective dehumidification still requires the use of cooling towers, which increases the cost of the process and requires special operating conditions. In addition, the CCL cooling process is currently in the design phase and is not used in practice.
Existing refrigerators and freezers in households account for around 6% of electricity generated globally. These cooling systems typically use R134a gas refrigerant. In the article [13], the authors experimentally investigate a dual-temperature R290/R600a refrigeration system based on a split condensation approach with two evaporators. The study demonstrated that the use of R290/R600a in a home refrigerator can reduce energy consumption by 12.3% compared to R134a. The main components of this refrigeration system—which uses an azeotropic blend of refrigerants—include a compressor, two condensers, a sub-cooler, a phase separator, two suction-line heat exchangers, two needle-metering valves as expansion devices, and two parallel evaporators installed in their respective cabinets. Theoretical results showed the potential for performance improvement compared to a conventional refrigeration cycle.
A popular type of refrigeration system is the thermally driven ejector refrigerator, which is powered by heat that can be generated from industrial waste heat, solar water heaters, geothermal energy, etc. Ejector chillers are simple in design and easy to operate and maintain. An ejector cooler consists of a generator, evaporator, ejector, condenser, liquid pump, and measuring instruments. An immersion electric heater is used to generate heat for the generator and evaporator. The working fluid in such refrigeration systems is usually R141b gas, which is a type of HCFC refrigerant. In an ejector refrigeration system, the ejector is an important piece of equipment that affects the efficiency of the refrigeration cycle. The ejector used in a refrigeration system is similar to a mechanical compressor, so it is known as a ‘thermal compressor’ because it is powered by heat. The performance of an ejector refrigeration system depends on the geometry of the ejector nozzle, namely the ratio of the nozzle area to the operating conditions [14].
Analysing various variants of cooling systems for premises or technological processes in industry, described in studies [8,10,11,12,13,15], it can be concluded that these systems are difficult to adapt for cooling compressed air in pneumatic systems of industrial enterprises. Firstly, they require the mandatory availability of large-volume compressed air storage facilities in the form of underground storage facilities or large-sized above-ground compressed air tanks. Secondly, some technologies involve the use of a cooling tower, which is also expensive and requires special industrial construction. Thirdly, the use of various types of cooling gases—such as R290, R600a, R141b, nitrogen, or argon—are harmful for the environment or require special equipment and storage conditions.
Thus, this article is devoted to the development of a model of compressed air drying based on the principle of a refrigeration dryer but instead of gas refrigerants, the method proposed is to use cooled compressed air with a temperature below 273 K as a cooling medium. Thus, the objective of the research described in this article is to study the possibility of replacing harmful cooling gases with a neutral type of coolant. To conduct this study, a test bench was designed and manufactured, the description of which is presented in this manuscript. The results obtained are presented in the form of graphs that show the potential use of compressed air energy for the process of cooling the main stream of warm compressed air after the compressor to a temperature that will ensure the quality of compressed air at the level of class 4, for a dew point of +3 °C under pressure, in accordance with the standards specified in ISO 8573-1:2010.
The main objective of this study is to develop a model of a compressed air dryer that will operate similarly to a standard refrigeration dryer. The fundamental difference will be the replacement of ozonating R134 or R404 refrigerants with cooled compressed air with a temperature below 0 °C. The process of heat exchange between the main warm and humid compressed air stream from the compressor and the pre-cooled air stream, which will act as a refrigerant, will then take place.
2. Research Methodology
2.1. Diagram of a Refrigeration Dehumidifier
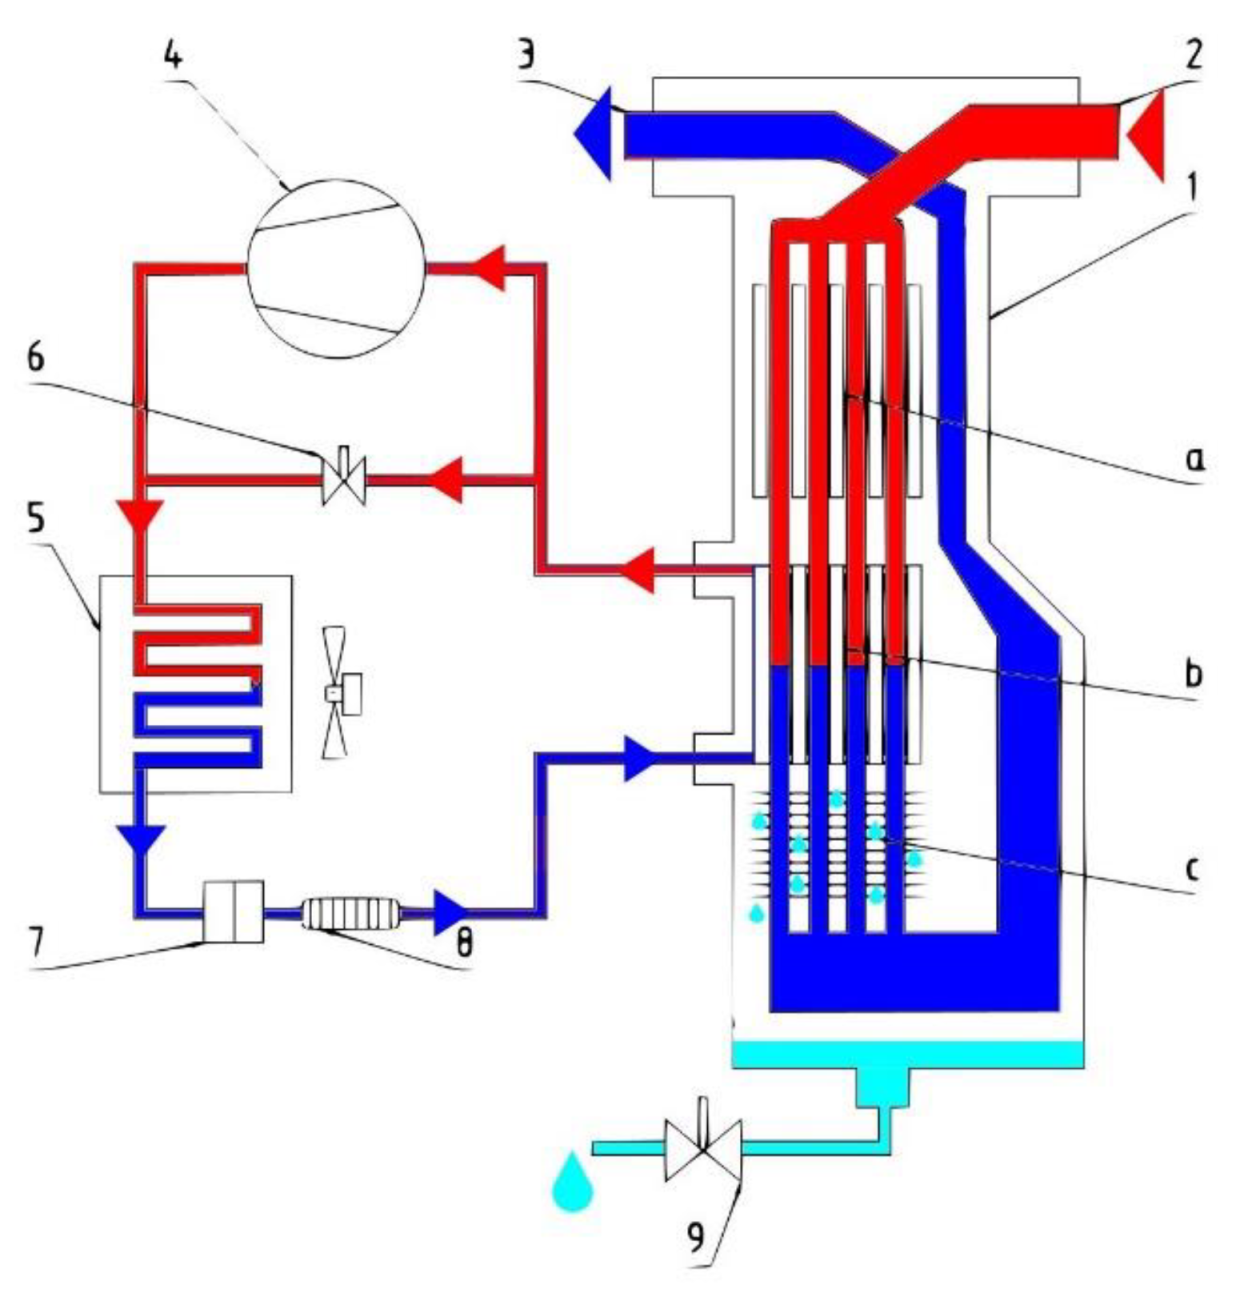
In refrigerant dryers (Figure 1), compressed air is cooled to a temperature as low as possible to condense the moisture present in the air.
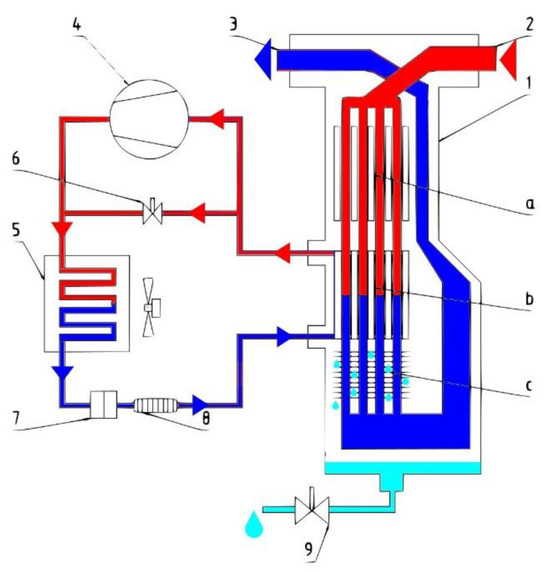
Figure 1.
Diagram of the refrigeration dryer (13-in-1 heat exchanger: a. air/air heat exchanger, b. air/coolant heat exchanger, c. separator; 2—compressed air inlet; 3—compressed air outlet; 4—compressor; 5—condenser; 6—hot gas bypass valve; 7—filter; 8—capillary tube/thermal expansion valve; 9—condensate drain).
The refrigeration dryer consists of air and refrigeration circuits.
In the air circuit, hot and humid air enters the 3-in-1 heat exchanger 1. The air flow then passes through the evaporator, which acts as a heat exchanger between the compressed air and the refrigerant. The temperature of the compressed air is reduced to around 2 °C, which causes water vapour to condense. The condensate is collected in a separator and removed through a condensate drain. The cooled and dehumidified compressed air is returned through an air/air heat exchanger, where it is heated to a temperature that is approximately 5 °C lower than the compressed air inlet temperature.
The main element of the refrigeration circuit is the compressor, which compresses the refrigerant, enters the condenser under high pressure, is cooled by heat exchange with the ambient air, and condenses. The condensed refrigerant passes through a capillary tube, which causes its pressure to drop alongside temperature. At low pressure, the liquid refrigerant enters the heat exchanger and is heated by the compressed air at the heat exchanger inlet, causing the refrigerant to evaporate. The low-pressure gaseous refrigerant is returned to the compressor, which compresses it and the cycle repeats. If the flow of compressed air through the chiller is reduced and the refrigerant load is lowered, the excess refrigerant is automatically passed through the hot-gas bypass valve back to the compressor.
This dryer consists of a heat exchanger and refrigerating unit. The heat exchanger is an air-to-air pre-cooler. The refrigerating unit is an air-to-refrigerant unit. Warm and humid compressed air is first passed through the heat exchanger. The air gets pre-cooled to a near-ambient temperature condition of the heat exchanger. The moisture present in the air becomes condensed corresponding to the temperature in the heat exchanger and water is precipitated.
Refrigeration dryers can produce dew points in a range from 1.7 °C to 10 °C (35 °F to 50 °F) at system operating pressure. A lower dew point is not feasible in this type of dryer as the condensate would freeze at 0 °C (32 °F) or a lower temperature. The advantages of refrigerant-type air dryers include their compact dimensions; being easy to install, operate, and maintain; low capital costs, maintenance costs, and operating costs; constant dew point; no need for chemical or desiccants; and easy condensate separation [16]. The disadvantages of refrigerant-type air dryers include the limited dew point capability and the problem of refrigerant leakage [17].
According to the 4th quality class, compressed air must have the following characteristics: maximum number of particles per 1 m3—1·105; maximum value of particle size—5 μm; dew point at 7 bar—+3 °C; oil and vapour inclusion—5 mg/m3.
To obtain an air stream with a temperature below 0 °C, we will use one of the easily accessible methods, namely, the Joule–Thompson effect [15], which facilitates a reduction in the temperature of compressed air during its passage through the throttling device.
To ensure the heat exchange process between two air streams with different temperatures, we will use a plate heat exchanger. To ensure higher heat exchange between the heat transfer fluids in the heat exchanger, we will use a countercurrent scheme of heat transfer fluids [18].
2.2. Description of the Test Bench
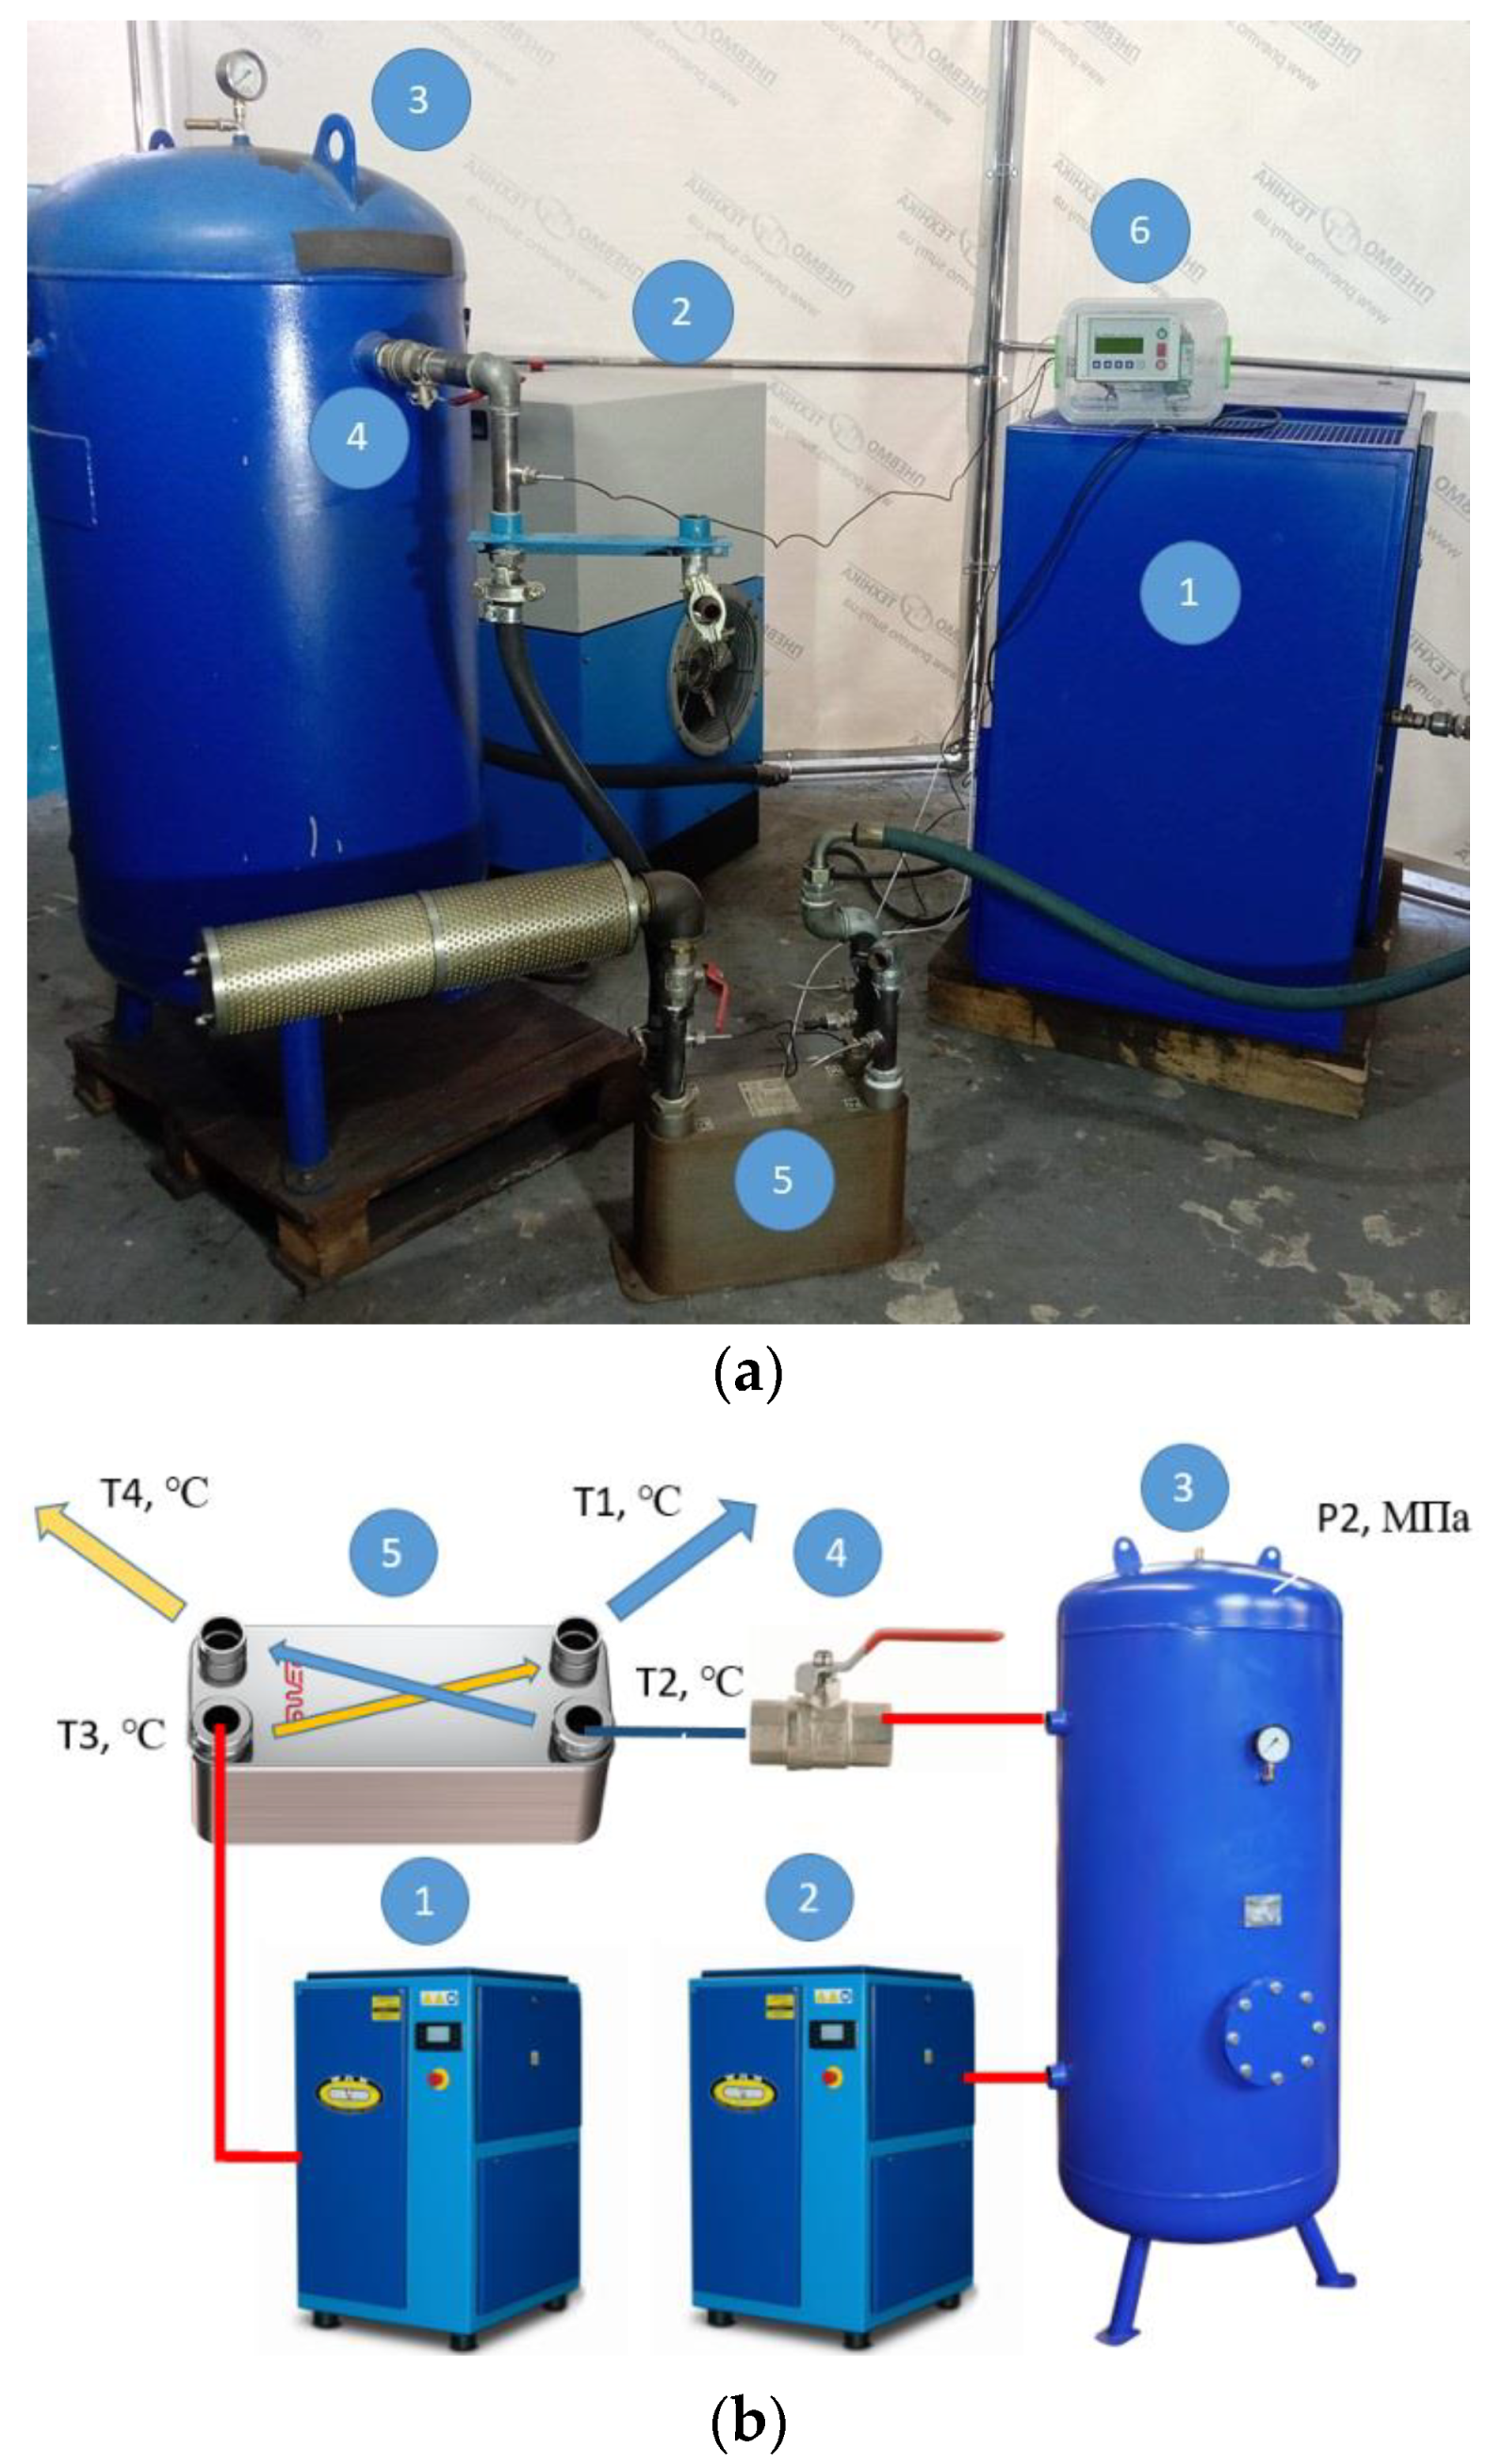
To achieve the research goal, a test bench was developed and implemented, as shown in Figure 2. The equipment used for the test bench is summarized in Table 1.
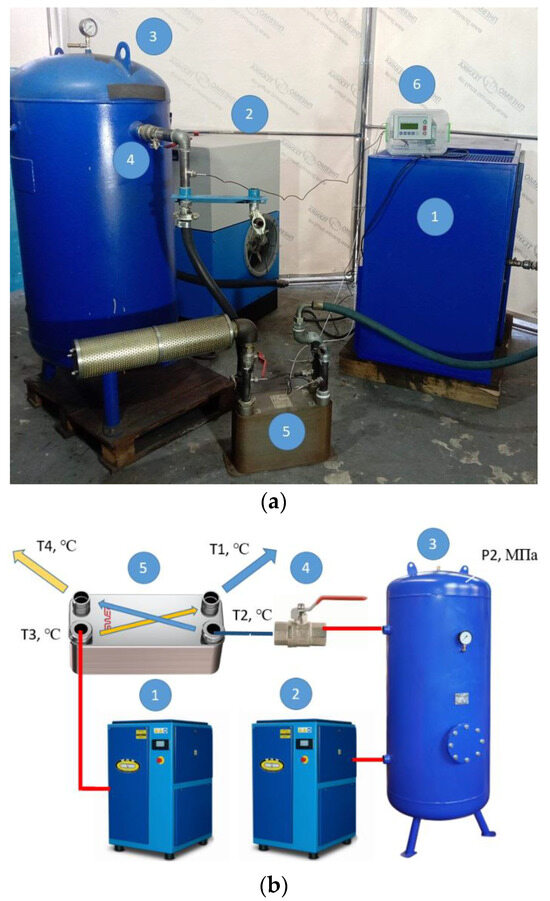
Figure 2.
Photo (a) and scheme (b) of the test bench. Scheme of the test bench (1—screw compressor WAN-NK60; 2—screw compressor CompAir START-031; 3—vertical receiver PB 300.600; 4—ball valve 1 ½”; 5—plate heat exchanger FUNKE TPL 01-K-60-22); 6—microprocessor controller COMCONT-M.

Table 1.
Table of the equipment used for the test bench.
The developed test bench is powered by two screw compressors. The first screw compressor WAN-NK60 (item 1, Figure 2) is used as the main compressor to supply warm and humid compressed air with the parameters Q = 2.37 m3/min, P = 6.2 bar, and T3 = 28.8–29.4 °C to the plate heat exchanger (item 5, Figure 2). The second CompAir START-031 screw compressor (item 2, Figure 2) is used to fill the receiver (item 3, Figure 2) with compressed air. The volume flow rate at which the receiver is filled is Q = 2.44 m3/min. The receiver with a volume of V = 0.33 m3 is filled with compressed air to a pressure of P2 = 0.906 MPa, and the air temperature in the receivers is T = 26 °C.
After that, the ball valve is fully opened (item 4, Figure 2) and the compressed air leaves the receiver within 76 s, being throttled and cooled to a temperature of T2 = 18.8 °C. In the heat exchanger, heat is exchanged between the compressed air T3 and the cooled air T2. At the outlet of the heat exchanger, the reduced temperature of the main compressed air stream T1 is obtained. All parameters of T1, T2, T3, T4, and P2 are recorded by the COMCONT-M microprocessor controller and stored in an Excel table.
3. Results
This study was carried out in three modes to determine the mode of compressed air outflow from the receiver, which would result in the lowest temperature T2 after the ball valve: a constantly partially open ball valve, a constantly fully open ball valve, and a mode in which the ball valve was opened quickly and completely to discharge the entire volume of compressed air from the receiver.
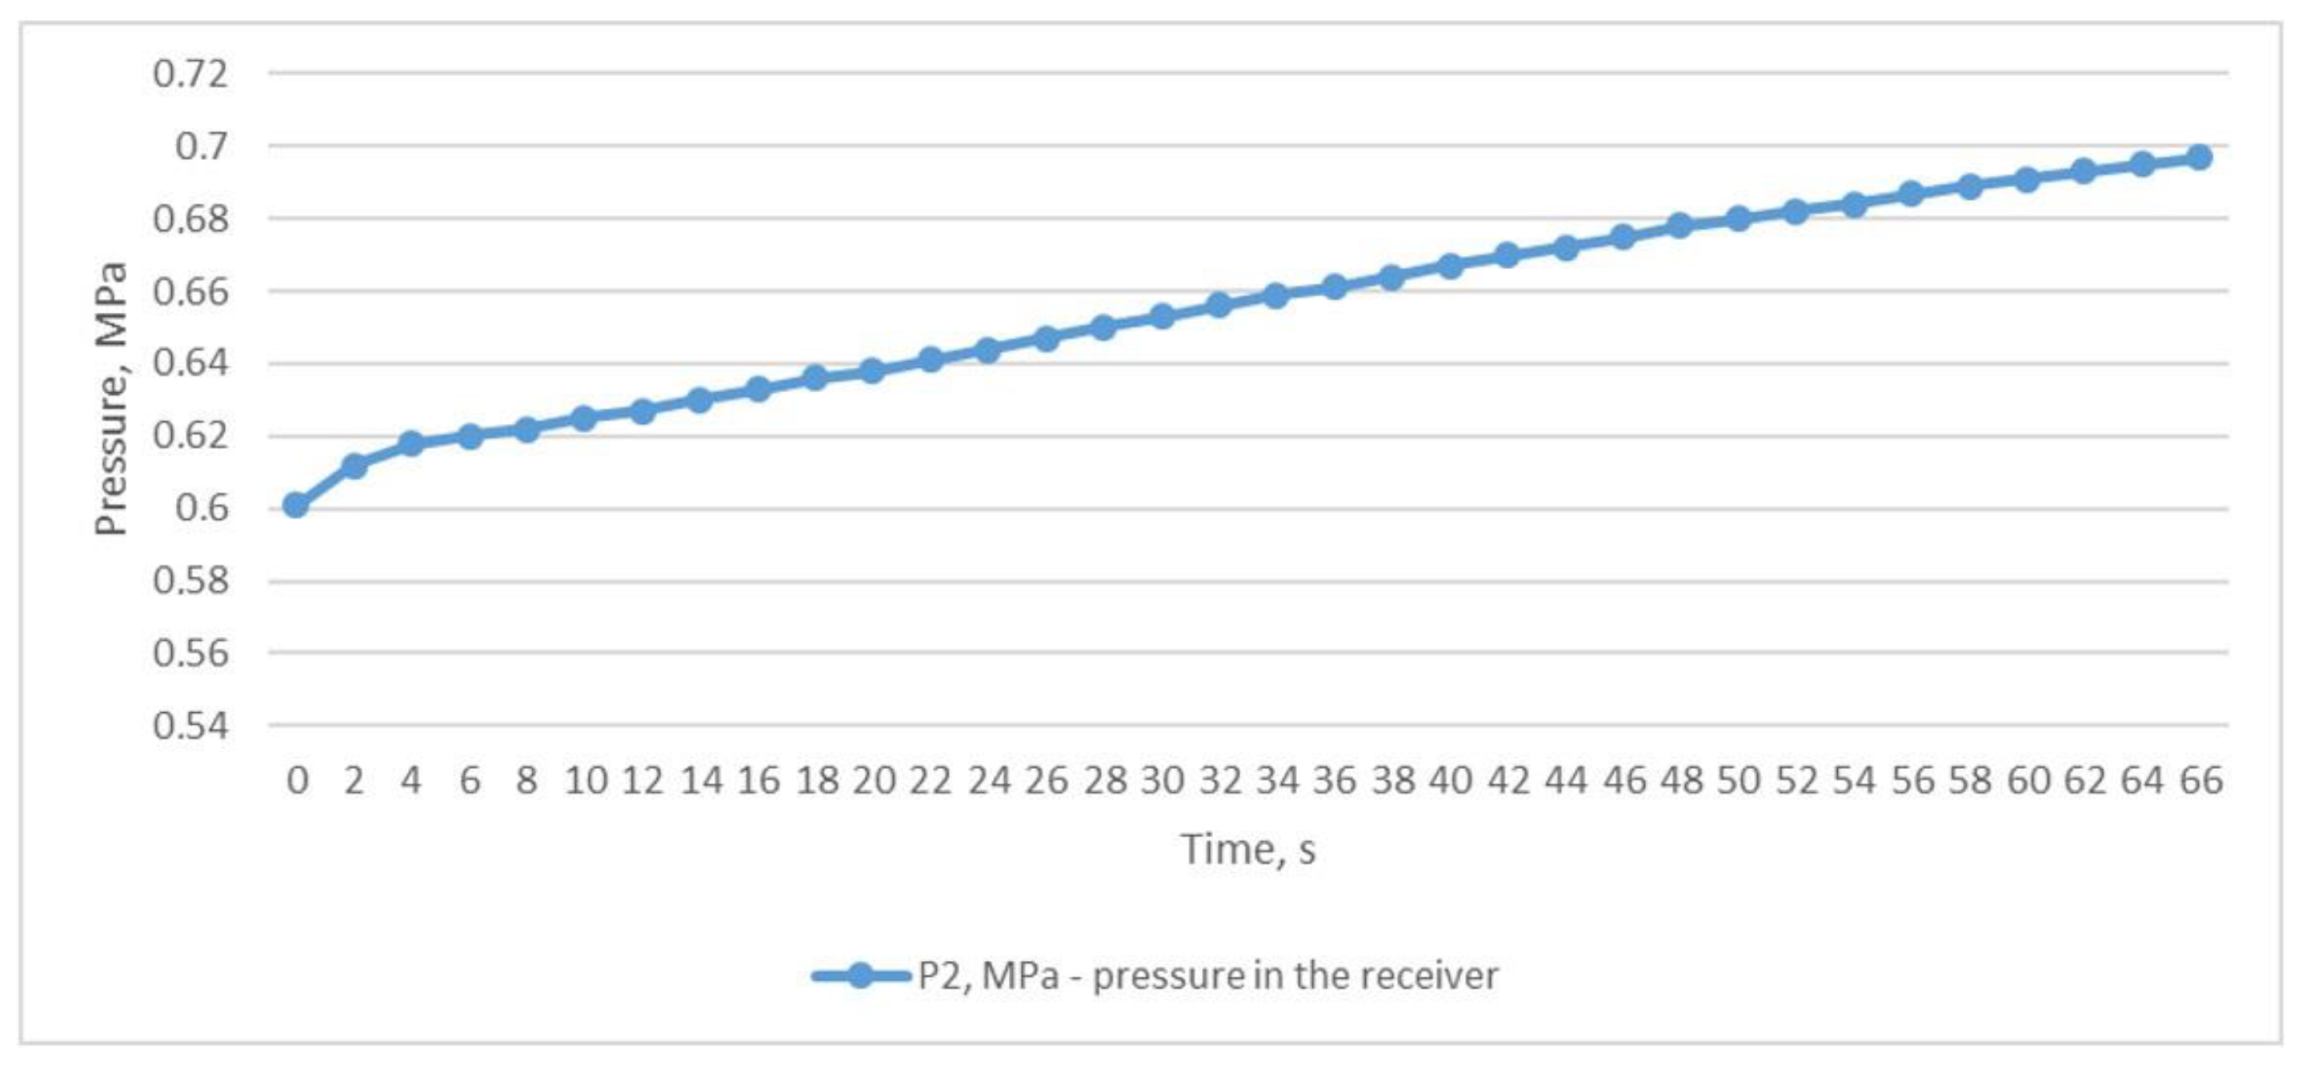
During the first study, the ball valve was partially opened and the pressure in the receiver P2 was maintained in the range of 0.601–0.697 MPa (Figure 3) due to the constant supply of compressed air from the CompAir START-031 compressor (item 2, Figure 4). A slight increase in pressure is due to the fact that in manual mode it is difficult to balance the volume of air entering and leaving the receiver through the partially covered throttle but this did not fundamentally affect the results.
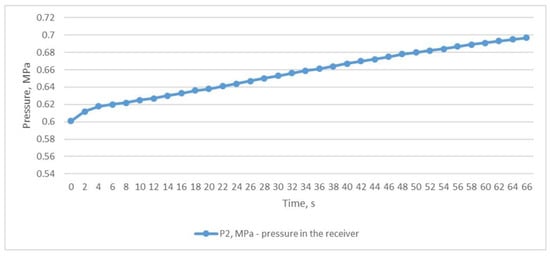
Figure 3.
Air pressure in the receiver with the throttle partially opened.
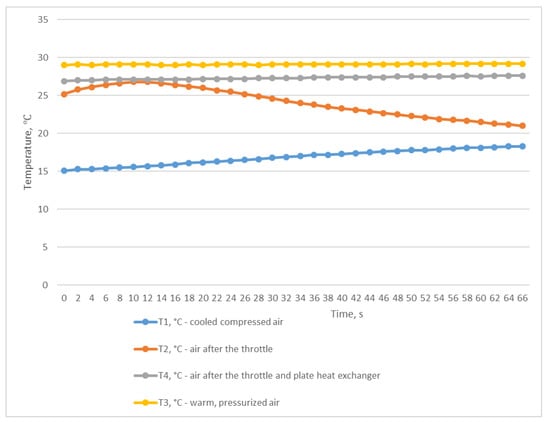
Figure 4.
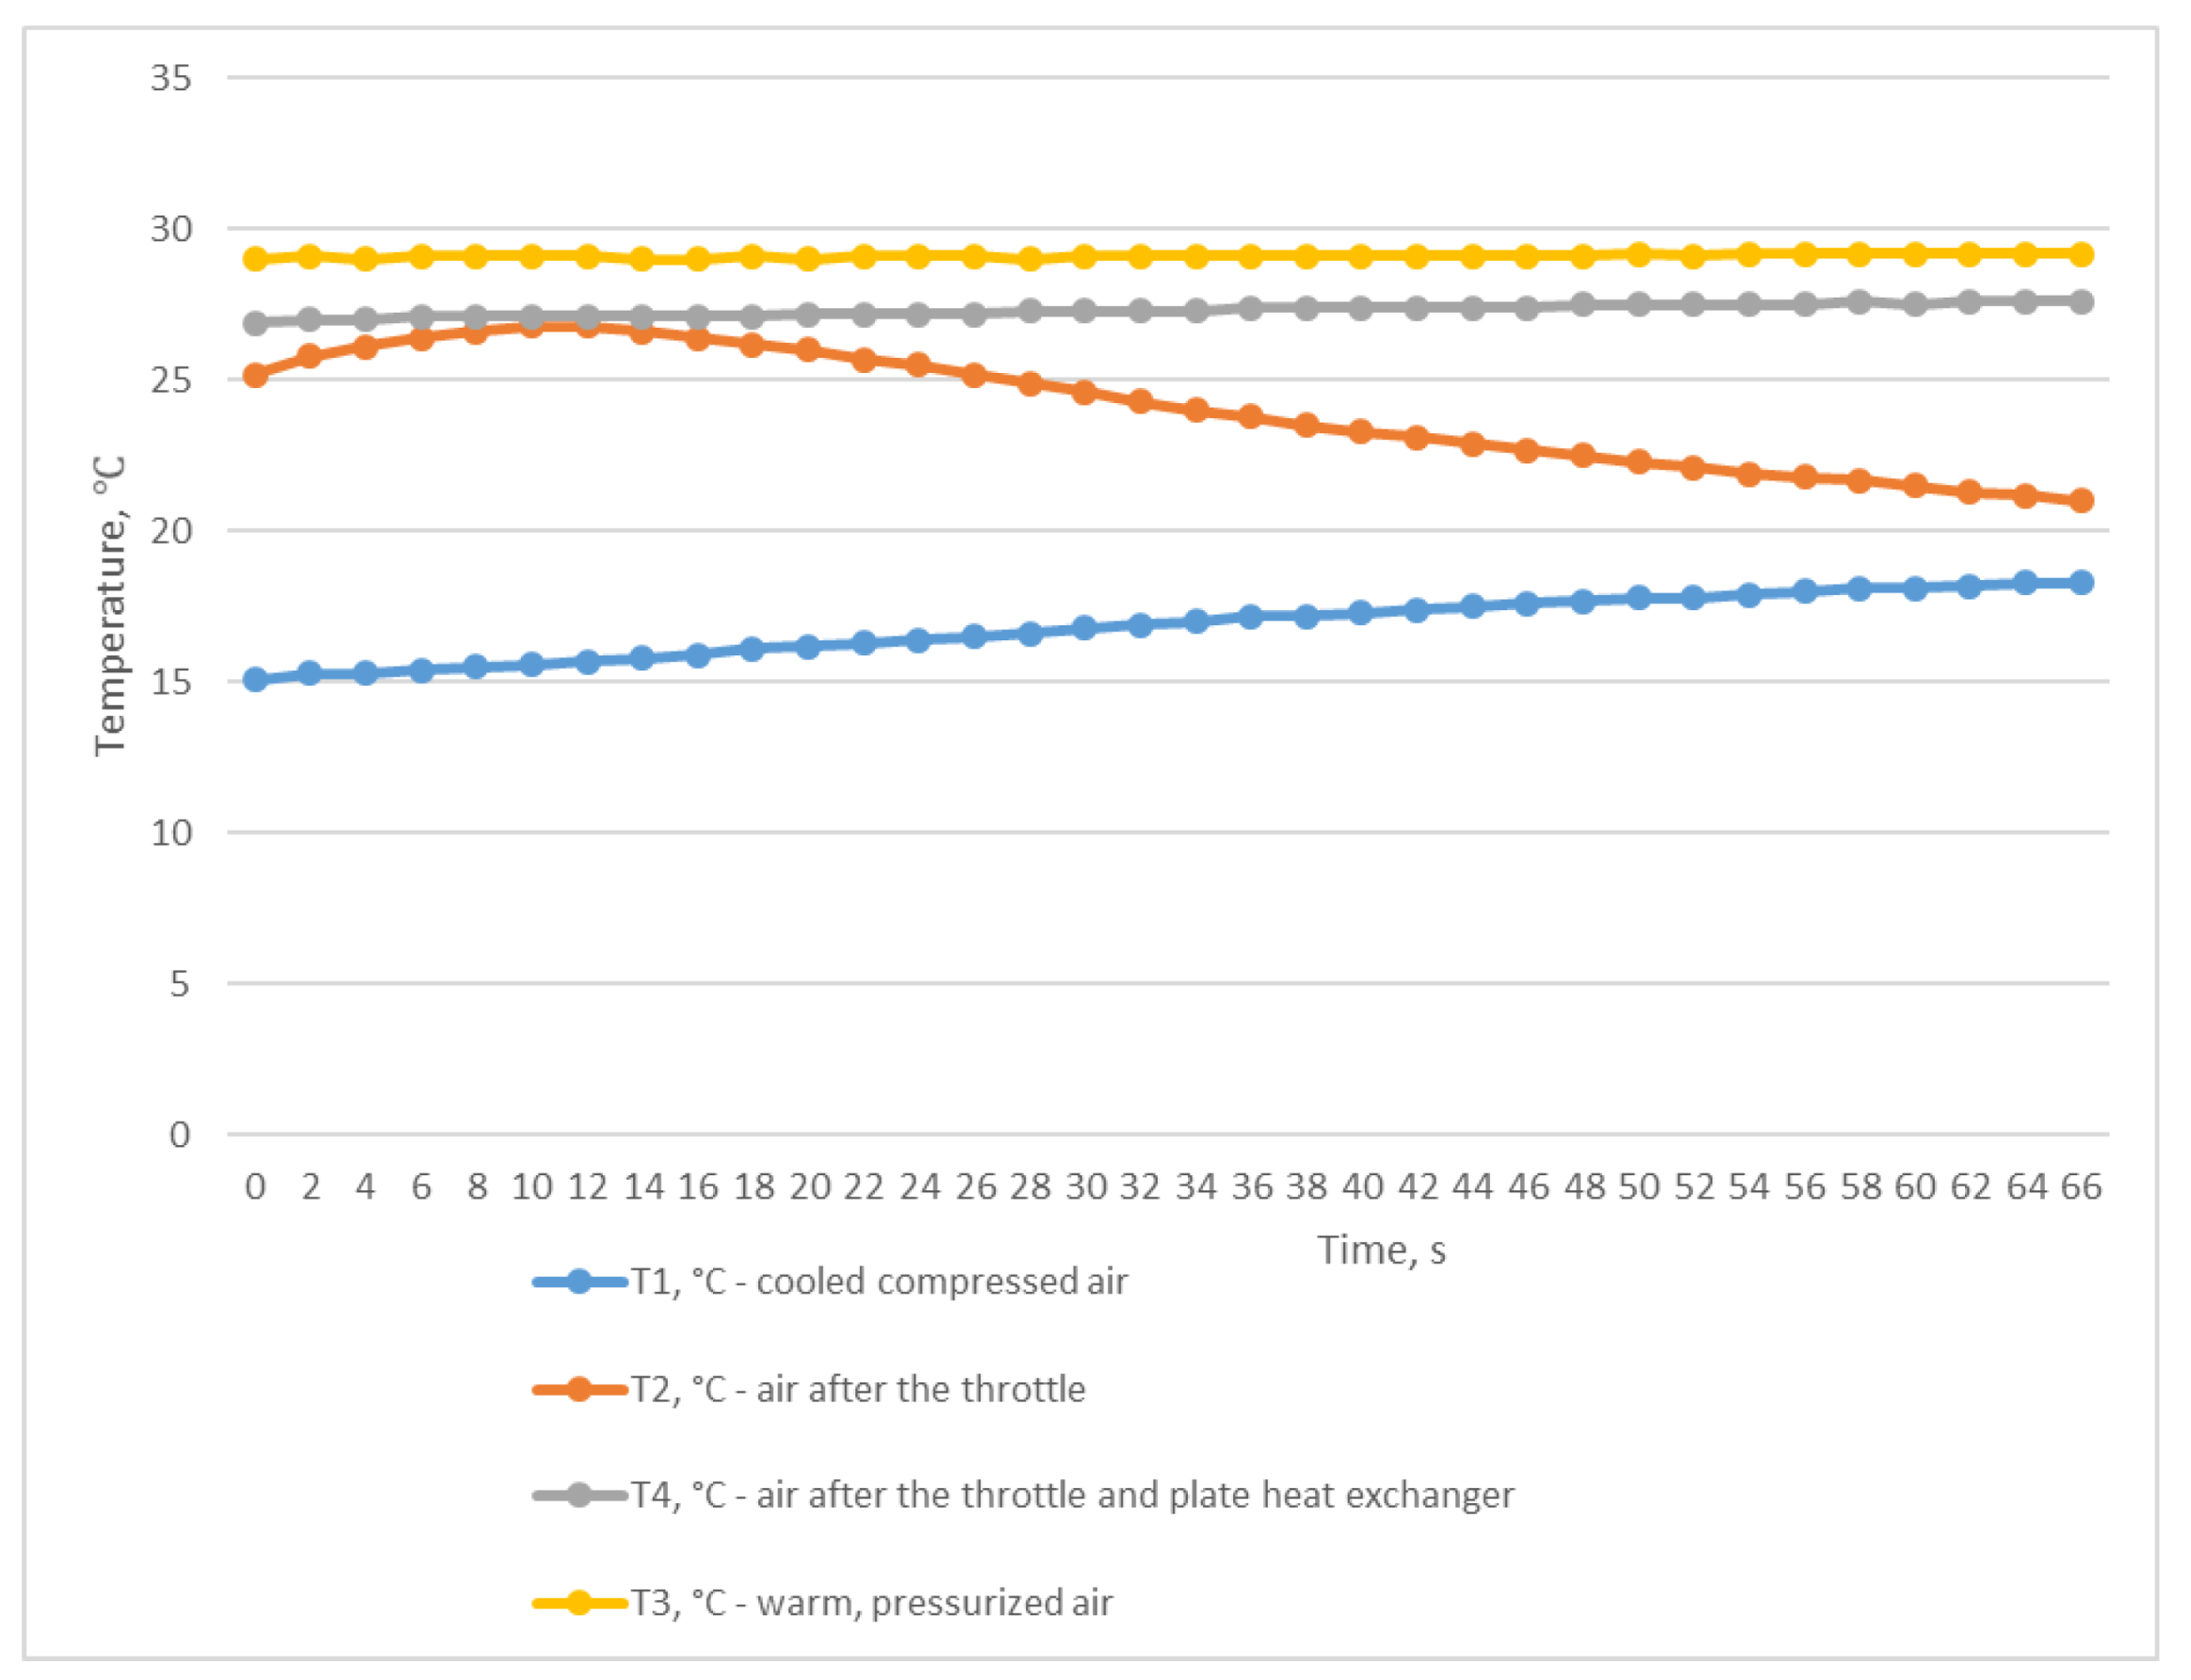
Temperature changes with the throttle partially opened.
In the diagram in Figure 4, we can see the temperature changes at the inlet and outlet of the heat exchanger. The temperatures T3 and T4 remained almost unchanged, averaging 29.1 °C and 27.2 °C, respectively. The air temperature after the T2 throttle dropped slightly from 25.2 °C to 21 °C. The cooled air under pressure T1 was also at a fairly high level in the range of 15.1–18.3 °C. This means that there was no influence of the air after the T2 choke on the T1 air temperature, and the difference between T3 and T1 is due to the heat inertia of the heat exchanger.
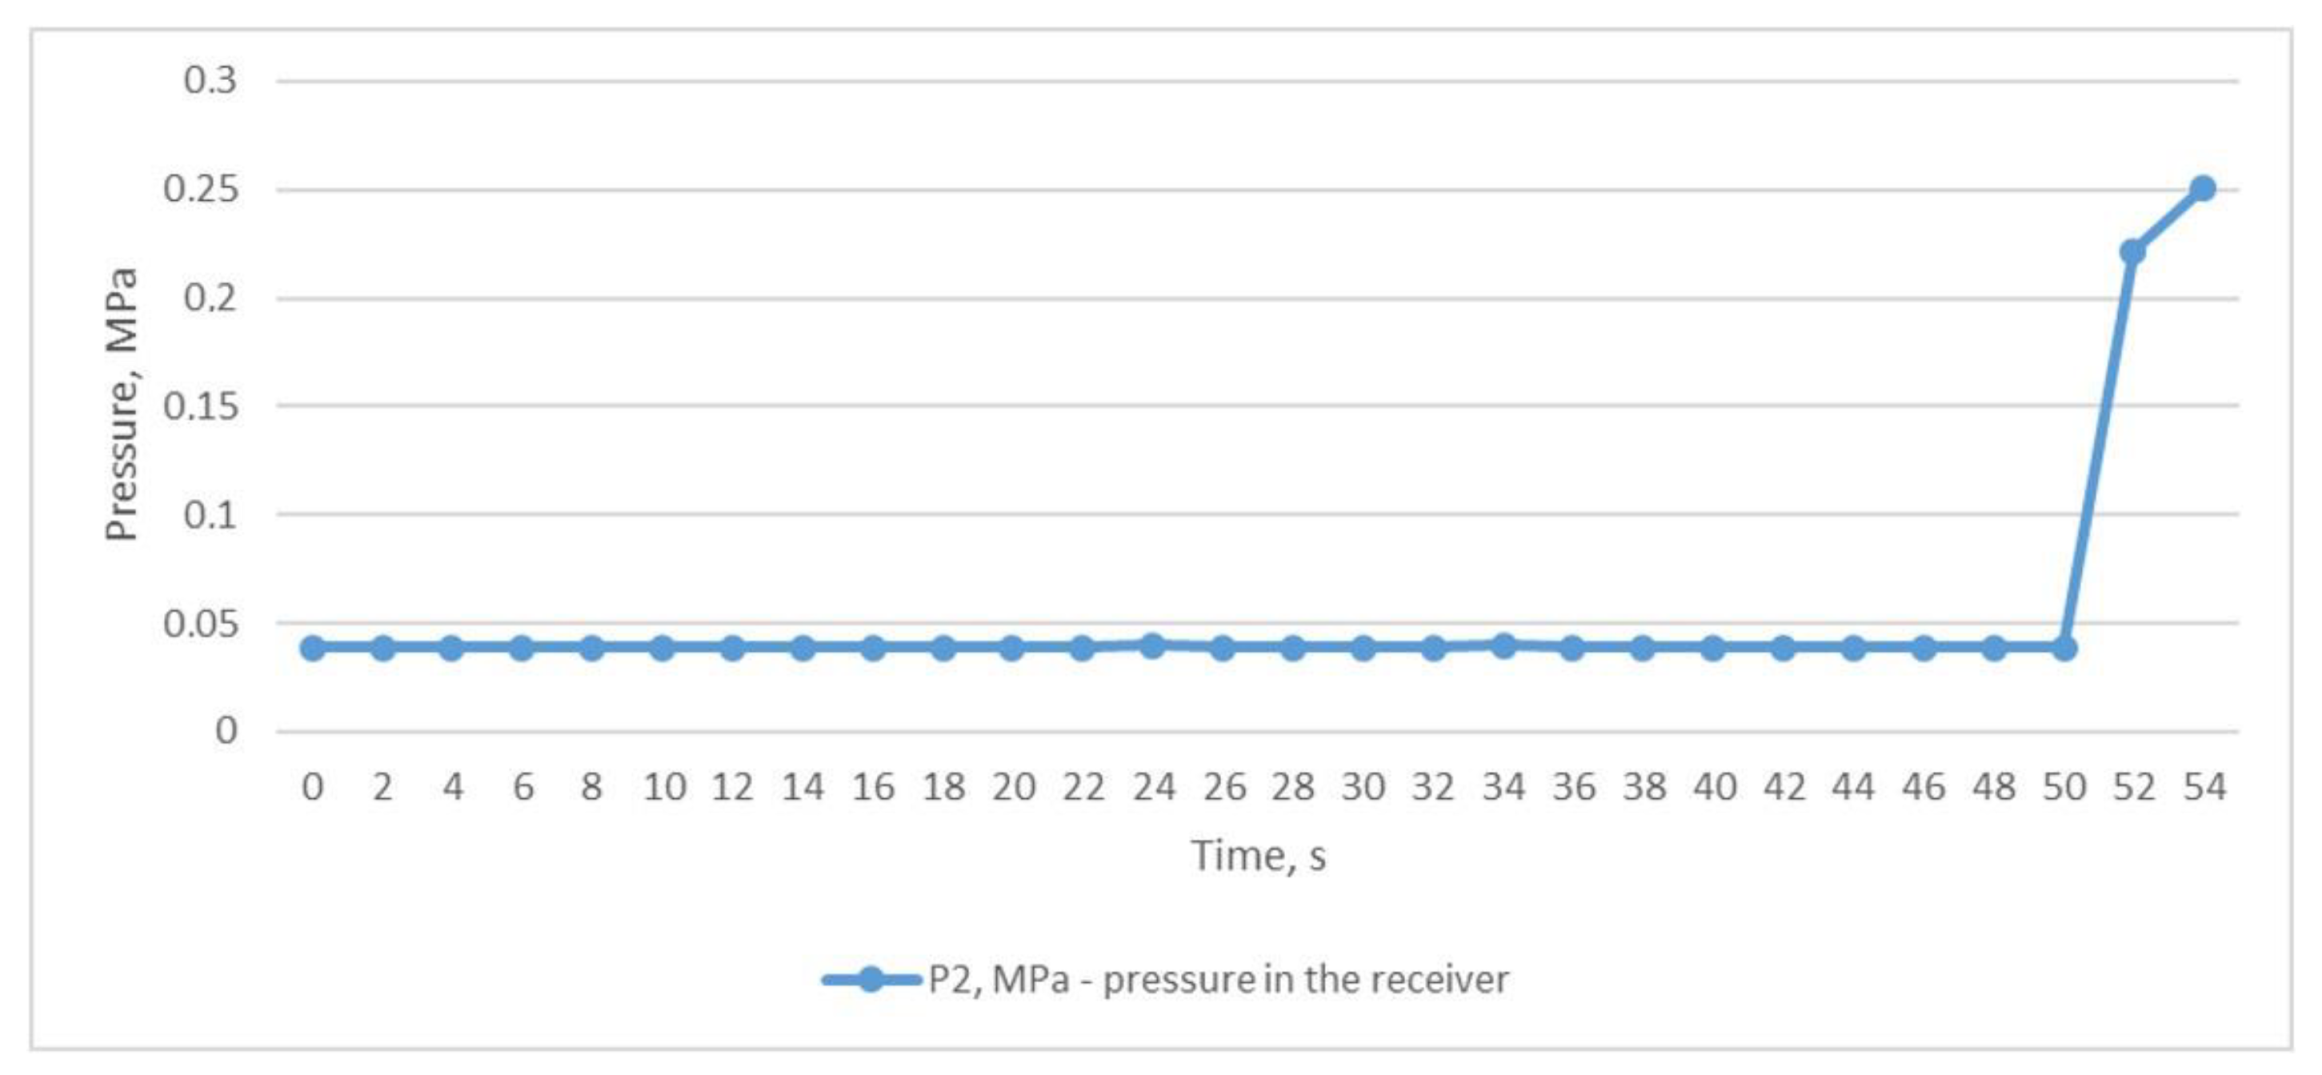
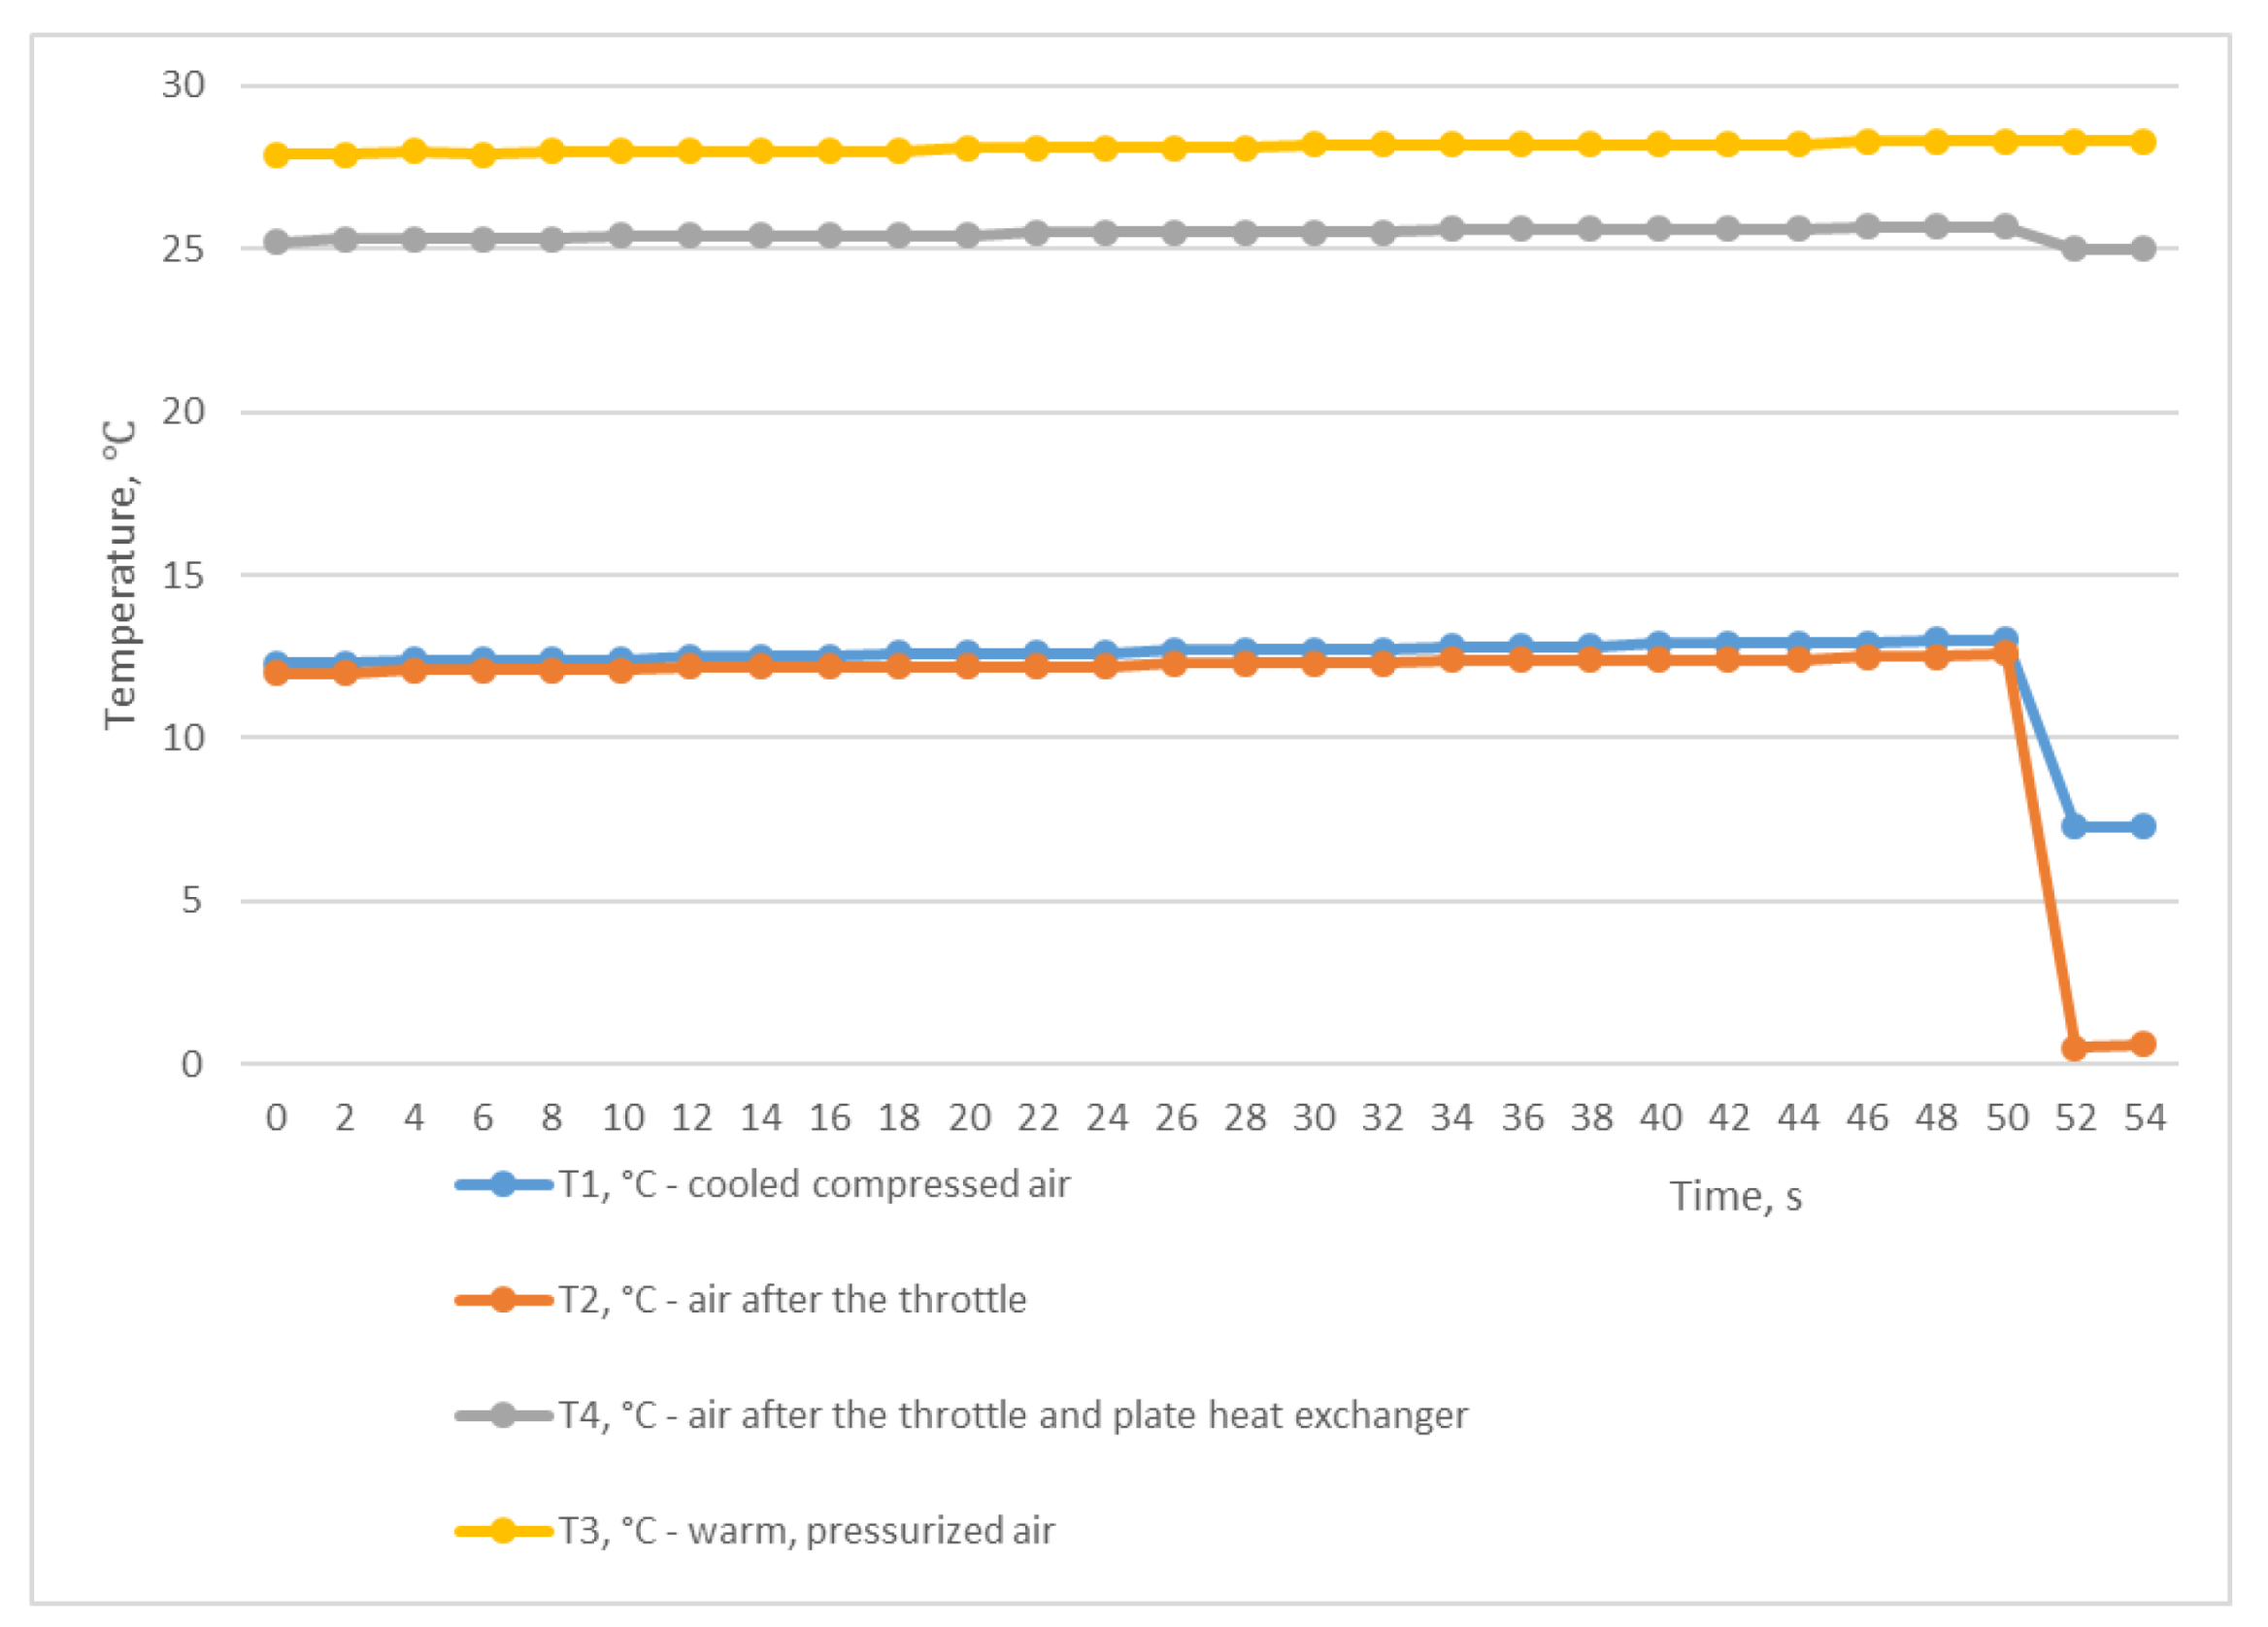
For the second study, we used the mode of a constant compressed air outlet from the receiver through a fully open ball valve, while compressed air was constantly supplied to the receiver from the CompAir START-031 screw compressor (item 2, Figure 2). In this situation, the pressure in the receiver P2 was almost equal to the atmospheric pressure and was at the level of 0.039 MPa (Figure 5). Using the graph shown in Figure 6, we can trace the temperature values at the inlet and outlet of the heat exchanger. As in the first experiment, temperatures T3 and T4 remained almost unchanged and averaged 28.1 °C and 25.4 °C, respectively. At the same time, the temperatures of T1 and T2 also remained unchanged and almost did not differ, and were in the range of 12–12.6 °C. The difference between the temperatures T3 and T1 was 15.9 °C and was not due to the heat energy of the heat exchanger itself but rather to the influence of the air T2 after the throttle.
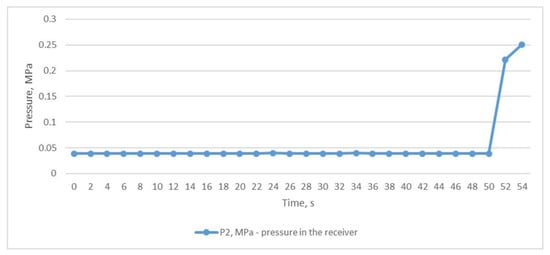
Figure 5.
Air pressure in the receiver with the throttle fully opened.
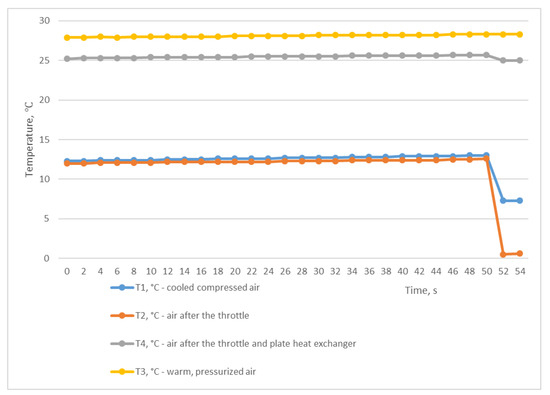
Figure 6.
Temperature changes with the throttle fully opened.
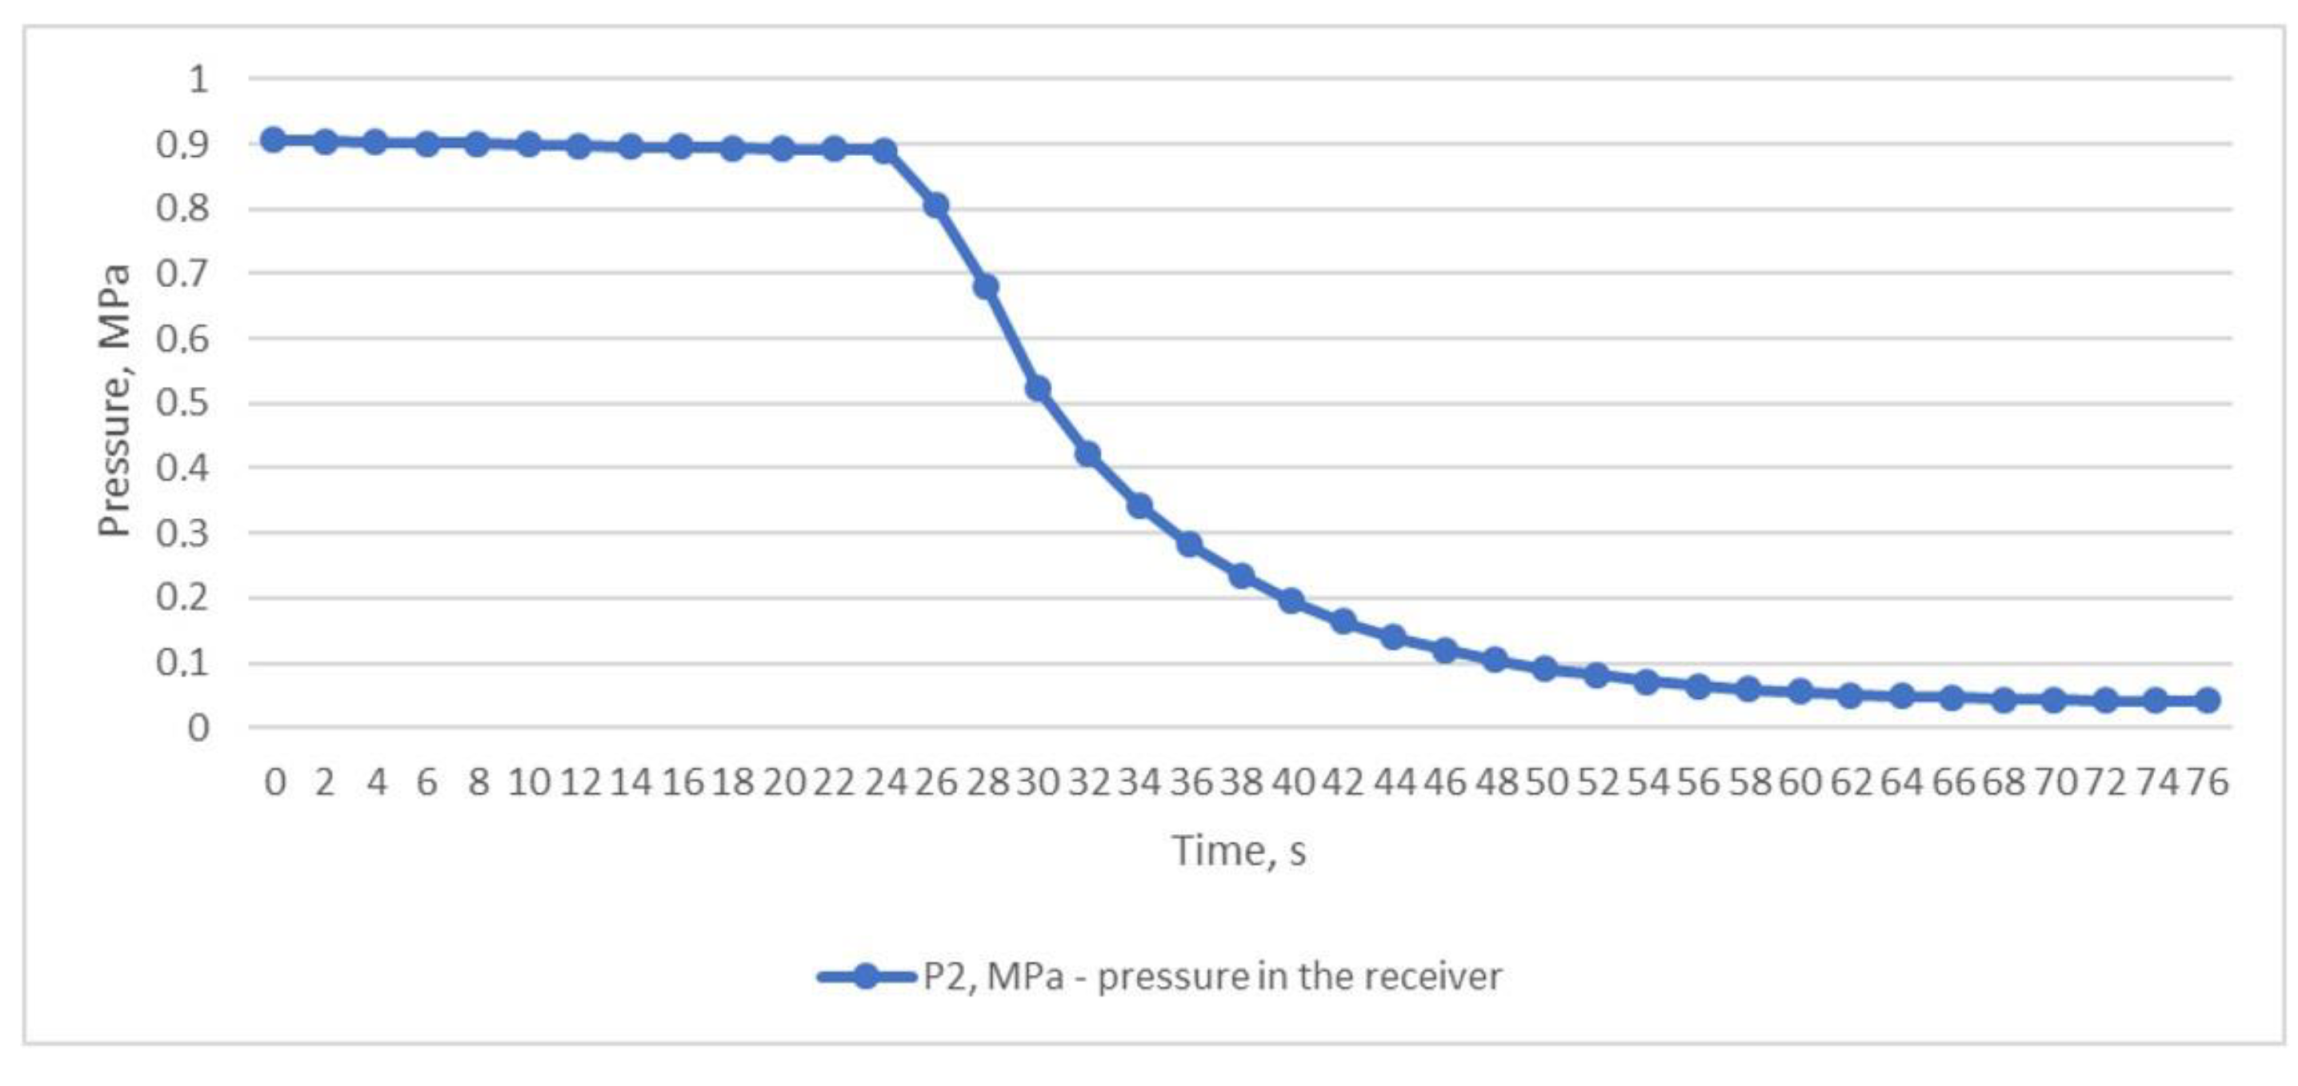
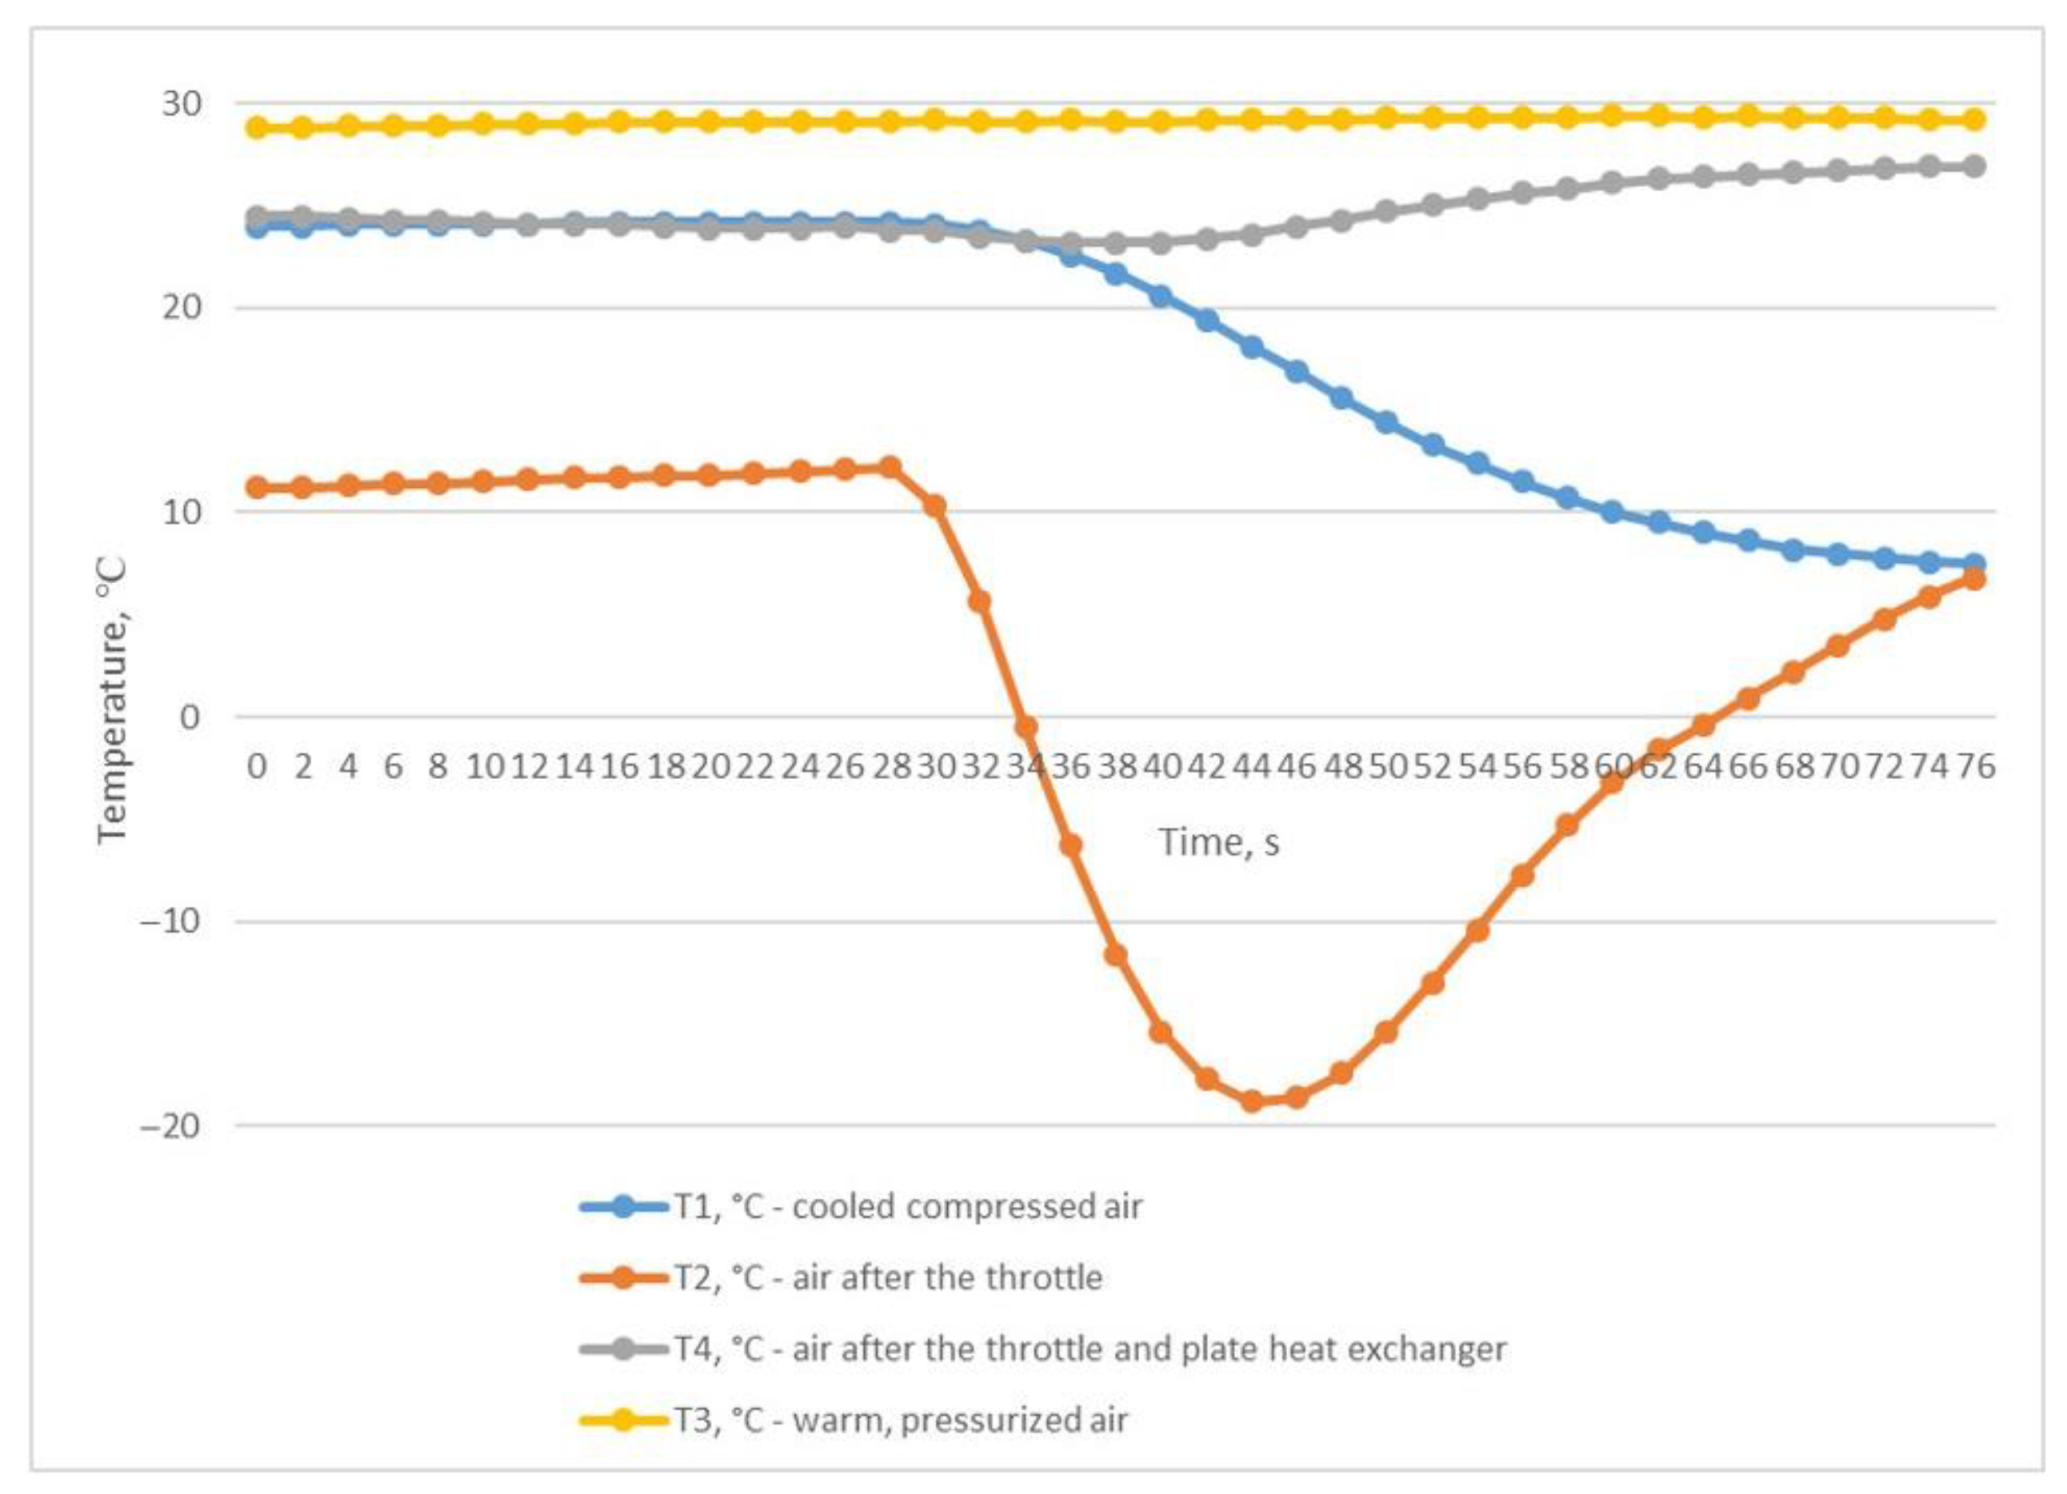
The third experiment was based on the method of rapid discharge of the entire volume of compressed air from the receiver. To perform this, the receiver was filled with compressed air to a pressure of P2 of 0.906 MPa (Figure 7) with the outlet ball valve completely closed. After the receiver was filled, the valve was quickly and completely opened, and compressed air was released from the receiver within 76 s until the pressure dropped to P2 0.041 MPa (Figure 7). This throttling mode allowed us to obtain the desired results of the inlet and outlet temperatures of the heat exchanger. The air temperature after the throttle T2 briefly dropped to −18.8 °C, which in turn facilitated a reduction in the temperature of T1 to +6.8 °C (Figure 8); this temperature is in the range of compressed air temperatures provided by refrigeration dryers with R134 or R404 refrigerants.
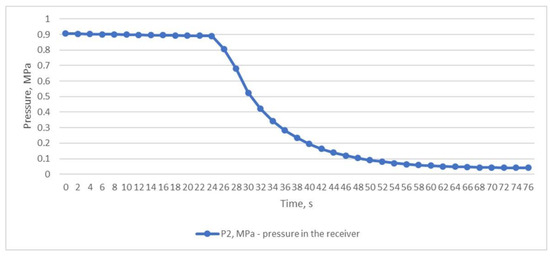
Figure 7.
Air pressure in the receiver is when the entire volume of compressed air is quickly and completely discharged from the receiver.
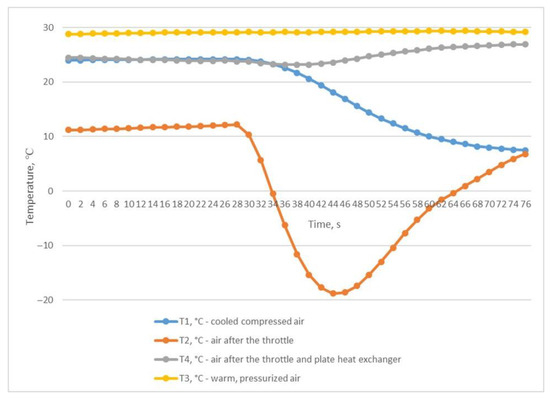
Figure 8.
Temperature changes during rapid and complete discharge of the entire compressed air volume from the receiver.
Table 2 summarises the parameters obtained during all three experiments.

Table 2.
Table of pressure and temperature parameters based on the experiments.
Using the temperature of the compressed air after cooling in the heat exchanger during the third experiment, we can calculate how much moisture can be condensed. For the sake of convenience, let us take T1 = 7 °C.
For calculation of the mass flow rate of water vapour remaining in the compressed air after the cooler, we first find the moisture content of the air sucked in by the compressor for compression [19].
The vapour pressure pv can be derived from the saturation vapour pressure pvs:
where φ is the relative vapour pressure (60% at the time of the experiment); and pv = 0.60 × 17.04 mbar (pvs value at 15 °C, see Table on (p. 134, [20])).
pv = φ pvs,
= 10.224 mbar
Dry air pressure is calculated from the formula:
where pha = 1.013 bar (the air enters the compressor at normal atmospheric pressure).
pha = pa + pv
We find that pa = 1.013 − 0.010224 = 1.002776 bar absolute.
Where Pha—humid air pressure: Pa, dry air pressure; Pv, water vapour pressure.
The water content X of the sucked-in air is found by means of the following formula:
X = 0.622 = 0.01019 kg water vapour/kg dry air
In order to calculate the water content per m3 of sucked-in air, we use the following equation:
where ρv is the water vapour density; Rv = 461.5 J/(kg·K) is the gas constant; T = 15 °C is the absolute ambient temperature.
Let us find the amount of moisture that will be released from the compressed air after cooling in the heat exchanger.
After the aftercooler the air is saturated, φ = 1 and pv = pvs.
We can calculate Pa and X as follows:
where pv = 10.01 mbar (pvs value at 7 °C, see Table on (p. 134, [20])); pha = 6.2 bar—air pressure after the compressor.
pa = pha − pv
= 6.2 − 0.01001 = 6.18999 bar absolute
Then we find water vapour of dry air:
Next, we calculate the water vapour density that will be released from the compressed air after cooling in the heat exchanger:
Calculated to FAD conditions (1 bar absolute inlet pressure):
This means that in the aftercooler 7.69 − 1.25 = 6.44 g condensate per m3 will be formed.
4. Discussion
The introduction of compressed air cooling and drying technology using an alternative method based on the use of compressed air expansion may have significant development potential as the development of renewable energy technologies increasingly replaces traditional means of generating electricity and contributes to the reduction in carbon emissions.
However, the presented method of cooling and drying compressed air needs to be improved, as the expansion is short-lived and cannot be used for a long process. Therefore, it is proposed to improve the test bench by replacing the throttle with a Rank–Hildsch vortex tube, which uses compressed air from a pneumatic network and can cool to −50 °C, depending on the geometric dimensions of the tube itself, pressure, and compressed air flow rate [21,22,23].
It is expected that this refinement will achieve a stable mode of heat exchange in the plate heat exchanger between the two heat carriers to conduct experiments using different parameters of the compressed air to be cooled and used in the vortex expansion device and, finally, to determine the optimal modes for obtaining the desired temperature of +3 °C, which will ensure the quality of compressed air at the level of class 4 according to ISO 8573-1:2010.
Further research will be aimed at improving the test bench and bringing it closer to the compressed air-drying parameters provided by standard refrigeration dryers.
5. Conclusions
In this article, a model of compressed air drying based on the principle of operation of a refrigeration dryer was considered but instead of R134 or R404 gas refrigerants, chilled compressed air was used as a cooling medium with a temperature below 0 °C. The objective of the study described in this article was to investigate the possibility of replacing harmful cooling gases with a neutral type of coolant using compressed air energy.
To implement the task, a test bench was designed and manufactured (Figure 2), consisting of two screw compressors, an air receiver, a ball valve as a throttle, a plate heat exchanger, temperature sensors, a pressure sensor, and a microprocessor controller.
To obtain an air flow with a temperature below 0 °C, one of the most widely available methods was used, namely the Joule–Thompson effect, which allowed the compressed air temperature to be reduced to −18.8 °C while the compressed air was rapidly exiting the receiver through the throttling device. In the plate heat exchanger, short-term heat exchange between warm and humid compressed air and cooled air took place, which reduced the compressed air temperature to +6.8 °C. This temperature is within the range of 1.7 °C to 10 °C provided by standard refrigeration dryers that use R134 or R404 gases as refrigerants, and it is also close to +3 °C, which can ensure compressed air quality at the level of class 4 according to ISO 8573-1:2010.
Author Contributions
Conceptualization, O.L.; methodology, D.B.; software, M.O. and S.W.; validation, I.P. and S.W.; formal analysis, O.L. and D.B.; investigation, O.L., D.B., M.O., I.P. and S.W.; resources, O.L. and M.O.; data curation, I.P. and S.W.; writing—original draft preparation, D.B.; writing—review and editing, M.O. and I.P.; visualization, D.B. and S.W.; supervision, O.L.; project administration, I.P.; funding acquisition, M.O. All authors have read and agreed to the published version of the manuscript.
Funding
This research was funded by MniSW-SBAD.
Data Availability Statement
The data are available on request from the corresponding author.
Acknowledgments
This research was partially realized within the project “Fulfillment of tasks of the perspective plan of development of a scientific direction“, Technical Sciences, Sumy State University, Ukraine, state reg. number 0121U112684. It was also partially realized within the Ulam NAWA Programme (Poland), grant number BPN/ULM/2022/1/00042.
Conflicts of Interest
The authors declare no conflicts of interest.
References
- Eras, J.J.C.; Gutiérrez, A.S.; Santos, V.S.; Ulloa, M.J.C. Energy management of compressed air systems. Assessing the production and use of compressed air in industry. Energy 2020, 213, 118662. [Google Scholar] [CrossRef]
- Hernandez-Herrera, H.; Silva-Ortega, J.I.; Diaz, V.L.M.; Sanchez, Z.G.; García, G.G.; Escorcia, S.M.; Zarate, H.E. Energy savings measures in compressed air systems. Int. J. Energy Econ. Policy 2020, 10, 414–422. [Google Scholar] [CrossRef]
- Goodarzia, G.; Dehghani, S.; Akbarzadeh, A.; Date, A. Energy Saving Opportunities in air Drying Process in High-pressure Compressors. Energy Procedia 2017, 110, 428–433. [Google Scholar] [CrossRef]
- ISO 8573-1:2010; Compressed Air. Part 1: Contaminants and Purity Classes. ISO: Geneva, Switzerland, 2024.
- Yokoo, K.; Matsune, H.; Kishida, M.; Tatebayashi, J.; Yamamoto, T. Promoting effect of water vapor on particle matter combustion in a low-temperature continuous regeneration type PM removal device using a fluidized bed. Powder Technol. 2019, 355, 657–666. [Google Scholar] [CrossRef]
- Fedele, L.; Di Nicola, G.; Menegazzo, D.; Tomassetti, S.; Bobbo, S.; Quattrocchi, P.; Alemanno, L.; Catanzani, L.; Amato, S. pvTx properties for carbon dioxide (CO2)/difluoromethane (R32)/1,1,1,2-tetrafluoroethane (R134a) ternary mixture measured in the compressed liquid, superheated vapour, and two-phase regions. Int. J. Refrig. 2023, 151, 136–145. [Google Scholar] [CrossRef]
- Bolaji, B.; Huan, Z. Ozone depletion and global warming: Case for the use of natural refrigerant—A review. Renew. Sustain. Energy Rev. 2013, 18, 49–54. [Google Scholar] [CrossRef]
- Alami, A.H.; Alrashid, R.; Mdallal, A.; Yasin, A.; Ayoub, M.; Alasad, S.; Aljaghoub, H.; Alashkar, A.; Abdelkareem, M.A.; Olabi, A.G.; et al. Expansion cooling prospects for large scale applications. Int. J. Thermofluids 2023, 20, 100437. [Google Scholar] [CrossRef]
- Walker, G. Claude and Joule-Brayton Systems. In Cryocoolers; Springer: Boston, MA, USA, 1983; pp. 297–353. [Google Scholar]
- Biglia, A.; Bilardo, M.; Comba, L.; Aimonino, D.R.; Grella, M.; Fabrizio, E.; Gay, P. Performance analysis of a nitrogen-based Brayton cryocooler prototype. Energy 2024, 290, 130095. [Google Scholar] [CrossRef]
- Chen, H.; Liu, Q.-S.; Liu, Y.-W.; Gao, B. Optimal design of a novel non-isometric helically coiled recuperator for Joule–Thomson cryocoolers. Appl. Therm. Eng. 2020, 167, 114763. [Google Scholar] [CrossRef]
- Claridge, D.E.; Culp, C.; Pate, M.; Haberl, J.; Bynum, J.; Tanskyi, O.; Schaff, F. A Performance analysis of the Claridge-Culp-Liu dehumidification process: A novel approach for drying moist air based on membrane separation, vacuum compression and sub-atmospheric condensation. Int. J. Refrig. 2021, 122, 192–200. [Google Scholar] [CrossRef]
- Chen, Q.; Yan, G.; Yu, J. Experimental research on the concentration distribution characteristics of dual-temperature refrigeration system using R290/R600a based on separation condensation. Int. J. Refrig. 2021, 131, 244–253. [Google Scholar] [CrossRef]
- Thongtip, T.; Aphornratana, S. An experimental analysis of the impact of primary nozzle geometries on the ejector performance used in R141b ejector refrigerator. Appl. Therm. Eng. 2017, 110, 89–101. [Google Scholar] [CrossRef]
- Liu, Y.; Ai, G. Numerical Study on the Heat Transfer in the Leakage of Pressure Vessels Considering the Joule-Thomson Cooling Effect. Procedia Eng. 2015, 130, 232–249. [Google Scholar] [CrossRef]
- Refrigerant Compressed Air Dryers. 2004. Available online: https://generalcompression.co.nz/compressed-air-dryers/refrigerant-compressed-air-dryers/ (accessed on 1 June 2024).
- Matusiak, K.; Goliwąs, D.; Kaluba, M. Adsorption dryer for use in railways. Rail Veh. Pojazdy Szyn. 2022, 77–85. [Google Scholar] [CrossRef]
- Onufrena, A.; Koettig, T.; Bremer, J.; Tirolien, T.; Dorau, T.; Laguna, M.; ter Brake, H. Design of a compact mesh-based high-effectiveness counter-flow heat exchanger and its integration in remote cooling systems. Int. J. Heat Mass Transf. 2022, 183, 122107. [Google Scholar] [CrossRef]
- Mobley, R.K. Air Dryers. In Fluid Power Dynamics; Newnes: Boston, MA, USA, 2000; pp. 232–241. Available online: https://archive.org/details/fluid-power-dynamics (accessed on 28 May 2024).
- Atlas Copco. Compressed Air Manual, 7th ed.; Atlas Copco: Wilrijk, Belgium, 2010. [Google Scholar]
- Hu, Z.; Wang, D.; Gao, F.; Cao, Y.; Wu, H. Experimental investigation on cooling performance of vortex tube with rectifier using Taguchi method. Case Stud. Therm. Eng. 2023, 49, 103373. [Google Scholar] [CrossRef]
- Tempiam, A.; Kachapongkun, P.; Rattanadecho, P.; Prommas, R. Experimental investigation of vortex tube for reduction air inlet of a reciprocating air compressor. Case Stud. Therm. Eng. 2020, 19, 100617. [Google Scholar] [CrossRef]
- Cartlidge, J.; Chowdhury, N.; Povey, T. Performance characteristics of a divergent vortex tube. Int. J. Heat Mass Transf. 2022, 186, 122497. [Google Scholar] [CrossRef]
Disclaimer/Publisher’s Note: The statements, opinions and data contained in all publications are solely those of the individual author(s) and contributor(s) and not of MDPI and/or the editor(s). MDPI and/or the editor(s) disclaim responsibility for any injury to people or property resulting from any ideas, methods, instructions or products referred to in the content. |
© 2024 by the authors. Licensee MDPI, Basel, Switzerland. This article is an open access article distributed under the terms and conditions of the Creative Commons Attribution (CC BY) license (https://creativecommons.org/licenses/by/4.0/).

