Article

Design and Performance Analysis of a Composite Thermal Protection Structure for a Robot Pan–Tilt

1
Key Laboratory of Advanced Intelligent Protective Equipment Technology, Ministry of Education, Hebei University of Technology, Tianjin 300401, China
2
State Key Laboratory of Reliability and Intelligence of Electrical Equipment, Tianjin 300401, China
3
School of Mechanical Engineering, Hebei University of Technology, Tianjin 300401, China
*
Author to whom correspondence should be addressed.
Energies 2024, 17(13), 3120; https://doi.org/10.3390/en17133120
Submission received: 28 April 2024 / Revised: 19 June 2024 / Accepted: 19 June 2024 / Published: 25 June 2024
(This article belongs to the Section J1: Heat and Mass Transfer)

Abstract

:
To improve the adaptability of the robot pan–tilt to the high-temperature environment, a design scheme for a composite thermal protection structure composed of aerogel felt, hollow glass, and skin is proposed. The effects of aerogel felt thickness, glass type, and ambient temperature on the thermal protection performance of the structure are studied, using a fluid–solid–thermal coupling model. Numerical results show that the structure exhibits good protection performance, and that the thermal resistance distribution changes the main path of heat transmission. The optimal thickness of the aerogel felt is approximately 8 mm. Compared to 3 mm, 5 mm, and 10 mm thicknesses, 8 mm reduces the maximum temperature by 15.90%, 8.37%, and 6.22%, and reduces the total entropy by 79.23%, 52.44%, and 12.5%. Lower thermal conductivity of the gas inside the hollow glass results in decreased maximum temperatures and total entropy. Using argon-filled hollow glass at 573.15 K decreases maximum temperature by 33.52% and 8.40%, with a total entropy reduction of 33.46% and 6.04%, compared to the single-layer and air-filled glass. Higher ambient temperatures correlate with increased maximum temperature, total entropy, and average surface-heat-transfer coefficient, indicating that the adaptability of the structure to high-temperature environments is limited.

1. Introduction

It is becoming a common practice to use robots equipped with various electronic components to cooperate with humans to collect information on accident sites [1,2,3,4,5]. However, in high-temperature environments, the electronic components within robot pan–tilts are prone to functional failure or damage [6]. To ensure that the robot can operate in extremely high temperature conditions, an appropriate thermal protection structure is required.
Thermal protection structures are designed to insulate the interior of the equipment from external heat by the means of an installed structure consisting of heat-insulating materials or spray coatings with excellent thermal insulation properties on the exterior of the equipment. Alhaza et al. proposed a design for a multi-layer thermal insulation structure for indoor fire and rescue robots. The insulating structure enables the robot to withstand an environment of 700 °C for 60 min [7]. Sevinchan conducted theoretical analyses on 19 insulation materials used in robots, as well as experiments on asbestos, fiberglass, and extruded polyurethane. The experimental results obtained at 40 °C indicate that the heat transfer rates between the inside and outside of the robot are 120 W for stone wool, 126 W for fiberglass, and 173.9 W for extruded polyurethane [8,9]. Midhun et al. investigated the thermal protection performance of vacuum insulation panels applied to electronic systems exposed to thermal radiation. An active cooling system combining liquid cooling with vacuum insulation panels could reduce the average temperature of the device by 51.52%. A passive cooling system combining phase-change materials with vacuum insulation panels could improve the uptime duration of the equipment by 41.63% [10,11,12]. Thermal barrier coatings are frequently used as protective materials in modern insulated thermal protection structures [6]. Ding et al. investigated the application of SiO2 aerogel in thermal barrier coatings. The results indicate that the temperature of the structure decreases by 12 °C when the mass fraction of SiO2 aerogel in the thermal barrier coating on the surface of the structure is 5% [13]. Solntsev et al. investigated glass-ceramic-based thermal barrier coating materials, which are suitable for a variety of equipment surfaces and effectively achieve sufficient levels of thermal protection of the equipment. The inclusion of this coating in the thermal insulation of the thermal protection structure raised the maximum operating temperature of the studied device by 300 degrees to 500 °C, resulting in an extended operational duration and utilization range for the equipment [14,15,16].
Most of the researched insulating structures are mainly applied to hypervelocity vehicles. However, these technologies can also be extended to other devices, such as robots, to enhance their performance and high-temperature-resistance characteristics. Sandwich structures are the most commonly used thermal protection structures [17,18,19,20,21]. Yu et al. developed a multifunctional composite square honeycomb sandwich structure. The results show that the maximum improvement is by a factor of approximately 26 times for the measured out-of-plane thermal conductivity, as compared with the traditional composite sandwich structures [22]. Zhang et al. designed and developed a multilayer thermal protection structure that combines ceramic matrix composites with titanium alloy supports. Experimental results demonstrate that introducing cooling air at 150 °C into the structure at a speed of 5 m/s resulted in a cold-side temperature of only 210.10 °C, even with the hot-side temperature reaching as high as 1100 °C [23]. Wei et al. proposed an integrated thermal protection system based on lightweight C/SiC-composite corrugated sandwich panels. Compared with the existing corrugated-metal-core integrated thermal protection systems, the system proposed in this paper significantly improves the temperature limit of the equipment, up to 1600 °C [24,25]. Wei et al. investigated the thermal protection performance of composite honeycomb sandwich panels using multilayer ceramic-based and graded insulation materials. The results show that filling the structure with graded insulation materials can effectively improve its protection performance, and the pyramid sandwich panel outperformed the corrugated-core sandwich panel, with a temperature difference of up to 90 °C [26,27]. To enhance the thermal protection performance of the structure, phase-change materials can be added to the interior of the sandwich structure. Cao et al. proposed filling composite phase-change materials into a corrugated-core thermal protection structure to enhance its thermal protection performance. The result shows that the maximum temperature of the protected object is reduced by 18.46%, compared to the conventional thermal protection structure [28]. However, due to their complexity and high cost, the structures described above are not suitable for mass production.
The thermal protection structure described above is not suitable for application on the robot pan–tilt, as it lacks the necessary degrees of freedom to protect the object and does not take into consideration the presence of visual information acquisition elements inside the device. Therefore, a composite thermal protection structure composed of aerogel felt, hollow glass, and steel skin is proposed in this study for use in robot pan–tilt thermal protection for work in high-temperature environments. By analyzing the maximum temperature and the total entropy values of the inner basin of the pan–tilt, as well as the average surface-heat-transfer coefficient of the structure, the protective properties of the structure under different conditions are obtained and discussed.

2. Composite Thermal Protection Structure Design

Figure 1 shows the robotic pan–tilt studied in this paper, which consists of a main body and lugs. The main body can be rotated, and lugs can be tilted, to improve the working space range of this pan–tilt. A visual information acquisition device such as a camera is installed inside the lugs to collect information on the accident scene.
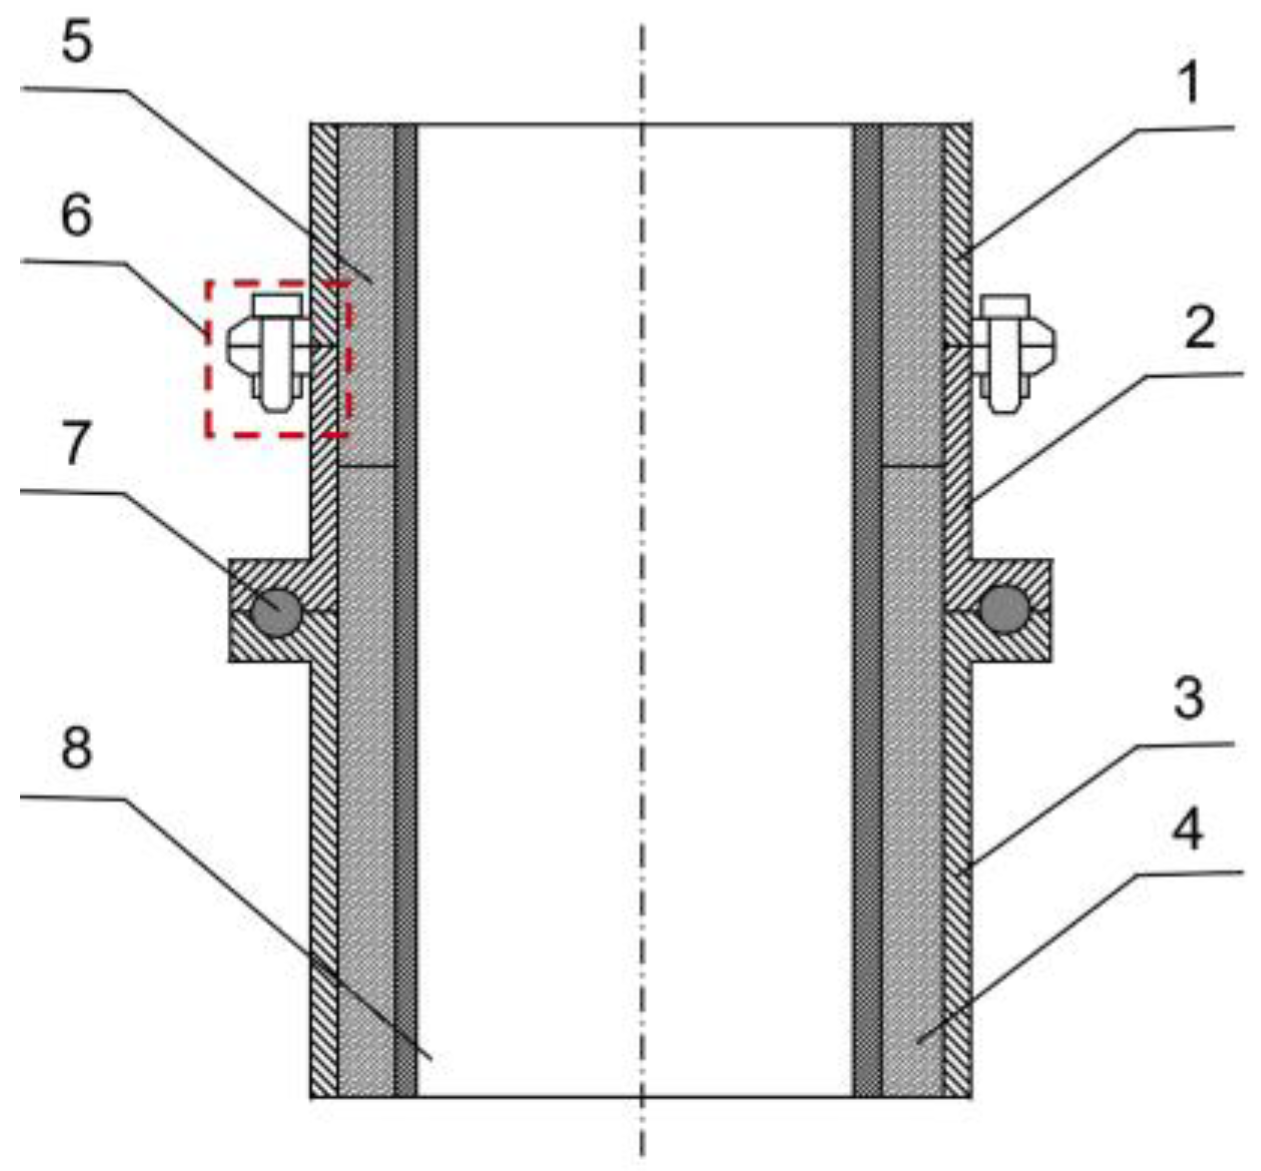
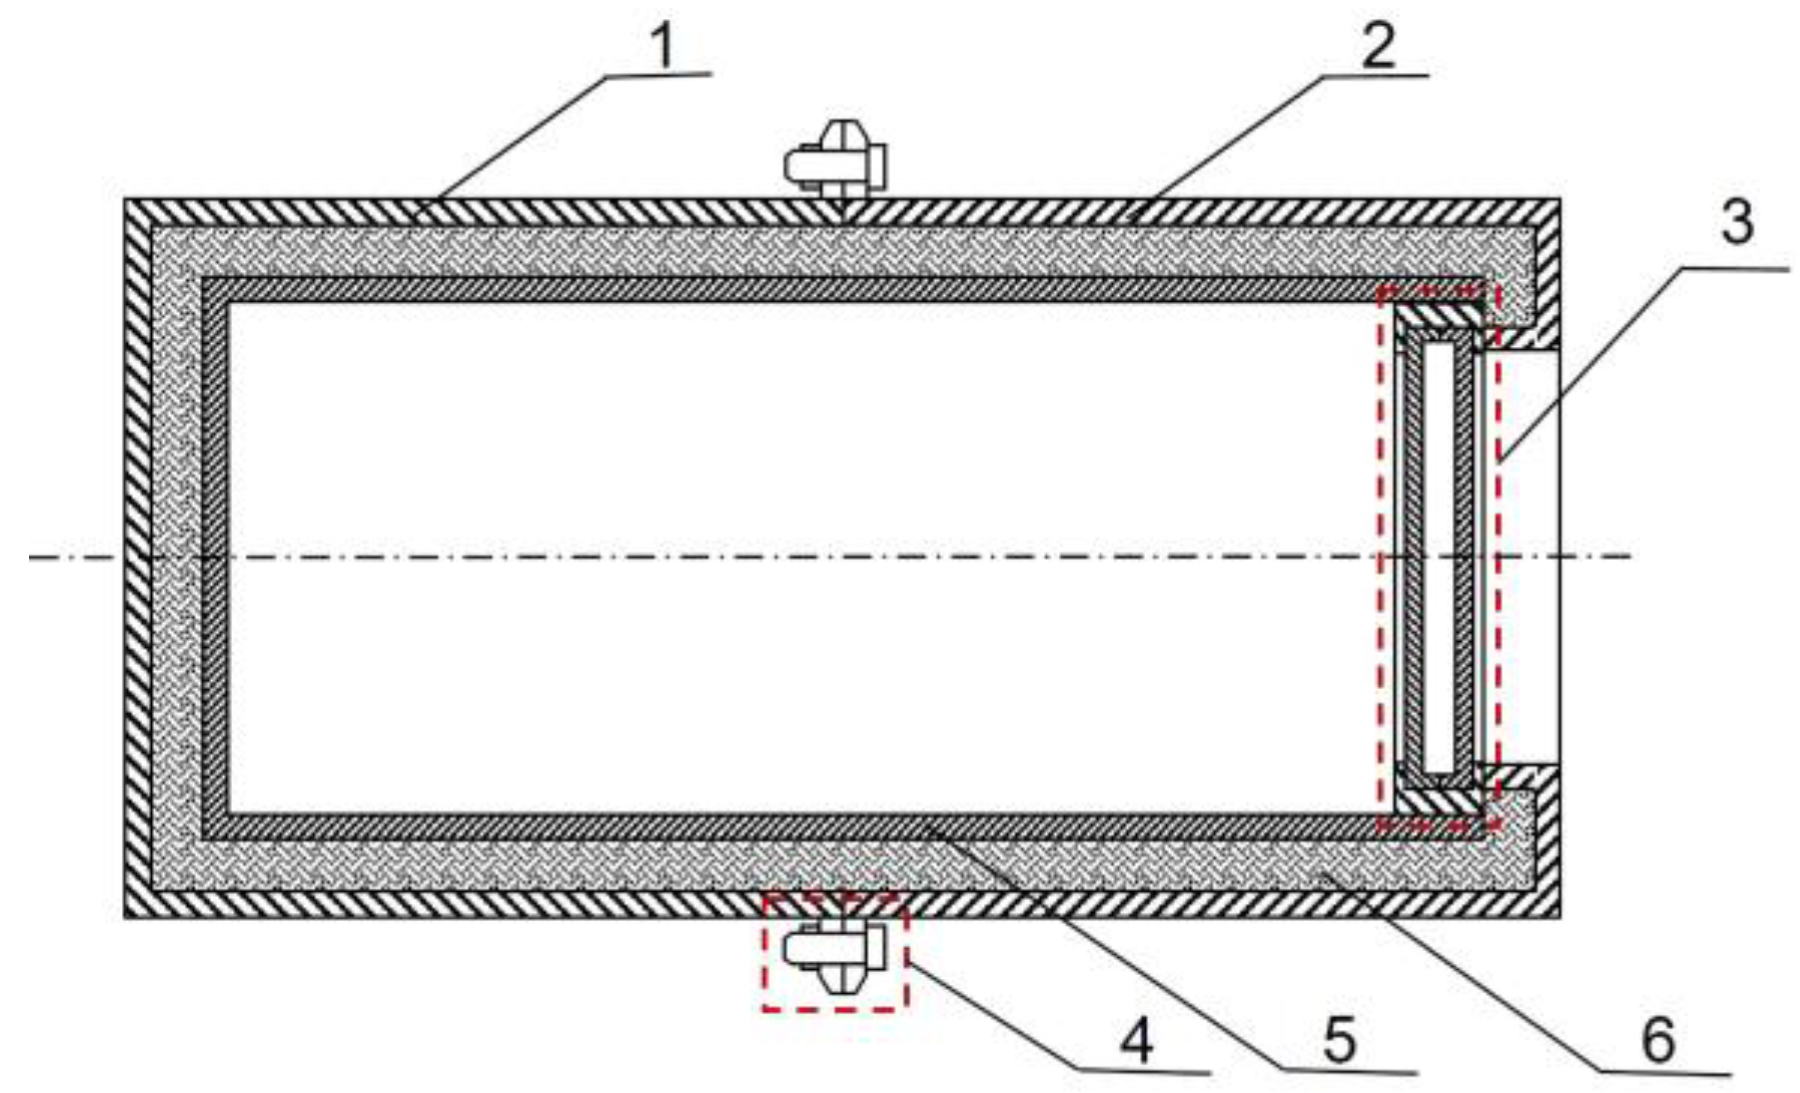
To improve the working ability of the pan–tilt in high-temperature environments, a composite thermal protection structure is designed using aerogel felt, hollow glass, and steel skin. The hollow glass is installed at the front end of the pan–tilt camera housing, while the outside of the pan–tilt housing is covered with aerogel felt. Aerogel felt is a lightweight and highly efficient thermal insulation material characterized by low density and low thermal conductivity. It possesses excellent thermal insulation properties and high temperature resistance, enabling it to reduce the load on the robot pan–tilt while achieving thermal protection. To prevent external impacts from breaking the aerogel felt, a protective skin is installed on its outside. Figure 2 shows the manner of connection between the rotation and pitch parts of the structure. The movement function of the structure is achieved by connecting the skin modules using stainless steel balls, while the rest of the modules are fixed in place with bolt groups. Figure 3 shows a schematic diagram of the thermal protection for the camera housing. Figure 4 shows the hollow glass used at the front end of the camera housing. The glass is filled with air, or other gases are used to fill the cavity, and it is then sealed with a metal ring.
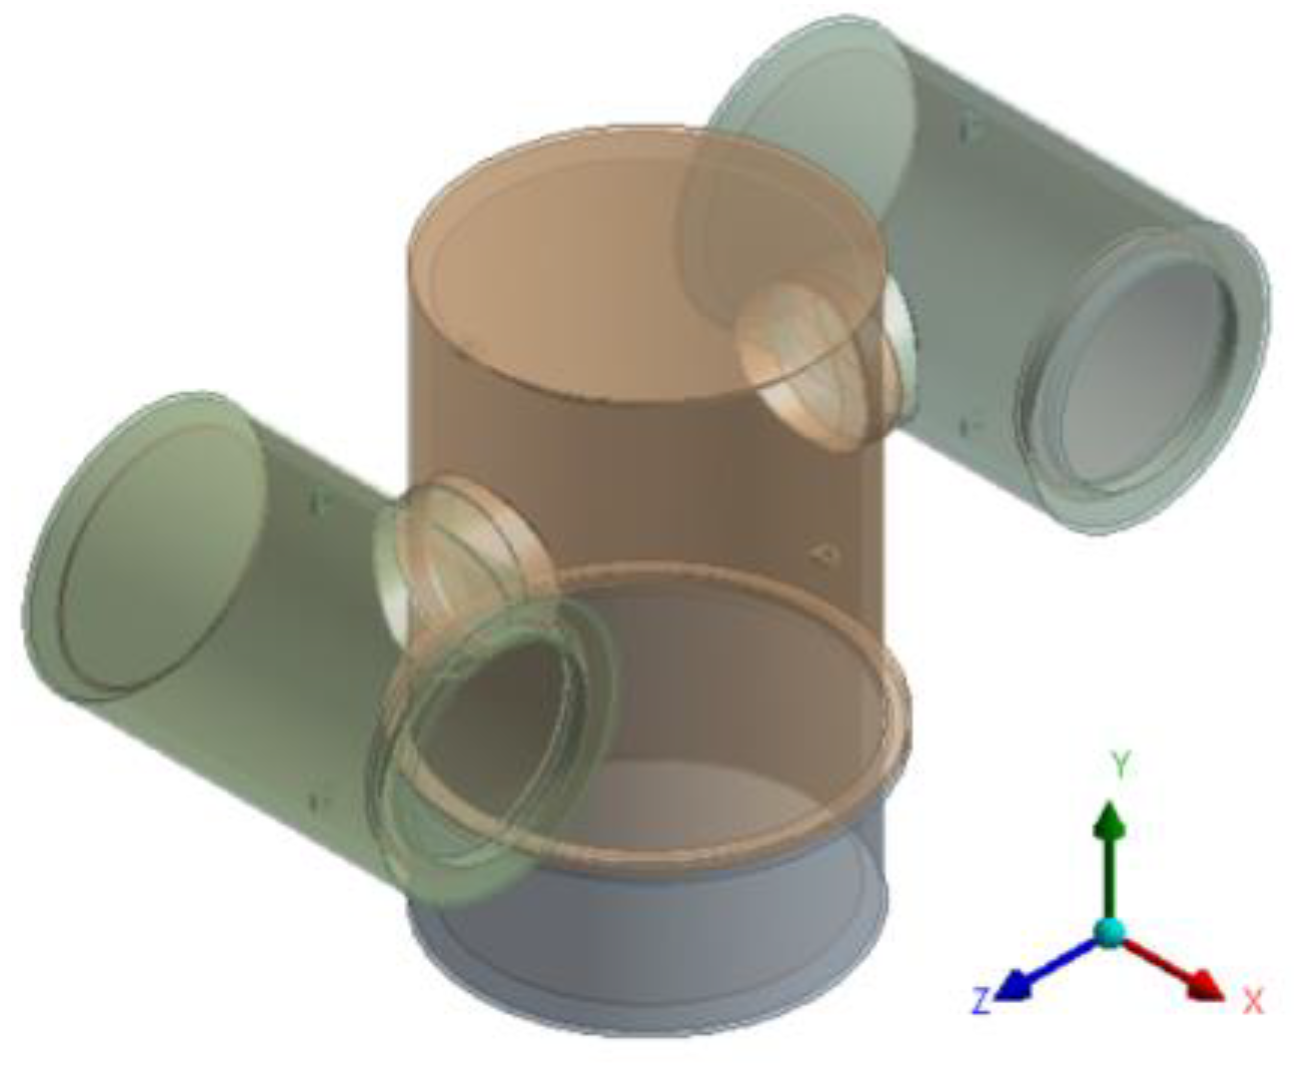
Figure 5 shows the pan–tilt with the composite thermal protection structure, including the details described above. When simulating engineering problems, it is necessary to appropriately simplify the model in order to improve computational efficiency. In this study, the boltholes and baffles in the model have been simplified. The skin is treated as a whole for the purposes of the simulation analysis. The thicknesses of the pan–tilt housing and the skin are each 0.002 m; the hollow glass and the cavity have diameters of 0.118 m and 0.114 m, and thicknesses of 0.01 m and 0.006 m, respectively.

3. Method and Model

3.1. Computational Domain

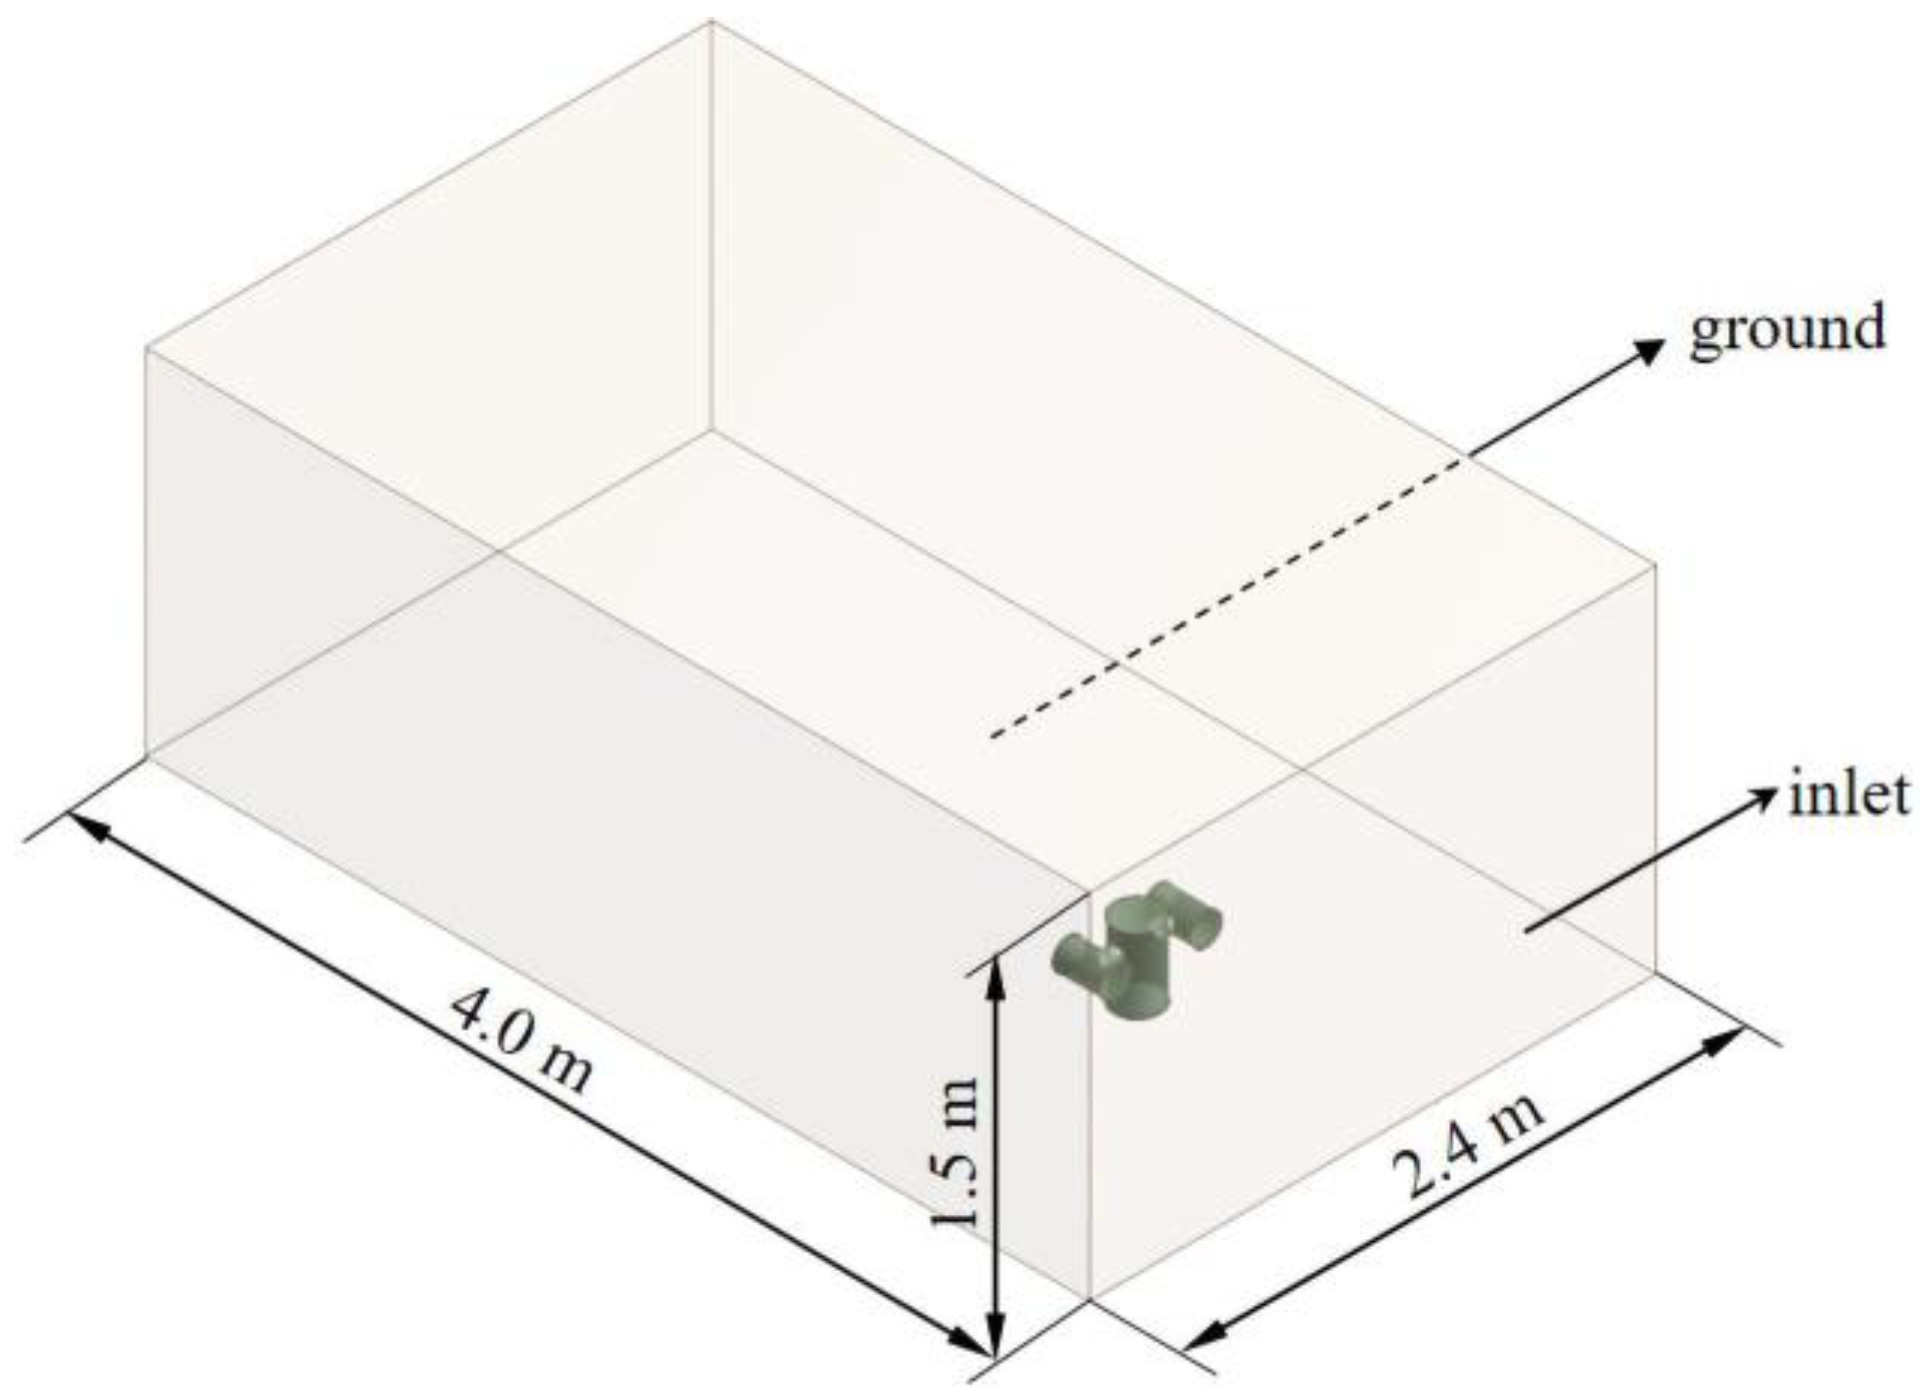
The size of the computational domain in relation to the structure affects the computational process and results. To enhance the calculation accuracy, each boundary surface of the computational domain ought to be as distant from the structure as would be feasible. Nevertheless, an overly large computational domain will result in a greater number of meshes, increased computation, and longer computation time. Therefore, combining the findings of Oliverira [29] and Lakehal [30] and the object and purpose of this paper, the sizes of the computational domain are determined by height of the pan–tilt in this study. The height of the simplified pan–tilt in Section 2 is denoted as HP. The height of the computational domain is 5 HP, and the overall length is greater than 12 HP, while the distance between the inlet of the computational domain and the pan–tilt is 3 HP. The aforementioned dimensioning arrangement avoids reflow at the boundary of the computational domain, thereby facilitating convergence of the computation and concomitantly ensuring the reliability of the results. The height of the simplified pan–tilt HP is 0.3035 m, and the computational domain measures 4.0 m × 2.4 m × 1.5 m, as shown in Figure 6. The bottom surface of the domain represents the ground, and the pan–tilt rests on it. The other boundaries are outlets, except for the inlet. Half of the domain is taken for simulation analysis, due to the symmetrical nature of the model of the pan–tilt and thermal protection structure.
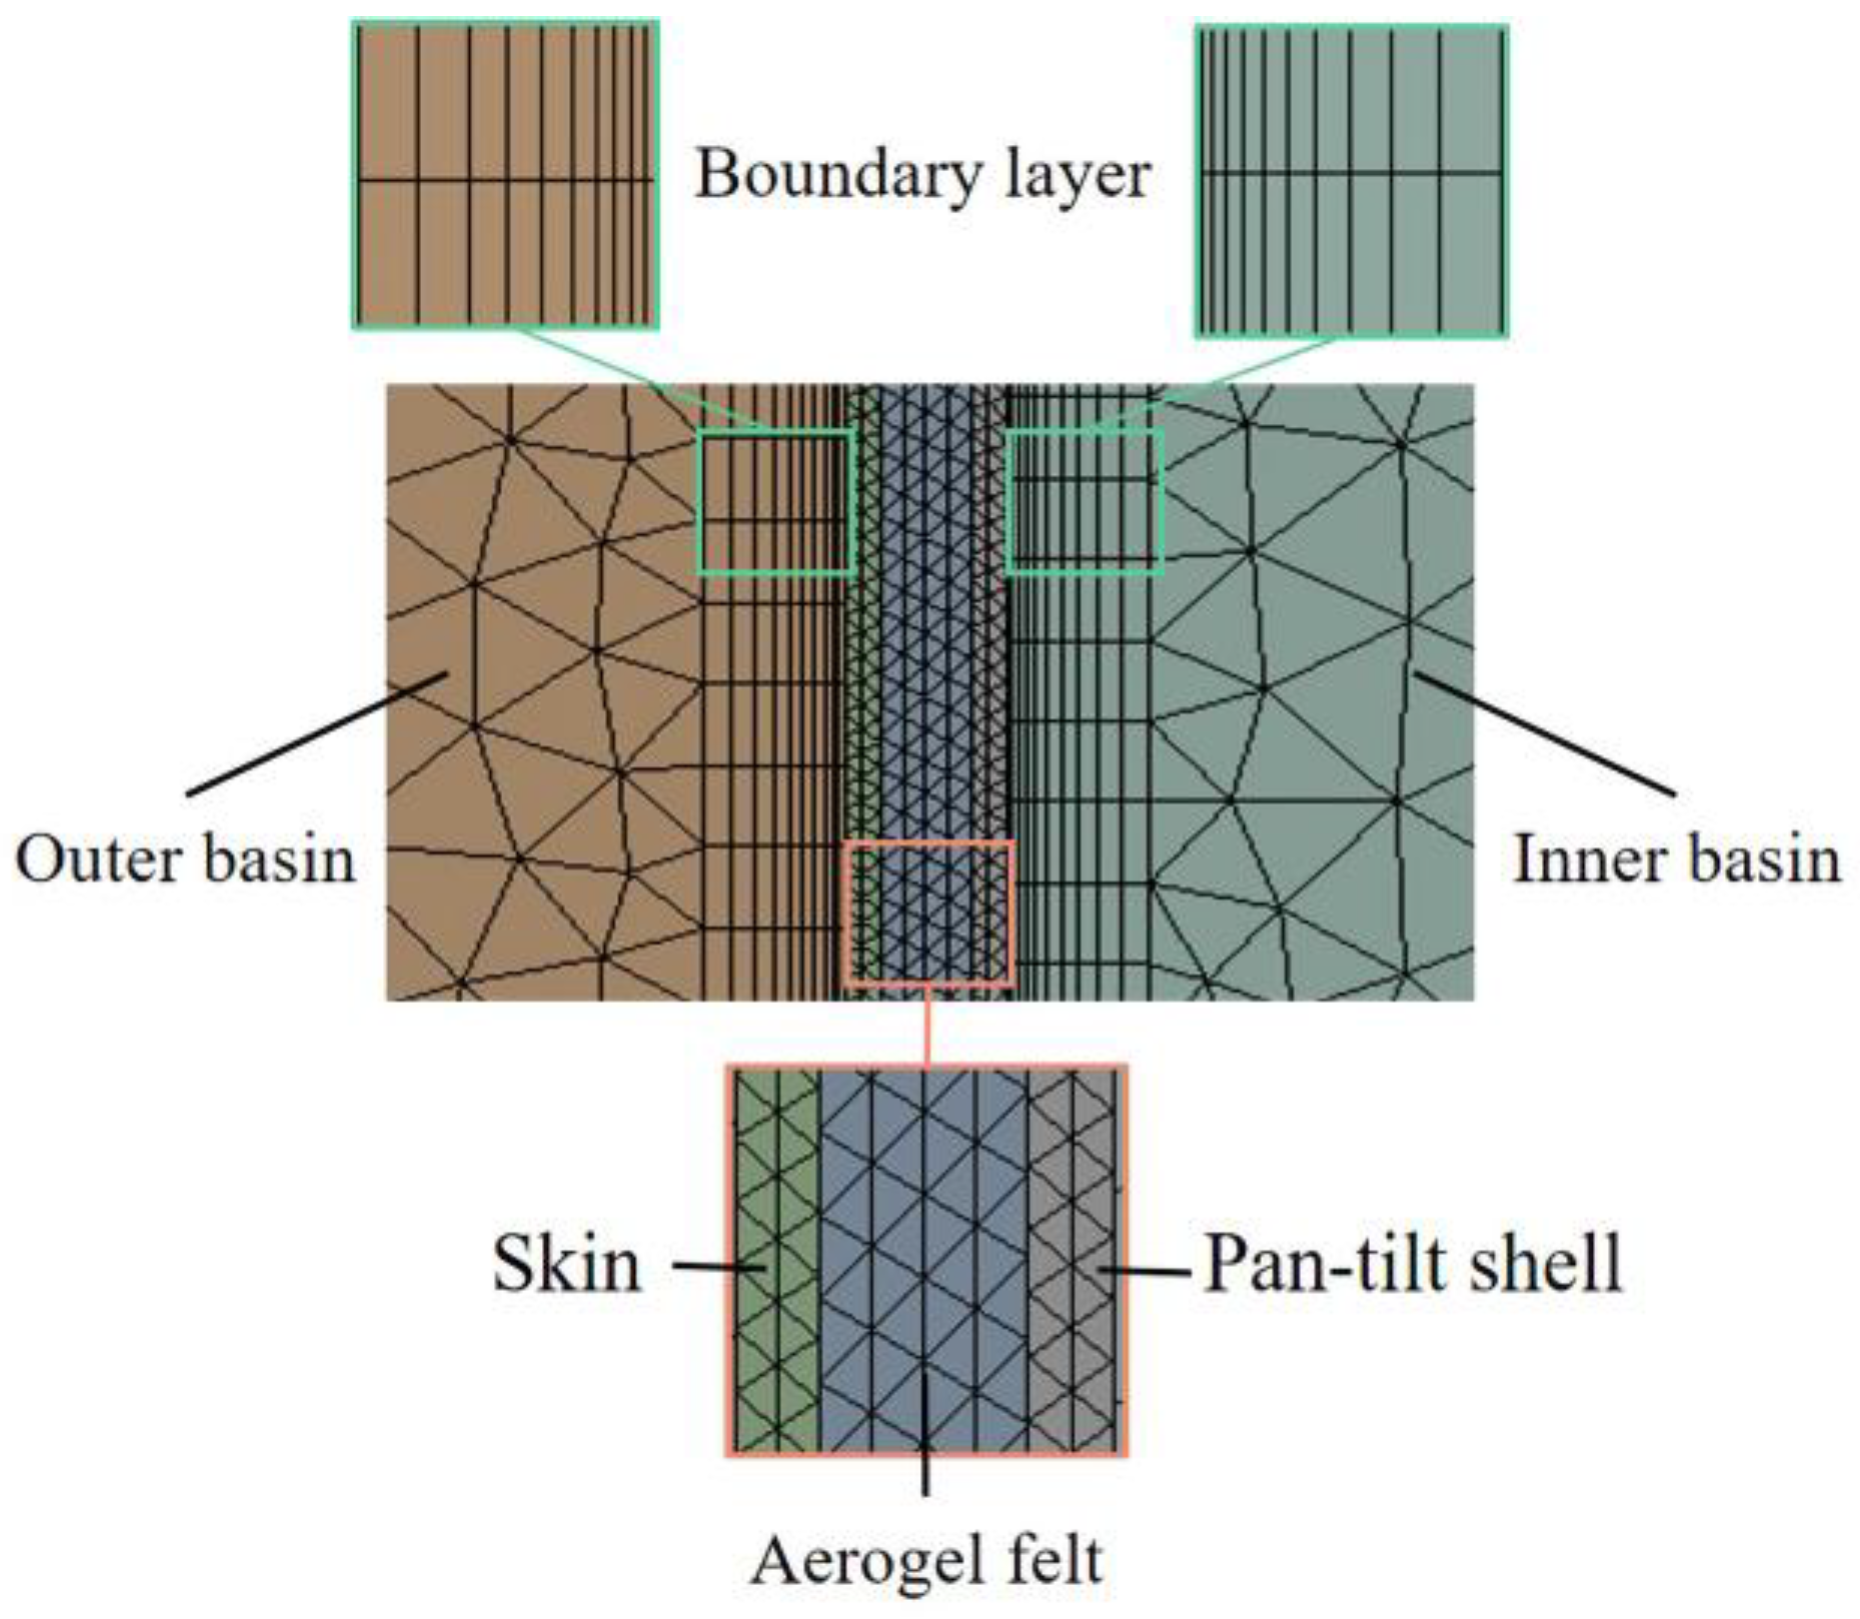
Due to the geometric complexity of the structure and pan–tilt, an unstructured mesh is employed for the domain. In the heat transfer analysis of a flow field, the velocity of fluid flow near the solid surface decreases substantially and the temperature changes sharply, which influences the accuracy of calculations and the simulation’s results. Hence, a denser mesh is necessary in these regions. For areas distant from the heat transfer region, a sparse mesh is employed in this paper to enhance computational efficiency and save computational time [31]. Figure 7 shows the meshing of each domain. To obtain accurate and reliable results, a 10-layer boundary is set near the fluid–solid interface. The meshes in the computational domain are dominated by tetrahedral meshes. Table 1 lists the number of meshes and nodes in each domain.
The overall computational domain model includes a steel skin, aerogel felt, quartz glass, and an aluminum alloy pan–tilt housing. The hollow glass is filled with either air or argon, respectively. In this study, SiO2 aerogel serves as the primary material and is combined with glass fibers to obtain a SiO2 aerogel flexible felt possessing a certain compressive strength. The physical properties of aerogel felt can be found in Ref. [32], and the physical properties of other relevant materials are given in Table 2. The thermophysical parameters of the materials, including thermal conductivity, usually change due to the influence of the temperature [33]. To ensure that the variation of material parameters does not affect the calculation results, the thermophysical parameters of the materials at different temperatures are used to establish the relationship between the thermophysical parameters of the materials and the temperature. Furthermore, the setup parameters are redefined in FLUENT 17.0 using piecewise-polynomial and piecewise-linear to improve the reliability of the calculation results.

3.2. Basic Equations

In this study, the commercial computational fluid dynamics software modules ANSYS Fluent 17.0 and ANSYS 17.0 are utilized to establish a fluid–solid–thermal coupling model for simulation and analysis. A finite-volume method is used in FLUENT to discretize the basic equations, including the fluid flow-governing and heat transfer equations. The velocity and density of air are continuous and differentiable functions of the spatial coordinates and time. The flow-governing equations in the numerical simulation of fluid flow include continuity equation, momentum equation, and energy equation [34].
The continuity equation describes the principle of conservation of mass of a fluid in motion, and can be expressed as in Equation (1) [35]. The equation expresses that the rate of change of the mass of air is equal to the difference between the inflow and outflow masses.
ρ t + d i v ρ U = 0
The momentum equation describes the principle of conservation of momentum of a fluid in motion, and it can be expressed as in Equation (2) [36]. The equation describes the rate of change of the momentum as being equal to the sum of the forces acting on the air.
ρ u t + d i v ρ u U = d i v μ g r a d Φ + S x p x ρ v t + d i v ρ v U = d i v μ g r a d Φ + S y p y ρ w t + d i v ρ w U = d i v μ g r a d Φ + S z p z
The energy equation describes the principle of conservation of energy in air in motion, and it can be expressed as in Equation (3) [36]. The equation describes the rate of change of the total energy per unit volume of air as being equal to the combined effects of inflow and outflow of energy, heat transfer, work done, and external energy sources.
ρ H t + ρ u H x + ρ v H y + ρ w H z = p d i v U + d i v λ g r a d T + Φ + S
The types of heat transfer include convective heat transfer, heat conduction, and radiative heat transfer. Figure 8 shows a schematic diagram of the heat transfer process.
Convective heat transfer is the process of transferring heat through the movement of air. In high-temperature environments, external heat is transferred to the skin of the structure through convective heat transfer. The heat flux density q conv of convective heat transfer is determined in the following [37]:
q conv = h ( T out T s )
Heat conduction usually occurs in solid systems with temperature differences, in which heat is transferred from high-temperature to low-temperature regions. Thermal resistance reflects the thermal protection performance of the structure and is inversely proportional to the heat transfer rate. The larger the thermal resistance, the better the thermal insulation capability of the structure. The thermal resistance of a multiple-layer structure is the sum of the thermal resistance of each layer. For a multiple-layer plate structure, the thermal resistance Rpi and heat flux density q p are as follows [38] (pp. 39–42):
R p i = d i λ i
q p = Δ T i = 1 n R p i = Δ T i = 1 n d i λ i
For a multiple-layer circular tube structure, the thermal resistance Rc and heat flux density q c are as follows [36]:
R c i = 1 2 π λ i ln r i + 1 r i
q c = Δ T i = 1 n R c i = Δ T i = 1 n 1 2 π λ i ln r i + 1 r i
Radiative heat transfer is the process by which objects transfer heat by emitting electromagnetic waves into their surroundings. As the temperature of the pan–tilt inner wall increases, heat is transferred to the inner basin through convection and radiation heat transfer. The heat flux density q rad of radiative heat transfer is as follows [38] (pp. 396–399):
q rad = ε σ T P 4 T in 4
The temperature variation in the structure and the heat transfer process are affected by the flow state and temperature of air. Therefore, the flow-governing and heat transfer equations are coupled at every time-step throughout the simulation. Initially, the flow-governing and heat transfer equations are established; this is followed by setting the boundary conditions. Subsequently, the mesh number and time-step of the model are verified. An iteration with a time-step of 0.2 s is employed to accurately solve the equations and model, facilitating the simultaneous calculation of flow and temperature fields, and ensuring that the calculation converges at each time-step.

3.3. Boundary Conditions

In this study, transient analysis is conducted to simulate the heat transfer process. The Shear Stress Transport (SST) k-omega model is selected as the turbulence model for air flow. The moving velocity of the robot ranges from 0 to 1 m/s. Taking into account its relative motion compared to the surrounding environment under the working conditions, the relative velocity of the robot pan–tilt in relation to the environment is set at 1.5 m/s. The robot pan–tilt is placed in an open space; thus, the outlet of the computational domain is designated as outflow, which is identical to the flow of the air entering the computational domain. The specific parameters and setting information are shown in Table 3.

3.4. Independence Analysis and Calculation Method Validation

The numerical results are affected by the mesh size of each domain. To ensure numerical accuracy and save computational resources, mesh independence must be validated.
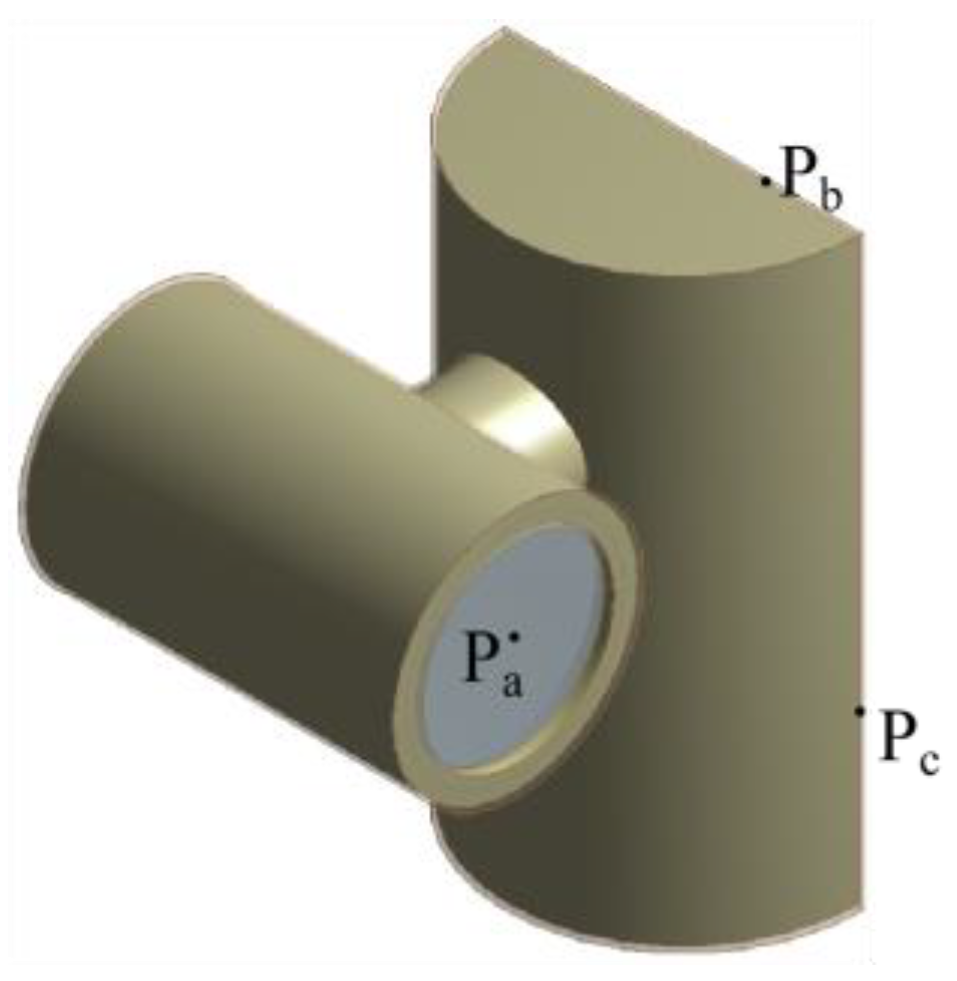
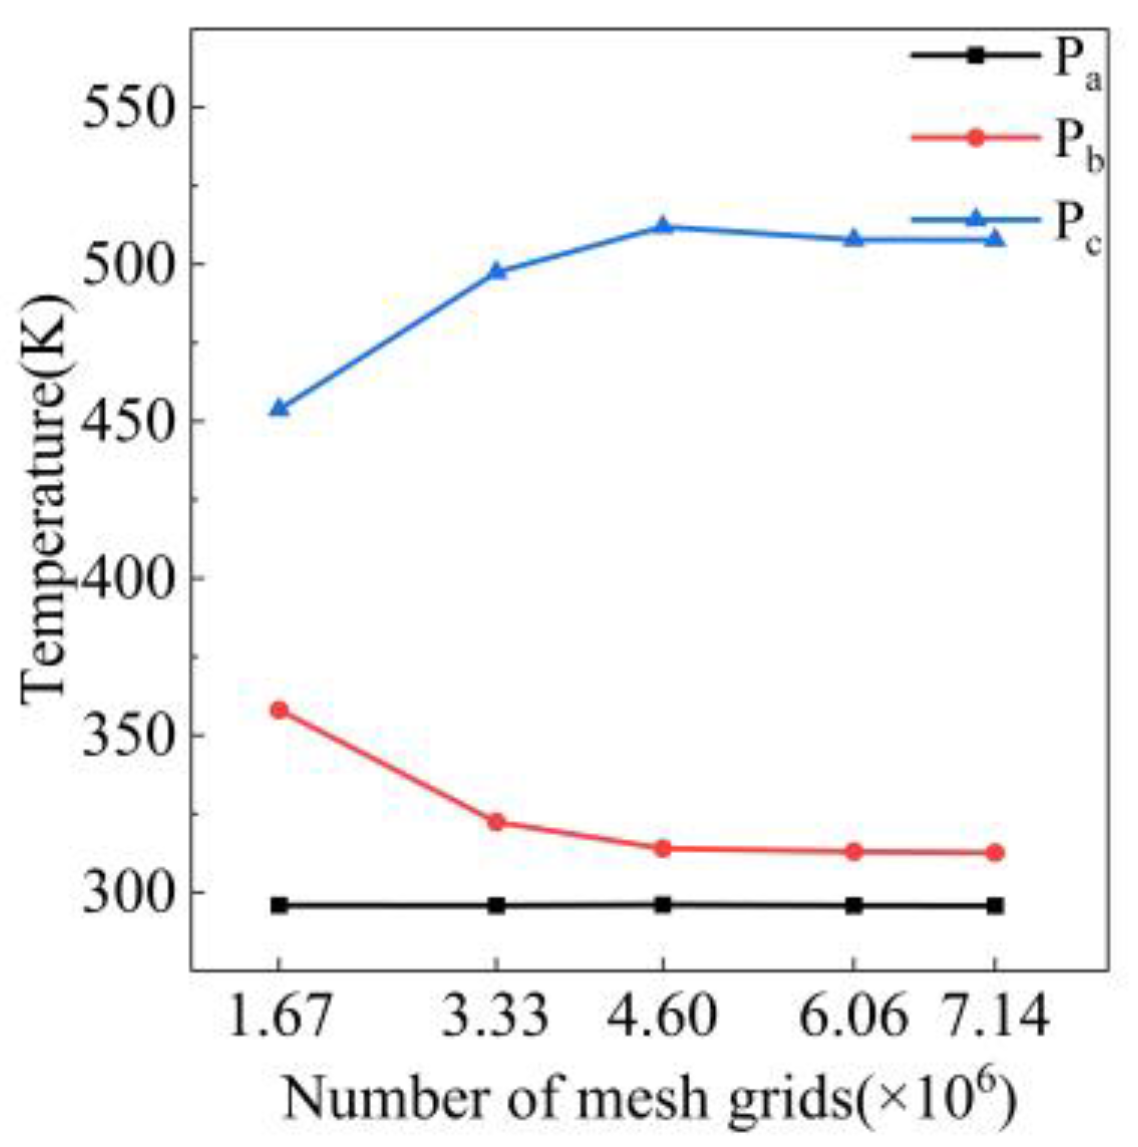
Figure 9 shows the positions of the mesh independence validation points Pa, Pb, and Pc. Figure 10 shows the temperatures of the three points, at 573.15 K under different mesh numbers. It can be observed that the temperatures of the points remain relatively invariant when the number of meshes reaches 4,600,000 or above. Consequently, the number of meshes is set at 4,600,000, with tetrahedral elements being used as the primary mesh type.
Due to the limitations of the experimental environment and conditions, the pan–tilt lug is used as the experimental research object. The model is validated by measuring and analyzing the temperature of the inner wall surface of the lug. The experimental block diagram is shown in Figure 11.
The furnace consists of four gas inlets and one gas outlet, which can be used to regulate the temperature of the experimental environment. The overall size of the specimen is 0.214 m × 0.11 m × 0.11 m; it consists of a thin housing with a thickness of 0.002 m, aerogel felt with a thickness of 0.01 m, a protective skin with a thickness of 0.002 m, and air-filled hollow glass. The glass thickness is 0.016 m and its diameter is 0.082 m, while the internal cavity thickness is 0.004 m and its diameter is 0.07 m. The specimen, with associated thermocouple sensors, is placed inside the furnace. The initial temperatures of both the environment and specimen are 278.15 K. After approximately 20 s, the temperature inside the furnace reaches 573.15 K. The experiment lasts for 30 min, during which the sensor outputs the data from the measurement point to the data acquisition system every minute.
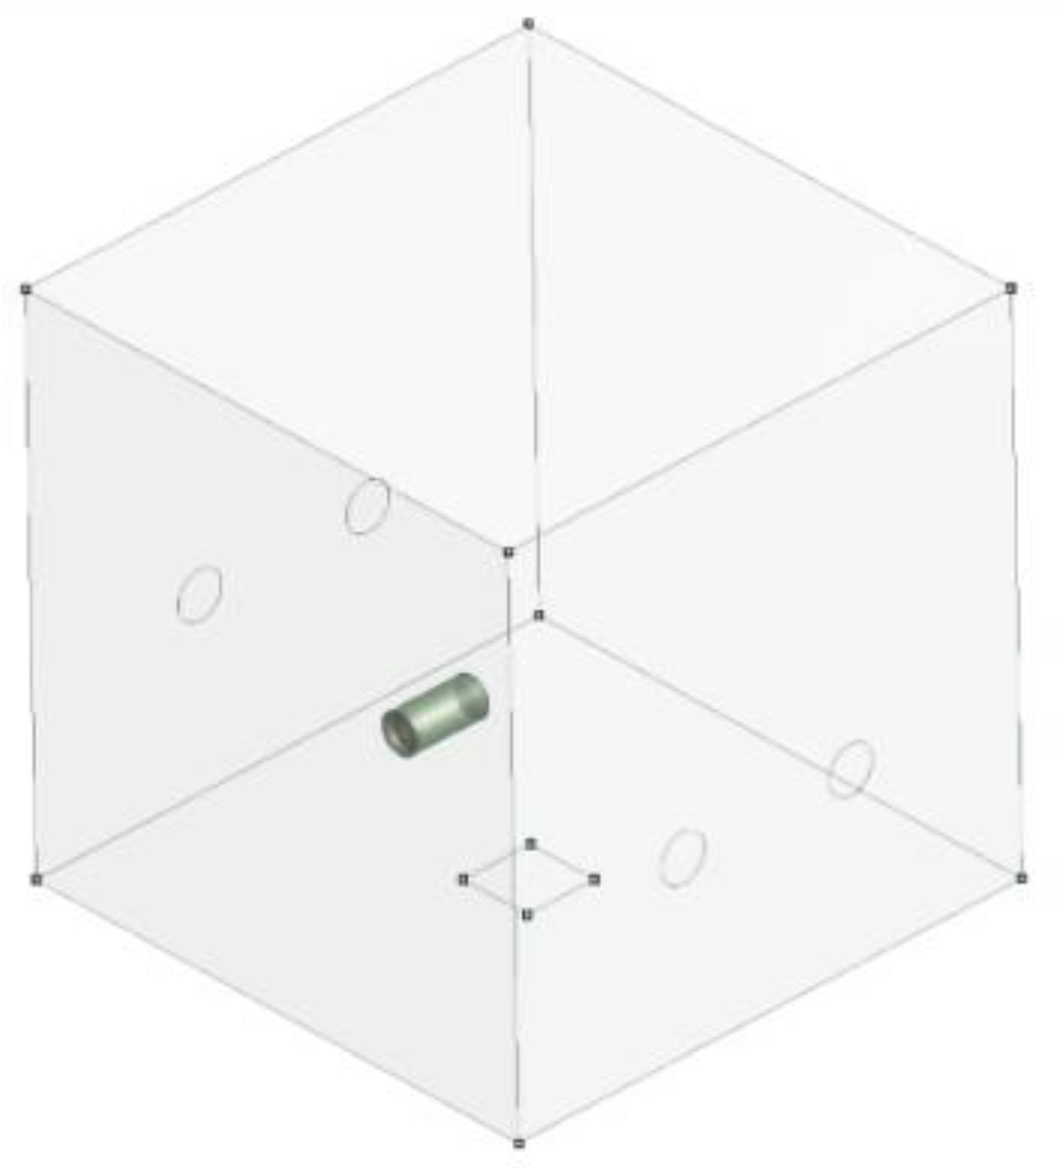
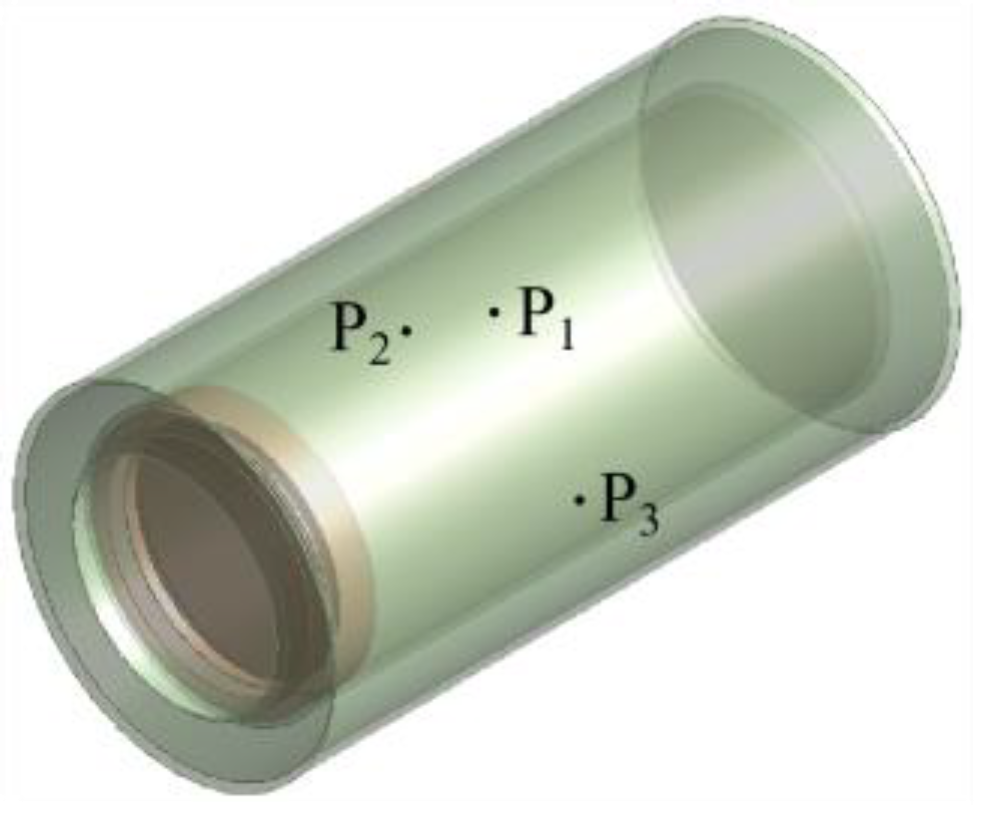
Figure 12 shows the computational domain model established based on the aforementioned experiment, the overall size of which is 1.5 m × 1.5 m × 1.5 m. The gas inlets are holes with a diameter of 0.13 m, the centers of which are 0.5 m away from the bottom and adjacent sidewall walls. The gas outlet is a square with a side length of 0.2 m, located at the center of the furnace bottom wall. The positions of the inlets and outlet are shown in Figure 12. The specimen is on the bottom wall of the furnace. Three temperature measurement points, P1, P2, and P3, are selected on the specimen’s inner wall. The positions of these points are shown in Figure 13.
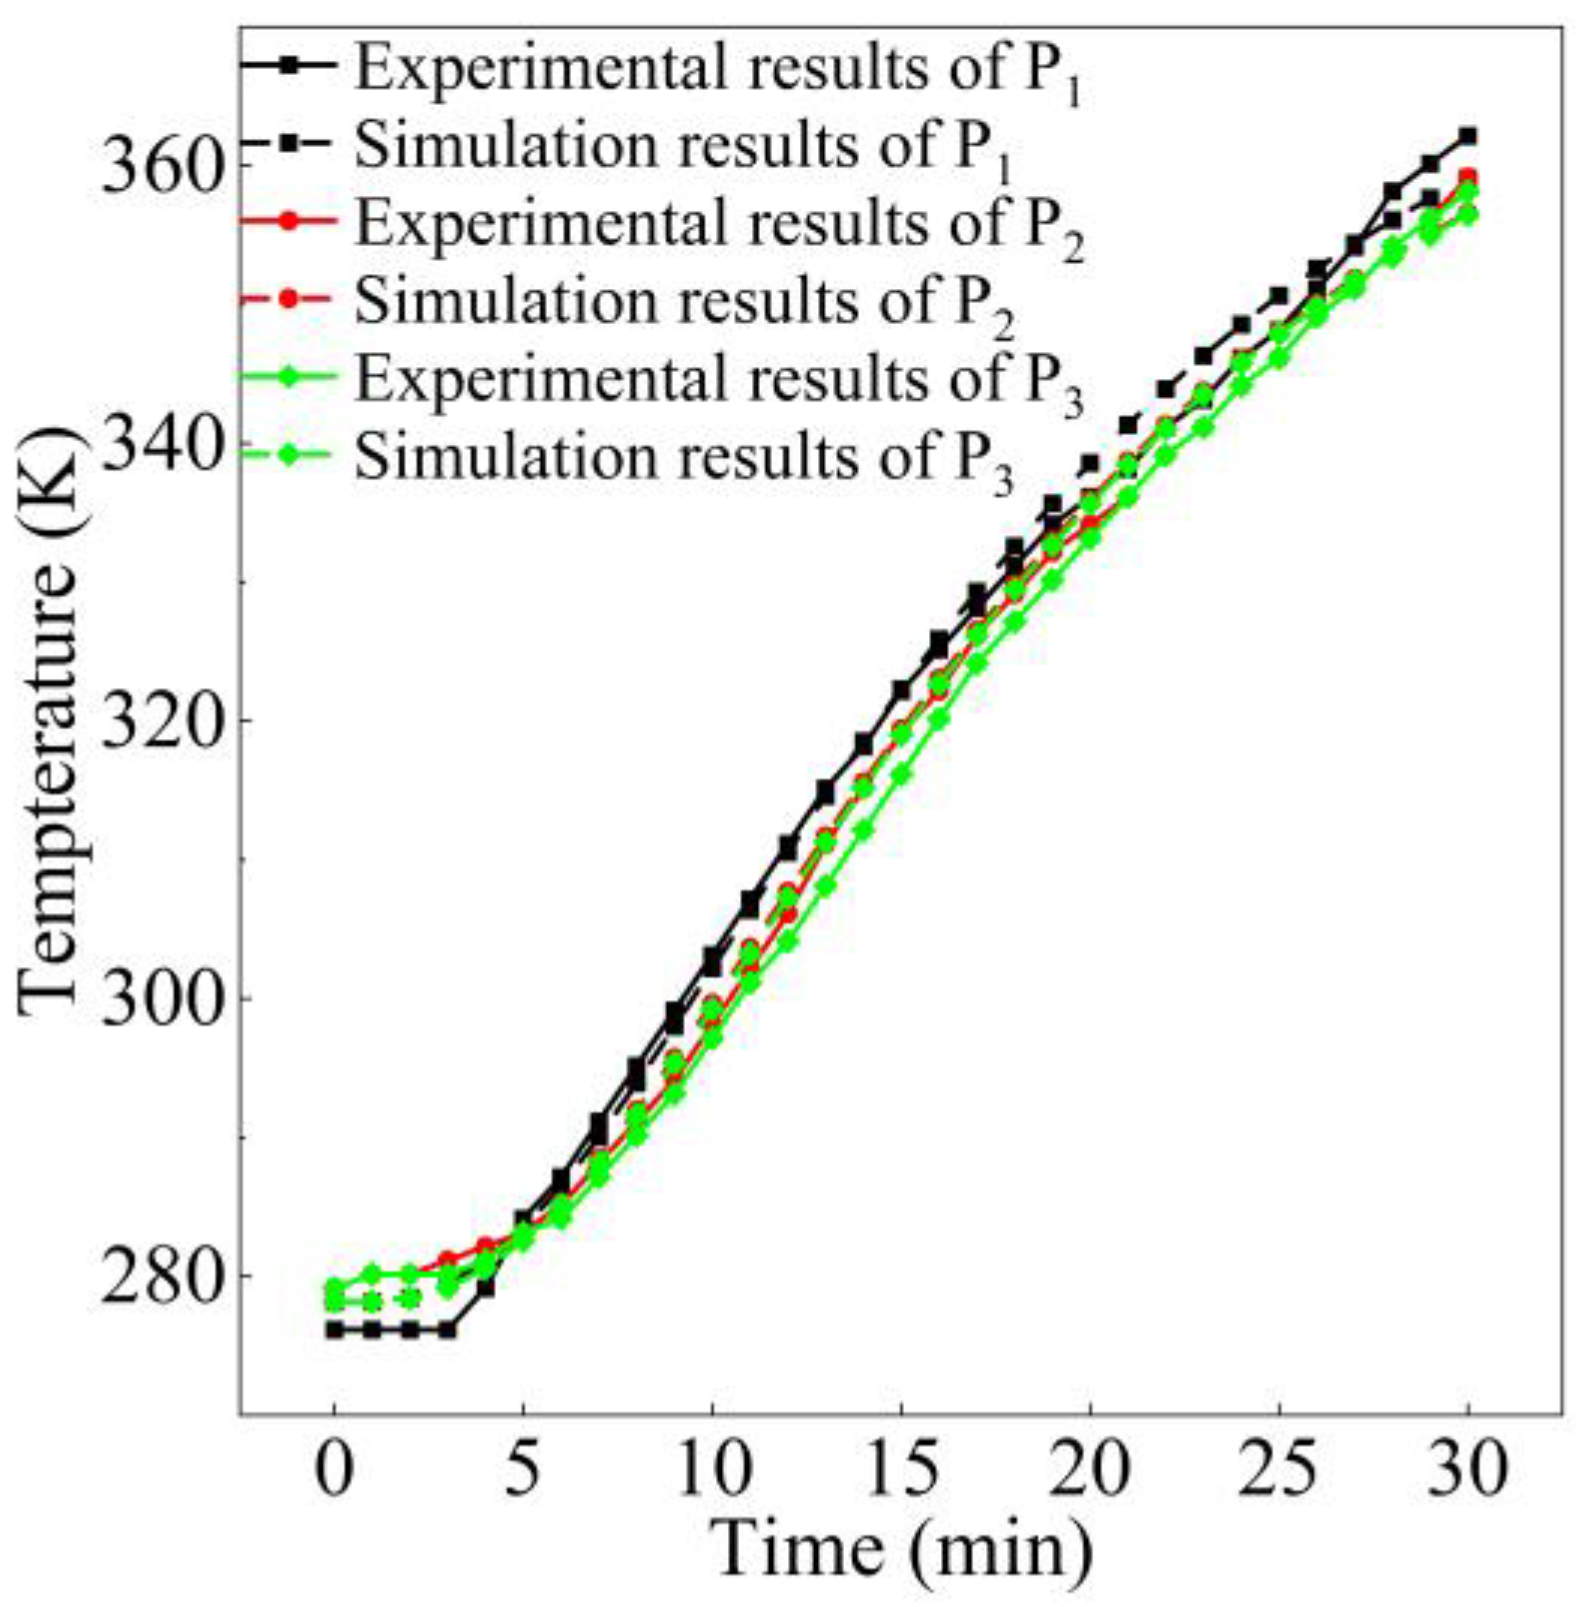
Figure 14 shows a comparison of the experimental and simulation results, under the same working conditions at the temperature measurement points. The maximum temperature differences in the three sets of data are 3.17 K, 2.53 K, and 3.13 K at the different time nodes, while the correlation coefficients are 0.9980, 0.9989, and 0.9983, respectively. The results indicate that the model established in Section 3 can meet the requirements for thermal protection performance simulation and analysis.

4. Results and Discussion

In this section, the model established in Section 3 was used to simulate and analyze the performance of the thermal protection structure. Firstly, the temperature distribution within the unprotected pan–tilt inner basin in a high-temperature environment was simulated. Then, the effects of aerogel felt thickness, glass structure type, and ambient temperature on the thermal protection performance of the composite structure were analyzed, respectively. It is assumed that the temperature of the external environment remains constant throughout the simulation, which spans a total of 600 s.

4.1. Temperature Distribution of the Unprotected Pan–Tilt Inner Basin

First, an unprotected pan–tilt was simulated and analyzed. The ambient temperature is 573.15 K, and the initial temperature of the pan–tilt and its inner basin is 278.15 K. Figure 15 shows the temperature contour of the unprotected pan–tilt inner basin.
As shown in Figure 15, at 30 s, 60 s, and 600 s, the maximum temperatures of the inner basin are 550.17 K, 565.69 K, and 570.40 K. Therefore, without the thermal protection structure, the temperature of the inner basin will exceed the operating temperature of the components in a short time, causing their functions to fail. It can also be determined that the heat is mainly transferred to the inner basin through the pan–tilt housing, indicating that the thermal resistance of the glass is higher than that of the housing.

4.2. Effect of Aerogel Felt Thickness on Performance

Figure 16 shows the temperature contour of the pan–tilt inner basin with different thicknesses of aerogel felt. The hollow glass used is air-filled. The ambient temperature is 573.15 K. The initial temperature of the structure and the pan–tilt and its inner basin is 278.15 K. By analyzing Figure 17, it can be observed that the temperature distribution of the inner basin remains consistent despite varying thicknesses of aerogel felt. At 600 s, the maximum temperatures of the inner basin are 401.25 K, 405.37 K, 381.44 K, and 395.06 K when the thicknesses of aerogel felt are 3 mm, 5 mm, 8 mm, and 10 mm, respectively. In comparison to Figure 15, it is evident that the temperature of the inner basin is significantly reduced.
From Figure 16, it can be seen that the maximum temperature does not exhibit a consistent trend with increases in aerogel felt thickness. In this regard, pan–tilts with installed structures with different thicknesses of aerogel felt were simulated and analyzed at temperatures of 373.15 K, 473.15 K, and 673.15 K. The maximum temperature and the total entropy of the inner basin were obtained, as shown in Figure 17.
From Figure 16 and Figure 17, the following can be determined:
(1) The installation of the thermal protection structure led to a considerable decrease in temperature variability within the inner basin of the pan–tilt, and the primary heat transfer path changed. When the thermal protection structure is not installed, the heat is mainly transferred from the housing to the inner basin; after the thermal protection structure is installed, the heat is mainly transferred from the glass to the inner basin. The temperature of the inner basin near the glass is higher than in other parts due to the thermal resistance of the glass being smaller than that of aerogel felt.
(2) The optimal thickness for the aerogel felt is 8 mm. When the aerogel felt thickness is 8 mm and the ambient temperatures are 373.15 K, 473.15 K, 573.15 K, or 673.15 K, the maximum temperatures of the pan–tilt inner basin are 300.46 K, 340.14 K, 384.44 K, or 424.36 K, and the total entropy values are 0.66 × 10⁷ J/(kg·K), 0.84 × 10⁷ J/(kg·K), 1.10 × 10⁷ J/(kg·K), or 1.40 × 10⁷ J/(kg·K), which are the smallest values under the same conditions.
(3) The change in the maximum temperature in the inner basin is the same as the change in the total entropy value. According to the second law of thermodynamics [39], when external high-temperature environments transfer heat to a fixed-capacity system, the total entropy of the system increases with the increases in its temperature. After the installation of the thermal protection structure, the smaller the maximum temperature and the total entropy of the inner basin, the better the thermal protection performance of the structure. At 673.15 K, when the aerogel felt thickness is 8 mm, the maximum temperature of the inner basin is reduced by 15.90%, 8.37%, and 6.22%, and the total entropy is reduced by 79.23%, 52.44%, and 12.5%, respectively, compared to the cases of 3 mm, 5 mm, and 10 mm thickness. At the other ambient temperatures, when the aerogel felt was 8 mm, the maximum temperature and the total entropy of the inner basin were lower than in the other three cases.
The above descriptions show that the thickness of the aerogel felt has a significant impact on the thermal protection performance of the structure. Continuously increasing the thickness of the aerogel felt negatively affects the protective performance of the structure. As the aerogel felt thickness increases from 3 mm to 8 mm, the thermal resistance of the structure increases, which slows down the rate of heat transfer to the inner basin and improves the thermal protection performance of the structure. However, when aerogel felt is further thickened to 10 mm, the thermal resistance is distributed in a seriously uneven manner, resulting in increased heat transfer to the inner basin through the hollow glass with lower thermal resistance. The reason for this phenomenon is that the thermal-protection function of the structure is achieved through aerogel felt, hollow glass, and skin. For thermal protection structures comprising a single material, an increase in the thickness of the material can enhance the protection performance of the structure. However, the structure proposed in this paper is designed to provide thermal protection to various locations on the pan–tilt using a combination of materials. When the entire protective structure is considered, the interaction between materials with different thermal insulation properties can lead to nonlinear results. Consequently, increasing only certain parameters of a single material may have an adverse effect on the overall performance of the structure. This accords with the results of Ding et al. as to the preparation of aerogel insulating coatings, determining that the insulation performance of the coatings does not continue to improve with the increase in the mass fraction of aerogel, and the best insulation performance is achieved when the mass fraction of aerogel is 5% [13]. Therefore, in conjunction with the purpose of this paper’s testing of the protective structure, it is necessary to comprehensively consider the thermal resistance distribution of the structure when improving its protective performance.
The heat transfer coefficient (HTC) reflects the rate of heat transfer between a solid and a fluid [40]. Given the complexity of the structure, the average HTC of its surface is used to evaluate the heat transfer rate. In FLUENT, the following formula can be used to calculate the average HTC havg of the structure:
h a v g = A h d A A
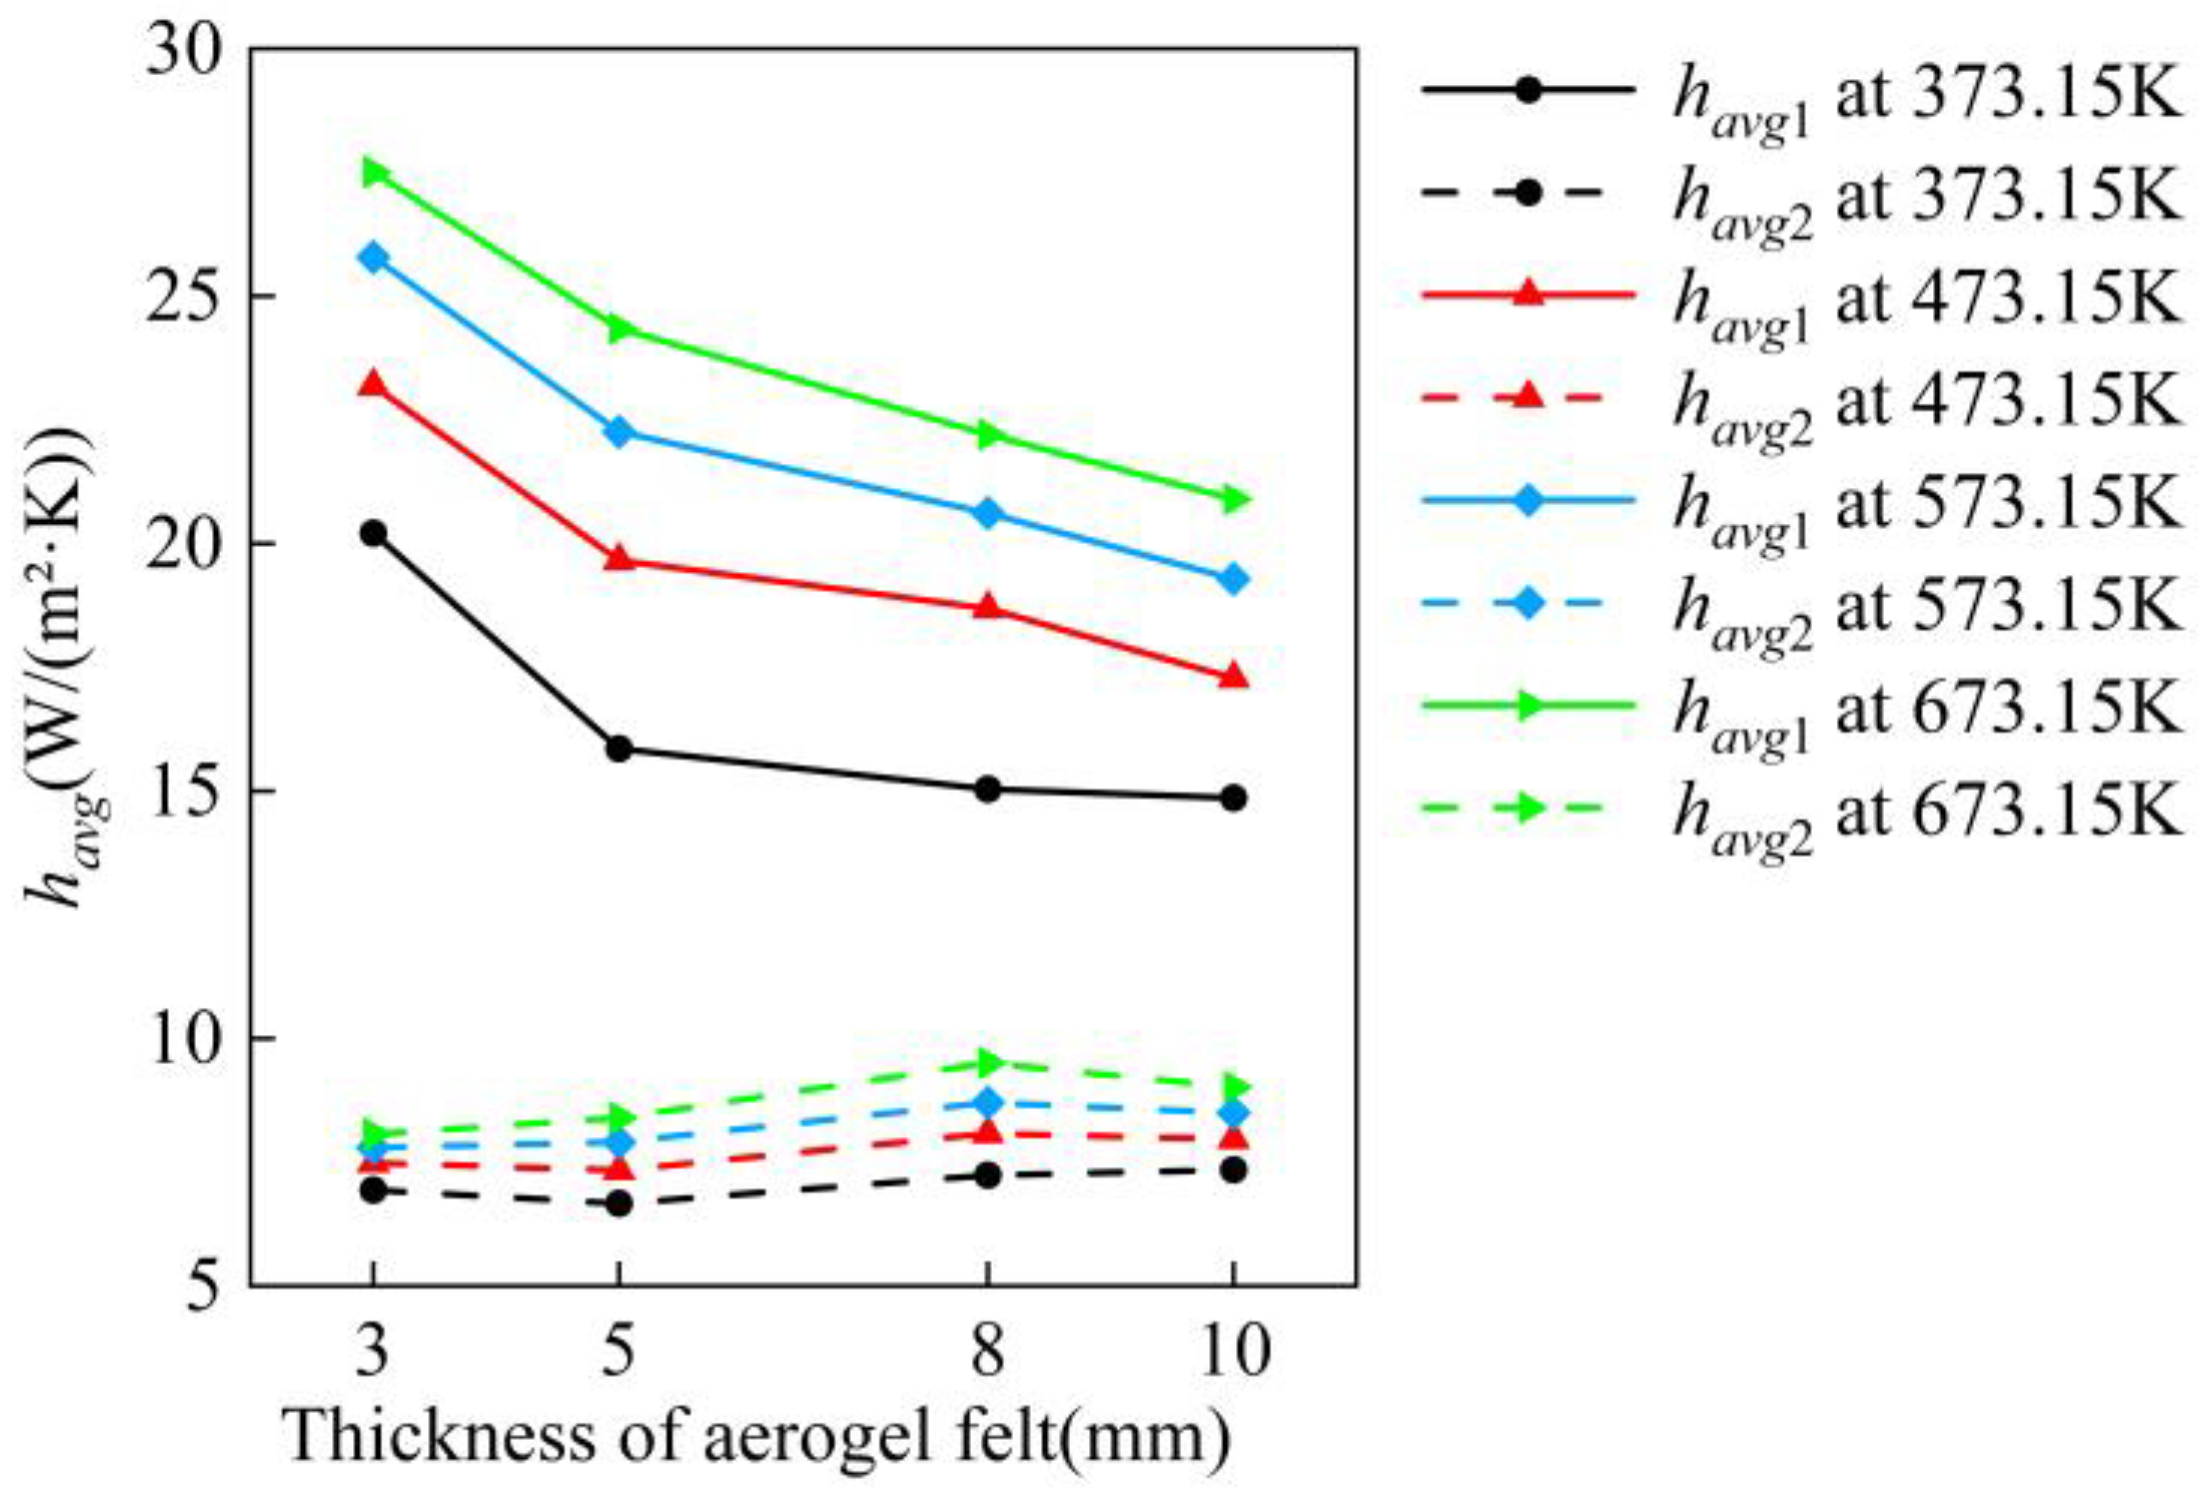
Figure 18 shows the havg of the structure with different thicknesses of aerogel felt. havg1 stands for the average HTC of the skin surface, and havg2 stands for the average HTC of the glass surface.
From Figure 18, it can be seen that havg1 decreases with an increase in aerogel felt thickness. When the aerogel felt thickness is 10 mm and the ambient temperature is 673.15 K, havg1 is 20.90 W/(m2·K), which is a reduction of 24.03%, 16.51%, and 5.90% compared to 3 mm, 5 mm, and 8 mm; however, havg2 increases slightly when the aerogel felt thickness is 8 mm, which is 17.84%, 13.21%, and 5.43% higher than with the thicknesses of 3 mm, 5 mm, and 10 mm at 673.15 K. The reason for this phenomenon is that the change in aerogel felt thickness affects the flow state of the high-temperature air on the wall of the structure. In addition, the surface heat transfer coefficients of the structure exhibit a consistent trend across different ambient temperatures.
The above description shows that the changes in the thickness of the aerogel felt directly affect the surface heat transfer coefficient of the structure. As the thickness of the aerogel felt increases, both the surface area of the skin and the thermal resistance of the aerogel felt increase, leading to reduced heat transfer through the skin and a subsequent decrease in the surface heat transfer coefficient of the skin. Moreover, the thickening of the aerogel felt influences the airflow near the surface of the glass, causing the average heat transfer coefficient of the glass surface to reach a peak at an aerogel felt thickness of 8 mm. The thermal resistance of the structure determines the heat transfer efficiency, while the heat transfer coefficient describes the rate of the heat transfer process. In this context, the performance of the thermal resistance plays a more significant role. Therefore, despite the higher heat transfer coefficient of the glass surface at an aerogel felt thickness of 8 mm compared to other thicknesses, the overall thermal resistance distribution of the structure is superior in this case, resulting in enhanced thermal protection performance.

4.3. Effect of Glass Structure Type on Performance

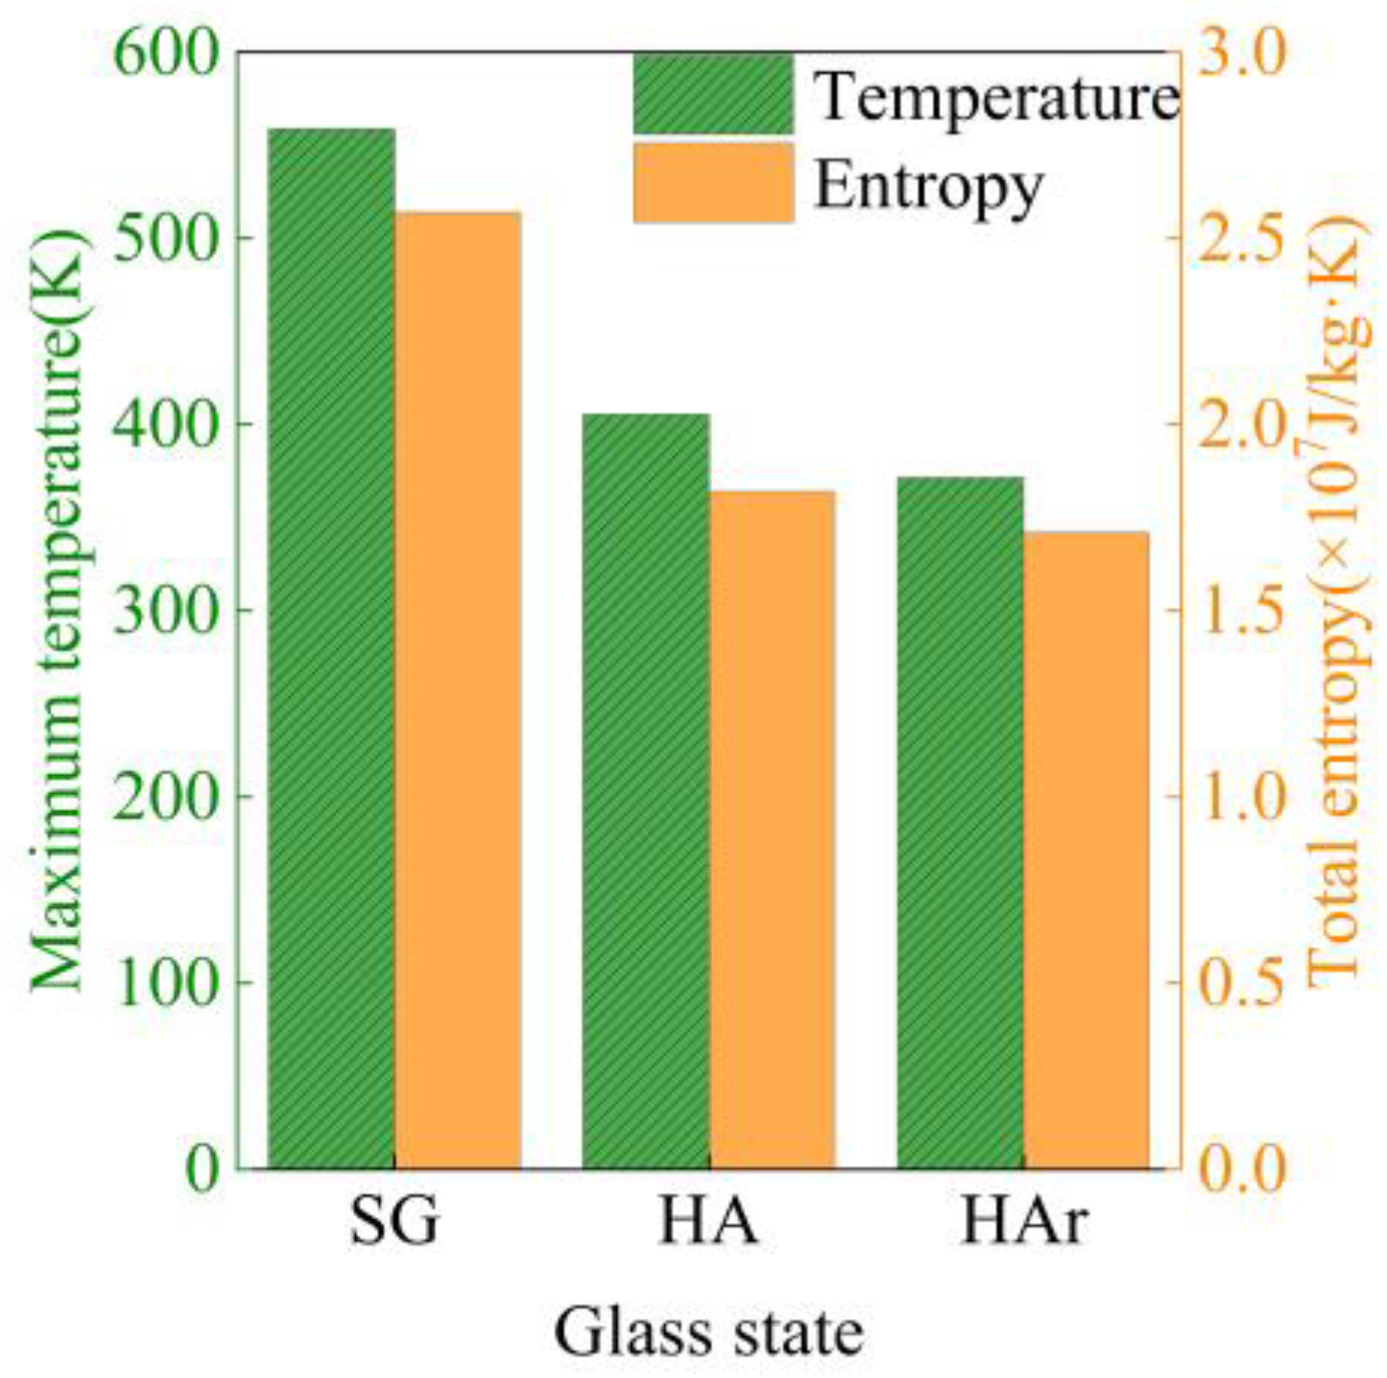
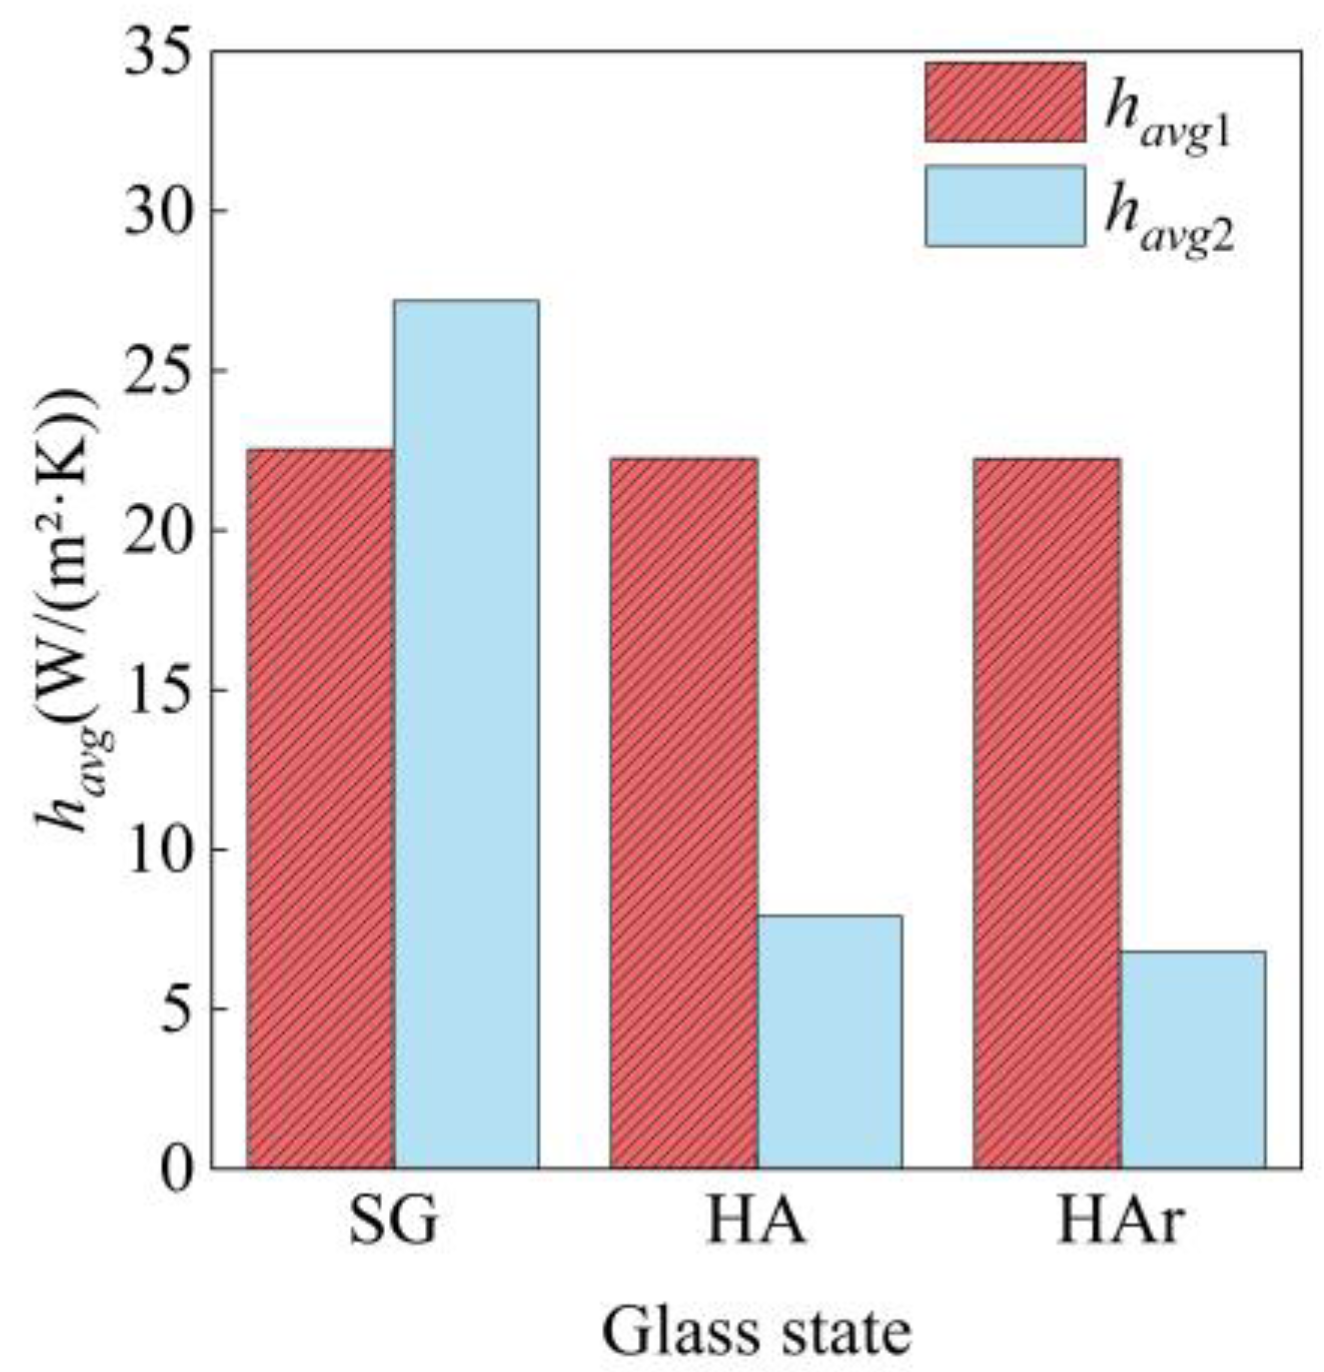
Figure 19 shows the temperature contour of the pan–tilt inner basin with different glass structure types. Figure 20 shows the maximum temperature and the total entropy of the inner basin with different glass structure types. Figure 21 shows the havg of the structure with different glass structure types. The thickness of aerogel felt is 5 mm. The ambient temperature is 573.15 K, while the initial temperature of the structure and the pan–tilt and its inner basin is 278.15 K.
From Figure 19, Figure 20 and Figure 21, the following can be seen:
(1) The temperature distribution trend in the inner basin remains consistent with the previous section, with the temperature near the glass being higher due to its lower thermal resistance, compared to other areas.
(2) When the thermal protection structure uses the argon-filled hollow glass, the maximum temperature and the total entropy of the inner basin are 371.4 K and 1.71 × 10⁷ J/(kg·K). Compared to the single-layer glass and air-filled hollow glass, the maximum temperature is reduced by 33.52% and 8.40%, and the total entropy is reduced by 33.46% and 6.04%, respectively, when the argon-filled glass is used. The change in glass structure has a similar effect on the maximum temperature and the total entropy of the inner basin. The reason is that single-layer glass, air-filled hollow glass, and argon-filled hollow glass can limit the transfer of external heat to the inner basin within a certain proportion, resulting in similar trends in the maximum temperature and the total entropy.
(3) havg1 remains relatively invariant, while havg2 changes significantly. At an ambient temperature of 573.15 K, the havg1 are 22.54 W/(m2·K), 22.26 W/(m2·K), and 22.25 W/(m2·K); the argon-filled glass havg2 is 6.8 W/(m2·K), representing decreases of 74.98% and 13.98%, compared to the single-layer and air-filled glass, respectively.
The above results show that the thermal protection performance of the hollow glass structure is better than that of the single-layer glass. The hollow glass exhibits high thermal resistance and a small surface-average-heat-transfer coefficient, which reduces the rate of heat transfer to the inner basin, thereby improving the thermal protection performance of the structure. Additionally, the performance of the thermal protection structure improves as the thermal conductivity of the gas filled into the hollow glass decreases.

4.4. Effect of Ambient Temperature on Performance

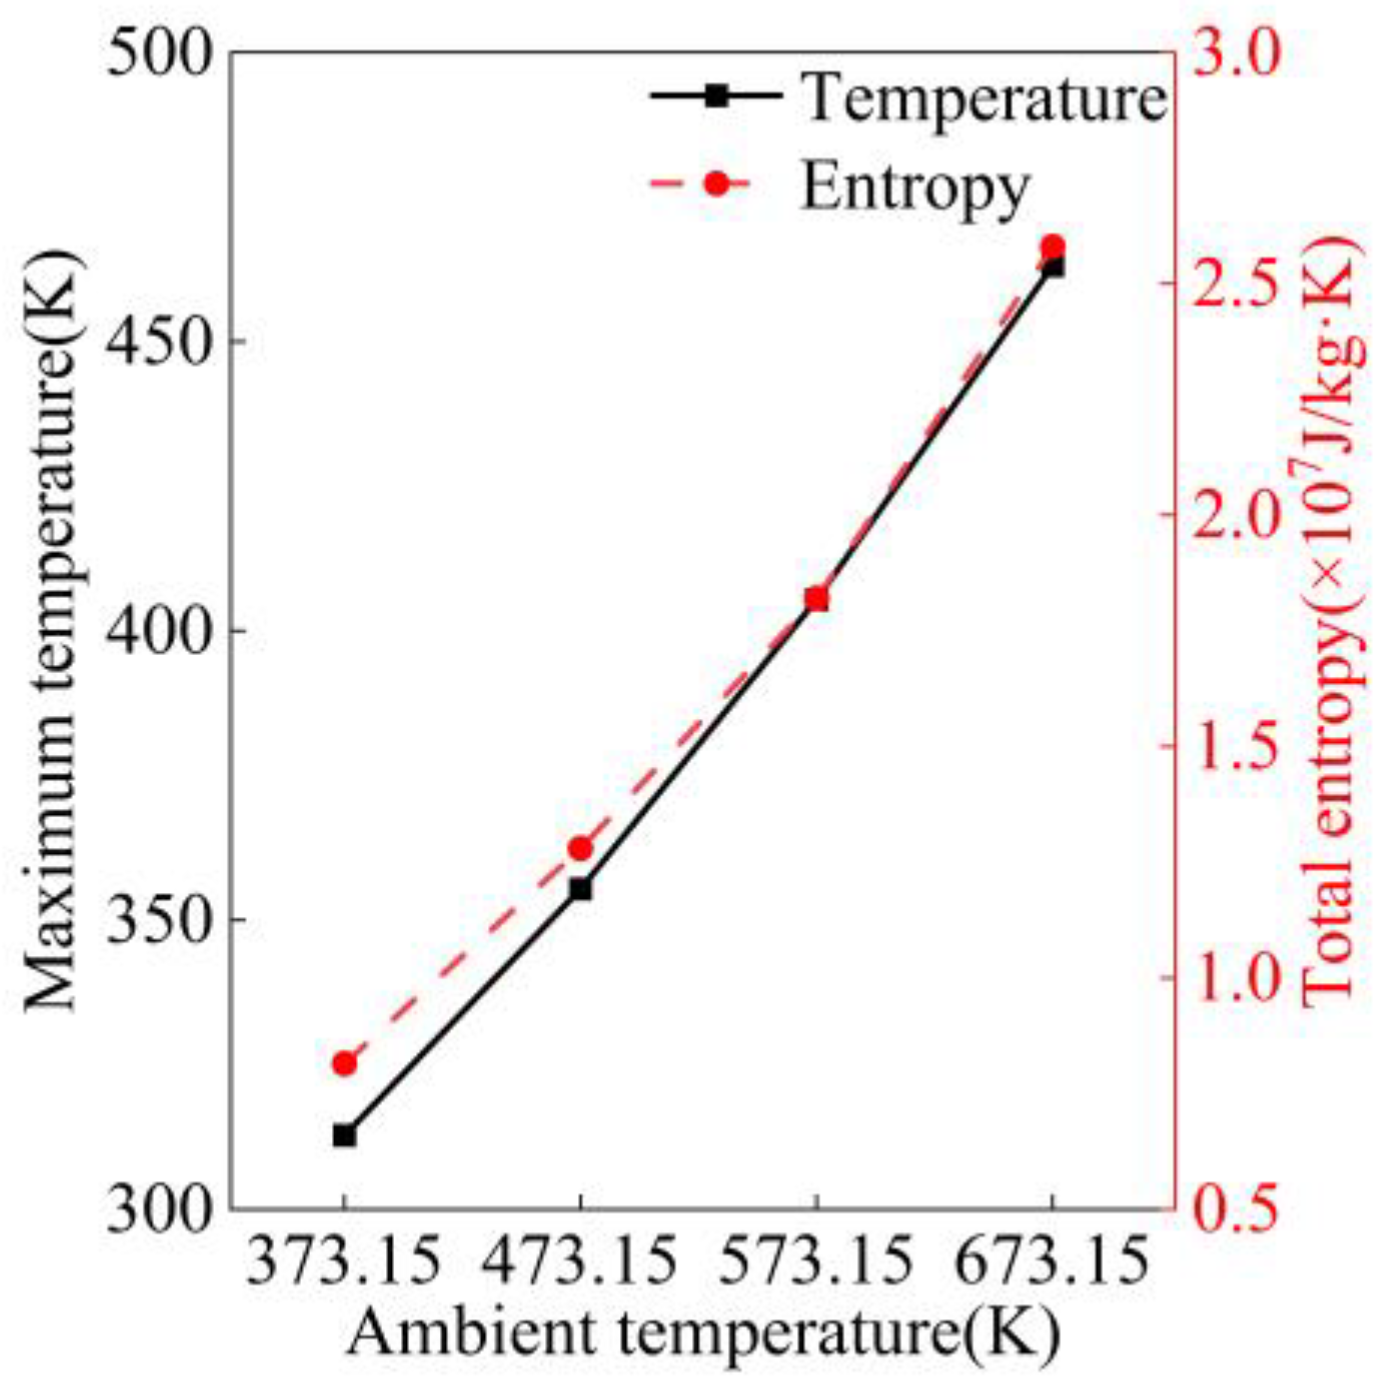
Figure 22 shows the temperature contour of the pan–tilt inner basin at different ambient temperatures. Figure 23 shows the maximum temperature and the total entropy of the inner basin at different ambient temperatures. Figure 24 shows the havg of the structure at different ambient temperatures. The aerogel felt thickness is 5 mm, and the glass is air-filled hollow glass. The initial temperature of the structure, the pan–tilt, and its inner basin is 278.15 K.
From Figure 22, Figure 23 and Figure 24, the following can be seen:
(1) The temperature of the inner basin area near the glass is higher due to the lower thermal resistance of the glass in the overall structure. This conclusion is consistent with the previous analysis.
(2) The maximum temperature and the total entropy of the inner basin exhibit positive correlations with ambient temperature. At 373.15 K, the maximum temperature and the total entropy of the inner basin are 312.80 K and 0.82 × 10⁷ J/(kg·K). When the ambient temperature is 473.15 K, 573.15 K, or 673.15 K, the maximum temperature of the inner basin increases by 13.61%, 29.60%, or 48.06%, and the total entropy increases by 57.06%, 123.31%, or 216.56%, respectively, as compared to 373.15 K. In addition, this also shows that with an increase in ambient temperature, the maximum temperature and the total entropy of the inner basin have similar trends. As the temperature difference increases, the heat transfer rate increases, resulting in proportional increases in the maximum temperature and the total entropy of the inner basin.
(3) As the ambient temperature increases, the havg of the structure increases gradually. At 373.15 K, the havg1 and havg2 are 15.86 W/(m2·K) and 6.67 W/(m2·K). When the ambient temperature is 473.15 K, 573.15 K, or 673.15 K, the havg1 increases by 23.96%, 40.35%, or 53.53%, and the havg2 increases by 10.04%, 18.59%, or 25.94%, respectively, compared to 373.15 K.
According to the above analysis, it is evident that as the ambient temperature increases, the maximum temperature and the total entropy of the inner basin tend to increase. The reason for this is that the increase in temperature difference leads to an increase in the quantity of heat transfer through the thermal protection structure. The average surface-heat-transfer coefficient of the structure increases with increasing ambient temperature, further reflecting the increase in the rate of heat transfer. The results show that the ambient temperature directly affects the temperature and the entropy rise in the inner basin, and also indicates the limited adaptability of the structure to high-temperature environments.

5. Conclusions

A thermal protection structure is an important means, ensuring that robots and other equipment can work properly in a high temperature environment. This study focuses on the robot pan–tilt as the subject of the research and proposes a composite thermal protection structure, including aerogel felt and hollow glass, to provide thermal protection for the robot pan–tilt. By comparing and analyzing the maximum temperature and the total entropy of the pan–tilt inner basin and the average surface-heat-transfer coefficient of the structure, this paper investigates the effects of changes in the thickness of the aerogel felt, the type of glass and the ambient temperature on the protection performance of the structure. The specific conclusions are as follows:
(1)
The thermal resistance distribution in the structure determines the heat transfer path. Without thermal protection, heat transfers through the pan–tilt housing to the inner basin; with protection, heat moves through the glass with lower thermal resistance to the inner basin.
(2)
Continuous thickening of the aerogel felt negatively affects the protective performance of the structure. The optimal thickness is 8 mm. At 673.15 K, an 8 mm thickness reduces the inner basin maximum temperature by 15.90%, 8.37%, and 6.22%, and the total entropy by 79.23%, 52.44%, and 12.5%, compared to 3 mm, 5 mm, and 10 mm.
(3)
The lower thermal conductivity of the gas in the hollow glass can reduce the maximum temperature and the total entropy of the inner basin, as well as the havg2 of the glass. At 573.15 K, argon-filled hollow glass reduces the maximum temperature by 33.52% and 8.40%, the total entropy by 33.46% and 6.04%, and the havg2 by 74.98% and 13.98%, compared to single-layer and air-filled glass.
(4)
Higher ambient temperatures can increase the maximum temperature and the total entropy of the inner basin, as well as the havg of the structure. At 473.15 K, 573.15 K, and 673.15 K, the maximum temperature increases by 13.61%, 29.60%, and 48.06%, the total entropy by 57.06%, 123.31%, and 216.56%, the havg1 by 23.96%, 40.35%, and 53.53%, and the havg2 by 10.04%, 18.59%, and 25.53%, compared to 373.15 K.
(5)
As the ambient temperature rises, the maximum temperature and the total entropy of the inner basin of the pan–tilt gradually become larger, indicating that the adaptability of the pan–tilt with the installed thermal protection structure to the ambient high temperature is limited, and the protection performance of the structure needs to be further improved.
The results above indicate that in the design of composite thermal protection structures, it is crucial to comprehensively consider the performance of different materials and the thermal resistance of each component. This ensures that enhancing the performance of one material component alone does not compromise the overall protective capability of the structure. Additionally, it is important to factor-in the influence of ambient temperature fluctuations on the installed thermal protection structure to minimize the risk of functional failure. In subsequent research, the inclusion of the porosity of the aerogel as a critical parameter in modeling is anticipated to refine the simulation of heat transfer properties. This refinement could necessitate the application of advanced modeling techniques, such as those involving porous media, or methods that integrate fluid-dynamics equations. Furthermore, a meticulous analysis of the relationship between the distribution of thermal resistance and the consequential changes in the thermal protection performance of the structure will be conducted, thus advancing our predictive capabilities and optimizing the design of thermal protection systems.

Author Contributions

Conceptualization, B.S.; methodology, B.S. and S.T.; software, S.T.; validation, S.T.; formal analysis, S.T.; investigation, S.T.; resources, B.S.; data curation, S.T.; writing—original draft preparation, S.T.; writing—review and editing, B.S., T.L., S.S., and H.S.; supervision, B.S. and T.L. All authors have read and agreed to the published version of the manuscript.

Funding

This research was funded by National Natural Science Foundation of China, grant number U20A20201 and S&T Program of Hebei, grant number 225676163GH.

Data Availability Statement

Data will be made available by the author or corresponding author upon reasonable request.

Conflicts of Interest

The authors declare no conflicts of interest.

Nomenclature

AArea (m2)
CpSpecific heat capacity (J·kg−1·K−1)
diThickness of flat plate structure (m)
HEnthalpy (J·kg−1·K−1)
HPHeight of pan–tilt (m)
hHeat transfer coefficient (W·m−2·K−1)
havgAverage heat transfer coefficient (W·m−2·K−1)
Pa, b, cMesh independence verification points
P1, 2, 3Temperature measurement points
pPressure (Pa)
qconvConvective heat flux density (W·m−2)
qcHeat flux density of circular tube heat conduction (W·m−2)
qpHeat flux density of plate heat conduction (W·m−2)
qradHeat flux density of radiation heat transfer (W·m−2)
RcCircular tube thermal resistance (m·K·W−1)
RpPlate thermal resistance (m·K·W−1)
ri,i+1Inner and outer radius of circular tubes (m)
SSource term in the energy conversion process
Sx,y,zSource terms of three momentum equations
TTemperature (K)
ToutTemperature of the outer basin (K)
TinTemperature of the inner basin (K)
TsTemperature of the outer wall of the skin (K)
TPTemperature of the pan–tilt inner wall (K)
ΔTTemperature difference (K)
tTime (s)
UVelocity vector (m·s−1)
u, v, wComponent of U in the x, y, and z
x, y, zDirection of the coordinate axis
Greek letters
ρDensity (kg·m−3)
μDynamic viscosity (kg·m−1·s−1)
λThermal conductivity (W·m−1·K−1)
ΦGeneral Variables
σStefan-Boltzmann (−)
εEmissivity
Subscript
inInner basin
outOuter basin
iNumber (-)
sSkin outer wall
PPan–tilt inner wall
Abbreviation
SGSingle-layer glass
HAAir-filled hollow glass
HArArgon-filled hollow glass

References

  1. Dong, B.; Zhang, Z.; Xu, L.; Zhu, Z.; Yang, Q.; Zhao, J.; Li, D.; Chen, S. Research status and development trend of intelligent emergency rescue equipment. Chin. J. Mech. Eng. 2020, 56, 1–25. [Google Scholar] [CrossRef]
  2. Nagatani, K.; Kiribayashi, S.; Okada, Y.; Otake, K.; Yoshida, K.; Tadokoro, S.; Nishimura, T.; Yoshida, T.; Koyanagi, E.; Fukushima, M.; et al. Emergency response to the nuclear accident at the Fukushima Daiichi Nuclear Power Plants using mobile rescue robots. J. Field Robot. 2013, 30, 44–63. [Google Scholar] [CrossRef]
  3. Arunkumar, V.; Rajasekar, D.; Aishwarya, N. A Review Paper on Mobile Robots Applications in Search and Rescue Operations. Adv. Sci. Technol. 2023, 6680, 65–74. [Google Scholar] [CrossRef]
  4. Bonfitto, A.; Amati, N. Mechanical Construction and Propulsion Analysis of a Rescue Underwater Robot in the case of Drowning Persons. Appl. Sci. 2018, 8, 693. [Google Scholar] [CrossRef]
  5. Yadav, S.; Raghuvanshi, R.; Bhadviya, A.; Sonare, R.; Paliwal, S.; Kashiv, V. Study and development of searching casualty and detecting fire by rescue robot. IOP Conf. Series: Mater. Sci. Eng. 2021, 1136, 012011. [Google Scholar] [CrossRef]
  6. Sevinchan, E.; Dincer, I.; Lang, H. A review on thermal management methods for robots. Appl. Therm. Eng. 2018, 140, 799–813. [Google Scholar] [CrossRef]
  7. Alhaza, T.; Alsadoon, A.; Alhusinan, Z.; Jarwali, M.; Alsaif, K. New concept for indoor fire fighting robot. Procedia-Soc. Behav. Sci. 2015, 195, 2343–2352. [Google Scholar] [CrossRef]
  8. Sevinchan, E.; Dincer, I.; Lang, H. Investigation of heat transfer performance of various insulating materials for robots. Int. J. Heat Mass Transf. 2019, 131, 907–919. [Google Scholar] [CrossRef]
  9. Sevinchan, E.; Dincer, I.; Lang, H. Experimental investigation and performance evaluation of thermal energy management arrangements for robots. Energy Sci. Eng. 2022, 10, 1726–1738. [Google Scholar] [CrossRef]
  10. Midhun, V.C.; Suresh, S.; Praveen, B.; Raj, C.R. Effect of vacuum insulation panel on active thermal management for electronics system exposed to thermal radiation. Therm. Sci. Eng. Prog. 2021, 26, 101117. [Google Scholar] [CrossRef]
  11. Midhun, V.C.; Suresh, S.; Akhil Krishnan, S.R.; Pandian R., S.T. Effect of vacuum insulation panel integration in phase change material-based passive thermal management system for electronics package exposed to hot air environment. J. Energy Storage 2022, 53, 105180. [Google Scholar] [CrossRef]
  12. Midhun, V.C.; Suresh, S. Thermal protection by integration of vacuum insulation panel in liquid-cooled active thermal management for electronics package exposed to thermal radiation. J. Therm. Sci. Eng. Appl. 2022, 14, 011014. [Google Scholar] [CrossRef]
  13. Ding, Y.; Liu, Z.; Wang, F.; Yang, H.; Shu, X. Thermal insulation performance and heat resistance of SiO2 aerogel coating. Surf. Technol. 2017, 46, 197–204. [Google Scholar] [CrossRef]
  14. Solntsev, S.S. Polyfunctional high-temperature coatings for heat-shielding materials. Glass Ceram. 2016, 73, 180–182. [Google Scholar] [CrossRef]
  15. Solntsev, S.S.; Rozenenkova, V.A.; Mironova, N.A. Coatings for thermo-reinforcement of heatproofing materials and quasiplastic ceramics. Glass Ceram. 2007, 64, 140–142. [Google Scholar] [CrossRef]
  16. Rozenenkova, V.A.; Mironova, N.A.; Solntsev, S.S.; Gavrilov, S.V. Ceramic coatings for functionally graded high-temperature heat-shielding materials. Glass Ceram. 2013, 70, 26–28. [Google Scholar] [CrossRef]
  17. Le, V.T.; San Ha, N.; Goo, N.S. Advanced sandwich structures for thermal protection systems in hypersonic vehicles: A review. Compos. Part B Eng. 2021, 226, 109301. [Google Scholar] [CrossRef]
  18. Xie, G.; Wang, C.; Ji, T.; Sunden, B. Investigation on thermal and thermomechanical performances of actively cooled corrugated sandwich structures. Appl. Therm. Eng. 2016, 103, 660–669. [Google Scholar] [CrossRef]
  19. Zhao, W.; Liu, Z.; Yu, G.; Wu, L. A new multifunctional carbon fiber honeycomb sandwich structure with excellent mechanical and thermal performances. Compos. Struct. 2021, 274, 114306. [Google Scholar] [CrossRef]
  20. Martinez, O.A.; Sankar, B.V.; Haftka, R.T.; Bapanapalli, S.K.; Blosser, M.L. Micromechanical analysis of composite corrugated-core sandwich panels for integral thermal protection systems. AIAA J. 2012, 45, 2323–2336. [Google Scholar] [CrossRef]
  21. Martinez, O.; Sankar, B.; Haftka, R.; Blosser, M.L. Two-dimensional orthotropic plate analysis for an integral thermal protection system. AIAA J. 2012, 50, 387–398. [Google Scholar] [CrossRef]
  22. Yu, G.-C.; Feng, L.-J.; Wu, L.-Z. Thermal and mechanical properties of a multifunctional composite square honeycomb sandwich structure. Mater. Des. 2016, 102, 238–246. [Google Scholar] [CrossRef]
  23. Zhang, P.; Pan, Y.; Yang, R.; Manthar, A.; Zhou, X. Investigation on a CMC-aided multilayer thermal structure and the functionality of active cooling. Appl. Therm. Eng. 2024, 245, 122834. [Google Scholar] [CrossRef]
  24. Wei, K.; Wang, K.; Cheng, X.; Peng, Y.; Li, M.; Yang, X. Structural and thermal analysis of integrated thermal protection systems with C/SiC composite cellular core sandwich panels. Appl. Therm. Eng. 2018, 131, 209–220. [Google Scholar] [CrossRef]
  25. Wei, K.; Cheng, X.; Mo, F.; Wen, W.; Fang, D. Design and analysis of integrated thermal protection system based on lightweight C/SiC pyramidal lattice core sandwich panel. Mater. Des. 2016, 111, 435–444. [Google Scholar] [CrossRef]
  26. Wang, X.; Wei, K.; Tao, Y.; Yang, X.; Zhou, H.; He, R.; Fang, D. Thermal protection system integrating graded insulation materials and multilayer ceramic matrix composite cellular sandwich panels. Compos. Struct. 2019, 209, 523–534. [Google Scholar] [CrossRef]
  27. Wei, K.; Wang, X.; Yang, X.; Qu, Z.; Tao, Y.; Fang, D. Heat transfer mechanism and characteristics of lightweight high temperature ceramic cellular sandwich. Appl. Therm. Eng. 2019, 154, 562–572. [Google Scholar] [CrossRef]
  28. Cao, C.; Wang, R.; Xing, X.; Liu, W.; Song, H.; Huang, C. Performance improvement of integrated thermal protection system using shaped-stabilized composite phase change material. Appl. Therm. Eng. 2020, 164, 114529. [Google Scholar] [CrossRef]
  29. Oliveira, P.J.; Younis, B.A. On the prediction of turbulent flows around full-scale buildings. J. Wind. Eng. Ind. Aerodyn. 2000, 86, 203–220. [Google Scholar] [CrossRef]
  30. Lakehal, D. Computation of turbulent shear flows over rough-walled circular cylinders. J. Wind. Eng. Ind. Aerodyn. 1999, 80, 47–68. [Google Scholar] [CrossRef]
  31. Benard, P.; Balarac, G.; Moureau, V.; Dobrzynski, C.; Lartigue, G.; D’Angelo, Y. Mesh adaptation for large-eddy simulations in complex geometries. Int. J. Numer. Methods Fluids 2016, 81, 719–740. [Google Scholar] [CrossRef]
  32. Schiavoni, S.; D’Alessandro, F.; Bianchi, F.; Asdrubali, F. Insulation materials for the building sector: A review and comparative analysis. Renew. Sustain. Energy Rev. 2016, 62, 988–1011. [Google Scholar] [CrossRef]
  33. Dogonchi, A.; Ganji, D. Convection–radiation heat transfer study of moving fin with temperature-dependent thermal conductivity, heat transfer coefficient and heat generation. Appl. Therm. Eng. 2016, 103, 705–712. [Google Scholar] [CrossRef]
  34. Du, C.; Bian, M. Numerical simulation of fluid solid coupling heat transfer in tunnel. Case Stud. Therm. Eng. 2018, 12, 117–125. [Google Scholar] [CrossRef]
  35. Mann, H.S.; Singh, P.K. Energy recovery ducted turbine (ERDT) system for chimney flue gases—A CFD based analysis to study the effect of number of blade and diffuser angle. Energy 2020, 213, 118501. [Google Scholar] [CrossRef]
  36. Sun, B.; Zhao, T.; Li, L.; Wang, Z.; Sun, P.; Peng, C. Optimization of regenerator operating parameters and thermal insulation construction for rotary regenerative thermal oxidizer (r-RTO) based on thermal-fluid coupling method and quadratic regression model. Case Stud. Therm. Eng. 2022, 37, 102314. [Google Scholar] [CrossRef]
  37. Al-Muhsen, N.F.; Al-Khafaji, O.R.; Ismail, F.B. Thermal Performance Optimization of Perforated Fins for Flat Plate Heat Sinks Using CFD Approach. Int. J. Heat Technol. 2023, 41, 1052–1062. [Google Scholar] [CrossRef]
  38. Tao, W. Heat Transfer; Higher Education Press: Beijing, China, 2019; pp. 39–42+396–399. [Google Scholar]
  39. Chen, Q. Second law of thermodynamics and energy dissipation function. MRS Bull. 2023, 48, 968–975. [Google Scholar] [CrossRef]
  40. Moreira, T.A.; Colmanetti, A.R.; Tibiriçá, C.B. Heat transfer coefficient: A review of measurement techniques. J. Braz. Soc. Mech. Sci. Eng. 2019, 41, 264. [Google Scholar] [CrossRef]
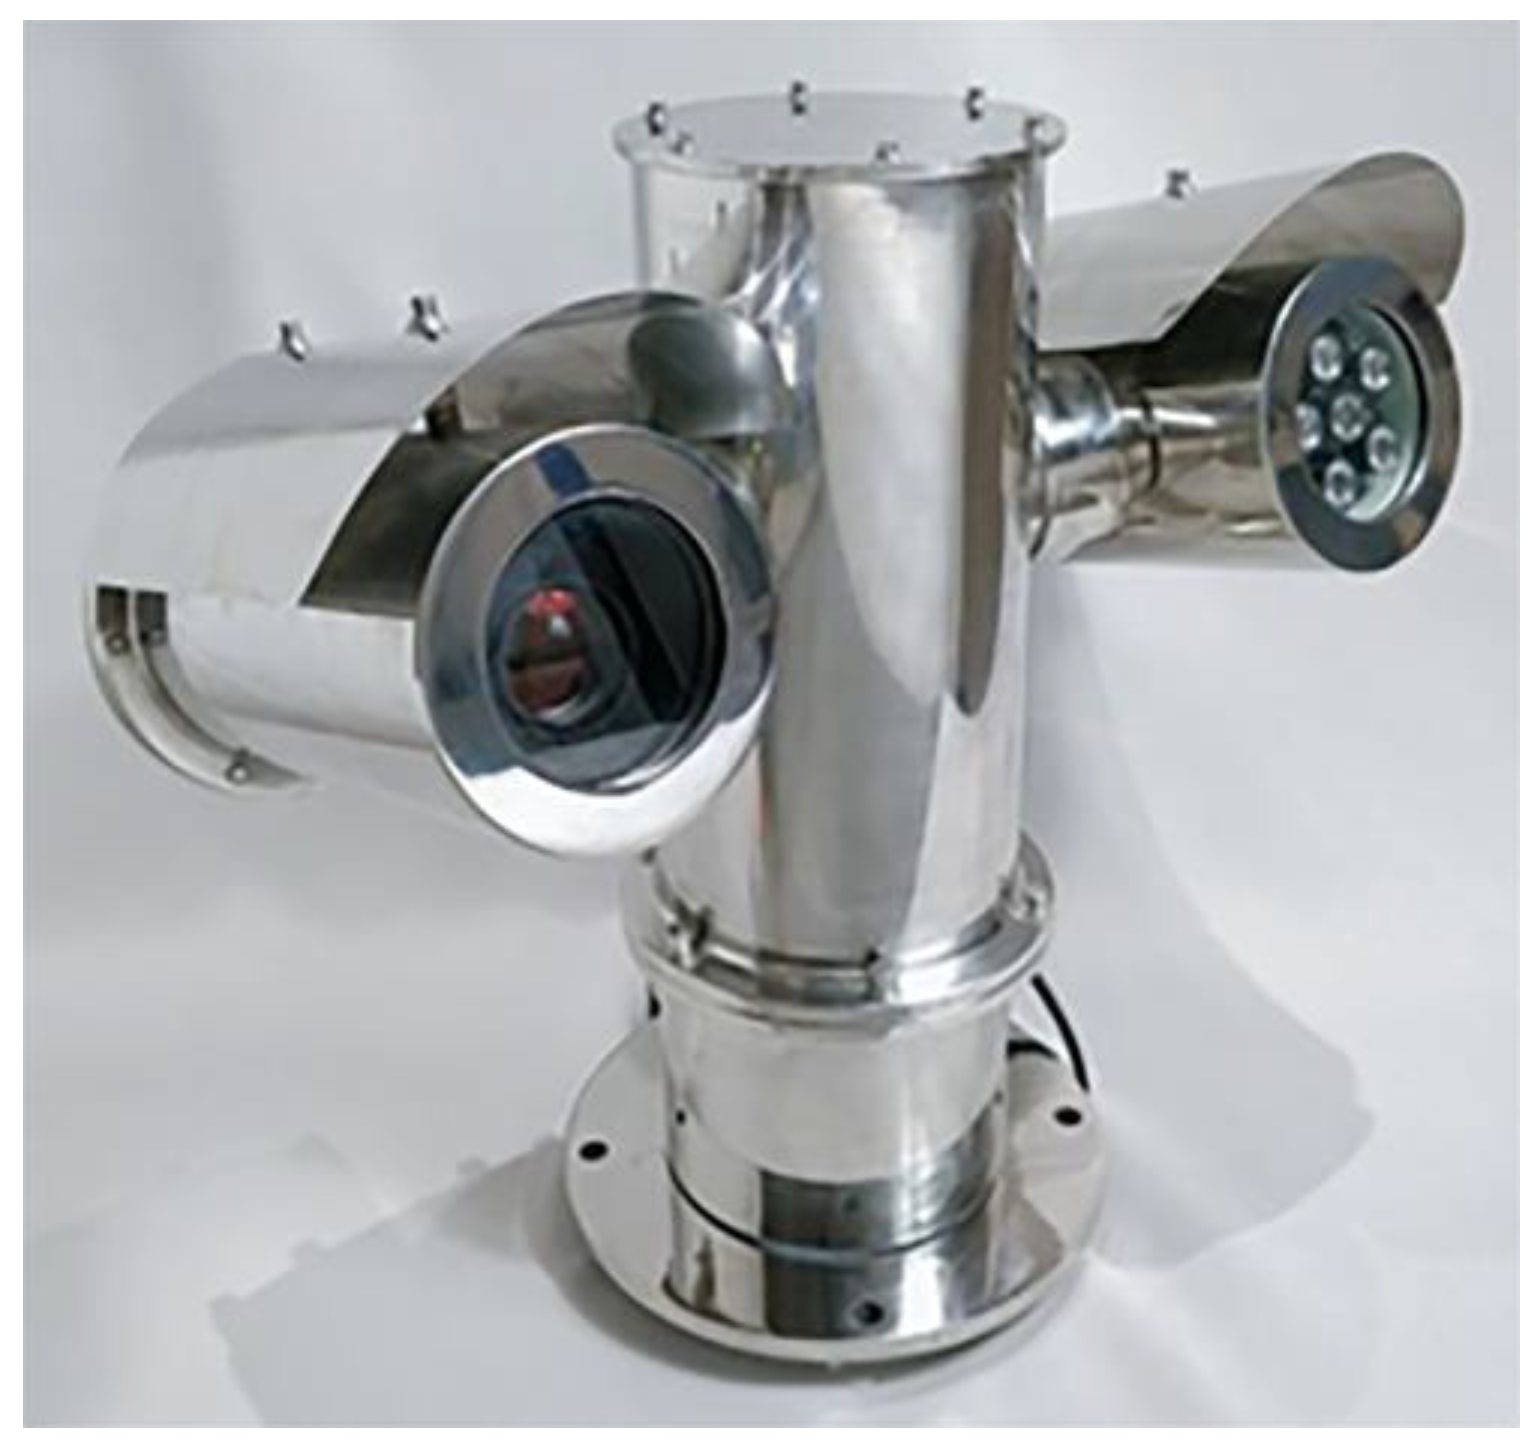
Figure 1. Actual model of a pan–tilt.
Energies 17 03120 g001
Figure 2. The manner of connection between the rotation and pitch parts of the composite thermal protection structure. Points 1, 2, and 3: skin; 4, 5: aerogel felt; 6: bolt group; 7: stainless steel ball; 8: pan–tilt housing.
Energies 17 03120 g002
Figure 3. Schematic diagram of the thermal protection for the pan–tilt camera housing. Points 1 and 2: skin; 3: hollow glass; 4: bolt group; 5: pan–tilt camera housing; 6: aerogel felt.
Energies 17 03120 g003
Figure 4. Hollow glass. Point 1: metal ring; 2 and 3: glass; 4: cavity.
Energies 17 03120 g004
Figure 5. Pan–tilt with the composite thermal protection structure.
Energies 17 03120 g005
Figure 6. Computational domain model.
Energies 17 03120 g006
Figure 7. Meshing of each domain.
Energies 17 03120 g007
Figure 8. Schematic diagram of the heat transfer process.
Energies 17 03120 g008
Figure 9. Positions of the mesh independence validation points.
Energies 17 03120 g009
Figure 10. The temperatures of the three points in different mesh numbers.
Energies 17 03120 g010
Figure 11. The block diagram of the experimental principle.
Energies 17 03120 g011
Figure 12. The experimental platform computational domain model.
Energies 17 03120 g012
Figure 13. Positions of temperature measurement points.
Energies 17 03120 g013
Figure 14. Comparison of the experimental and simulation results.
Energies 17 03120 g014
Figure 15. The temperature contour of the unprotected pan–tilt inner basin.
Energies 17 03120 g015
Figure 16. The temperature contour of the pan–tilt inner basin with different thicknesses of aerogel felt.
Energies 17 03120 g016
Figure 17. The maximum temperature and the total entropy of the inner basin with different thicknesses of aerogel felt.
Energies 17 03120 g017
Figure 18. havg of the structure with different thicknesses of aerogel felt.
Energies 17 03120 g018
Figure 19. The temperature contour of the pan–tilt inner basin with different glass structure types.
Energies 17 03120 g019
Figure 20. The maximum temperature and the total entropy of the inner basin with different glass structure types.
Energies 17 03120 g020
Figure 21. havg of the structure with different glass structure types.
Energies 17 03120 g021
Figure 22. The temperature contour of the pan–tilt inner basin at different ambient temperatures.
Energies 17 03120 g022
Figure 23. The maximum temperature and the total entropy of the inner basin at different ambient temperatures.
Energies 17 03120 g023
Figure 24. The havg of the structure at different ambient temperatures.
Energies 17 03120 g024
Table 1. The number of meshes and nodes.
DomainMeshesNodes
Pan–tilt inner basin270,761109,368
Outer basin442,815150,153
Hollow glass inner basin13,88118,836
Pan–tilt housing1,168,372293,906
Skin1,384,170347,281
Aerogel felt1,186,319259,271
Glass138,54934,286
Table 2. Physical properties of relevant materials.
MaterialDensity/
(kg·m−3)
Specific Heat Capacity/
(J·kg−1·K−1)
Thermal Conductivity/
(W·m−1·K−1)
Viscosity/
(kg·m−1·s−1)
Steel793048717.7——
Aerogel felt200501.60.02——
Quartz glass22008921.382——
Aluminum alloy2719870122.41——
Air1.22510130.02581.81 × 10−5
Argon1.784519.160.01622.08 × 10−5
Table 3. Parameter setting table.
ParameterSetting Information
SolverPressure-based
TimeTransient
Gravity−9.81 m/s2
Turbulence modelSST k-omega
Inlet boundary conditionVelocity-inlet
Velocity1.5 m/s
Outlet boundary conditionOutflow
Flow rate weighting1
Time-step0.2 s
Solution algorithmCoupled
Disclaimer/Publisher’s Note: The statements, opinions and data contained in all publications are solely those of the individual author(s) and contributor(s) and not of MDPI and/or the editor(s). MDPI and/or the editor(s) disclaim responsibility for any injury to people or property resulting from any ideas, methods, instructions or products referred to in the content.