Abstract
The integrity of a pressure vessel (PRV) is affected by the decay heat of the molten pool in the lower head, so it is very important to study the natural convection heat transmission in the lower head. Scholars from all over the world have carried out a lot of experimental studies and calculations to determine the convection mechanism and heat transmission characteristics of the molten pool. Most of them were based on the empirical formula of convective heat transmission on the wall of a hemispherical molten pool based on two-dimensional slice experiments and simulation calculations. In this study, FLUENT 2021R1 software was used to simulate the three-dimensional convective heat transmission process of the hemispherical molten pool, and the temperature, velocity and wall heat transmission coefficients of the flow field were analyzed. The results were in good agreement with experimental data from UCLA (University of California, Los Angeles). Through research on the heat transmission of the lower head, the results showed that in the region where the wall angle was θ between approximately 72 and 90 degrees, heat transmission coefficients had larger fluctuations, and a more reasonable empirical relation was proposed. Comparing between the simulation results of CFD and the two-dimensional empirical formula, it was found that the latter one was smaller under the same θ angle condition. Finally, the convection phenomena of different external temperatures were simulated, and the main factors affecting the flow field by temperature were analyzed.
1. Introduction
In most nuclear power systems, the nuclear fuel, control components, reactor internal structures and coolant are wrapped in the reactor pressure vessel (RPV). As a part of the second barrier of the reactor, RPV directly bears the threat of decay heat after a serious accident of the core melting. If the RPV fails in a serious accident, the radioactive materials are released. The RPV is also a conductor of heat exchange, which could transfer the waste heat and decay heat from the core to the external environment and the corresponding cooling system.
At present, the international analysis programs of reactor system simulation based on the lumped parameter method are relatively mature, such as MELCOR, RELAP, MAAP and other serious accident analysis software, as well as the MOSAP integrated analysis program developed by Xi’an Jiaotong University. The United States Department of Energy (DOE) and the United States Nuclear Regulatory Commission (NRC) used the lumped parameter method in AP600 and AP1000 research, which was used to calculate the thermal characteristics of the molten pool, the empirical formula and the related experiment and numerical simulation analysis. It was considered that the most dangerous situation was that a stable molten pool was formed inside the pressure vessel [1]. Therefore, research on the thermal characteristics of the stable molten pool was the focus of the behavior of the molten pool inside the pressure vessel.
The heat balance and heat flux distribution of the stable molten pool are the key points of research. The heat balance mainly analyzes the heat transmission between the oxide layer and the metal layer in the molten pool, the heat transmission between the molten pool and the wall of the pressure vessel, and the balance and heat distribution between the radiation heat transmission of the molten pool to the upper chamber of the pressure vessel. The study of heat flux mainly analyzes the heat flux distribution of the melt pool on the wall of the pressure vessel. Among them, the internal reason that determined the heat flux distribution trend of the molten pool was the natural convection in the molten pool caused by the density difference formed by the cooling of the pressure vessel wall and the thermal delamination phenomenon.
It should be mentioned here that before the AP-600 study conducted by Prof. Theofanous, a substantial body of data and analysis existed on liquid pool natural circulation in rectangular and hemispherical vessels, and correlations existed for thermal loading (see Table 1). Considering the calculation speed, most CFD studies on the molten pool currently adopt a two-dimensional axis symmetric model. Different from the integrated system program based on the lumped parameter method, CFD related softwares using the finite element analysis method could well simulate the internal convection phenomenon of the molten pool in the lower head, verifying it with relevant experiments. As a kind of software using CFD technology, COMSOL Multiphysics is used to conduct thermal–hydraulic analysis in multiple nuclear applications. The aim of this study was to benchmark the prediction accuracy of COMSOL Multiphysics in performing thermal–hydraulic analysis [2]. Scholars from many countries, including Zhu Guangyu, Zhang Luteng et al. [3,4], and Masanori FUKASAWA et al. [5] calculated and verified the two-dimensional CFD of a molten pool based on relevant experiments. The results could well simulate the flow field temperature field in the axial and tangent plane of the lower head in the two-dimensional plane [6]. Wang, Mingjun et al. performed three-dimensional CFD simulations with three types of internal structures in the lower plenum, and the influence of different internal structures on the flow characteristics in the lower plenum was achieved and analyzed [7]. TRAN C T developed the ECM capability to accurately predict energy splitting and heat flux profiles in volumetrically heated liquid pools of different geometries over a range of conditions related to accident progression, examined and benchmarked against both experimental data and CFD results [8]. Maatki, Chemseddine et al. numerically performed the entropy generation of double diffusive natural convection in a three-dimensional differentially heated enclosure [9].

Table 1.
Domestic and international experimental studies on molten pools.
With the significant improvements in computing power, the CFD method has the potential to simulate the detailed three-dimensional flow and heat transmission features in nuclear reactors [15]. The development direction of CFD technology in the future nuclear field could be as follows: (1) The large-scale high-fidelity CFD parallel simulation for the whole reactor with extremely complex structures; (2) the hybrid turbulent model development based on RANS, LES, DES, and DNS; (3) the advanced two-phase CFD models and numerical technology development for nuclear reactor engineering; (4) the multi-scale and multi-physics coupling methodology; (5) parameter sensitivity analysis and uncertainty analysis of the CFD method [7].
In this study, FLUENT software was used to set up a quarter slice model with a periodic boundary, and the temperature distribution and natural convection phenomena of the three-dimensional hemispherical pool under the rectangular coordinate system were studied. Modeling in this way could reduce the computation time by about 70%. The empirical formula of the convective heat transmission coefficient on the wall of the lower head was obtained, and the CFD calculation results were compared with the UCLA experimental data and the ACOPO empirical formula. The simulation results were well validated. It was found that the three-dimensional results could clearly reflect the fluctuations in the convective heat transmission coefficient of a high-inclination wall, which were generally homogenized in the commonly used two-dimensional models and empirical formulas. The randomness and inconstancy of heat transmission in the turbulent region were ignored. On this basis, the variations in the temperature and flow field in the pool with different surface temperature differences were also calculated, and the influence of different convective intensities on the fluctuation range and magnitude of the convective heat transmission coefficient was studied.
2. Convection Calculation of Hemispherical 3D Pool
2.1. Thermohydraulic Model
The flow resulting from the non-uniform fluid density distribution was considered as natural convection. It was widely used in the passive safety concept of third-generation nuclear power plants. In the two-layer model of the reactor molten pool analysis, the flow of the oxide layer always belonged to the convection of the hemispherical region with an internal heat source, while the convection of the metal layer belonged to the convection of the cylindrical region without an internal heat source. In this study, the natural convection of fluid in a hemispherical vessel with an internal heat source was studied.
As shown in Figure 1, due to the large temperature gradient of the oxidation pool near the lower head wall, there would be some downward flow near the vessel wall. In the top region of the pool, the density difference resulting from the temperature difference led to significant local convection. In the lower region of the pool, thermal stratification occurred. Using the Boussinesq approximation criterion, the differential equation of the rectangular coordinate system is:
where T0 is the initial temperature, is the kinematic viscosity and β is the coefficient of thermal expansion. According to the conservation of energy:
where is the thermal diffusion coefficient, SE is the heat source term, is the viscous dissipation term.
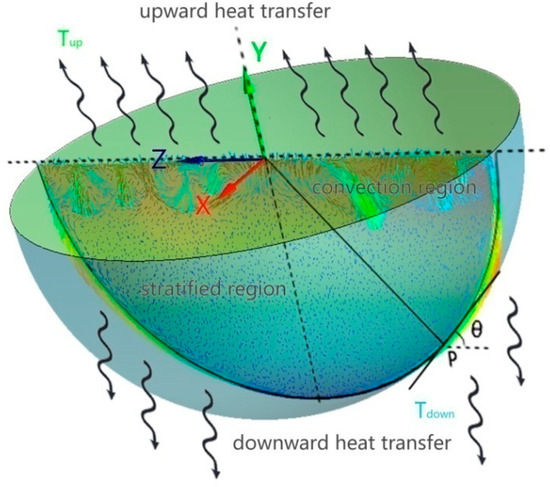
Figure 1.
Natural convection in the hemispherical pool of lower head.
The boundary conditions are as follows (, , ):
When y = 0, T = Tup.
When , T = Tdown.
According to the experimental study [1], it was found that the local convective heat transmission coefficient of the lower head wall is related to the wall angle θ.
2.2. UCLA Experiment and Grid Sensitivity Analysis
Westinghouse’s empirical formula for AP600 [1] was derived from the Mini-ACOPO [16] and UCLA [12] experiments. The two experiments were commissioned by two universities, and the results were compared and verified. The Mini-ACOPO experiment did not actually use an internal heat source for heating, but a natural cooling mode was used to simulate the steady state. Because the UCLA experiment can simulate the release of decay heat in the lower head by microwave heating, it allowed us to more intuitively understand the mechanism of convection pools heated by internal heat sources. However, due to the difficulty of the experiment, the experimental results were difficult to reproduce.
In this study, the UCLA experiment was selected for numerical simulation, and the experimental data were applied to validate the CFD model. A schematic diagram of this experiment and location of thermocouples is shown in Figure 2. This thermocouple distribution covered different wall heights and angle regions within the molten pool.
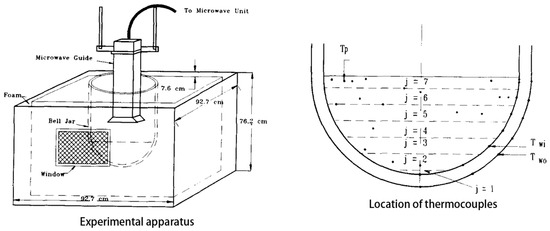
Figure 2.
UCLA experiment and location of thermocouples.
In order to evaluate the applicability of CFD for molten pool analysis, it was necessary to compare the calculated values with the experimental values to verify the reliability of the numerical model. The physical properties of the hemisphere-shaped molten pool material and the internal heat source settings were given according to the UCLA test conditions, as shown in Table 2.

Table 2.
Initial condition setting.
Using the modeling tool, the semi-sphere molten pool model was established, which was completely consistent with the experiment. The initial temperature in the pool was assumed to be uniform, the upward boundary was the temperature boundary and the hemisphere wall was the cooling wall. In order to avoid numerical instability, a combination of steady-state and transient methods was adopted in the process of numerical calculation.
Firstly, relatively convergent results were obtained by using the steady-state simple algorithm. Then, the transient simple algorithm was applied for the transient computation. Finally, we set the time step and the number of iteration steps and repeated the calculation until the result was stable. In this study, it was found through calculation that when the number of steps exceeds 10,000, the results of the flow field and temperature field tend to be stable and no longer change, and it was considered that the fluid region was in a state of thermal equilibrium thereafter (the conclusion obtained from the calculation results of 10,000 and 50,000 steps is compared). The standard k-ω model was chosen as the turbulence model. It was an empirical model of the model transport equation based on the turbulent kinetic energy k and the specific dissipation rate ω, which could also be considered as the ratio of ε to k. The model contained modifications for low Reynolds number effects, compressibility and shear flow expansion.
The pressure-base solver and the absolute pressure–velocity coupling method were used to solve the problem. The SIMPLEC method was used as the coupling scheme, and the gradient calculation scheme was the Least Squares Cell-Based method. The spatial discretization of momentum, turbulent kinetic energy and the turbulent dissipation rate was second order upwind.
The mesh sensitivity analysis of the calculation model was carried out to analyze the influence of the increase in the number of grids on the heat transmission coefficient, under the same temperature boundary conditions, as shown in Table 3.

Table 3.
Grid sensitivity analysis.
To ensure that the wall shear stress was calculated correctly, we targeted a Y+ of < 5, so the mesh size should be less than 5 mm. As can be seen from Figure 3, when the number of grids reached 2.16 × 10⁵, the upward and downward Nu tended to be roughly stable. The heat transmission coefficient was no longer affected by the mesh resolution, so it could be considered that the influence of the mesh was eliminated. The calculation results of this study were based on the elimination of mesh influence factors. When the residual values of continuity, velocity, energy, k and stress were less than 0.0001, the convergence criterion was taken.
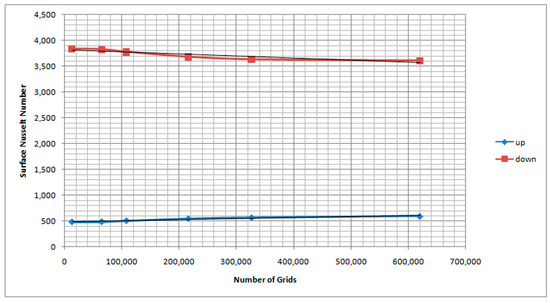
Figure 3.
Grid sensitivity analysis for numerical simulation of UCLA experiment.
2.3. Simulation and Validation
ANSYS (2021R1) Fluent was used to set the boundary conditions mentioned above. The realizable k-epsilon model was chosen on the computational model. A constant-temperature non-slip wall boundary as close as possible to the real test situation was used. The standard wall equation and viscous heating were used for the computational solution. Since the fluid domain was an axially symmetric structure, a hemispherical-distributed pool, the quarter model not only described the motion of fluid in the x, y and z directions but also saved computing resources effectively. Through the simulation of the process of natural circulation flow caused by the superposition of internal heat releasing and external cooling, the temperature field, flow field and heat exchange of the molten pool could be obtained, as shown in Figure 4.
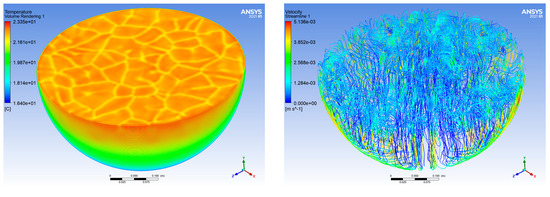
Figure 4.
Results of temperature and velocity.
It can be seen from the calculation results that the flow field can be divided into three parts.
No.1: The upper part of the pool was the convection region, the temperature in this region was relatively uniform and some large vortices appeared in the velocity field.
No.2: The lower part of the pool was the obvious thermal stratification phenomenon region, and there was no obvious velocity distribution.
No.3: The part near the wall of the hemispherical vessel was a thin layer with large velocity gradient variations, considering viscosity.
As can be seen from Figure 5, after the convection pool reached a steady state, closer to the bottom, the temperature gradient was larger. The temperature distribution was more uniform in the top area because of the muddy effect. Due to the cooling effect of the lower head, the temperature stratification curve near the wall would have a small temperature depression.

Figure 5.
Comparison of experimental and calculation results.
According to the ACOPO experimental data [16], the experimental correlative formula for calculating the local heat transmission coefficient h (θ) was given. There was a set of parameters named a–f and k, determined by the value of H/R. H stood for pool height and R stood for lower head radius. In the current situation, H = R was satisfied. These coefficients defined the curve-fit parameters for the molten pool convection model.
As shown in Table 4, It could be found from the empirical formula that k determined the division of convective and thermal stratification zones. When k was equal to 0.7, it meant that if the θ was greater than 72.54°, the fluid flow state and the convective heat transmission formula would change.

Table 4.
Parameter values at H/R = 1.
As can be seen from Figure 6, the calculated results of the three-dimensional model simulating the molten pool were in good agreement with the experimental results, which well reflected the process of the convective heat transmission coefficient from small to large as the angle of the molten pool wall changed. The following CFD empirical formula could be obtained under the UCLA experimental conditions.
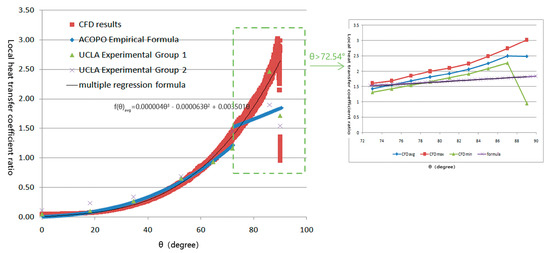
Figure 6.
Comparison of experimental, CFD and formula results.
Figure 6 shows that when θ was less than 72.54°, the errors of the two empirical formulas were small. When θ was greater than 72.54°, the error should not be ignored. It can be seen that in the range of 72° to 90°, due to the small number of experimental groups, the influence of the minimum value in the discrete data on the whole was overly considered. However, curve fitting was performed on the average value of each position of the CFD results, and the heat transmission coefficient in this region was larger than that in the ACOPO empirical formula. There are two main reasons for this, one being that the region of convection inherently features larger flow changes, which directly led to the area of the convection heat transmission coefficient being uncertain, and the three-dimensional calculation results reflected the fluctuation characteristic; another reason was that, in practice, there was also a convection phenomenon in the air outside the PRV. The temperature in the upper part was slightly higher than that in the lower part in practice, which reduced the heat transmission in the upper part to a certain extent. However, the temperature difference condition of CFD was uniform, so the efficiency of heat transmission in CFD calculation was relatively higher.
The range of the Reynolds number was crucial for judging the fluid flow regime, and 2100 and 4000 were important critical values for laminar and turbulent flow, respectively. Figure 7 shows that when the angle was more than 20° and less than 40°, both laminar and turbulent flow phenomena existed.
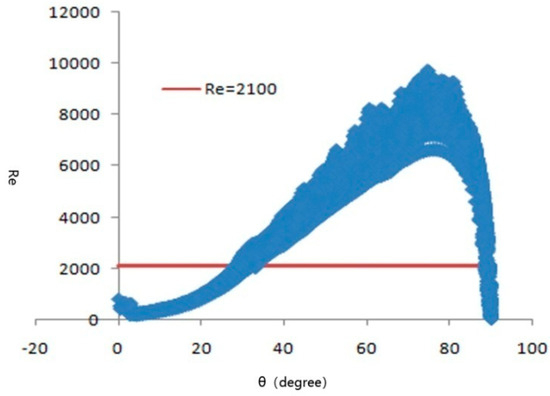
Figure 7.
The Reynolds number varied with the angle.
Figure 8 showed that the convective heat transmission coefficient and vorticity distribution. In the area with an angle of about 60~85 degrees from the horizontal plane reached the maximum vorticity (as shown in the red shade in Figure 8), and the greater the local convective heat transmission coefficient was closer to the upper horizontal plane of the molten pool. At the same time, because there were large vortices in the velocity field in this region, the velocity was larger, and the Reynolds number was larger, so the numerical points were more dispersed. However, due to the axis symmetric two-dimensional model adopted in most studies, the fluctuation dispersion characteristics of the convective heat transmission coefficient on the large inclination wall could not be reflected. Therefore, only a single empirical formula curve of the convective heat transmission coefficient changing with the angle could be fitted. The empirical formula could reflect the average state of each plane of the melt pool to a certain extent, while the circumfluence state of the horizontal plane could not be well fitted.

Figure 8.
Vorticity distribution diagram.
3. Influence of External Cooling Conditions on Natural Convection Characteristics in the Lower Head
IVR-ERVC is an important mitigation measure for serious accidents in nuclear power plants. In the AP/CAP series nuclear power plant design, water from the fuel pool (IRWST) in the containment vessel floods the pit and creates a natural circulation around the outside of the lower head, preventing the vessel from failing due to excessive decay heat from the reactor melt trapped in the lower head.
In order to explore the sensitive factors of the influence of different external ambient temperatures on the convection heat transmission of the molten pool, based on the previous model, the outer wall temperatures were set at 10 °C, 16.4 °C and 20 °C, respectively, to calculate the natural convection of the molten pool under different external cooling environments. The results are shown in Figure 9.
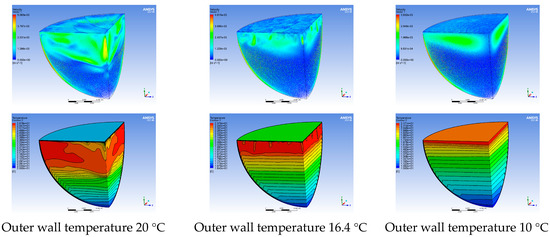
Figure 9.
Distribution of temperature field and streamline with different outer wall temperatures.
It can be seen from the results of the flow field and temperature field in Figure 9 that the natural convection phenomenon of the molten pool of the lower head became more obvious with the increase in the temperature of the lower wall, reflecting the passive heat transmission characteristics of the fluid. The lower the temperature of the lower wall, the greater the temperature difference between the upper and lower surfaces, and the more obvious the temperature stratification phenomenon inside the molten pool. In this case, the internal flow of the molten pool slowed down, and the temperature distribution was uneven.
As can be seen from Figure 10, the local convective heat transmission coefficient of the lower head wall, which varied along the inclination angle of the lower head wall, was basically not affected by the temperature of the lower wall. If the dip angle was less than 60 degrees, with the increase in the temperature of the lower wall, the convective heat transmission capacity of the lower wall of the lower head increased. If the dip angle was greater than 80 degrees, as the temperature of the lower wall decreased, the convective heat transmission capacity of the lower wall of the lower head increased. At the same time, as the temperature difference between the upper and lower walls in this area increased, the fluctuation range of the convective heat transmission coefficient also became larger.
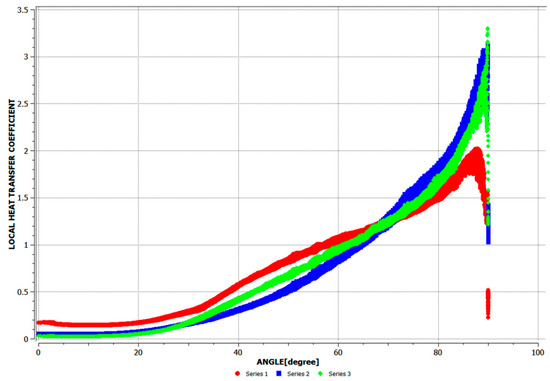
Figure 10.
Changes in local heat transmission coefficient ratio with angle under different outer wall temperatures.
As can be seen from Figure 11, when the wall inclination angle was greater than 60 degrees, the temperature of the lower wall had a great influence on the distribution of vorticity. As the temperature difference between the upper and lower walls decreased, the peak value of the fluid vorticity gradually increased and moved up.
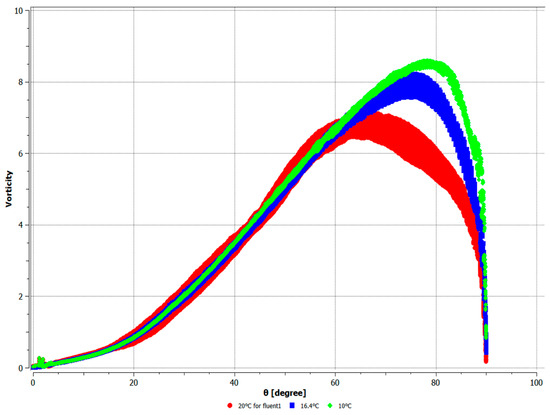
Figure 11.
Changes in vorticity under different outer wall temperatures.
As can be seen from Figure 12, in the change curve of fluid Ra in the lower head, the temperature of the lower wall had little influence on the flow state distribution of the laminar flow and turbulent flow of the fluid, both of which were obvious turbulence when the wall angle was above 40 degrees and obvious laminar flow when the wall angle was below 20 degrees.
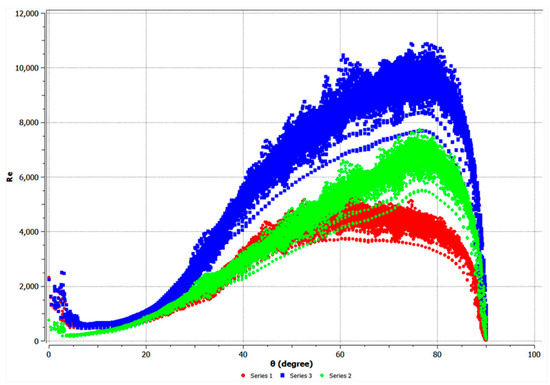
Figure 12.
Changes in Ra under different outer wall temperatures.
4. Conclusions
In this study, FLUENT was used to model and calculate the natural convection heat transmission in a three-dimensional pool with a hemispherical lower head. The temperature, velocity and wall heat transmission coefficients of the flow field were analyzed by using periodic boundary conditions. Compared with the results of the hemispherical UCLA experiment, the parameter ranges of the hemispherical natural convection pool and the applicability of the classical empirical formula were verified. The convection heat transmission coefficients in the commonly used two-dimensional models and empirical formulas were generally uniform and conservative. The method ignored the randomness and non-constancy of turbulent heat transmission. The three-dimensional analysis results of CFD calculations clearly reflect the vortex and oscillation of the flow field. The main conclusions are as follows:
- The simulation results were in good agreement with the experimental results of UCLA. At the same time, the quarter-slice modeling method of the periodic boundary ensured not only the accuracy of the results but also the axial symmetry of the heating pool. This approach to modeling saved computing resources. Using a simple 32-core configuration server, the calculation could be completed in 1 h, and the same object with a full-size molten pool model took about 3–4 h.
- There was an obvious thermal stratification phenomenon at the bottom of the natural convection heating pool in the calculated results of this study. The closer to the bottom, the greater the thermal stratification temperature gradient. The stratification area would inhibit the heat transmission efficiency of the molten pool.
- In the region where the angle with the horizontal plane was 72~90 degrees, there were large errors in the convective heat transmission coefficients obtained by different calculation methods, because the fluid reached the maximum vorticity in this region and the convective heat transmission phenomenon was the most intense. By comparing the 3D CFD results with the experimental empirical formula, it was found that the empirical formula was limited by the number of experimental groups, and the heat transmission coefficient in this region was relatively small. At the same time, because there were large vortices in this region, the velocity and Reynolds number were large, and the numerical points were scattered. The fitted empirical formula curve of the convective heat transmission coefficient with the change in angle could reflect the average state of each plane in the melting pool to a certain extent, but the reflux state of the horizontal plane could not be well fitted. The existence of oscillation means that the local convective heat transmission coefficient fluctuates in a certain range at the same θ value. Ignoring this problem would introduce uncertain factors into the related simulation calculation research of heat transmission in the lower head, especially the local failure problem.
- The temperature distribution of the top and outer wall of the molten pool would also affect the natural convection of the fluid in the pool. The larger the temperature difference, the more obvious the thermal stratification phenomenon. The smaller the temperature difference, the more obvious the turbulent convective heat transmission phenomenon. Although the temperature change would have a certain impact on the function of the convective heat transmission coefficient of the lower wall as a function of the angle changed, the effect was small under the condition of error tolerance.
Author Contributions
Conceptualization, Y.C.; Methodology, X.Y., J.Z., X.D., B.Z., Y.Z. and R.X.; Investigation, Q.C.; Writing—original draft, Z.M.; Writing—review & editing, W.W. All authors have read and agreed to the published version of the manuscript.
Funding
This research received no external funding.
Data Availability Statement
Data are contained within the article.
Conflicts of Interest
The authors declare no conflict of interest.
References
- Theofanous, T.G.; Liu, C.; Additon, S.; Angelini, S.; Kymäläinen, O.; Salmassi, T. In-vessel cool-ability and retention of a core melt. Naclear Eng. Des. 1997, 169, 49–57. [Google Scholar] [CrossRef]
- Alkaabi, A.K.; King, J.C. Benchmarking COMSOL Multiphysics Single-Subchannel Thermal-Hydraulic Analysis of a TRIGA Reactor with RELAP5 Results and Experimental Data. Sci. Technol. Nucl. Install. 2019, 2019, 4375782. [Google Scholar] [CrossRef]
- Zhu, G.; Min, J.; Jing, J.; Wang, K.; Liu, F. Numerical simulation of heat transmission characteristics of tip melt pool under RPV. Nucl. Technol. 2022, 45, 99–104. (In Chinese) [Google Scholar]
- Zhang, L.; Su, G.; Ma, Z.; Bu, S.; Sun, W.; Pan, L. Development and verification of a program for Analysis of Heat transmission Characteristics of two-dimensional transient melt Pools. Nucl. Power Eng. 2019, 40, 1–5. (In Chinese) [Google Scholar]
- Fukasawa, M.; Hayakawa, S.; Saito, M. Thermalhydraulic analysis for inversely stratified molten corium in lower vessel. J. Nucl. Sci. Technol. 2008, 45, 873–888. [Google Scholar] [CrossRef]
- Kymäläinen, O.; Tuomisto, H.; Hongisto, O.; Theofanous, T.G. Heat-flux distribution from a volumetrically heated pool with high Rayleigh number. Nucl. Eng. Des. 1994, 149, 401–408. [Google Scholar] [CrossRef]
- Wang, M.; Wang, Y.; Tian, W.; Qiu, S.; Su, G.H. Recent progress of CFD applications in PWR thermal hydraulics study and future directions. Ann. Nucl. Energy 2021, 150, 107836. [Google Scholar] [CrossRef]
- Tran, C.T.; Dinh, T.N. The effective convectivity model for simulation of melt pool heat transmission in a light water reactor pressure vessel lower head. Part II: Model assessment and application. Prog. Nucl. Energy 2009, 51, 860–871. [Google Scholar] [CrossRef]
- Maatki, C.; Ghachem, K.; Kolsi, L.; Borjini, M.N.; Aissia, H.B. Entropy Generation of Double Diffusive Natural Convection in A Three Dimensional Differentially Heated Enclosure. Int. J. Eng. Trans. B Appl. 2014, 27, 215–226. [Google Scholar] [CrossRef]
- Bernaz, L.; Bonnet, J.-M.; Spindler, B.; Villermaux, C. Thermal hydraulic phenomena in corium pool: Numerical simulation with TOLBIAC and experimental validation wit BALI. In Proceedings of the OECD/CSNI Workshop on In-Vessel Core Debris Retention and Coolability, Garching, Germany, 3–5 March 1998. [Google Scholar]
- Steparyan, A.V.; Nayak, A.K.; Sehgal, B.R. Experimental investigations of natural convection in three layer stratified pool with intermal heat generation. In Proceedings of the 11th International Topical Meeting on Nuclear Reactor Thermal-Hydraulics NURETH-11), Avignon, France, 2–6 October 2005. [Google Scholar]
- Asfia, F.J.; Dhir, V.K. An experimental study of natural convection in a volumetricall hated spherical pool bounded on top with a rigid wall. Nucl. Eng. Des. 1996, 163, 333–348. [Google Scholar] [CrossRef]
- Fluhrer, B.; Alsmeyer, H.; Cron, T.; Messemer, G.; Miassoedov, A.; Wenz, T. The experimental programme LIVE to investigate in-vessel core melt behaviour in the late phase. In Proceedings of the Jahrestagung Kerntechnik Nurnberg, INFORUM GmbH, Nurnberg, Germany, 5–10 May 2005. [Google Scholar]
- Su, G. Phenomenology of Serious Accident in Light Water Reactor Nuclear Power Plant; National Defense Industry Press: Beijing, China, 2016; pp. 148–151. [Google Scholar]
- Wang, M.; Wang, L.; Wang, X.; Ge, J.; Tian, W.; Qiu, S.; Su, G.H. CFD simulation on the flow characteristics in the PWR lower plenum with different internal structures. Nucl. Eng. Des. 2020, 364, 110705. [Google Scholar] [CrossRef]
- Rempe, J.L.; Knudson, D.L.; Allison, C.M.; Thinnes, G.L.; Atwood, C.L. Potential for AP600 in-Vessel Retention through ex-Essel Flooding; INEEL/EXT-97-00779; Idaho National Engineering and Environmental Laboratory: Idaho Falls, ID, USA, 1997. [Google Scholar]
Disclaimer/Publisher’s Note: The statements, opinions and data contained in all publications are solely those of the individual author(s) and contributor(s) and not of MDPI and/or the editor(s). MDPI and/or the editor(s) disclaim responsibility for any injury to people or property resulting from any ideas, methods, instructions or products referred to in the content. |
© 2024 by the authors. Licensee MDPI, Basel, Switzerland. This article is an open access article distributed under the terms and conditions of the Creative Commons Attribution (CC BY) license (https://creativecommons.org/licenses/by/4.0/).