1. Introduction
Differential pressure flowmeters utilize the linear relationship between the pressure difference across throttling devices (commonly orifice plates and Venturi tubes) and the square value of the flow rate to realize flow measurement. They offer advantages such as having no moving parts and being simple, reliable, and cost-effective and have found widespread applications [
1]. Compared to the traditional single-hole orifice flowmeter, the balanced flowmeter replaces single-hole throttling orifice plates with multi-hole orifice plates. While inheriting the advantages of orifice flowmeters, the key component—the perforated plate—integrates functions of flow stabilization and pressure stabilization. This further results in the advantages of stabilizing the flow field, reducing pressure loss, shortening upstream straight pipe length, and preventing the occurrence of cavitation, leading to improved measurement performance [
2].
The balanced flowmeter was initially developed by NASA for liquid nitrogen (LN
2) flow measurement in aerospace main rocket engines [
3]. The improvable core is a perforated plate structure. Two-dimensional feature parameters include hole shape, hole area ratio, hole position, and hole density, while three-dimensional feature parameters include the perforated plate thickness, chamfering, flow pattern, and stage number, all of which interact with each other.
Quandt Jr. et al. [
4] conducted an early study on the influence of two-dimensional feature parameters of perforated plates. They studied the effects of Reynolds number, hole area ratio, inclined hole, and square hole on pressure drop using air as the medium. Similarly, Kolodzie et al. [
5] experimentally investigated the effect of the Reynolds number, hole diameter, hole spacing, and hole area ratio on the flow coefficient of a perforated plate for one with an equilateral triangularly spaced hole arrangement. Morrison et al. [
6] proposed a slotted multi-hole orifice plate, and the air verification experiments found that this structure had better total pressure loss, measurement range, and accuracy than an orifice plate. In 2011, Zhao et al. [
7] developed an optimized method for hole positioning and verified it through water flow experiments. In the same year, Nicolleau et al. [
8] conducted air experimental research with the Reynolds number ranging from 3 × 10
4 to 7 × 10
4 and studied the effects of perforated plate structure formed by different basic shapes through fractal iteration on the pressure drop performance.
In recent years, CFD numerical simulation has been increasingly used for the optimization of orifice plate structures. In 2016, Casado et al. [
9], by combining numerical and experimental data, compiled a comprehensive design guide for the hydraulics of the perforated plate structure (with more than three holes) used for liquids, vapors, and gases, and also provided the equations related to flow rate, pressure drop, and geometric dimensions. In 2017, Dhumal et al. [
10] analyzed the flow characteristics of perforated plates with one to seven holes and proposed a simple model for calculating the static pressure loss coefficient. In 2019, Mehmood et al. [
11] focused on analyzing the influence of surface geometric parameters of perforated plates on downstream development length. It was found that increasing the number of holes could improve the static pressure recovery length of downstream pipelines. In 2021, Smierciew et al. [
12], focusing on the pressure drop and velocity distribution of gas flow through perforated plates, found that this method could significantly reduce the time and computational resources required for modeling under a uniform flow design.
In the research on the three-dimensional feature parameters of perforated plates, the focus is mainly on plate thickness and chamfering. In 1997, Gan and Riffat [
13] first compared the influence of orifice plate thickness on the pressure loss coefficient in a square wind tunnel via numerical methods. It was found that when the hole area ratio is 0.5, increasing the plate thickness can significantly reduce the pressure loss, but when the plate thickness increases to 1.5 times the hole diameter, this coefficient no longer decreases significantly. In 2014, Wu et al. [
14] proposed a method for the rapid optimization of perforated plate thickness based on finite element theory. In 2015, Barros et al. [
15] numerically considered the effects of both inlet and outlet chamfering on performance and concluded that the outlet chamfering has a greater impact compared to the inlet one. Subsequently, You et al. [
16] further analyzed the influence of chamfering on the pressure loss characteristics of perforated plates through CFD. The results showed that there is an optimal angle for the inlet, while increasing the outlet angle will lead to higher pressure loss. In 2016, Yu et al. [
17] conducted experimental research on the thickness and chamfering of the perforated plate on a standard water flow device. They pointed out that a 45° chamfer at the hole could reduce the lower limit of the Reynolds number in the stable region, a plate thickness of more than 10 mm could increase the upper limit of the Reynolds number, and both chamfering at the hole and increasing the plate thickness could improve the average flow coefficient.
Because the trigger of cavitation determines the upper limit of liquid flow measurement of the orifice plate, cavitation is a physical phenomenon that must be considered in CFD analysis and experimental research. Holt et al. [
18] conducted early studies on cavitation effects, finding complex correlations between the static pressure loss coefficient of perforated plates and initial cavitation number with hole area, thickness, and diameter ratio, indicating the complexity of cavitation effects. However, in recent years, most studies on the cavitation effects of orifice flowmeters have been conducted using water as the medium.
Compared to room-temperature fluids, there is a significant difference in properties for cryogenic fluids. For example, the latter has the smaller subcooling in the flow process; therefore, cavitation is more likely to occur with thermal effects, which is commonly not considered with water as the medium. Consequently, cryogenic fluids present more complex flow physics with different flow coefficients and pressure drop characteristics, and the optimization design of the throttling elements for cryogenic fluids is especially required. There are few numerical and experimental studies on the optimization of cryogenic perforated plate structures and their performance. In 2016, a numerical study by Liu et al. [
19] showed that cryogenic fluids have a higher upper limit of the Reynolds number compared to water. Jin et al. [
20] analyzed the influence of hole distribution on liquid hydrogen perforated plates. In 2017, Shaaban et al. [
21] designed a new throttling flowmeter with optimized liquid hydrogen distribution, and the numerical analysis improved the improvements in flow and static pressure loss coefficient and cavitation characteristics compared with the perforated plate flowmeter designed by Jin et al. [
20]. In 2018, Wang [
22] numerically compared the flow performance of perforated plates under different inlet temperatures and outlet pressures with LN
2 as the working medium. In 2016, Tian [
23] conducted preliminary experimental research on balanced flowmeters using LN
2.
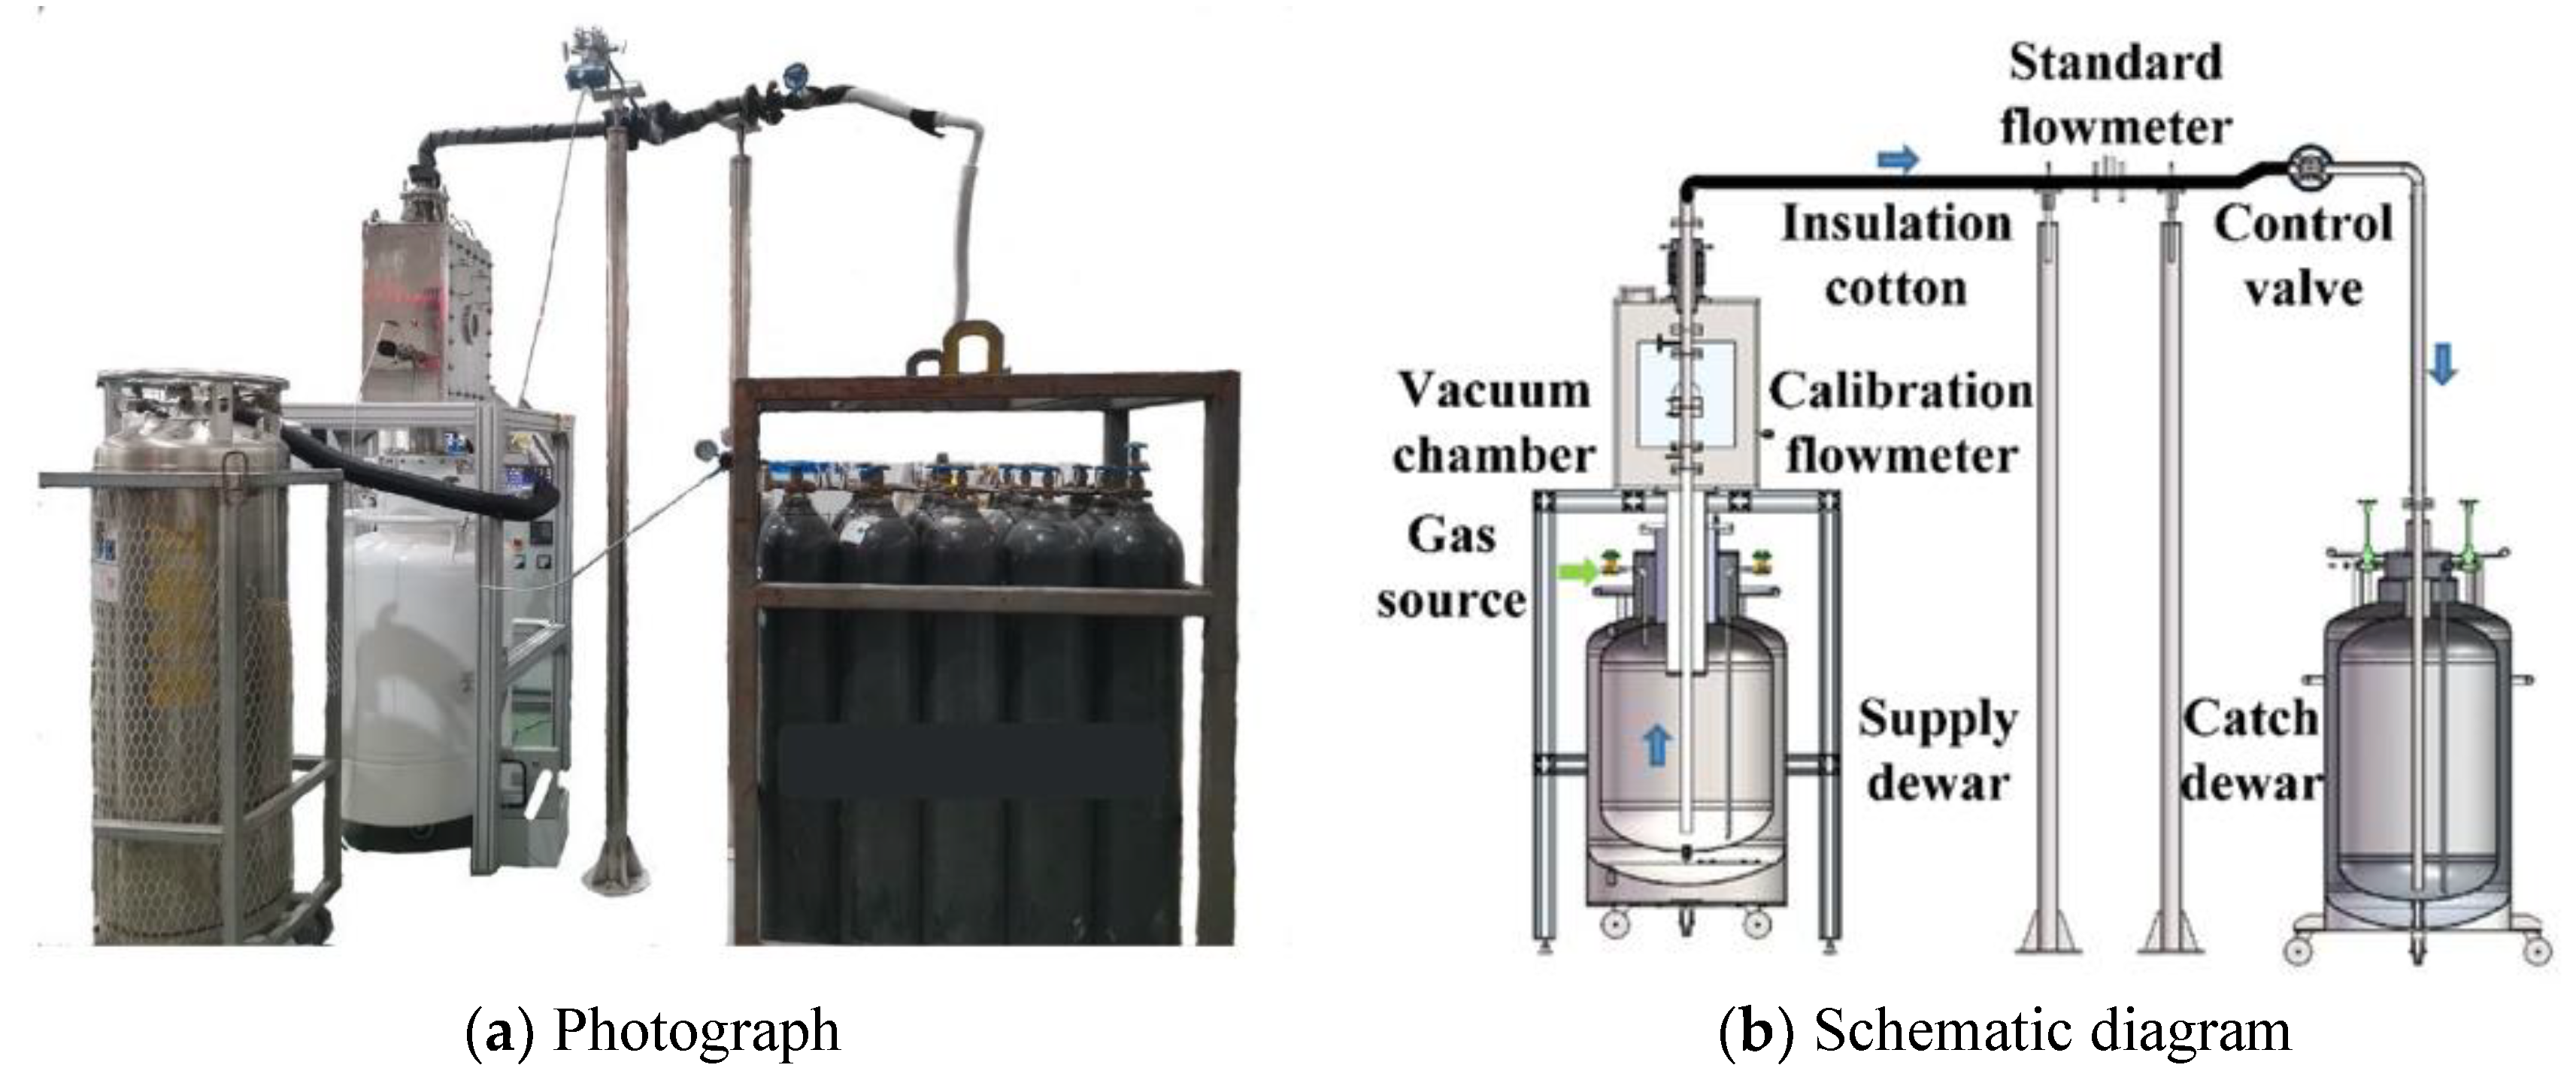
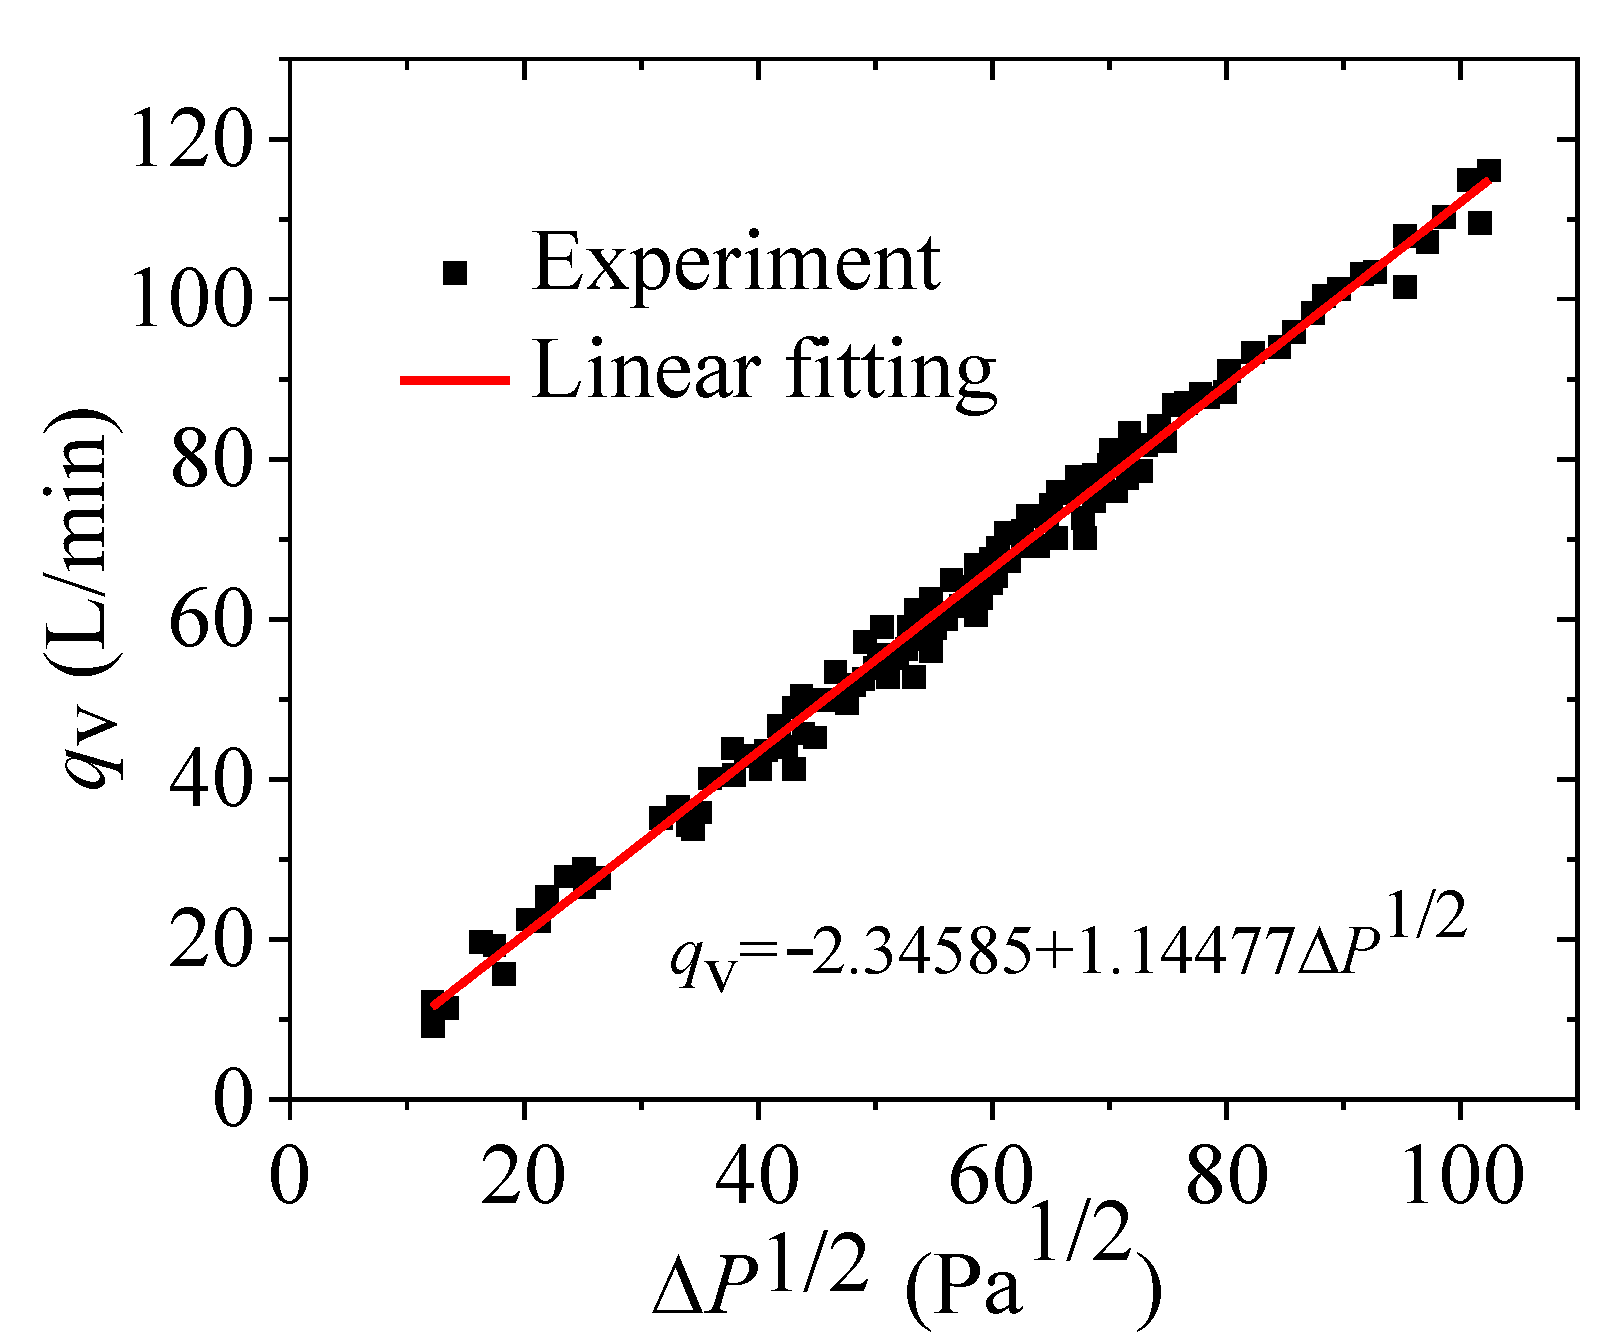
Currently, the designed methods for perforated plates are mainly empirical and trial-and-error, and there are no reports on the design of structural characteristic parameters such as hole opening methods, hole sizes, and hole shapes for cryogenic fluids, as well as the matching of flow ranges, Reynolds numbers, and other operating conditions, and also, the experimental data for cryogenic balanced flowmeter are scarce. This paper focuses on the analysis of the key component, the perforated plate, for the cryogenic balanced flowmeter. It utilizes orthogonal design, proposes a three-factor, three-level CFD numerical experimental method, and focuses on analyzing the influence of structural characteristic parameters on measurement performance under different operating conditions, optimizing structural characteristic parameters and developing a cryogenic fluid balanced flowmeter. An experimental platform for LN2 flow measurement was constructed, and the numerical method was verified. The influence mechanism of the thickness of the perforated plate was systematically studied. The research results obtained the LN2 flow and pressure drop coefficient and the upper limit of the Reynolds number, finally clarifying the influence law of the parameters, which can guide the design of perforated plates.
4. Design of Two-Dimensional Characteristics of Perforated Plate
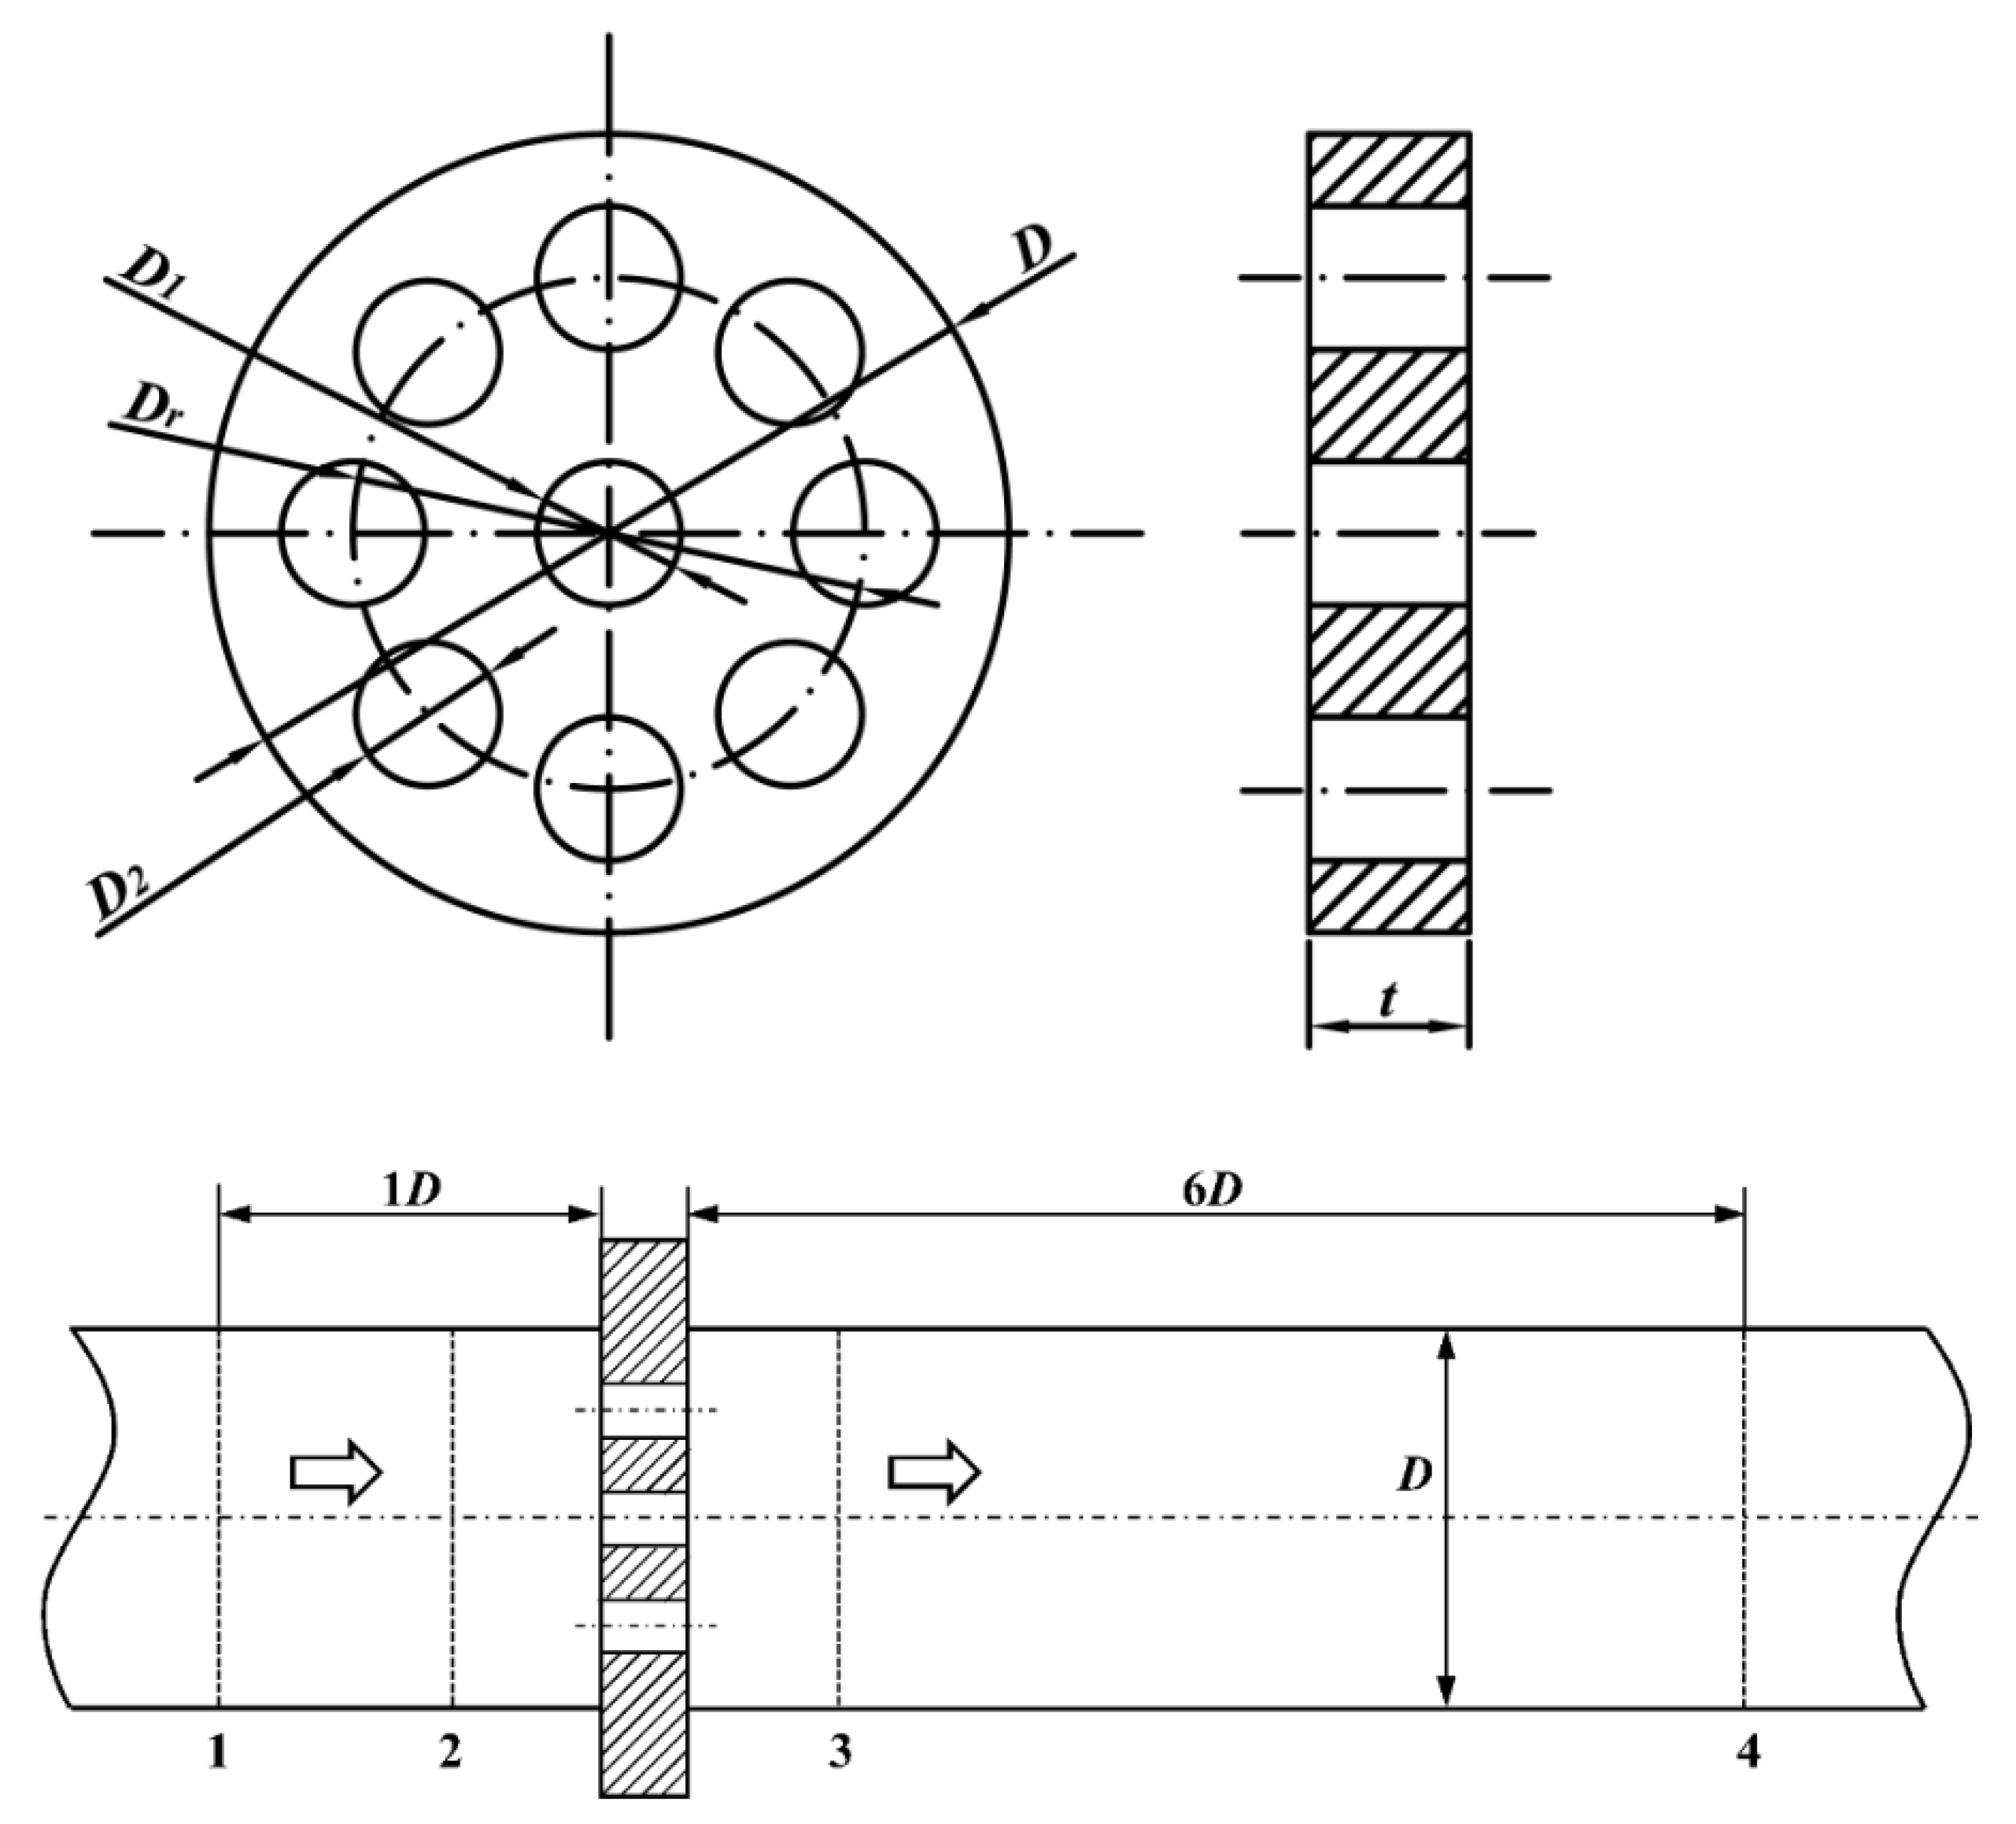
Based on the above validated CFD model, a parameter study was conducted on the hole configuration of the perforated plate with a central hole and uniformly distributed circumferential holes (referred to as “1 +
N” for short), as shown in
Figure 1. By determining the variable values, including the internal diameter of the pipeline
D, the equivalent diameter ratio
β, the number of circumferential holes
N, the hole diameter ratio
K, and the hole position ratio
H, the two-dimensional geometry of the perforated plate could be established. For this study, the equivalent diameter ratio was fixed at
β = 0.6, the thickness at
t = 3 mm, and the pipeline internal diameter at
D = 40 mm. The variable parameters are the number of circumferential holes
N, the hole diameter ratio
K, and the hole position ratio
H, while the performance indicators for best results are the flow coefficient
C and pressure drop coefficient
ζ.
An orthogonal experiment scheme considering three factors, three levels, and three types of interactions, was designed, as shown in
Table 1. Additionally, the L
27(3
13) orthogonal array was selected to conduct the numerical experiments, where each type of interaction occupied two columns, and the three factors and three types of interactions collectively occupied nine columns in the orthogonal array. Under the non-cavitation condition of
Re = 250,808, the experimental results
Ci and
ζi (1 ≤
i ≤ 27) for 27 different two-dimensional characteristic parameters were obtained through calculations. The relative optimal perforated plate structure was determined through range analysis, with the calculation of range
ℜ defined as
The magnitude of the range ℜ indicates the degree of influence of the factor, where Ki represents all results of the selected two-dimensional characteristic parameters at level i. It was found that the degree of influence of each parameter on the flow coefficient C was in the order of number of circumferential holes (N) > hole diameter ratio (K) > hole position ratio (H). The optimal perforated plate for the coefficient C was determined to have N = 8, K = 0.7, and H = 0.48. Conversely, the degree of influence of parameters on the pressure drop coefficient ζ was in the order of hole position ratio (H) > number of circumferential holes (N) > hole diameter ratio (K). The perforated plate with the minimum pressure drop coefficient ζ was found to have N = 8, K = 1.0, and H = 0.62. These results indicate that the optimal two-dimensional characteristic parameters of the perforated plate corresponding to the flow coefficient and pressure drop coefficient are different. Nevertheless, the magnitude of the flow coefficient reflects the rate of pressure recovery of the fluid through the plate, which can be considered as an auxiliary reference for the flowmeter performance compared to the pressure drop coefficient. Therefore, collectively considering these factors, this study adopted the optimal two-dimensional characteristic parameters of the perforated plate corresponding to the pressure drop coefficient ζ.
5. Influence of Three-Dimensional Characteristics of Perforated Plate
Based on the optimal two-dimensional structure of the perforated plate obtained from the above orthogonal experiments, further numerical analysis was conducted to investigate the influence of its thickness. Five thickness levels were considered: t = 1, 3, 6, 9, and 12 mm, with LN2 as the working medium.
Figure 9 illustrates the pressure profiles along the central axis of the perforated plate for different thicknesses when the LN
2 flow at
Re = 250,808. In the figure, the
z axis coincides with the central axis, and the windward face of the orifice plate is defined as z = 0. It can be observed that with the increase in thickness, the pressure distribution along the central axis of the plate exhibits two patterns. The first pattern shows that the fluid experiences throttling only once through the plate (
t = 6, 9 and 12 mm), occurring at the upstream end face of the plate. The position of the minimum contraction section occurs downstream of the plate, which shifts slightly backward with increasing thickness, accompanied by a gradual increase in the contraction coefficient
γ. And the increased contraction coefficient
γ leads to a reduction in pressure loss. The second pattern indicates that the fluid undergoes throttling twice through the plate (
t = 1 and 3 mm), with throttling occurring, respectively, at the upstream and downstream end faces of the plate. The position of the minimum contraction section occurs within the orifices of the plate and remains unchanged as the thickness increases, and the contraction coefficient
γ also remains unchanged. Additionally, from
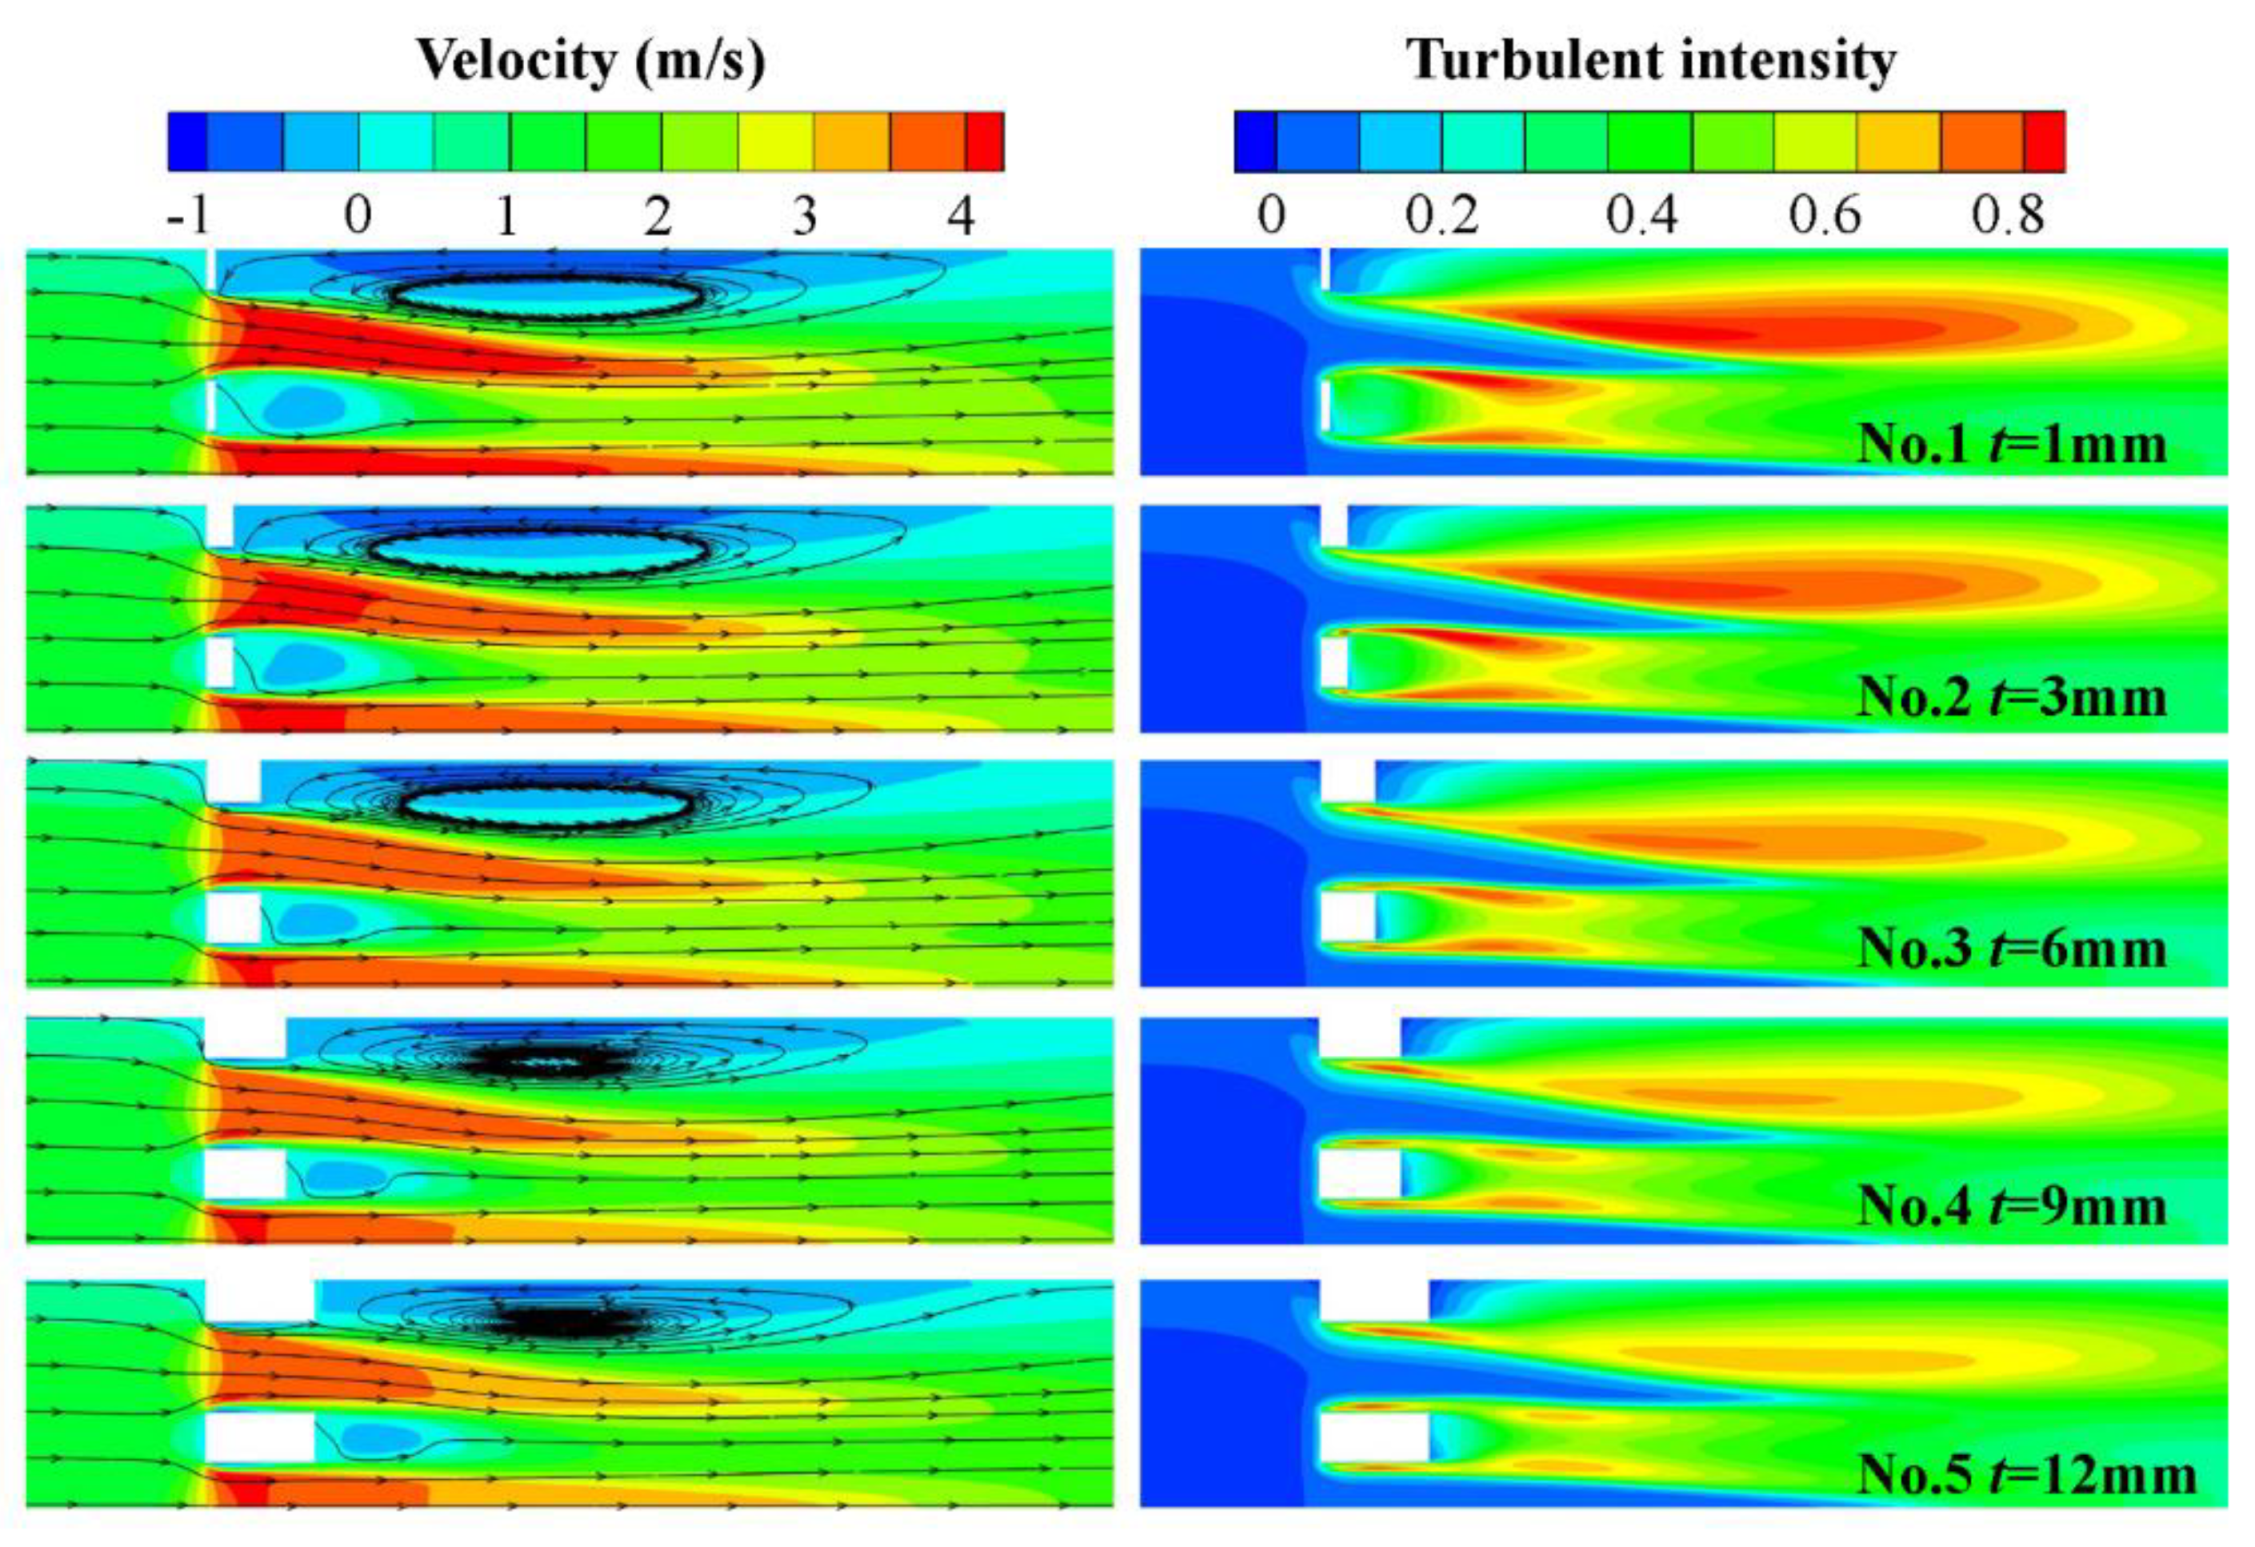
Figure 10, it can be observed that as thickness increases, the area of vortices gradually decreases, and the turbulence intensity behind the plate weakens, indicating reduced energy dissipation and consequently decreased pressure drop. For the first pressure distribution pattern, the turbulence intensity peak is observed downstream of the plate. However, for the second pattern, the maximum turbulence intensity is becoming increasingly apparent inside the small hole, indicating that there is also a throttling here, which explains the reason for the two throttling occurrences in pressure distribution in
Figure 9. Furthermore, the increase in turbulence intensity suggests that cavitation is more likely to occur, as turbulence kinetic energy raises the pressure threshold for cavitation [
24]. The results of typical cavitation conditions presented in
Figure 11 confirm this, which gives the vapor-phase distribution at the maximum area of cavitation considering the quasi-steady-state characteristics of cavitation. As shown in the figure, when
Re = 1,404,918, the cavitation intensity increases gradually with the increase in plate thickness. The maximum cavitation cloud mainly appears within the holes when the thickness
t < 6 mm. Overall, cavitation prevents further reduction in local pressure, thereby improving pressure recovery rate and pressure loss, albeit slightly reducing measurement stability and the upper limit of measurement
Figure 12 presents the variation of flow coefficient
C and pressure drop coefficient
ζ with LN
2 Reynolds number for different thicknesses. It is found that as thickness
t increases, the coefficient
C gradually increases, while the
ζ gradually decreases. This is because, as can be seen from
Figure 10, the increase in thickness leads to a decrease in the maximum velocity of the fluid through the perforated plate, as well as a decrease in the area of vortices downstream of the plate and the turbulence intensity. Therefore, the increase in thickness improves the momentum loss downstream of the plate, leading to improved performance. The inflection points in the curves in the figure are due to the occurrence of cavitation, resulting in a significant decrease in the flow coefficient, which represents the upper limit of flow measurement.
From
Figure 12, the average flow coefficient
and pressure drop coefficient
within the effective Reynolds number range can be obtained. The trends of the
and
at different Reynolds numbers are the same, as shown in
Figure 13 in the self-similar region of Reynolds numbers. As the thickness increases from 1 mm to 12 mm,
increases by 20.8%, while
decreases by 28.6%, and the upper limit Reynolds number
ReU decreases from 13.05 × 10
5 to 12.04 × 10
5. A comprehensive comparison shows that if the emphasis is on obtaining a large flow coefficient, the performance of perforated plates with thicknesses of 9 mm and 12 mm is better than that of thinner plates. However, if the measurement upper limit is preferential, selecting thinner plates is advantageous, albeit with a reduction in the flow coefficient and an increase in pressure drop.


