Abstract
Heating in the winter is one of the human activities that consumes the most energy, thereby affecting the environment and leaving a carbon footprint. An increase in heating efficiency results in a reduction in the energy demand of the process and environmental protection. This contribution aimed to determine and experimentally verify the possibility of obtaining and effectively using the heat from the chimney of a gas boiler generated during the heating of a family house. For this purpose, we used a simple heat exchanger and measured the relevant temperatures on an exchange unit for almost five months during the heating season. The air temperatures measured at the inlet and outlet of the exchanger unit together with the outside temperatures were statistically analyzed to determine the effect of using the exchanger unit to obtain additional heat that could be used for other purposes. In addition, this study investigated whether there was a statistically significant difference in the temperature of the air entering the heating system with different outdoor temperature values. In the discussion, these hypotheses are either confirmed or disproved. Finally, the effectiveness of the current household heating system is evaluated.
1. Introduction
Recently, the topic of global warming has been resonating more and more strongly in the media. Many scientists and politicians have tried to propose strategies to improve or at least maintain the status quo (see, e.g., [1,2,3,4]). The impact of global warming is becoming more and more noticeable worldwide. It can be seen in agriculture, land values, and farm revenues [5,6,7], river runoff [8], streamflow drought [9], the environment itself [10,11], health and mortality [12,13,14], urbanization, migration [12,15], and elsewhere. Increased average temperatures can even cause non-linear upward inflationary pressure. Kotz et al. in [16] estimated that the 2022 summer heat extremes were reflected in food inflation in Europe of 0.43–0.93 percentage points and that future warming estimated for 2035 would amplify this by 50%.
There have been several summits dedicated to finding ways to stop the increase in the average annual temperature (see e.g., [4,17,18,19,20]). However, all this is in vain as long as these efforts remain only on a theoretical level. Therefore, it is our duty to find ways how to put stimulating ideas from conference proceedings, summit discussions, and paper studies into practice.
According to [21], one of the human activities that have a significant impact on the parameters playing a role in global warming is the heating of buildings during the winter season. Coal-fired heating is especially carbon-intensive and represents a significant burden on the environment, society, and the economy. Therefore, several studies have searched for cost-effective solutions towards mitigating energy consumption and greenhouse gas emissions. In these studies, it was proved that replacement of coal combustion results in an air quality improvement (see e.g., [22]). It also has health benefits related to CO2 emissions reduction [23]. Therefore, the question of clean heating has became more and more relevant and forms of clean heating play a crucial part in the energy revolution.
Xue et al. in [24] asked whether clean heating could effectively alleviate air pollution and discussed the results of their empirical study on the plan for cleaner winter heating in northern China. Minofaar et al. [25] looked for a solution using solar photovoltaic and thermal panels. Zhang et al. [24] discussed the environmental benefits of clean heating during the winter and evaluated several options like air-source heat pumps (see also [26]), electric heating systems, wall-mounted natural gas heater systems, biomass pyrolysis, and cogenerated clean heating, and compared the economics, advantages, and disadvantages of these heating systems and methods.
Another approach is based on the increase in heating efficiency, as this results in a reduction of the energy demand in the process, and this way, helps to protect the environment.
Lee et al. in [27] discussed indoor solar heating systems using ventilated roofs. The efficiency and effectiveness of such systems vary depending on their operation methods and design. Traditional systems to increase the solar heat collection effect the intake of a large volume of outside air, which, especially in the winter season, results in over-drying and heat loss. Therefore, Lee et al. suggested using indoor air circulation via ventilated cavities in the roof and indoor walls to prevent over-drying and improve the solar heating and heat-storage effects. Through a numerical simulation, they confirmed 50% or more reduction in heating load and 10% increase of relative humidity when using the suggested method. In addition to air circulation paths, solar air heat can be effectively utilized through the design of spaces and the exterior surfaces of buildings. Moreover, a cooling effect can be obtained through exhausting heat to the outside during the hot season [28]. Solutions have taken the form of trombe walls [29], ventilated facades [30], double skins [31], specially designed roofs [32], and so on.
Thermal regulations within the European Union resulted in a significant rise of new and efficient heating technologies. Comparison of several of these, namely, a gas-fired condensing boiler, a wood pellet boiler, a micro-combined heat and power system, an air-to-water electric heat pump, an air-to-water gas absorption heat pump, and an exhaust air-to-air electric heat pump, from energic and environmental perspectives is given in [33]. One of the surprising results of that study [33] was in relation to the environmental impact of the electricity production mix considered, expressing that the wood-fired boiler caused the lowest greenhouse gas emissions. Discussing the energy performances according to their study, the highest performance levels were achieved with the micro-combined heat and power and the absorption heat pump, but based on current size availability, the air-to-water electric heat pump appeared to be the most efficient technology.
The energy efficiency of gas-heated housing was studied in [34]. Gilijamse and Boonstra [35] compared heat demand reduction and cogeneration as the two main options to reduce fuel consumption for space heating and warm tap water in buildings. Both of these methods appear to have considerable fuel-saving potential. Because at present, the natural gas prices of both options are not cost-effective, the authors concluded that their combination could make a large contribution to fuel consumption reduction goals.
In this paper, we present another approach to reduce household costs, through studying the potential for utilization of the heat from the chimney for other purposes. To achieve this, a simple heat exchanger was mounted on the gas boiler of a model house in Slovakia in order to harvest the heat energy. Subsequently, the relevant temperatures were measured on an exchange unit for a period of almost five months during the heating season. The obtained data were collected and processed.
The environmental benefits of such heating options during the winter season were evaluated based on the extensive analysis. Suggestions regarding this heating technology are presented in this paper.
The aim of the study was to find out and experimentally verify whether it was possible to obtain and effectively use the heat from the chimney of a gas boiler generated during the heating of a family house.
The results of the study showed that incorporating a heat exchanger into the gas boiler system led to a significant saving of heat energy. Reducing the temperature of the air discharged into the external environment is important from the environmental point of view. The technological contribution of this study is significant for energy harvesting and utilization for domestic purposes and it can thus be reflected in cost savings.
2. Materials and Methods
In addition to using renewable energy, energy harvesting and recuperation are urgently needed to reduce household energy consumption. In this contribution, the technology of using air circulation in the heat exchanger to use heat energy more efficiently in a model family house was actively investigated.
The aim of the experiment was to verify whether it was possible to harvest and utilize the heat from the chimney generated during the combustion of gas in the heating boiler of a family house.
The original technical operation of the boiler was as follows: The flame of the gas boiler heated the water, which was then used to heat the house through the hot water piping and the radiator system. The boiler turned on automatically when the temperature in the house dropped below the value preset on the thermostat. During the entire experiment, this value was preset to 19 °C. It is important to note that the boiler was non-condensing, and it did not provide domestic hot water for a kitchen or bathroom. The hot tap water was provided in another way, namely through electric heating.
The experimental part of the study presented in this paper ran from November 2023 to April 2024.
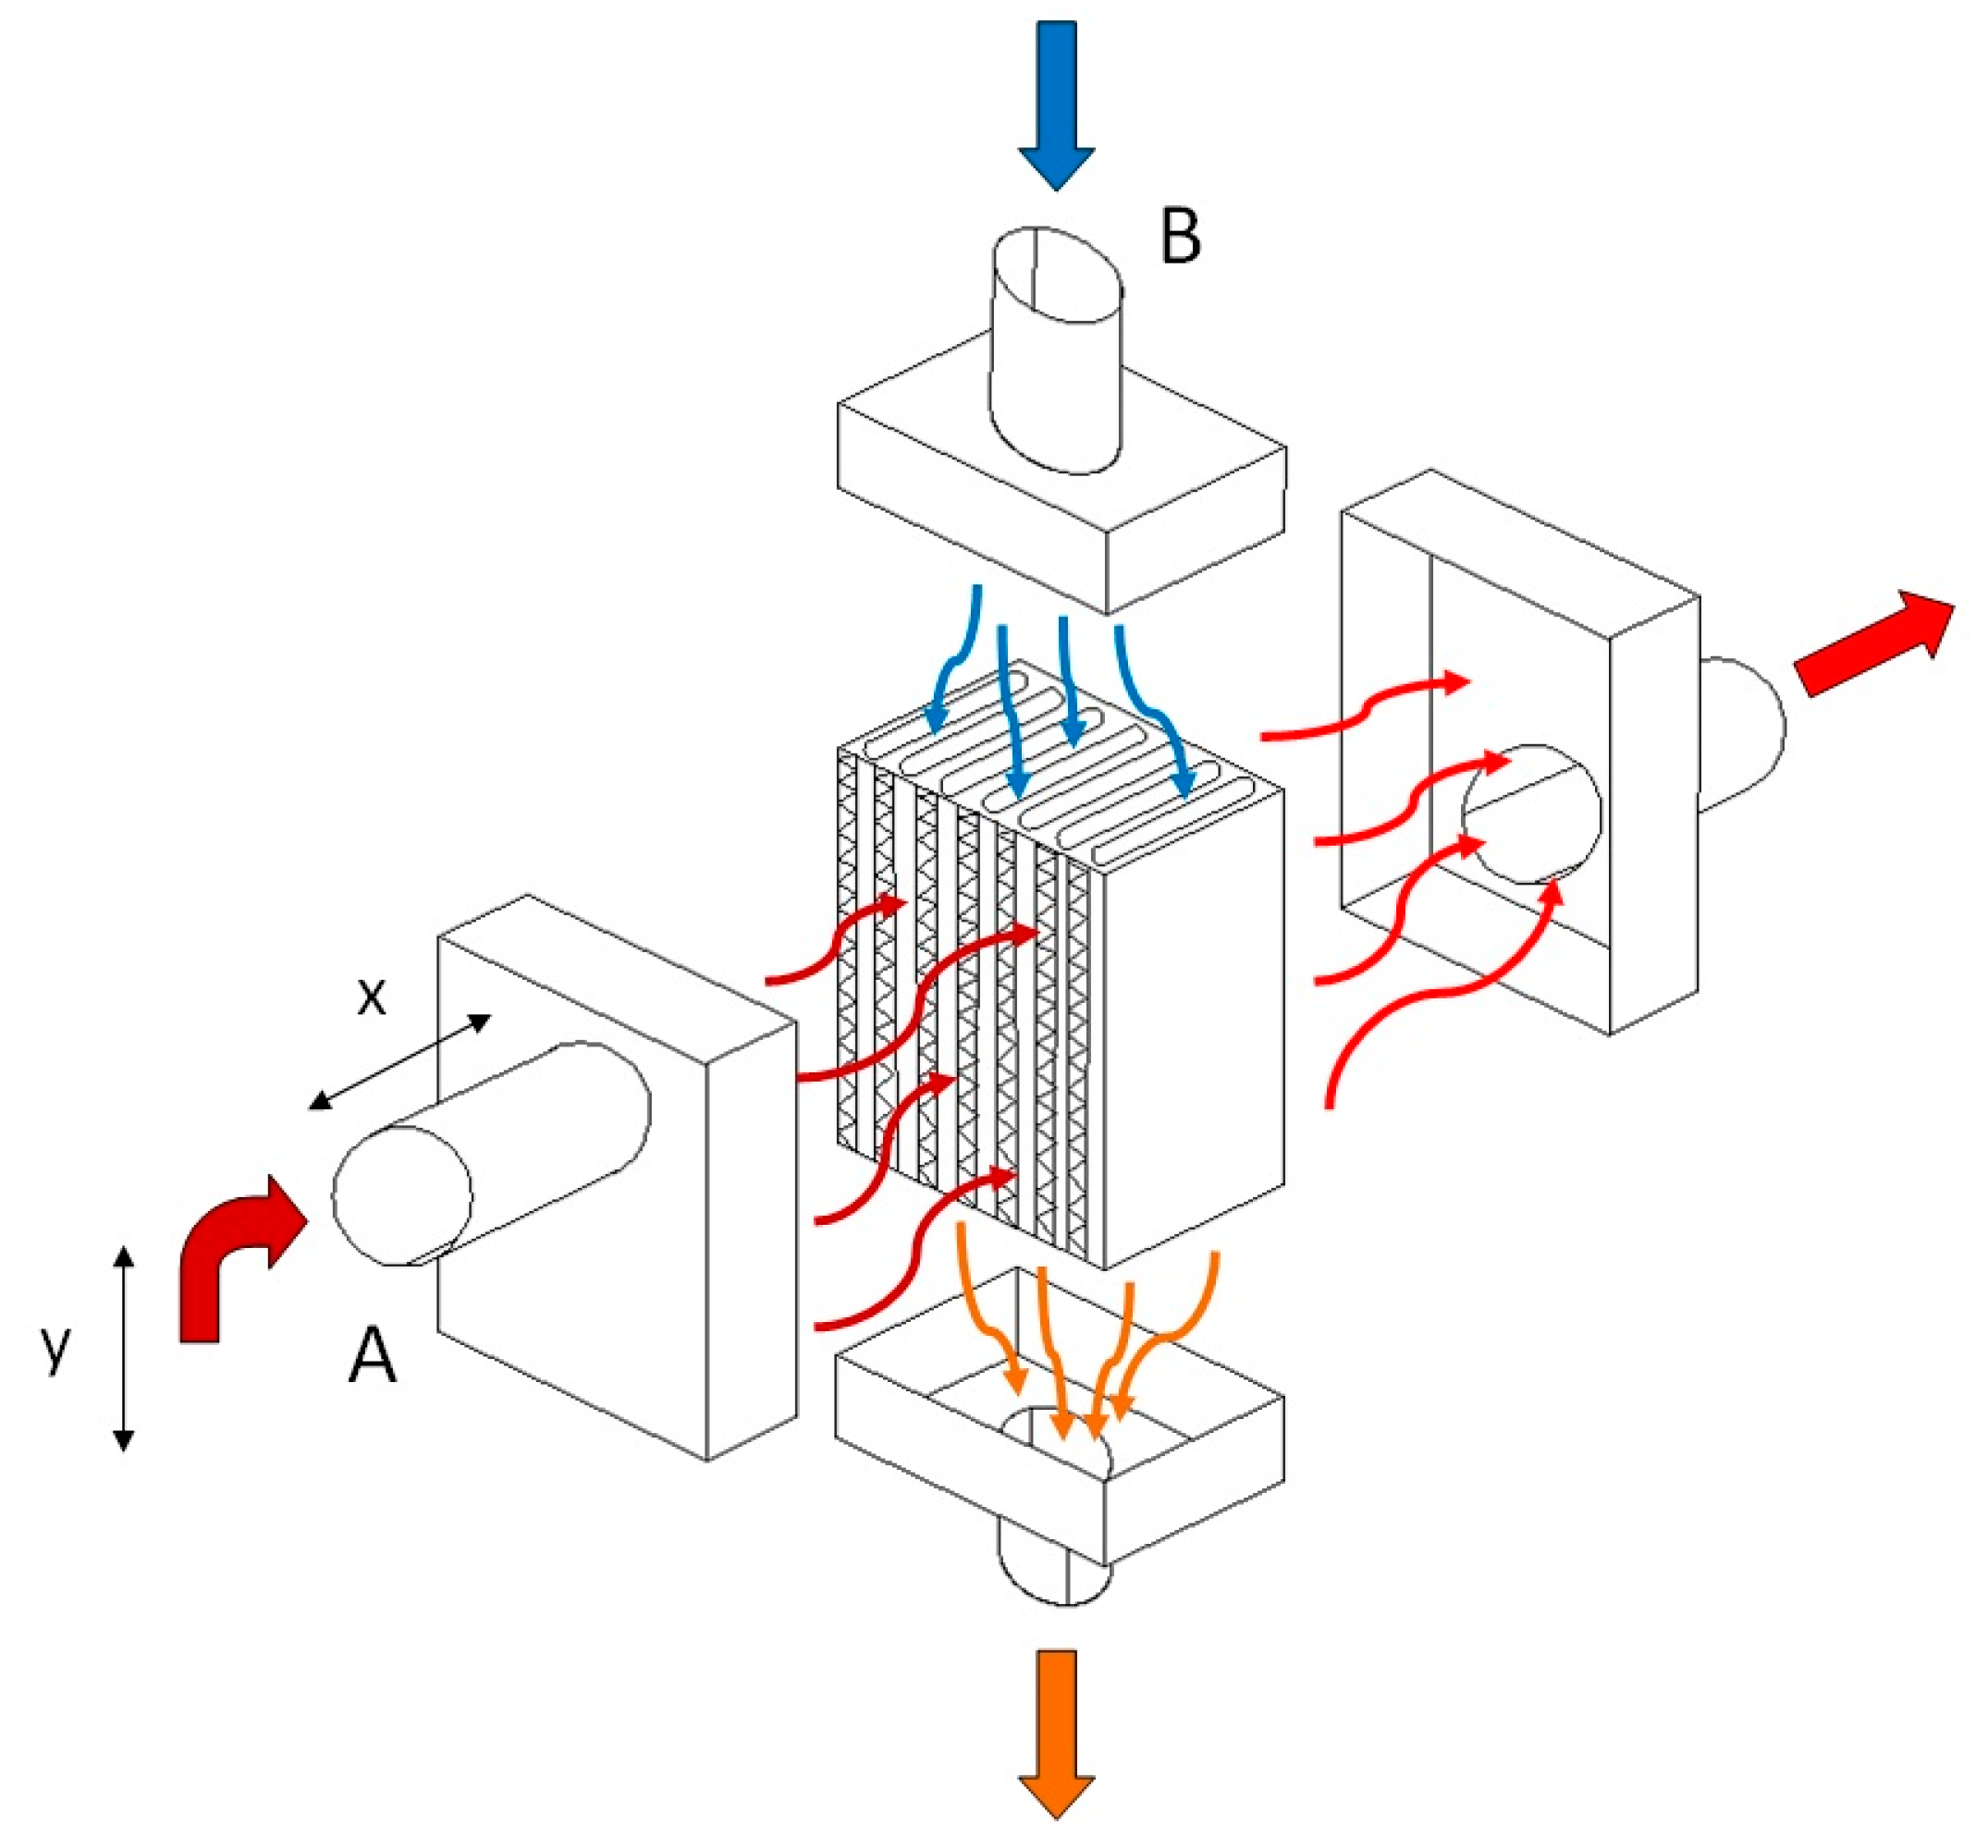
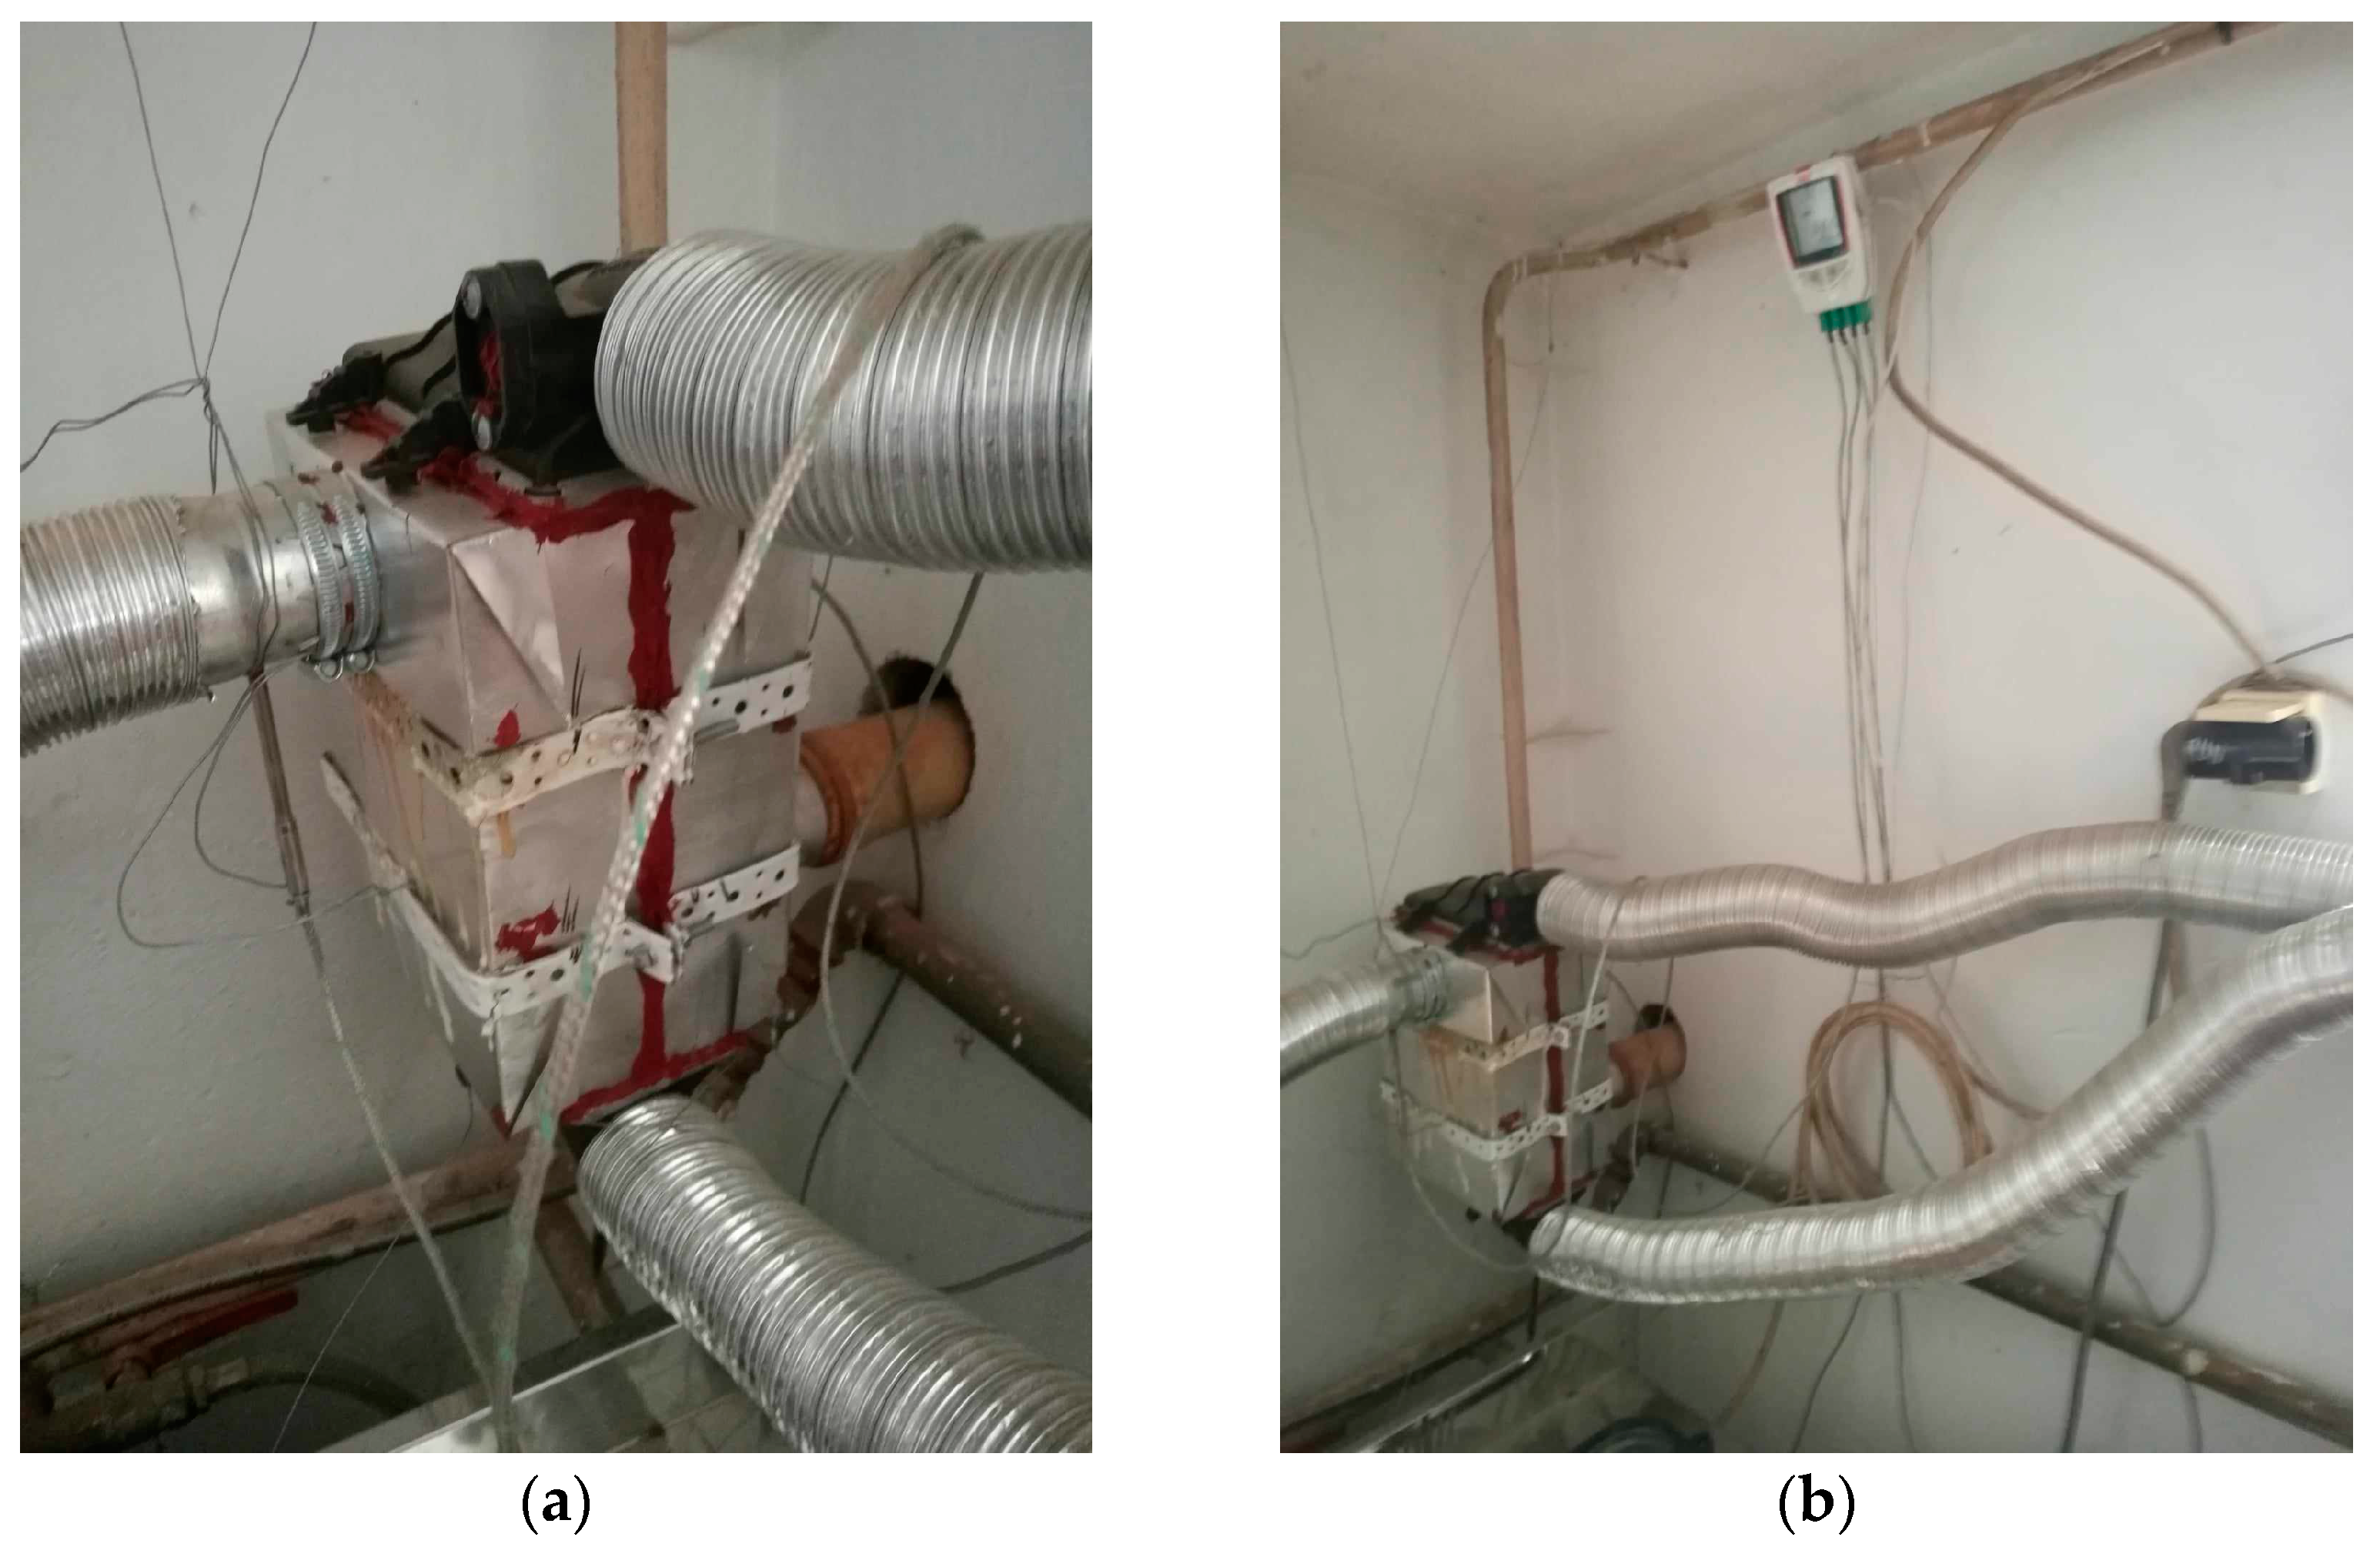
In this experiment, a unique heat exchanger unit measuring 24 × 17 × 13 [cm] was constructed, marking a significant step forward in our understanding of energy efficiency. We used the configuration of a tube-type heat exchanger. In the exchanger, the heat exchange took place between the flue gases and the air, through its walls. The incoming air to be heated was carried through a number of parallel tubes, while hot gases entered a shell surrounding the tubes—see Figure 1. We decided on such a type of heat exchanger as, in general, compared with radiation exchangers, tube-type models are more compact and have higher effectiveness because of the larger heat transfer area through the use of multiple tubes and multiple passes of the gases. The heat exchanger was mounted at a height circa 1 m of the chimney, where ¾ of this distance was counted vertically and ¼ horizontally. The duct tube had a round shape. Round is the most effective duct shape; it is typically the most efficient in transporting air. Such ducts utilize less material than rectangular ducts and still handle the same amount of air. Square or rectangular ducts are designed to fit building construction and these types of ducts are commonly used for tight spaces that round ductwork can not fit in, like between walls. There also exists spiral ducting characterized by its spiral shape that offers a smoother airflow compared with traditional rectangular ducts. As the chimney was originally produced with a round shape of diameter 60 mm, it was not replaced with a differently shaped one but the rigid ducting was replaced with a flexible aluminum one of the same size, as stiff ducts are hard to use to connect non-flexible ductwork. A chimney pipe with a diameter of 60 mm also passed through the exchanger unit, through which flue gases flowed from the boiler to the chimney; this is referred to as heating tube (A). In our calculations the temperature of the tube inlet to the exchanger is designated as K1, and the tube’s temperature at the outlet of the exchanger is referred to as K2. At the same time, another pipe with a diameter of 6 cm passed through the exchanger unit, which drew air from the outside that flowed into the garage of the family house; this is referred to as heated tube (B). The temperature at the inlet of the heated hose to the exchanger is designated as K3, and the temperature at the outlet of the heated hose from the exchanger is marked as K4. Heat exchange occurred between the heating and heated tubes in the heat exchanger unit. The heat exchanger unit and its inputs and outputs are shown in Figure 2a. Figure 2b shows the location of the temperature recording device.
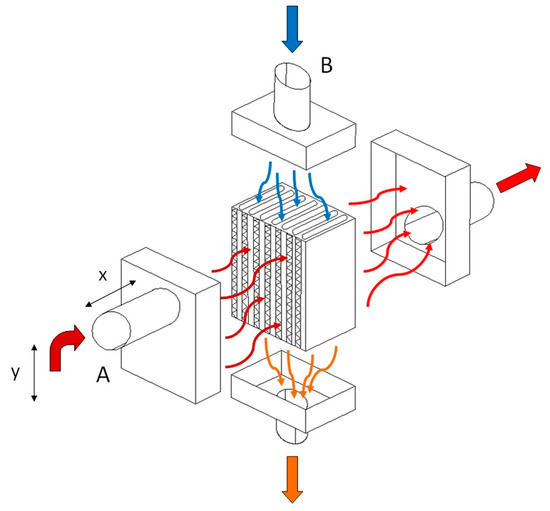
Figure 1.
The principle of the heat exchanger: (A)—heating tube, (B)—heated tube, x = 25 cm, y = 75 cm. The blue arrow indicates cold air drawn in from outside. Arrows in shades of red represent heated air, while the darker is the shade of the arrow, the warmer is the air represented.
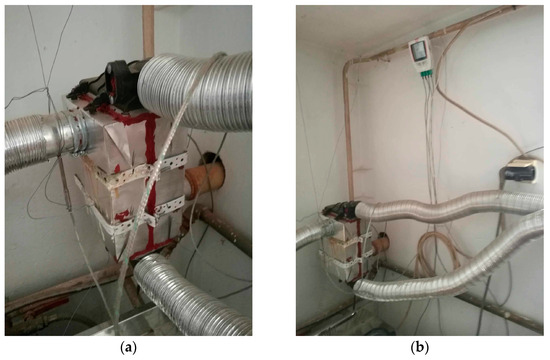
Figure 2.
(a) The heat exchanger unit and its inputs and outputs; (b) the location of the temperature recording device.
The temperatures of both tubes at the inlet and outlet of the exchanger unit were meticulously recorded at a high frequency of 6 times per second, ensuring the reliability and accuracy of our data.
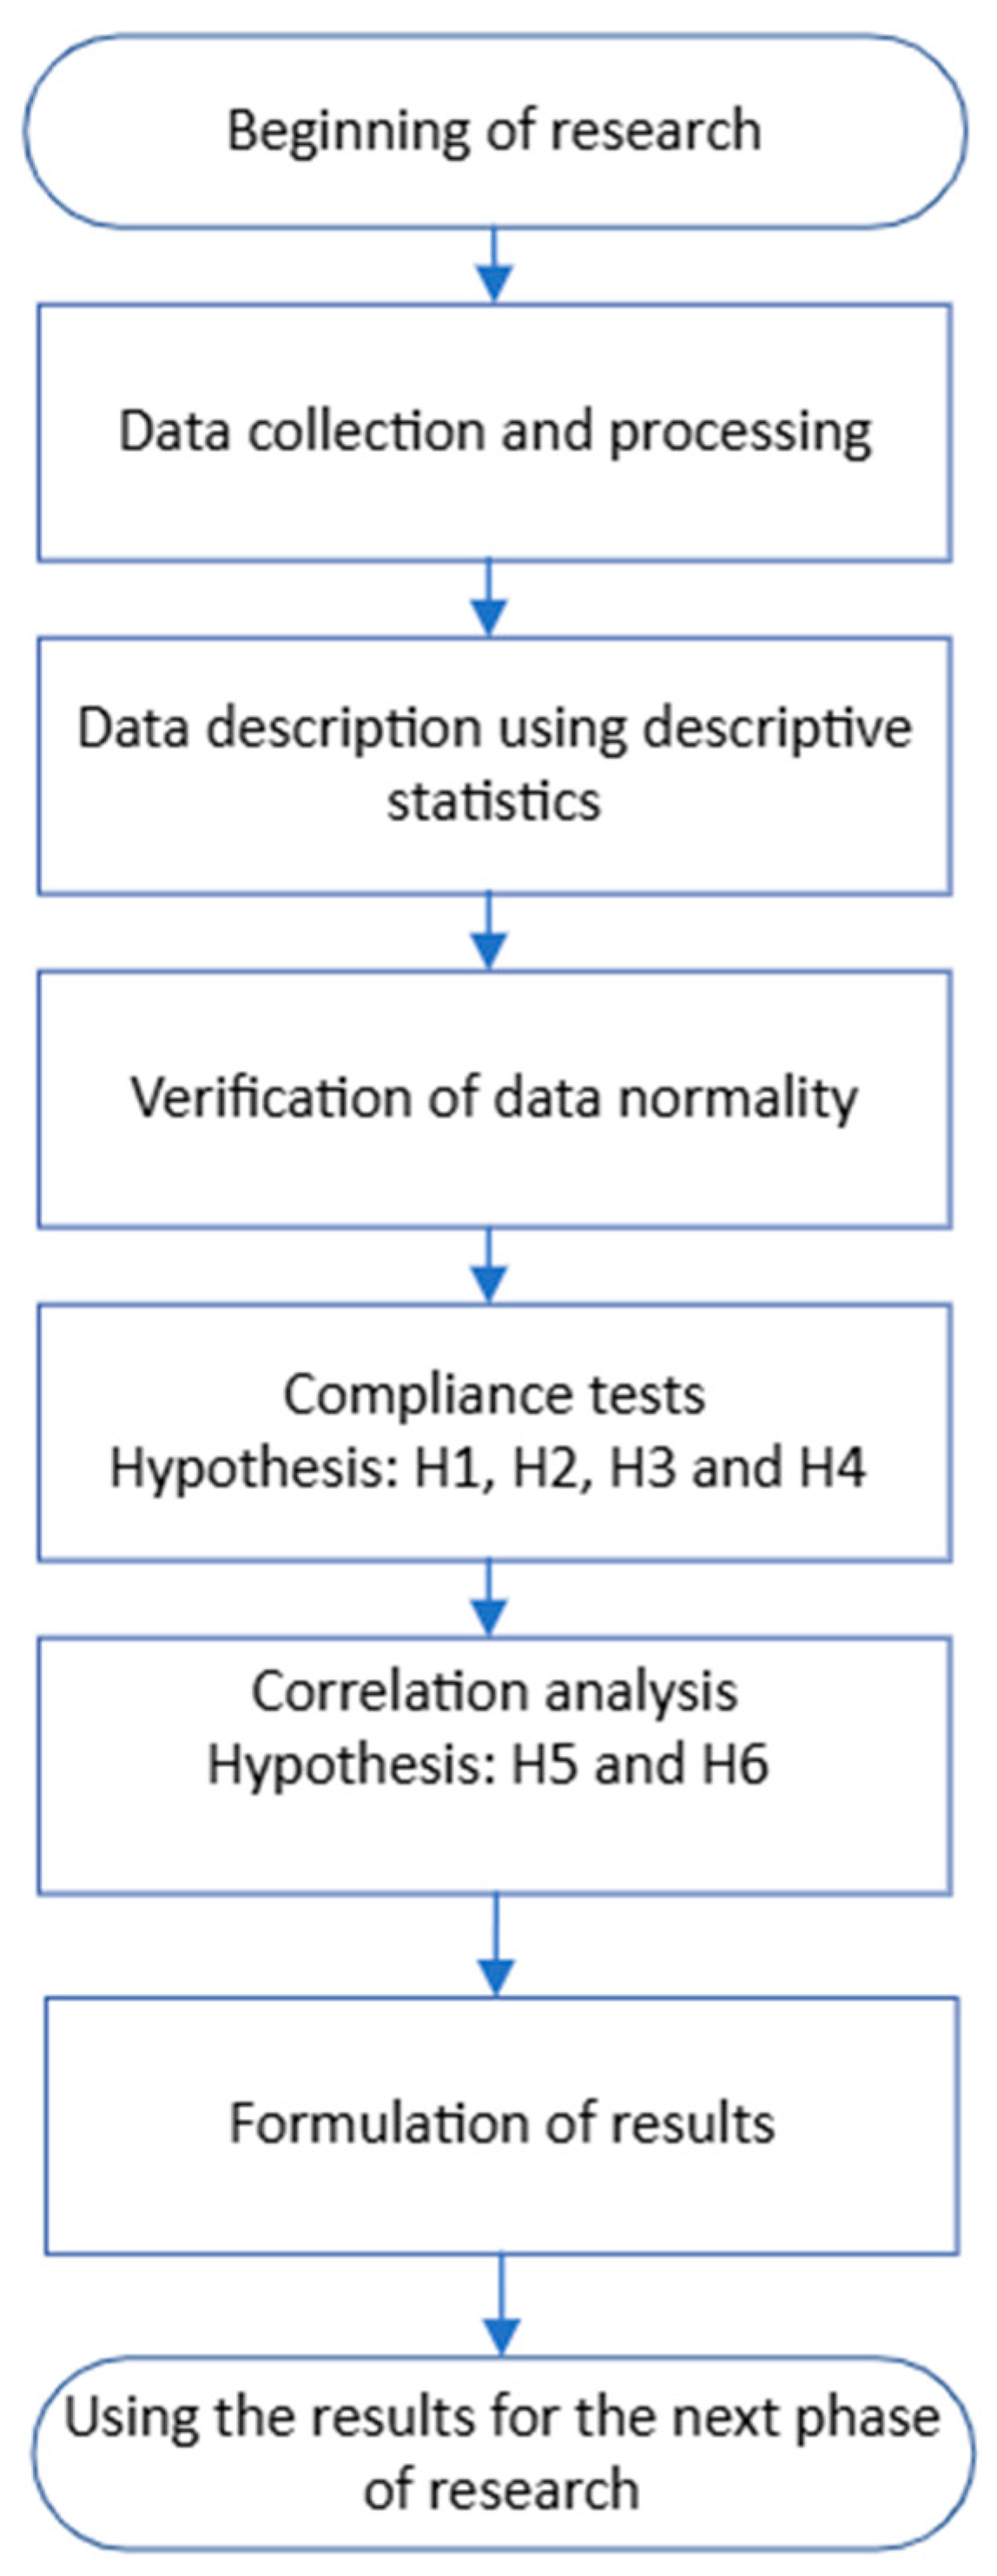
Figure 3 shows the procedure for solving the experimental task. After data collection and processing, data normality was verified, research hypotheses were established, and conclusions formulated.
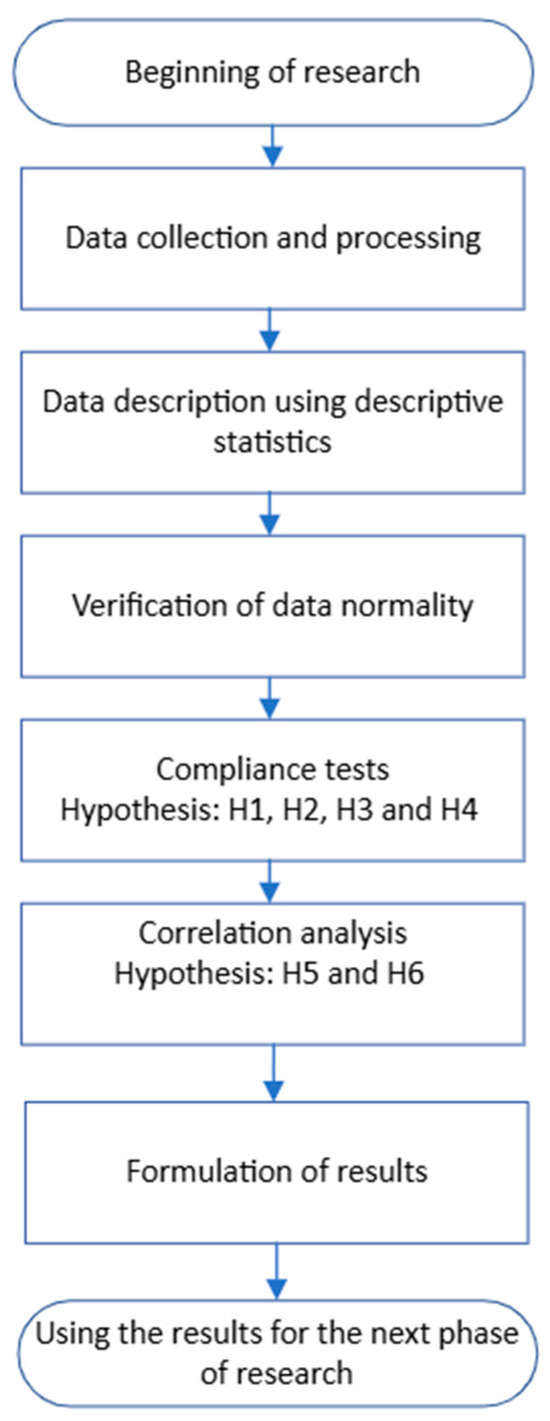
Figure 3.
Procedure for solving the experimental task.
To meet the research objective, the following research hypotheses were established:
H1:
The exchanger will increase the average air temperature at the output;
H2:
Considering the amount of air 0.001 kg that heats up in one time interval—⅙ s, the measured amount of heat obtained per day—obtained quantity of heat Q is more than 300 kJ;
H3:
When considering the amount of air 0.001 kg that heats up the average Q for a heating cycle, the measured amount of heat obtained per boiler switch-on is induced by a thermostat of 4 kJ;
H4:
There is a statistically significant difference in the average amount of heat obtained in 1 day, obtained quantity of heat Q, for different months of the year;
H5:
There is a dependence between the average temperature of the chimney K1 and the average temperature of the air flowing from the exchanger K4;
H6:
There exist relations between average temperatures per day, Mean K1, Mean K2, Mean K3, and Mean K4.
The following statistical tools were used to describe the measured data and verify the research hypotheses: descriptive statistics, normality tests, one-sample and two-sample t-tests for comparing means, and one-sample nonparametric Wilcoxon testing for assessing median equality with a constant. ANOVA testing, Tukey multiple comparisons of means, and principles of regression modeling, namely linear regression modeling [36,37]. Statistical calculations and evaluations were performed in the R statistical environment, known as the R project [38].
Determination of air parameters for the heated tube:
Due to the size of the exchanger unit and the fact that we did not know the temperatures in the room where the heated air flowed, we decided to perform very simplified calculations.
We considered the weight of air that passed through the exchanger at each time interval to be constant: 0.001 kg
Since we had data on the temperature of the pipe at the inlet and output for every ⅙ s, we determined the value of the heat obtained as:
where is the temperature difference of the intake air at the inlet and outlet of the exchanger, c is the specific thermal constant 1005 J/(K.kg), m represents the mass of air in kilograms. We divided the calculated value by 1000 to obtain the value in KJ.
The processing of measured data was carried out as follows:
We divided the recorded temperature data into days from 00:00:00 to 23:59:59, obtaining 8640 records for each day. For each period, the heat received in kJ was calculated.
Subsequently, day-by-day summaries and a record of each day were created, consisting of the following variables:
- Date—representing the year, month, and day on which the measurements were conducted/performed.
- Minimum outside temperature—the lowest temperature measured at position K3 over the course of a single day, from 00:00 to 23:59 on the current date.
- Mean K1, Mean K2, Mean K3, and Mean K4—average of measured values at marked positions K1, K2, K3, and K4 of 8640 values.
- Obtained quantity of heat Q in KJ, the sum of received heat for 8640 periods of time.
- Number of heating cycles, number of boiler heating starts for the whole day
- Average Q for heating cycle, calculated as:
- Calendar month of the year.
During the experiment, several situations arose that made it impossible to use the measurement results. Data for January were missing, due to an error in starting the data recording, resulting in no data being recorded for the entire month. The second situation occurred each time the data recording was initiated, causing a several-minute interruption, and therefore, data for such days were not used in the presented research. The third situation occurred on days when outside temperatures were too high during the day, leading to confusing results, such as negative values of received heat, due to our very simplified heat calculations. We cleaned the data obtained this way and removed records where the value of obtained quantity of heat Q in 24 h was negative, or the minimum outside temperature was higher than 15 °C, as well as days when the number of heating cycles was less than 25. The file created in this way contained records for 124 days.
Based on the results of the proposed heating system, conclusions were formulated.
3. Results
In this section, we provide an overview of the descriptive statistics of variables in the day-by-day records, verification of the research hypotheses using statistical methods, and graphical presentation of the statistical evaluation of the research results.
Table 1 presents descriptive statistics of the day-by-day records.

Table 1.
Descriptive statistics of day-by-day records of variables.
We would like to draw the reader’s attention to the high variability of the variables. This fact confirms that the building being heated was not especially energy-saving and the daily characteristics were dependent on meteorological conditions.
To correctly choose statistical tools for evaluating and presenting the research results, we needed to verify whether the numerical variables came from populations with normal distribution. Table 2 presents the p-value of the Pearson normality test. Where the p-value was greater than 0.05, the null hypothesis of conformity with the normal distribution could not be rejected. This means that the variables Mean K2 and Average Q for the heating cycle did not come from normally divided populations.

Table 2.
p-value of the Pearson normality test.
The next important aspect addressing questions regarding the relationships between variables is the rate of linear dependence, known as correlation, presented in Table 3. Due to the nature of the data, the Spearman correlation coefficient was employed. A statistically significant correlation existed when the absolute value of the correlation coefficient exceeded 0.7. In this context, we can conclude the following correlations: between each pair of variables among Mean K1, Mean K2, Mean K3, Mean K4, obtained quantity of heat Q, and number of heating cycles; between the pair of variables—minimum outside temperature and Mean K3; and between minimum outside temperature and obtained quantity of heat Q.

Table 3.
Correlation matrix of Spearman correlation coefficient.
The results presented in Table 3 verify the validity of the research hypotheses H5 and H6.
Hypothesis H1: The exchanger will increase the average air temperature at the output. We can easily verify this using a two-sample average matching test, as both variables come from a population with a normal distribution. The statistical null hypothesis zero is Mean K3 ≤ Mean K4. The test result for var.equal = FALSE returned a p-value < 2.2 × 10⁻¹⁶. The null hypothesis is rejected in favor of the alternative, with an estimate of the mean of K3 = 11.66607 °C and mean of K4 = 56.04770 °C. The research hypothesis is considered true.
Hypothesis H2: Considering the amount of air 0.001 kg that heats up in one time interval of ⅙ s, the measured amount of heat obtained per day—obtained quantity of heat Q is more than 300 kJ. This can be verified using a t-test for comparing the mean with a constant. The statistical null hypothesis is mean of obtained heat Q ≤ 300 kJ.
The result of the test showed p-value = 3.348 × 10⁻¹⁴; therefore, the null hypothesis is rejected and the research hypothesis H2 is confirmed.
Hypothesis H3: When considering the amount of air 0.001 kg that heats up the average Q in the heating cycle, the measured amount of heat obtained per boiler switch-on induced with a thermostat is 4 kJ. This was verified using the Wilcoxon test for assessing median equality with a constant; the value of 4 kJ was considered a constant. The test result was p-value = 0.244. That means that a null hypothesis cannot be rejected. This confirms the research hypothesis.
Hypothesis H4: There is a statistically significant difference in the average amount of heat obtained in 1 day, obtained quantity of heat Q, for different months of the year. This was verified using the ANOVA test since the condition for its use is the normality of residues, with regard to the consistency of the variances of the populations sorted by month of the year. These conditions met the significance level 0.05.
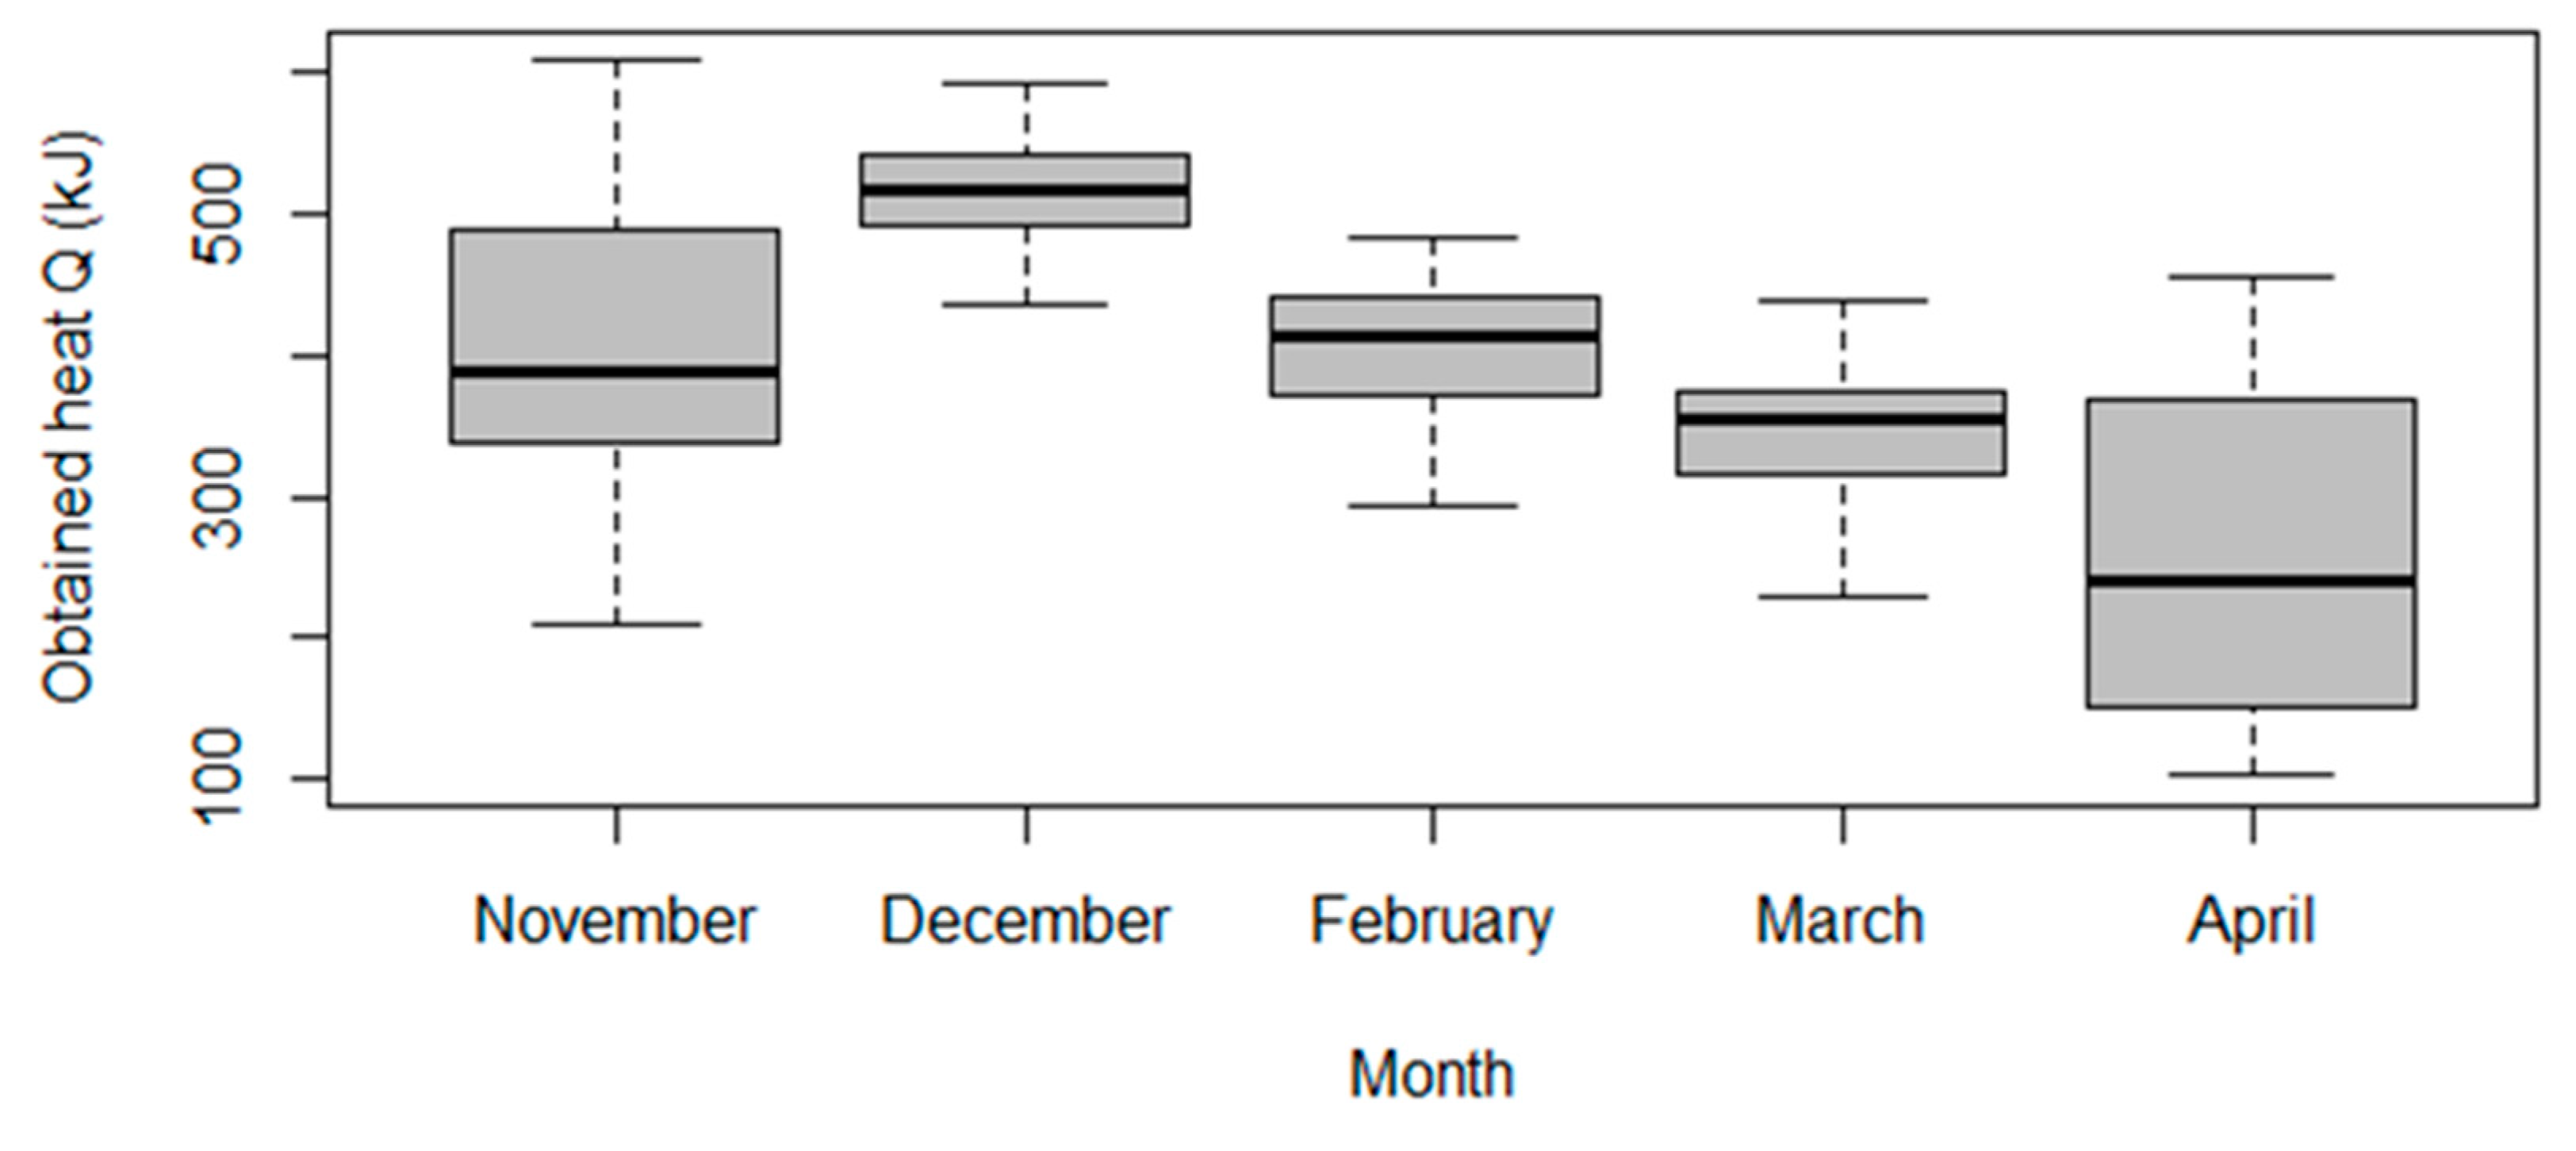
The result of the ANOVA test was p-value = 4.605 × 10⁻¹⁶; the null hypothesis is rejected. In pair comparison we observed for which months the average values differed and for which they did not. The results of the pair comparison are presented in Table 4. The term “p adj” refers to the adjusted p-value for multiple comparisons. If the “p adj” was less than or equal to a pre-set significance level (in this case, 0.05), then the difference between the groups is considered statistically significant. Based on this, we can conclude that there was no statistically significant difference between the average values of the obtained quantity of heat Q for the pairs of months March–February, November–February, and November–March.

Table 4.
Tukey multiple comparisons of means.
These results are graphically presented in Figure 4, showing the boxplots of obtained quantity of heat Q sorted by month.
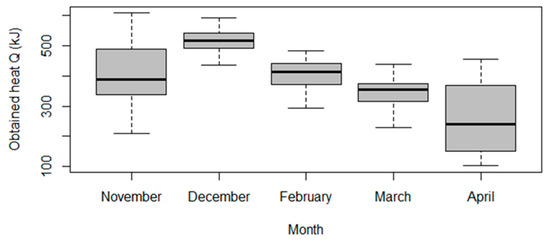
Figure 4.
Boxplot of obtained heat Q sorted by month.
The research hypotheses were verified using statistical methods.
4. Discussion
In this section, we summarize the findings we arrived at via evaluating the data and monitoring the experiment. The results of the verification of the research hypotheses can be summarized as follows:
Hypothesis H1, which states that the exchanger will increase the average air temperature at the output, is confirmed.
The same is true for H2: considering the amount of air 0.001 kg that heats up in a single time interval—⅙ s, the measured amount of heat obtained per day—obtained quantity of heat Q—was more than 300 kJ.
The following statement of hypothesis H3 is also confirmed: When considering the amount of air 0.001 kg that heats up the average heat Q in the heating cycle, the measured amount of heat obtained per boiler switch-on induced with a thermostat is 4 kJ.
Hypothesis H4 states that there is a statistically significant difference in the average amount of heat obtained in one day. The obtained quantity of heat Q for different months of the year was confirmed only for some pairs of months.
Hypothesis H5, which states that there is a dependence between the average temperature of the chimney—K1 and the average temperature of the air flowing from the exchanger—K4, is also confirmed.
Hypothesis H6: there exist relations between average temperatures per day, Mean K1, Mean K2, Mean K3, Mean K4, is confirmed.
Through experimentation, we found the following:
The additional heat recovered depended on the outside temperature and meteorological conditions. A statistically significant dependence Q obtained for the number of switch-ons of the boiler controlled by the thermostat was confirmed.
During boiler heating, air and pipes with flowing air were heated even outside the exchanger. Therefore, it is impossible to predict the behavior of heated air or allow it to re-enter the system, as it could extinguish the flame.
Air heating at the exchanger’s outlet occurred even at relatively low chimney temperatures (30 °C to 50 °C).
It is evident from the calculation procedure that the calculations have been significant simplified through considering a constant mass of air heated for ⅙ s (1 g), constant air density, and constant airflow velocity. We employed this approach to accommodate our research hypotheses. However, the respective heat transfer problem is more complicated and requires combined analysis of coupled momentum (fluid flow) and energy (heat transfer)—see [39].
A variation in pressure can influence the mass (m) of the air traversing the system. Air is a compressible fluid; hence, at elevated pressures, a larger quantity of air (thus a greater mass m) is admitted into the system within the same temporal interval. A pressure alteration also modifies the mass of the air that passes through the system, and consequently, the total heat gained Q. The precise modifications are contingent on the specific conditions of the system. Therefore, in the subsequent phase of the investigation, measurements of pressure and air velocity will be incorporated into the experimental assembly, among other factors. This will facilitate the development of a more sophisticated thermodynamic model of the apparatus.
In this study, we have shown that through lowering the temperature of flue gases, it is possible to obtain some heat. This heat energy can be transferred between two objects or mediums in general or transformed into other forms of energy, such as chemical, mechanical, or electrical energy, via appropriately designed systems based on thermal engineering concepts. Progress in this field, as well as key concepts and applications, is described in [40]. According to [41], the already high demand for energy, primarily from combustion, is expected to increase rapidly.
The use of heat obtained from flue gas or exhaust gages has been addressed by several authors in their research [42,43,44]. Zhao et al. [42] investigated the potential and possibilities of using waste heat from natural gas flues for space heating. They found that 1 billion square meters of heating area could be heated with waste heat, reducing natural gas consumption, achieving energy savings, and reducing emissions. In their research, several authors have explored the possibilities of utilizing waste heat from exhaust gases. Sarode and Vinchurkar [43] described an approach to recovering heat from a compressed air system based on waste heat recovery; a review showed that approximately 30–40% of energy was lost as waste when utilizing the exhaust gas internal combustion engine. However, in that study, a similar heat exchanger was graphically designed, and the estimate of recoverable heat was not specified.
The lack of information on overall combustion systems has inspired researchers to develop creative ideas like the one described in the present paper. In this sense, it may be interesting to explore the possibilities of using other types of heat exchangers and make a comparison. Zohuri investigated several types of heat exchangers in his publication [45]. He argued that heat transfer efficiency, manufacturing cost, installation cost, weight, and size were critical factors in selecting the appropriate type of heat exchanger.
From a safety point of view, a heat exchanger similar to that used in the experiment should not be self-made. Equipment to use the heat obtained in the manner presented in this article must be designed with consistent cooperation between boiler manufacturing experts and chimney system design experts.
In general, duct systems can be divided into three categories: flexible, rigid, and semi-rigid ducting. Rigid duct systems are available in a variety of materials and sizes and are usually rectangular or cylindrical. They are popular since they are tough, long-lasting, and dependable. Semi-rigid ducting systems allow easy movement between round and oval ducting without affecting system function. Flexible ducts are usually tube-shaped and ideal for tight locations where rigid ducts cannot be installed or stiff ducts cannot be used to connect non-flexible ductwork. Flexible ducts provide several advantages, including ease of installation and lower costs than other types of ductwork.
In our case, when choosing the pipe system, we took into account the original shape and size of the already existing outlets on the boiler, easy installation, and a comfortable living environment, as well as the economic point of view. Therefore, the rigid round-shaped ducting of diameter 60 mm was replaced with a flexible aluminum round shape ductwork of the same diameter, as aluminum was a lightweight, flexible, more affordable option, and such ducting was easy to install. For the final choice we also took into account the fact that considering the dimensions of the heat exchanger and the position of the measuring devices on it, the duct material itself was of low importance.
The experimental device (heat exchanger) was 24 cm long. This dimension was chosen for safety reasons because before conducting the experiment, it was not clear what the temperature conditions would be inside the equipment and whether there would be a risk of fire. It was designed to safely discharge combustion gases through the chimney into the atmosphere (to prevent a decrease in chimney draft). Under no circumstances do we recommend that any DIY enthusiast or craftsman should manufacture such equipment on their own.
The assembly of the heat exchanger cost us EUR 53. On first view, it may seem that the return on such an investment is not high, but considering that the obtained heat was used to heat the garage, which did not have another direct source of heating, compared with the purchase price of another heating unit and the costs of its operation, the prospects for a return on this investment seem promising.
During the experiment’s implementation, the heat obtained in the heat exchanger through reducing the heat of flue gases in the chimney was used to heat the air in the family house’s garage. Although this was the only way to directly heat the garage, the temperature in the garage was around 12 °C all winter, which confirms the practical significance of this work.
5. Conclusions
The use of different possibilities for obtaining additional heat from the heating medium is nothing new. More than 200 years ago, tiled stoves had built-in elements with doors that were used to heat food or drinks. Modern stoves also use this method. Currently, heat pumps or condensing boilers are considered modern heating methods. Condensing boilers use a heated medium, and efficiency is increased through returning heat to the system.
Research results have shown that it is also possible to obtain heat via lowering the temperature of flue gases. The variable reduction in flue gas temperature was around 20 °C. The heat obtained in this way for 24 h would be an average of 400 kJ in winter months. For one switch-on of the boiler, this is an average of 4 kJ.
While four kJ of heat may seen modest, its versatility is remarkable. This amount of heat can be harvested for a multitude of purposes, including:
- Heating approximately 1 L of water to a temperature of approximately 80 °C;
- Quickly heating food or to finish cooking some dishes;
- Heating some space, such as bathroom or corridor;
- Powering small electrical devices—this amount of heat could be harvested and converted into electrical energy using thermoelectric generators to power small electrical devices such as LED lights or mobile phones;
- Heating air in a confined space: The amount of heat could be used to heat the air in a small, confined space, such as a clothes closet or tool cabinet, to prevent moisture and corrosion.
In the future, we aim to investigate the amount of additional heat obtained from data segments where the temperatures K1 and K2 are lower and correspond to the temperatures of modern high-efficiency gas condensing boilers.
Author Contributions
Conceptualization: B.S. and E.F.Š.; methodology: B.S.; software: B.S.; validation: G.B. and M.F.; formal analysis: B.S. and G.B.; investigation and resources: E.F.Š., G.B. and M.F.; data curation: M.F.; writing—original draft preparation: B.S. and E.F.Š.; writing—review and editing: B.S., E.F.Š. and G.B.; visualization: B.S.; supervision: M.F.; project administration and funding acquisition: B.S. and E.F.Š. All authors have read and agreed to the published version of the manuscript.
Funding
This work was supported by the Scientific Grant Agency of the Ministry of Education, Science, Research, and Sport of the Slovak Republic and the Slovak Academy Sciences as a part of the research project VEGA 1/0264/21: “Application of modern methods in the analysis and modeling of technological and other processes used in the acquisition and processing of earth resources in order to optimize them” and it was supported by the Cultural and Educational Grant Agency of the Ministry of Education, Science, Research and Sport of the Slovak Republic and the Slovak Academy of Sciences under the project No. 006TUKE-4-2024.
Data Availability Statement
Data is contained within the article.
Acknowledgments
The authors would like to thank the anonymous reviewers for their valuable comments that improved the quality of the manuscript.
Conflicts of Interest
Author Matúš Fecko was employed by the company Garrett Motion Slovakia s.r.o. However, all authors declare that the research was conducted in the absence of any commercial or financial relationships that could be construed as a potential conflict of interest.
References
- Sajjadian, S.M. A critique on the UK’s net zero strategy. Sustain. Energy Technol. Assess. 2023, 56, 103003. [Google Scholar] [CrossRef]
- Osman, A.I.; Fawzy, S.; Lichtfouse, E.; Rooney, D.W. Planting trees to combat global warming. Environ. Chem. Lett. 2023, 21, 3041–3044. [Google Scholar] [CrossRef]
- Tirelli, D.; Besana, D. Moving toward net zero carbon buildings to face global warming: A narrative review. Buildings 2023, 13, 684. [Google Scholar] [CrossRef]
- Ribeiro Hoffmann, A.; Sandrin, P.; Doukas, Y.E. Climate Change in Regional Perspective: European Union and Latin American Initiatives, Challenges, and Solutions, 1st ed.; Springer Nature: Cham, Swizerland, 2024. [Google Scholar]
- Cline, W.R. The impact of global warming of agriculture: Comment. Am. Econ. Rev. 1996, 86, 1309–1311. [Google Scholar]
- Mendelsohn, R.; Nordhaus, W.D.; Shaw, D. The impact of global warming on agriculture: A Ricardian Analysis. Am. Econ. Rev. 1994, 84, 753–771. [Google Scholar]
- Ždímalová, M. Tessellation. In Faces of Geometry. From Agnesi to Mirzakhani, 1st ed.; Magnaghi-Delfino, P., Mele, G., Norando, T., Eds.; Springer Nature: Cham, Swizerland, 2020; Volume 88, pp. 225–234. [Google Scholar]
- Miller, J.R.; Russell, G.L. The impact of global warming on river runoff. J. Geophys. Res. Atmos. 1992, 97, 2757–2764. [Google Scholar] [CrossRef]
- Feyen, L.; Dankers, R. Impact of global warming on streamflow drought in Europe. J. Geophys. Res. Atmos. 2009, 114, 1–17. [Google Scholar] [CrossRef]
- Wesselmann, M.; Apostolaki, E.T.; Anton, A. Species range shifts, biological invasions and ocean warming. Mar. Ecol. Prog. Ser. 2024, 728, 81–83. [Google Scholar] [CrossRef]
- Pawan, M. Impacts of global warming on environment. Int. Res. J. Environ. Sci. 2014, 3, 72–78. [Google Scholar]
- Bouchard, J.P.; Pretorius, T.B.; Kramers-Olen, A.L.; Padmanabhanunni, A.; Stiegler, N. Global warming and psychotraumatology of natural disasters: The case of the deadly rains and floods of April 2022 in South Africa. In Annales Médico-Psychologiques, Revue Psychiatrique; Elsevier Masson: Amsterdam, The Netherlands, 2023; Volume 181, pp. 234–239. [Google Scholar]
- Fotso-Nguemo, T.C.; Weber, T.; Diedhiou, A.; Chouto, S.; Vondou, D.A.; Rechid, D.; Jacob, D. Projected impact of increased global warming on heat stress and exposed population over Africa. Earth’s Future 2023, 11, e2022EF003268. [Google Scholar] [CrossRef]
- Keatinge, W.R.; Donaldson, G.C. The impact of global warming on health and mortality. South. Med. J. 2004, 97, 1093–1100. [Google Scholar] [CrossRef] [PubMed]
- Helbling, M.; Meierrieks, D. Global warming and urbanization. J. Popul. Econ. 2023, 36, 1187–1223. [Google Scholar] [CrossRef]
- Kotz, M.; Kuik, F.; Lis, E.; Nickel, C. The Impact of Global Warming on Inflation: Averages, Seasonality and Extremes. ECB Working Paper No. 2023/2821. May 2023. Available online: https://papers.ssrn.com/sol3/papers.cfm?abstract_id=4457821 (accessed on 9 June 2024).
- Oleskog Tryggvason, P.; Shehata, A. Success or failure? News framing of the COP26 Glasgow summit and its effects on citizens’ beliefs about climate change. Int. J. Press/Politics 2024, 29, 19401612231218426. [Google Scholar] [CrossRef]
- Ghymers, C. Fostering the dynamics of the Bi-regional Summit EU-CELAC for spurring the cooperation in climate change. In Climate Change in Regional Perspective: European Union and Latin American Initiatives, Challenges, and Solutions, 1st ed.; Ribeiro Hoffmann, A., Sandrin, P., Doukas, Y.E., Eds.; Springer Nature: Cham, Swizerland, 2024; Volume 149, pp. 59–80. [Google Scholar]
- Arora, P.; Arora, N.K. COP27: A summit of more misses than hits. Environ. Sustain. 2023, 6, 99–105. [Google Scholar] [CrossRef]
- Süleyman, D.A.L. Africa Climate Summit 2023: Climate change and the social dimension. Africania 2023, 4, 41–61. [Google Scholar]
- Zhang, T.; Sun, X.; Li, X.; Liu, H.; Hong, J. Drivers of spatiotemporal variations in traditional heating under carbon neutrality commitment: Evidence from China at city-level. J. Clean. Prod. 2023, 406, 137142. [Google Scholar] [CrossRef]
- Mandal, S.; Kumar, A.; Singh, R.K.; Ngachan, S.V.; Kundu, K. Drying, burning and emission characteristics of beehive charcoal briquettes: An alternative household fuel of Eastern Himalayan Region. J. Environ. Biol. 2014, 35, 543–548. [Google Scholar] [PubMed]
- Zhang, Z.; Zhou, Y.; Zhao, N.; Li, H.; Tohniyaz, B.; Mperejekumana, P.; Hong, Q.; Wu, R.; Li, G.; Sultan, M.; et al. Clean heating during winter season in Northern China: A review. Renew. Sustain. Energy Rev. 2021, 149, 111339. [Google Scholar] [CrossRef]
- Xue, W.; Wang, L.; Yang, Z.; Xiong, Z.; Li, X.; Xu, Q.; Cai, Z. Can clean heating effectively alleviate air pollution: An empirical study based on the plan for cleaner winter heating in northern China. Appl. Energy 2023, 351, 121923. [Google Scholar] [CrossRef]
- Minoofar, A.; Gholami, A.; Eslami, S.; Hajizadeh, A.; Gholami, A.; Zandi, M.; Ameri, M.; Kazem, H.A. Renewable energy system opportunities: A sustainable solution toward cleaner production and reducing carbon footprint of large-scale dairy farms. Energy Convers. Manag. 2023, 293, 117554. [Google Scholar] [CrossRef]
- Huang, L.; Zheng, R.; Piontek, U. Installation and operation of a solar cooling and heating system incorporated with air-source heat pumps. Energies 2019, 12, 996. [Google Scholar] [CrossRef]
- Lee, H.; Ozaki, A.; Choi, Y.; Iqbal, M. Performance improvement plan of air circulation-type solar heat-storage system using ventilated cavity of roof. Energies 2021, 14, 1606. [Google Scholar] [CrossRef]
- Ibañez-Puy, M.; Vidaurre-Arbizu, M.; Sacristán-Fernández, J.A.; Martín-Gómez, C. Opaque Ventilated Façades: Thermal and energy performance review. Renew. Sustain. Energy Rev. 2017, 79, 180–191. [Google Scholar] [CrossRef]
- Szyszka, J.; Bevilacqua, P.; Bruno, R. An innovative trombe wall for winter use: The thermo-diode trombe wall. Energies 2020, 13, 2188. [Google Scholar] [CrossRef]
- Ciampi, M.; Leccese, F.; Tuoni, G. Ventilated facades energy performance in summer cooling of buildings. Sol. Energy 2003, 75, 491–502. [Google Scholar] [CrossRef]
- Barbosa, S.; Ip, K. Perspectives of double skin façades for naturally ventilated buildings: A review. Renew. Sustain. Energy Rev. 2014, 40, 1019–1029. [Google Scholar] [CrossRef]
- Peñalvo-López, E.; Cárcel-Carrasco, J.; Alfonso-Solar, D.; Valencia-Salazar, I.; Hurtado-Pérez, E. Study of the improvement on energy efficiency for a building in the mediterrane an area by the installation of a green roof system. Energies 2020, 13, 1246. [Google Scholar] [CrossRef]
- Pineau, D.; Rivière, P.; Stabat, P.; Hoang, P.; Archambault, V. Performance analysis of heating systems for low energy houses. Energy Build. 2013, 65, 45–54. [Google Scholar] [CrossRef]
- Marchio, D.; Rabl, A. Energy-efficient gas-heated housing in France: Predicted and observed performance. Energy Build. 1991, 17, 131–139. [Google Scholar] [CrossRef]
- Gilijamse, W.; Boonstra, M.E. Energy efficiency in new houses. Heat demand reduction versus cogeneration? Energy Build. 1995, 23, 49–62. [Google Scholar] [CrossRef][Green Version]
- Fisher, R.A. The Design of Experiments, 2nd ed.; Oliver and Boyd: Edinburgh, UK, 1966. [Google Scholar]
- Fisher, R.A. Statistical Methods for Research Workers, 6th ed.; Oliver and Boyd: Edinburgh, UK, 1936. [Google Scholar]
- Core Team, R.R. R: A Language and Environment for Statistical Computing; R Foundation for Statistical Computing: Vienna, Austria, 2013. [Google Scholar]
- Gogoi, T.K.; Dixit, U.S. Basics and applications of thermal engineering. In Introduction to Mechanical Engineering, 1st ed.; Davin, J.P., Ed.; Springer Nature: Cham, Switzerland, 2018; Volume 24, pp. 137–178. [Google Scholar]
- Davis, A. Thermal Engineering: Concepts and Applications, 1st ed.; Murphy & Moore Pub: New York, NY, USA, 2022. [Google Scholar]
- Baukal, C.E., Jr. Heat Transfer in Industrial Combustion; CRC Press: Boca Raton, FL, USA, 2000. [Google Scholar]
- Sarode, R.P.; Vinchurkar, S.M. An approach to recovering heat from the compressed air system based on waste heat recovery: A review. Energy Sources Part Recovery Util. Environ. Effects 2023, 45, 9465–9484. [Google Scholar] [CrossRef]
- Zhao, X.; Fu, L.; Yuan, W.; Li, F.; Li, Q. The Potential and Approach of Flue Gas Waste Heat Utilization of Natural Gas for Space Heating. Procedia Eng. 2016, 146, 494–503. [Google Scholar] [CrossRef]
- Nyakuma, B.B.; Mahyon, N.I.; Chiong, M.S.; Rajoo, S.; Pesiridis, A.; Wong, S.L.; Martinez-Botas, R. Recovery and utilisation of waste heat from flue/exhaust gases: A bibliometric analysis (2010–2022). Environ. Sci. Pollut. Res. 2023, 30, 90522–90546. [Google Scholar] [CrossRef] [PubMed]
- Zohuri, B. Compact Heat Exchangers, 1st ed.; Springer Nature: Cham, Switzerland, 2017. [Google Scholar]
Disclaimer/Publisher’s Note: The statements, opinions and data contained in all publications are solely those of the individual author(s) and contributor(s) and not of MDPI and/or the editor(s). MDPI and/or the editor(s) disclaim responsibility for any injury to people or property resulting from any ideas, methods, instructions or products referred to in the content. |
© 2024 by the authors. Licensee MDPI, Basel, Switzerland. This article is an open access article distributed under the terms and conditions of the Creative Commons Attribution (CC BY) license (https://creativecommons.org/licenses/by/4.0/).

