Abstract
The purpose of this study is to analyze how global research cooperation patterns in the secondary battery industry have changed over recent years and to identify the evolution in the focus of research. To this end, network analysis was performed using the nationality information of the authors of a 10-year multinational joint research paper related to lithium-ion batteries. Furthermore, keyword analysis and topic modeling were performed using the abstract data from the study. The results of this study confirm that some countries that are not well-known in the field, such as Australia, Spain, and France, showed high centrality, compared with the level of cooperation scale. Additionally, six research topics were identified. According to a comparison over the first half of the decade, no difference was observed in the appearance of keywords indicating high energy density and conductivity with lithium, a key mineral. Keyword distribution was high for topics like battery charging and discharging in the first half of the decade, and for next-generation battery materials, such as solid electrolytes, lithium metal anodes, and lithium–sulfur batteries in the second. These results provide insights into the establishment of research and development (R&D) cooperation strategies by countries and pre-planning by companies in the battery industry.
1. Introduction
Following the Paris Climate Agreement, countries worldwide have recently declared global carbon neutrality, with a target point of 2050. The United States (US), China, Japan, and Korea have joined the policy stance of strengthening Europe’s carbon dioxide emission regulations, and changes in all existing industries are required to achieve the set regulatory goals step by step. In the automobile industry, a representative manufacturing industry, the movement to reduce carbon emissions continues by replacing vehicles using the traditional internal combustion engine, that is, diesel or gasoline engines, with eco-friendly vehicles, such as plug-in hybrid vehicles, hybrid vehicles, battery electric vehicles, and hydrogen fuel cell vehicles. In particular, there is a growing interest in pure electric vehicles, whose carbon emissions are the lowest when compared to hybrid vehicles that combine electric motors and internal combustion engines, and electric vehicles that only use electric batteries.
The secondary battery industry, represented by lithium-ion batteries, was initially dominated by the IT device power market, primarily laptops and mobile phones. However, demand increased dramatically as soon as the electric vehicle market opened. According to the SNE Research Market Report, a leading global research organization specializing in the electric vehicle industry, the battery market has grown from $46 billion in 2020 to $106.7 billion in 2022, and is expected to grow to approximately 350 billion dollars by 2030. Additionally, all global market forecasting organizations predict that the market will grow in the future owing to the continuous spread of electric vehicle supply.
As the demand for secondary batteries increases, owing to the electric vehicle market, competition in countries is intensifying to increase the size of the battery market and number of market participants, and strengthen cooperation in developing next-generation secondary battery technology. Moreover, numerous countries, led by Korea, China, and Japan, the three East Asian countries, are participating in battery development competition, translating into an increase in the entry of new companies into the lithium-ion battery market. Manufacturers of internal combustion engines and electric vehicles have also attempted to internalize battery technology. The three aforementioned countries have dominated the market and technology in terms of the materials and manufacturing of batteries for a long time. Therefore, most existing research related to the battery industry is mainly focused on comparing their battery technology evolution, development history, and market success factors, or their battery industry structure and technology. Few studies have analyzed the secondary battery industry from the perspective of research and cooperation within countries, apart from the three East Asian countries that hold hegemony in the secondary battery field. Some studies have analyzed the issues of the secondary battery industry over a short period of time, but none have analyzed it over a long period, specifically, from when the market opens up until it reaches full-fledged growth.
Therefore, the purpose of this study is as follows. First, it analyzes how the global research cooperation pattern between countries in the rapidly growing secondary battery industry for electric vehicles has evolved, or changed over time. Second, it identifies countries that take the initiative for cooperation in global research related to secondary batteries for electric vehicles, and further analyzes the level or degree of research cooperation among major countries. And third, it identifies, by period, which topics were the center of joint cooperation research content since the secondary battery industry was created.
2. Literature Review
2.1. Concept and Development History of Secondary Batteries
A secondary battery converts electrical energy into chemical energy, stores it, and converts it back to electrical energy when necessary. Chemicals, such as lead, nickel, and cadmium, are used to fabricate the cathode and anode, and electricity is generated by controlling the movement of ions and electrons between the two electrodes through an electrolyte. The secondary battery can be charged by receiving electricity from an external power source. When charged, it can operate the necessary electronic devices by supplying electric power. This charging and discharging process can be repeated, and the reusability characteristics of the secondary battery differ from those of the primary battery. The advantages of secondary batteries are that, compared with primary batteries, they are relatively smaller and lighter, with high energy densities and relatively low energy losses during the charging and discharging processes. Thus, they demonstrate not only stable performance for an extended time, but also environmentally friendly factors owing to the possibility of reuse. Secondary batteries are used in various fields because of their portability, charging convenience, and environment-friendliness. Typical applications include mobile electronic devices, such as smartphones and laptops, solar cell systems, and energy storage devices, which were mainly used as electric vehicle power sources in the 2010s.
Currently, the most commonly used secondary battery is the lithium-ion battery, which has been adopted as an electric vehicle battery owing to its unique characteristics. Lithium is the lightest metal atom, with element number 3, and the easiest atom to work with when emitting electrons from the outside. This means that it is suitable as raw material for batteries requiring high energy density; further, because of its light weight, it can reduce the size and weight of vehicles. The structure of lithium-ion batteries includes the cathode, anode, electrolyte, and separator. Lithium is used as the main material for the cathode, and graphite for the anode. As an operating principle, electrons separated from lithium are charged as they move from the cathode to the anode through the electrolyte; conversely, when voltage is applied, they move from the anode to the cathode through the electrolyte to discharge.
The history of the development of lithium-ion batteries has gradually accumulated the contributions and research results of several researchers. In the early 1970s, M. Stanley Whittingham, a British-born American chemist, developed the first lithium-ion technology. He was the first to create early models of rechargeable lithium-ion batteries using certain types of lithium, lithium sulfide (LiS6) and titanium disulfide (TiS2). Later, in the 1980s, American chemist John B. Goodenough developed a cathode material using cobalt oxide (CoO2), leading to his success in increasing the battery output from only 2 V to 4 V, and highly improving the energy density of lithium-ion batteries. His research later played a major role in the commercialization of lithium-ion batteries, which offered high energy density and relatively stable performance. Upon learning of John B. Goodenough’s development, Japanese chemist Akira Yoshino recognized the problem of explosion risk in metallic lithium batteries, used as anode materials, and applied a carbon material capable of intercalating lithium ions, instead of the highly reactive lithium metal, into the anode of lithium-ion batteries. This was successfully commercialized in 1985. The contributions of the above three researchers enabled the development of lithium-ion battery technology, and its use in various applications. In recognition of their contributions to research and development, the researchers were awarded the Nobel Prize for Chemistry in 2019.
2.2. Advances in the Global Battery Industry
Lithium-ion batteries were first mass-produced by Japan’s Sony in 1991, following the early development success of researchers in the 1980s. Sony introduced lithium-ion battery technology to the world for the first time, applying it to the Sony Disk Man, a compact disc portable player. After that, lithium-ion batteries were mainly used in mobile phones, laptops, and other mobile devices until the mid-2000s.
Since Sony developed the first one, lithium-ion batteries have made steady technological progress in relation to other battery materials, all of which have been developed by Japanese companies. Generally, the four components or core materials of a battery are the cathode, anode, separator, and electrolyte. Regarding the anode, in 1994, Sanyo, Japan, replaced hard carbon with artificial graphite to improve the energy density of lithium-ion batteries. Artificial graphite demonstrated about twice the existing carbon capacity, but could not be used by Sony because of its reactivity with the electrolyte. In terms of electrolytes, in the same year in 1994, Sanyo replaced a propylene carbonate organic solvent-based electrolyte with an ethylene carbonate-based organic solvent electrolyte to prevent some molecules of the electrolyte solvent from falling off and blocking the anode. This phenomenon wherein some solvent molecules of the electrolyte fall off and block the anode inlet is called co-intercalation, and rapidly reduces battery capacity. In 1997, Sanyo introduced inexpensive natural graphite rather than the previously developed artificial graphite to secure battery cost competitiveness, and until now, both of these are the most widely used representative active materials constituting the anode of a lithium-ion battery. Regarding the cathode, technological advances have occurred relatively recently. In 2003, Japan’s Sony and Panasonic developed nickel cobalt aluminum (NCA) and nickel cobalt manganese (NCM) as high-capacity cathode active materials to overcome the limitations of the battery capacity of lithium cobalt oxide (LCO) cathodes. Through this development, lithium-ion batteries with sufficient energy capacity could be expanded to the electric vehicle market. The nickel cobalt manganese (NCM), along with lithium iron phosphate (LFP), is the most widely used cathode active material to date. A dry separation membrane was applied to a lithium-ion battery developed by Sony for the first time; however, as the thickness of the separation membrane decreased, holes were generated in the membrane and short circuits occurred. In 1994, Asahi kasei and Toray developed a wet separation membrane that maintained a thin layer and did not cause short circuits. Through this development, the thickness of the separator was reduced from dry 20 μm to wet 10 μm, and it was possible to fill the active material more with a reduced volume, leading to an increase in battery capacity. The next most important material after the four core materials of the battery is the anode current collector, using thin copper, which also helps secure the price competitiveness of lithium-ion batteries by converting copper foil into electrolytic copper foil through rolling, a new manufacturing method introduced in Toshiba, Japan, in 1997.
After the initial development by Sony in 1991, and technological innovations in battery materials from the mid-1990s to 2003, electric vehicles, a representative application of the lithium-ion battery (LIB), emerged in the late 2000s. In the modern sense, the first commercial electric vehicle was launched by Tesla in 2008. Tesla Roadster, the first electric vehicle, based on the sports car concept, has played a major role in raising consumer interest in electric vehicles. In June 2012, Tesla launched Model S, a large-scale, mass-produced electric vehicle model. It was selected as the world’s best-selling electric vehicle consecutively in 2015 and 2016, succeeding in establishing Tesla as a leader in the electric vehicle market [1]. Thereafter, Tesla’s electric vehicle market opened in full swing, and the electric vehicle battery market began to grow.
2.3. Definition of Research Cooperation and the Target of Cooperation
Several studies have examined research cooperation. Powell et al. [2] stated that companies become much more proficient in cooperation with various partners over time and create their own reputations, and that research cooperation is a way to secure insufficient research resources from the outside. Additionally, if the sources of knowledge are dispersed and the path of technological development is not determined, a learning network can emerge. Cooperation is a path of knowledge diffusion, and one of the implications of a corporate cooperation network is that the optimal structure of the network between companies depends on the goals of the network members [3]. Katz and Martin [4] argued that research cooperation is very difficult to define because the concept is customary among scientists, and there is little agreement on where informal cooperation begins and ends. Some regard research cooperation as a loose grouping or an informal set of connections. Therefore, cooperation varies depending on the institution, field, sector, and country, and changes over time [4]. By using panel data at the level of large Japanese companies to analyze the impact of supply chain network structure on productivity and innovation capabilities through knowledge diffusion, Todo et al. [5] emphasized the importance of knowledge diffusion with various partners through cooperative networks
Several studies have summarized the types of research cooperation targets or partners. Miotti and Sachwald [6] asserted that companies or countries use research cooperation to secure knowledge and build a global research and development (R&D) network, and that R&D cooperation can be conducted with suppliers, customers, competitors, academic institutions, and foreign companies. Fritsch [7] defined research partners as including customers, manufacturing suppliers, business service providers, publicly funded research institutes, universities, and other institutions with horizontal relationships. Belderbos et al. [8] classified research and development (R&D) partner types into competitors, suppliers, customers, universities, and research institutes to analyze the impact of research cooperation on corporate performance. In addition, Tether [9] divided cooperative partners into external partners, suppliers, customers or clients, competitors, universities, consultants, private research institutes, government research institutes, research associations, and technology organizations, whereas Lhuillery and Pfister [10] classified them horizontally as competitors, public research institutes or unions, and international partners.
2.4. Reasoning and Effectiveness of Research Cooperation
Many factors explain why countries and businesses engage in joint or cooperative research, rather than individual research. Countries frequently seek complementary resources and expertise from international research partners because they have unequal opportunities to access the global scientific market [11]. Although participation in research cooperation is increasing worldwide, most international cooperation is asymmetric, and research systems are organized around a few dominant countries. Georghiou [12] implied that the motivation for global research cooperation can be categorized by its benefits: direct benefits for research and indirect strategic, economic, or political benefits. Georghiou also suggested that international research cooperation is likely to be recognized as a means of strengthening a country’s scientific base status, as long as it is a competitive unit. Furthermore, collaborative research can be interpreted as the influence and derivation of greater knowledge values, ensuring knowledge with potentially higher value as it reflects a greater level of consensus than individual research by isolated researchers [13]. Hottenrott and Lopes-Bento [14] stated that research and development (R&D) collaboration promotes not only risk- and cost-sharing, but also the combination of complementary skills learned from partners. The relationship between collaboration strength and innovation was analyzed for 2735 German manufacturing and service industries, and it was confirmed that the higher the proportion of collaborative projects among all research and development (R&D) projects, the higher the probability of product innovation and the higher the market success rate of new products. In addition, there are examples of idea sharing, equipment cooperation, support sharing, and data exchange as motives for research cooperation. Some studies suggest that relationships that emerge through geographically distant research cooperation can promote the creation of new knowledge [15].
Several papers have also studied the strategies and effects from the perspective of R&D partnerships, which differ slightly from research cooperation. Hagedoorn [16] stated that R&D partnerships are dominated by the world’s most economically advanced companies and countries and that strategic flexibility can be increased through short-term joint R&D projects with various partners. Corsi et al. [17] stated that the funding method plays an important role in determining the establishment and survival of research and development (R&D) partnerships. In addition, if one wants to maintain an R&D partnership, they need to be efficient and selective in their partnership choices rather than take advantage of all the partnership opportunities as soon as they emerge. Specific strategic network positioning and efficient partnership choices are more important than the general experience of a company or country [18]. Busom and Fernández-Ribas [19] conducted an empirical study on the impact of R&D subsidies on R&D cooperation strategies and found that public R&D programs induce changes in R&D partnership behavior, easing barriers to cooperation.
2.5. Analysis of the Paper Co-Author Network
Co-author information is an important indicator of scientific cooperation. The co-author network consists of several subcommunities, and the researcher can secure visibility by connecting these isolated subgroups [20]. Generally, the knowledge structure of a specific academic field produces knowledge that appears in the form of a network wherein academic research subjects are interconnected. Among the analyses used to understand the current status of joint research among researchers, the most representative method is the analysis of joint research networks using the co-author information of the paper. Additionally, co-author analysis can be used as an important tool to identify obscure universities or research institutes for the first time [21].
Peters and Van Raan [21] applied co-author analysis to a number of publications in the field of chemical engineering to create a cluster of collaborating researchers, consisting mainly of a group of collaborating authors around the head of the department, the professor. Additionally, the co-author cluster was found to be significant in the identification of the research group, the relationship within the group, and changes in the relationship between the groups over time. Moody [22] analyzed all English academic papers listed in “Sociological Abstract”, published from 1963 to 1999, to investigate network relationships, and found that participation in cooperative networks was dependent on research expertise, and co-authors were more likely to write about quantitative, rather than qualitative, research. Barabâsi et al. [23] studied all related journals in the field of mathematics and neuroscience based on a database of papers published over a period of eight years, from 1991 to 1998. The scientists’ network of co-authors represents a prototype of a complexly evolving network and is known to be useful for research that systematically analyzes changing structures. To investigate the structure of the scientific cooperation network, Newman [24] considered studies co-written by two scientists. To analyze the connection network, MEDLINE in the biomedical field, the Los Alamos e-Print Archive in physics, and the NCSTRL data DB in computer science, were used. This study presents the average and the distribution of the number of collaborative authors, proving the existence of network clustering and highlighting several clear differences in cooperation patterns in the research field.
Yan et al. [25] identified the co-author network cooperation pattern and network structure in the field of Library and Information Science (LIS) in China and constructed a co-author network, using data obtained from 18 major Library and Information Science (LIS) academic journals over six years. The network was analyzed from macroscopic and microscopic perspectives, centrality and citation rankings were checked, and a correlation analysis between the number of citations and the centrality value was performed. In addition, Liu et al. [26] investigated the network of co-authors in the Digital Library (DL) research community and presented the “Author Rank”, an indicator of the author’s reputation in the network, which, according to the co-authors of the paper, demonstrated much stronger social ties than citations.
This study analyzes the research cooperation patterns and characteristics of the global secondary battery industry, using the nationality and abstract information of authors within the thesis data published over the last 10 years. Existing research on paper co-authors through network analysis studies research cooperation primarily in single or minority academic domains, such as chemical engineering, mathematics, and political science. This study was extended to research that included a multidisciplinary field called the secondary battery field as the scope of research analysis and to analyze the topics and keywords of collaborative research.
3. Materials and Methods
3.1. Data Collection and Preprocessing
The data used in this study were collected from SCOPUS, the Elsevier Publishing paper database. Most paper quantitative analyses use Web of Science and SCOPUS as information sources [27]. SCOPUS provides approximately 20% more journal coverage than Web of Science and is the world’s largest research paper information database [28]. As the secondary battery industry includes various academic fields, such as engineering and science, SCOPUS was selected to cover a wide range of papers. Google Scholar, which is widely used along with the two paper DBs, was excluded from the collection candidate DB [29] because it provides inconsistent search results.
When collecting the thesis data, search conditions were set, including various filtering processes, to meet the purpose of this study. Documents containing “Secondary Battery”, “Lithium Battery” or “Rechargeable Battery” in the title were searched first. “Rechargeable Battery” was used as a search term in addition to “Secondary Battery” and “Lithium Battery” because it is often used in reference to secondary batteries in research papers. However, “Fuel cell” and “Fuel-cells” were set as items that were not to be included in the title, for the purpose of excluding data related to a hydrogen fuel secondary battery installed in a hydrogen vehicle. The collection period for the thesis data was set to 10 years, from 2013 to 2022. The reason for setting this time period is that Tesla’s Model S, the first model of an electric vehicle, was launched in mid-2012, and its full-scale sales began in 2013; it can be assumed that the electric vehicle industry began that year. Given the previous studies that conducted network analysis of co-authors’ papers, most of the studies conducted research based on data for between five and ten years, and it was judged that the 10-year collection setting period was sufficient. Additionally, the language of the literature was limited to English for the analysis of consistent keyword data, and the document type was limited to subject areas belonging to the technical domain, such as material science, chemistry, chemical engineering, and energy engineering, to examine cooperative research from an R&D perspective. The search query, used as an Advanced Search on the SCOPUS DB, and reflecting all the above conditions, is the same as the search equation in Figure 1.
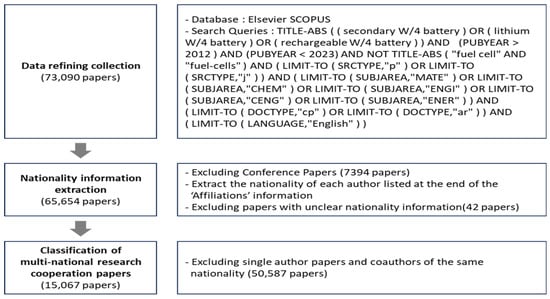
Figure 1.
Data collection and preprocessing process.
To define the author’s nationality for each paper collected for the first time, nationality information was extracted separately from the author’s information. Authors’ nationality information was defined as the nationality of the affiliated research institution described in the affiliation field column among the data downloaded as a CSV file from the SCOPUS DB. Among the 73,090 papers collected, based on the designed search formula, conference papers were filtered first. Among them, 42 papers that recorded unclear nationality information in the affiliation information field were excluded. Under these conditions, it was first refined to 65,654 papers; 50,587 additional single-author papers and research papers involving cooperation between authors of the same nationality were excluded. The research dataset was confirmed using data from 15,067 papers.
3.2. Analytical Methods
Network analysis is necessary to clarify the community structure and explain these relationships. It is used in various fields, and enables the analysis of the influence of detailed networks in a community within an organization [30]. In this study, network centrality analysis was performed to structure a global research cooperation community and identify key countries and changes by period.
Network centrality can be interpreted quantitatively as a numerical value, and a high centrality can be interpreted as a key research country because it is located at the center of the community and is closely related to many countries. Gephi 0.10.1 version software was used to visualize and analyze the centrality of research cooperation networks between countries. This software is effective in network visualization and is an open-source tool used in many studies. It is meaningless to set the direction of the link in the network analysis connecting low-national nodes in multinational research cooperation papers, rather than looking at the citation relationship between papers. However, in this study, the Gephi program was executed by setting a directional link for the visibility of the network visualization results. In addition, schematizing all 126 countries on a single graph can cause confusion in interpretation; therefore, the node visibility level was adjusted to 20% by adjusting the degree range setting value in the Gephi program. The size of the node set as the text type was proportional to the frequency of cooperative studies, and the division of the research cooperation community, based on modularity, was expressed in different colors.
Changes in research topics, by period and time, were also compared and analyzed, in addition to identifying countries that are central to research cooperation, to precisely analyze research cooperation patterns. The entire analysis period of 10 years was divided into five years, each in the first and second halves, and a topic modeling analysis was conducted. The year 2018 is also a very important year for the electric vehicle industry. The release of the IPCC report by the UN Framework Convention on Climate Change, which restricts global temperatures from exceeding 1.5 degrees Celsius, led to the launch and mass production of Tesla’s Model 3 vehicles, an inflection point that rapidly increased product diversity in the electric vehicle market.
Topic modeling has been used to identify the most important topics in a variety of text corpora, including books, newspapers, and electronic documents, by identifying repeated patterns of words and grouping these word patterns into topics that reflect document content. Within the field of general data science, topic modeling is an example of stochastic modeling, with the simplest and most widely used model being Latent Dirichlet Allocation (LDA) [31]. LDA is a powerful method to study hidden meanings in larger parts of given textual data and is useful for grouping text related to the subject [32]. One of the main objectives of this study was to analyze topic changes due to research cooperation, not just keyword frequency-based abstract data text analysis; therefore, topic modeling latent Dirichlet allocation (LDA) techniques were used to identify topics.
Topic modeling latent Dirichlet allocation (LDA) was performed based on coding, using Python 3.1 Version and open-source libraries related to text mining. Using NLTK, spaCy, and gensim, representative libraries for natural language processing, preprocessing of abstract text data, such as token generation, morpheme analysis, and part-of-mouth attachment, was performed, and words with very low or high document frequency were filtered. Subsequently, perplexity and coherence indicators were obtained to set the appropriate number of topics. To confirm the appropriate number of topic distributions, similarity between topics, and keyword composition for each topic, the pyLDAvis package was visualized. PyLDAvis is a package that can be expressed in two-dimensional form by applying principal component analysis to a probability vector, wherein the keyword appears for a specific topic.
To estimate the number of optimized topics prior to full-scale topic modeling analysis, an appropriate topic value was set by comprehensively comparing the coherence and perplexity values; thereafter, latent Dirichlet allocation (LDA) was conducted. Coherence is a grounding indicator that determines the consistency of a topic, and it is interpreted that the higher the value, the higher the semantic consistency. In addition, perplexity is an index that determines each selected topic number to find the section with the lowest value and ascertain the number of optimized topics, in turn, helping to establish the accuracy of the probability model’s results. In contrast to the coherence value, the lower the perplexity value, the higher the accuracy. However, it should be noted that a low perplexity value does not necessarily mean that the result is easy to interpret. This was executed by setting the parameter value range for the appropriate number of topics k from 2 to 14.
Figure 2 shows a visualization of the results setting parameter values from 2 to 14 topics in the model over the entire period. In the 10-year model over the entire period, the coherence value was the highest when there were two to five topics, but in terms of performance, the value was somewhat higher when there were two to five topics; therefore, the appropriate number of topics was finally set to six by comprehensively considering these two points.
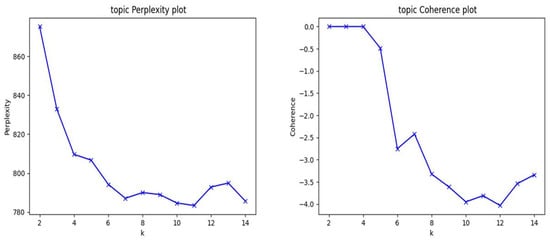
Figure 2.
Selection of the optimal number of topics for the entire period (10 years).
In order to determine the appropriate number of topics in the first half of the five years, the parameter value range of k was set from 2 to 14, similar to the identification of the appropriate number of topics in the entire period. Figure 3 shows a visualization of the result when the value of the number of topics from 2 to 14 is set in the first-half model. In the first half of the five-year model, the coherence value was highest for 2–6 topics, but in terms of perplexity, the value was low for 5–6 topics. Therefore, the appropriate number of topics was comprehensively considered, and the final number of topics was set at 6.
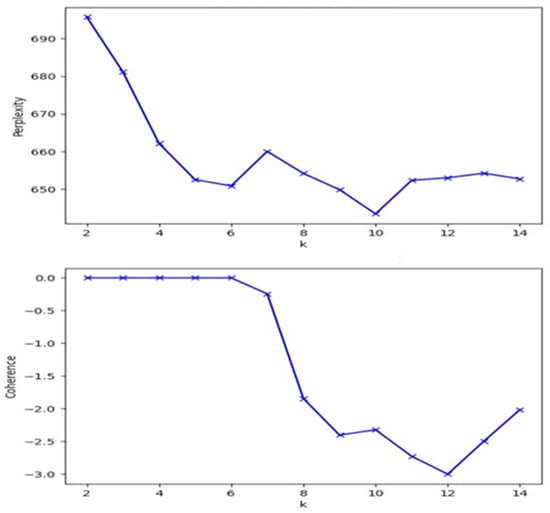
Figure 3.
Selection of the optimal number of topics for the first half (5 years).
In order to determine the appropriate number of topics in the second half of the year, the parameter value range of k was set from 2 to 14, similar to identifying the appropriate number of topics in the entire period and the first half. Figure 4 shows a visualization of the results when values from 2 to 14 topics were set in the second half of the model. In the second half of the five-year model, the coherence value was highest for two to five topics, but in terms of performance, the value was low for five or more topics; therefore, the appropriate number of topics was finally set to five.
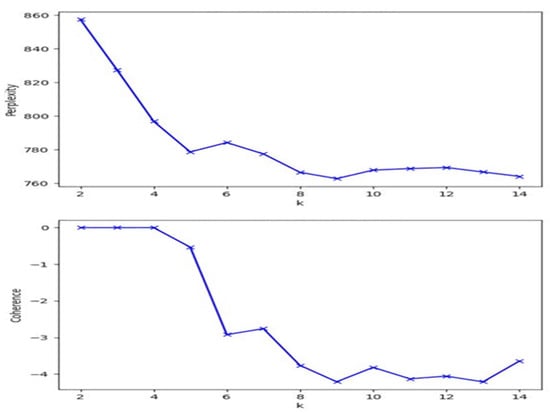
Figure 4.
Selection of the optimal number of topics in the second half of the year (5 years).
4. Results
4.1. Basic Properties and Centrality Analysis Results of Research Cooperation Network
In the network centrality analysis, the three aspects of prestige, proximity, and mediation centrality were analyzed, and the results are shown in Table 1 and Table A1. The United Kingdom (UK), Germany, India, and Korea, including China and the US, ranked at the top in all three aspects. However, Japan, the originator of secondary battery research and the market leader so far, showed a relatively low level of cooperation research, that is, 9th in prestige centrality, 11th in proximity centrality, and 14th in mediation centrality. Additionally, countries such as Australia, Spain, and France, which are not well-known in the field of secondary batteries, showed high results in the centrality analysis. In Australia, the results seem to be partly due to the very high number of cooperative research parameters of two, three, and four or more countries. However, it was confirmed that European countries, such as Spain, France, and Italy, are highly influential in global research cooperation compared to scale, despite the small number of multinational joint research paper parameters. Further, Brazil was not included in the top 20 countries for prestige and closeness centrality, but ranked 9th in mediation centrality, which seems to have played a major role in establishing cooperative research networks with other countries.

Table 1.
Network centrality analysis results for the entire period (Top 10).
According to the network visualization analysis results in Figure 5, the major cooperative research communities in the secondary battery field include Asian countries based on China, Korea, and Australia, as well as research communities in the United States (US) and the United Kingdom (UK), and other European research groups representing Germany, Spain, and Russia.
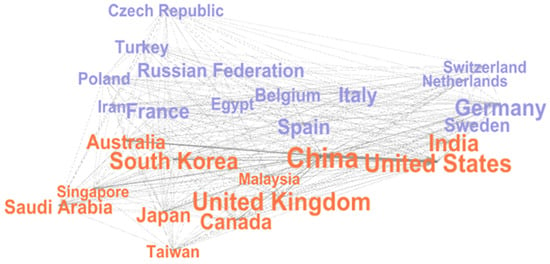
Figure 5.
Visualization of the research cooperation network for co-authors during the entire period.
4.1.1. Two-Country Research Cooperation Patterns
As shown in Figure 6, 82% (12,415) of all research cooperation papers examined the cooperation between two countries. Figure 7 shows the results of the network analysis, confirming the pattern of research cooperation between the two countries with the highest research cooperation. The larger the size of the node text, the greater a country’s research cooperation. The thickness of the edge represents the number of times countries cooperate on research.
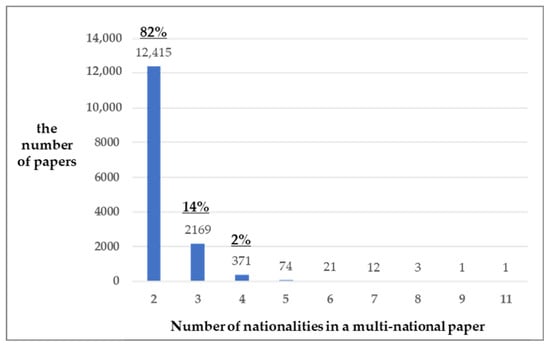
Figure 6.
Number of papers by nationality among multinational cooperation papers.
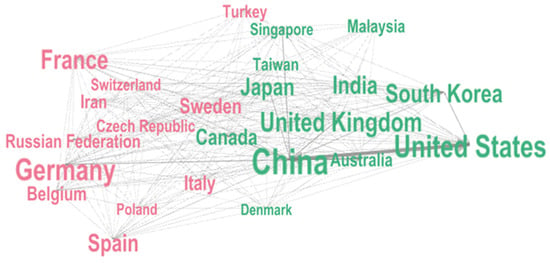
Figure 7.
Visualization of network for authors in two countries.
The maximum research cooperation between two countries over the past 10 years was observed between the United States (US) and China, accounting for 2697 cases, or 22% of the total two-country cooperation studies. The second-highest research cooperation relationship was between Australia and China, with 1024 cooperation cases, accounting for 8% of the total two-country cooperation studies. The third-highest research cooperation relationship was between Hong Kong and China, with 639 cooperation cases, accounting for 5% of the total two-country cooperation studies. In addition, the joint research cases between two countries were divided into the top ten rankings, as shown in Table 2.

Table 2.
Ranking of joint research between two countries during the entire period.
4.1.2. Three-Country Research Cooperation Patterns
As shown in Figure 6, among the total research cooperation papers, 14% (2, 169 cases) were studied for cooperation with the three countries. The results of network analysis to confirm the pattern of research cooperation for three countries are shown in Figure 8. Similar to the analysis of the two-nation cooperation network, the larger the size of the node text, the greater the research of a country. The thickness of the edge represents the number of research cooperation cases among three countries.
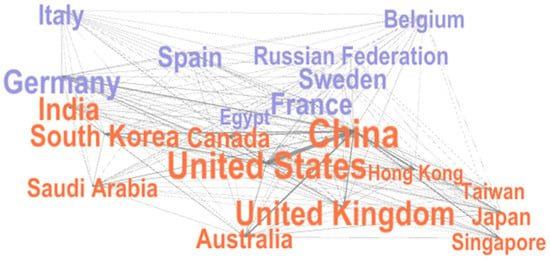
Figure 8.
Visualization of the network for authors in three countries.
The most research cooperation over the past 10 years was observed among the United States (US), Canada, and China, with 82 cases, accounting for 4% of the total of the three countries’ cooperation studies. The second-highest research cooperation relationship was between the US, China, and Hong Kong, with 80 cooperation cases, accounting for 4% of the cooperation studies of three countries. The third-highest research cooperation relationships were between Australia, China, and the US, with a total of 71 cooperation cases, accounting for 3% of the cooperation studies. The cases of joint research between the other countries were divided into the top 10 ranks, as shown in Table 3.

Table 3.
Ranking of joint research between three countries during the entire period.
4.1.3. Research Cooperation Patterns in More Than Four Countries
As shown in Figure 6, among all the research cooperation papers, 483 cases were studied on cooperation among more than four countries (4%). Figure 9 shows the results of the network analysis, confirming the research cooperation patterns of more than four countries. Similar to the analysis of the two and three country cooperation networks, the larger the size of the node text, the greater the research cooperation of a country, and the thickness of the edge represents the number of research cooperation cases between countries.
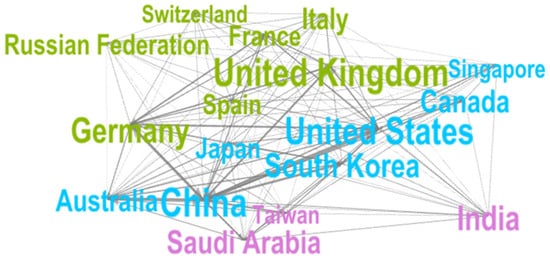
Figure 9.
Visualization of networks for authors in more than four countries.
Australia, China, Japan, and Korea have shown the maximum research cooperation among the four-country relationships over the past 10 years, accounting for 11 cases, which is 3% of the total number of four-country cooperation studies. China, the Czech Republic, Germany, and Poland showed the second-highest research cooperation, with a total of seven cooperation cases, accounting for 2% of the cooperation studies. Australia, China, Germany, and the Netherlands showed the third-highest research cooperation, with a total of five cooperation cases, accounting for 1% of the cooperation studies.
Further, the highest level of research cooperation among five countries is demonstrated by Indonesia, Nigeria, Saudi Arabia, Korea, and Sudan, accounting for 3% of the five-country cooperation studies. In addition, research cooperation between Australia, China, Macau, the United Kingdom (UK), and Vietnam; between China, France, Germany, the United Kingdom (UK), and the United States (US); and between Australia, China, Japan, Saudi Arabia, and the Republic of Korea were conducted in the same two cases. Table 4 shows the joint research cases between the four other countries and five countries by dividing them into the top 10 rankings. There were no overlapping cases among the six countries’ joint studies.

Table 4.
Ranking of joint research between more than four countries during the entire period.
4.2. Topic Modeling LDA Analysis (Full Period, First Half, Second Half)
Topic modeling latent Dirichlet allocation (LDA) analysis was performed to identify the topics of multinational cooperation research conducted in the secondary battery field over the past decade, and after diagnosing the appropriate number of topics, as shown in Figure 2, a total of six topics were identified, as shown in Figure 10, and the ranking of the top keywords, by topic, is shown in Table 5. As a result of selecting and analyzing 10 top distribution keywords for each topic, it was confirmed that the keywords “Lithium”, implying lithium-ion battery, which is a secondary battery for electric vehicles, and the keywords “High”, “High”, and “Capacity”, denoting high energy density and capacity, are highly distributed across all topics. In this way, we attempted to interpret topics by focusing on unique keywords assigned to individual topics, excluding common keywords.
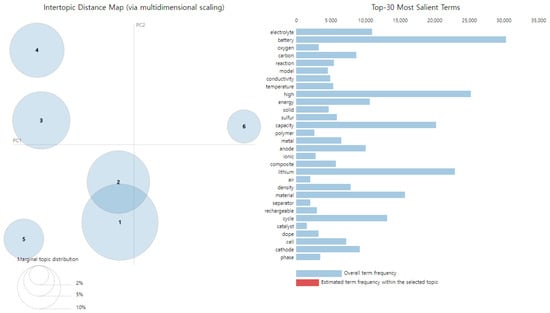
Figure 10.
Visualization of topic modeling LDA analysis for the entire period (2013–2022).

Table 5.
Top 10 keywords by LDA topic during the entire period (2013–2022).
Given that the keywords “Carbon”, “Cycle”, “Performance,“ and “Material” appeared frequently, Topic 1 deals with anode active materials, such as artificial and natural graphite for battery charging. Topic 2 relates to research on the four key materials of batteries, except for the separator, as keywords, such as “Electrolyte”, “Anode”, and “Cathode”, appeared in addition to the common keywords. Keywords, such as “Electrochemical”, “Electrode”, “Structure”, and “Surface”, appeared in Topic 3, which seems to be mainly composed of research on the surface and structure of the two battery electrodes. Topic 4 includes the keywords “Model”, “Method”, Charge”, and “Temperature”, which are considered the main topics of research on methods or models for battery charging and thermal management. Topic 5 identified the keywords, “Electrolyte”, “Solid”, “Conductivity”, and “Separator”, which appear to be research topics for all-solid-state batteries with solid electrolytes that do not require separators. Finally, unlike the other five topics, Topic 6 was in the top 10 sub-distributions, even if there were few common keywords. The unique representative keywords for this topic included “Oxygen”, “Air”, and “Metal”, and it can be assumed to be a research topic for next-generation batteries, except for all-solid-state batteries, such as lithium metal batteries or lithium–air batteries.
As shown in Figure 3, after diagnosing the appropriate number of topics, six topics in the first half were identified, as shown in Figure 11, and the ranking of the top keywords, by topic, is shown in Table 6. Topic 1 shows high frequency of keywords, such as “Capacity”, “High”, “Cycle”, and “Performance”, as well as a distribution of “Carbon” and “Anode” keywords. This can be assumed to be a topic containing the contents of the anode material, centered on graphite. Topic 2 is composed of top keywords such as “Material”, “Electrochemical”, “Lithium”, and “Ion”, and the distribution of the keywords, “Capacity”, “Cathode”, and “High” is also shown. It can be inferred that the topic covers the composition of the cathode material, which has the highest energy density among the four constituents of batteries. Keywords, such as “Battery”, “Lithium”, “Sulfur”, and “High” appeared to be high in Topic 3, and keywords such as “Cathode” and “Metal” could also be identified. This topic mainly focuses on lithium–sulfur batteries that use sulfur as the cathode material and lithium metal as the anode material. Top keywords of Topic 4 were “Electrolyte”, “Lithium”, and “High”, with specific keywords being “Si”, “conductivity”, and “Polymer”. Technologies that increase the conductivity of lithium ions by adding silicon or polymer electrolytes have been the primary focus of research. Topic 5 consists of the top keywords, “Battery”, “Model”, and “Ion”, and specific keywords, such as “Method”, “Charge”, “State”, and “Cell”. Considering the keyword distribution, it seems that the primary focus of topics is on various battery cell charging models or methods. In addition to keywords, such as “Battery” and “Energy”, Topic 6 also features keywords such as “Oxygen”, “Air”, and “Catalyst” that cannot be found in other topics. This seems to be a topic covering the contents of lithium–air batteries, which are ultra-light batteries, using oxygen as a positive active material, acting as a catalyst to solve the short-life shortcomings of lithium–air batteries.
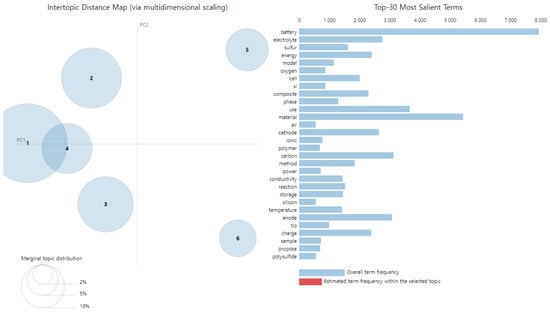
Figure 11.
Visualization of topic modeling LDA analysis in the first half of the year (2013–2017).

Table 6.
Top 10 keywords by LDA topic in the first half (2013–2017).
Table 7 shows the most representative research partner countries in the first half. Among the cases in which two countries cooperated, the most common was United States and China, and 1022 cases were conducted, accounting for 24% of the two-country cooperative studies conducted in the first half. The second most common case was Australia and China, accounting for 9% of the two-country cooperative studies conducted in the first half. Next, 226 cases were conducted in the first five years with the cooperation of Singapore and China, accounting for 5% of the total. Among the cases in which three countries cooperated, the most common was United States, Hong Kong and China, with 25 cases accounting for 4% of the three-country cooperative studies conducted in the first half. The second most common case was United States, China, and Korea, with 24 cases accounting for 4% of the three-country cooperative studies conducted in the first half. Next, 17 cases were conducted in the first five years with the cooperation of Australia, United States, and China, accounting for 3% of the total.

Table 7.
Ranking of joint research between two and three countries during the first half (2013–2017).
As shown in Figure 4, after the diagnosis of the appropriate number of topics, a total of five topics in the second half could be identified, as shown in Figure 12, and the ranking of the top keywords by topic is shown in Table 8. Topic 1 shows high keywords such as “Capacity”, “High”, “Material”, and “Ion”, and the distribution of “Cycle”, “Anode”, and “Carbon” keywords is also shown. This seems to be a topic related to the contents of the anode material, which is responsible for charging the four battery materials. Topic 2 is composed of top keywords such as “Lithium”, “Ion”, “Material”, and “Battery”, and the distribution of keywords “Electrode”, “Cathode”, and “Structure” is also shown. The four battery materials appeared to contain the cathode and the contents of the cathode material or its structure. Keywords such as “Electrolyte”, “High”, “Lithium”, and “Battery” appeared high in Topic 3, and keywords such as “Solid” and “Capacity” could also be identified. This topic seems to be mainly focused on all-solid batteries that can implement high capacity using solid electrolytes. Top keywords of Topic 4 will be “Battery”, “Model”, and “Lithium”, and the specific keywords will be “Temperature” and “Charge”. Technologies, such as models or methods that can control high temperatures during cell charging, which have been pointed out as one of the chronic problems of lithium-ion batteries, seem to be the main topics. Topic 5 consists of the top keywords “Sulfur”, “Battery”, and “High”, and “Polysulfide” and “Oxygen” appear as specific keywords. Considering the distribution of keywords, the topic can be assumed to have been mainly about lithium–sulfur batteries and lithium–polysulfide products that damage the positive electrode active materials, which is a chronic problem of lithium–sulfur batteries.
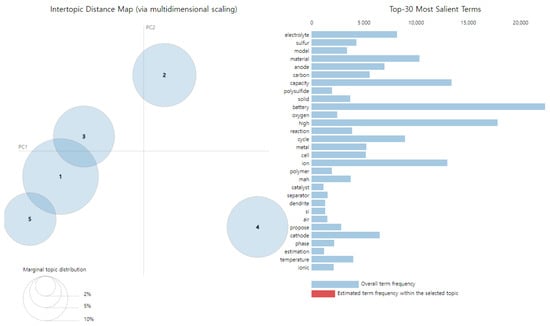
Figure 12.
Visualization of topic modeling LDA analysis in the second half of the year (2018–2022).

Table 8.
Top 10 keywords by LDA topic in the second half of the year (2018–2022).
Table 9 shows the most representative research partner countries in the second half. Among the cases in which two countries cooperated, the most common was the United States and China, and 1675 cases accounted for 20% of the two-country cooperative studies conducted in the second half. The second most common case was Australia and China, which accounted for 8% of the two-country cooperative studies conducted in the second half. Next, 417 cases were conducted in the second half of the year with the cooperation of China and the United Kingdom, accounting for 5% of the total. Among the cases in which three countries cooperated, the most common was the United States, China, and Canada, with 66 cases accounting for 4% of the three-country cooperative studies conducted in the second half. The second most common case was the United States, Hong Kong, and China, with 55 cases accounting for 4% of the three-country cooperative studies conducted in the second half. Next, with the cooperation of Australia, the United States, and China, 54 cases were conducted in the second half of the five years, accounting for 3% of the total.

Table 9.
Ranking of joint research between two and three countries during the second half (2018–2022).
5. Discussion
5.1. Global Research Cooperation Patterns
A comparison of the results of the network module visualization analysis for both halves of the 10-year period, along with the network centrality analysis for the entire period, confirmed that more diverse countries participated in cooperative research in the second half than in the first half. In particular, two cooperative research communities, Korea and Japan, and three cooperative research communities, Germany, the United Kingdom (UK), and France, were identified during the first five years. In the second five-year period, the UK and India were included in cooperative research communities concentrated around the United States (US) and China. In the European cooperative research community, the influence of Russia—not Germany, Spain, or France—increased. In addition, we identified cooperative research communities in Middle Eastern countries, including Saudi Arabia, Egypt, and Turkey, which were not identified in the first half.
5.2. Characteristics of Secondary Battery Cooperation Research Topics
Six topics were identified through the topic modeling of the abstracts of the co-authors’ papers on the secondary battery field for 10 years from 2013 to 2022. Topics 1 and 2, which account for the largest volume, were confirmed to be similar. Topic 1 deals with anode active materials, and Topic 2 with core battery material, excluding separators. It seems that the two topics overlap in the subject of cathode materials. In addition, when looking at the latent Dirichlet allocation (LDA) visualization graph, the topic distribution size of Topic 5, which covers all-solid-state batteries, and Topic 6, which deals with next-generation batteries, was significantly smaller than that of the other topics. Thus, various studies have been conducted over the past 10 years, since the inception of the battery industry. However, in multinational cooperative research, research has been mainly conducted from the perspective of battery contents rather than next-generation batteries.
In addition to topic modeling over the entire period, it was conducted for the first and second five-year intervals; thereafter, cooperative research topics were compared. The comparison yielded six topics in the first half, but one topic was reduced, generating five topics in the second half. Upon comparison, the topic-wise keyword distribution in the first and second halves is as follows. Overall, there was no significant difference in the emergence of keywords, such as “High”, “Energy”, “Power”, and “Capacity” related to the high energy density of batteries; however, more appearances were confirmed in the first half. Additionally, keywords related to battery charging and discharging, such as “discharge” and “charge”, appeared in the first half, but their frequency was relatively less in the second half. Further, keywords, such as “Sulfur”, “Polysulfide”, and “Solid”, which could not be identified in the first half, appeared in the second half. Overall, in the early stages, battery research has mainly focused on improving battery-specific low-energy performance and charging and discharging. However, in recent years, more research has been directed toward next-generation batteries, such as solid-state batteries or lithium–sulfur batteries.
6. Conclusions
From a policy perspective, this study provides insights into the establishment of international battery research cooperation strategies by identifying the countries that dominate joint research cooperation. In addition, based on the results of this study, global corporate research institutes and R&D workers in the electric vehicle industry can check how research cooperation topics and keywords related to lithium-ion batteries have changed in recent years, utilizing it as basic data for establishing future research and development (R&D) plans.
This study analyzed global research cooperation patterns and characteristics using nationality information and abstract data from published joint research papers. However, it has certain limitations. First, of the various results produced through global research cooperation, data were collected only from published papers. Even if the research was conducted with multinational cooperation, it could not be included in the data if it had not been published as a paper. In addition, factors such as joint patent applications or citations, the dispatch of visiting researchers, and the movement of research personnel generated by research cooperation between countries were not considered. Second, the nationality information described in the joint research paper could be used only to observe the simple relationship of cooperation; the pattern according to the time series, differences in the strength, or the level of cooperation could not be considered. There were limits to obtaining detailed information, such as differences in contributions between co-authors, differences in roles in the cooperative research process, and cooperation periods.
The electric vehicle industry is moving from infancy toward maturity through the development of the secondary battery sector. Therefore, the hegemony of the global market is not completely biased toward a specific minority country or company, and there are many technical issues and barriers to overcome through technological innovation in the future. Some examples are all-solid-state batteries, using solid electrolytes, which are structurally safe from fires, lithium–sulfur batteries that can rapidly increase the mileage of electric vehicles because of low material density and large capacity per weight, and sodium-ion batteries that can reduce production costs by replacing lithium, a key mineral for battery manufacturing, with sodium. Numerous countries and companies are currently collaborating to commence research to develop next-generation batteries. We believe that focusing on next-generation batteries will present meaningful results for countries and companies exploring this field, if studies on cooperative research patterns and thematic characteristics in the secondary battery field are conducted in the future.
Author Contributions
Conceptualization, H.A.; methodology, H.A.; software, H.A.; validation, K.C.; formal analysis, H.A.; writing—original draft preparation, H.A.; writing—review and editing, H.A. and K.C.; supervision, K.C. All authors have read and agreed to the published version of the manuscript.
Funding
This research received no external funding.
Data Availability Statement
The data used to support the findings of this study are included within the article.
Conflicts of Interest
The authors declare no conflicts of interest.
Appendix A

Table A1.
Results of network centrality analysis for the entire period (2013–2022).
Table A1.
Results of network centrality analysis for the entire period (2013–2022).
| Rank | Country Name | Eigenvector Centrality | Country Name | Closeness Centrality | Country Name | Betweenness Centrality |
|---|---|---|---|---|---|---|
| 1 | China | 1.0000 | China | 0.7529 | China | 0.172667 |
| 2 | United Kingdom | 0.9508 | United States | 0.7033 | United Kingdom | 0.088105 |
| 3 | United States | 0.9447 | United Kingdom | 0.6995 | India | 0.085293 |
| 4 | Germany | 0.9398 | India | 0.6809 | United States | 0.068123 |
| 5 | India | 0.9123 | South Korea | 0.6809 | South Korea | 0.059112 |
| 6 | South Korea | 0.9063 | Germany | 0.6702 | France | 0.049469 |
| 7 | Canada | 0.8708 | Canada | 0.6531 | Germany | 0.048839 |
| 8 | Australia | 0.8511 | Spain | 0.6465 | Canada | 0.04441 |
| 9 | Japan | 0.8470 | France | 0.6432 | Brazil | 0.027934 |
| 10 | Spain | 0.8439 | Italy | 0.6432 | Italy | 0.027294 |
| 11 | France | 0.8428 | Japan | 0.6368 | Russian Federation | 0.025134 |
| 12 | Italy | 0.8385 | Australia | 0.6337 | Taiwan | 0.024034 |
| 13 | Russian Federation | 0.7883 | Russian Federation | 0.6275 | Spain | 0.023621 |
| 14 | Sweden | 0.7880 | Sweden | 0.6184 | Japan | 0.021844 |
| 15 | Belgium | 0.7499 | Saudi Arabia | 0.6184 | Mexico | 0.020719 |
| 16 | Saudi Arabia | 0.7494 | Belgium | 0.6038 | Saudi Arabia | 0.019505 |
| 17 | Turkey | 0.7348 | Turkey | 0.6038 | Nigeria | 0.019279 |
| 18 | Czech Republic | 0.7205 | Taiwan | 0.5981 | South Africa | 0.01875 |
| 19 | Poland | 0.7160 | Poland | 0.5953 | Austria | 0.017278 |
| 20 | Iran | 0.6933 | Czech Republic | 0.5926 | Sweden | 0.016524 |
| 21 | Netherlands | 0.6917 | Egypt | 0.5926 | Australia | 0.01444 |
| 22 | Taiwan | 0.6902 | Netherlands | 0.5899 | Turkey | 0.013669 |
| 23 | Switzerland | 0.6777 | Switzerland | 0.5899 | Iran | 0.012367 |
| 24 | Singapore | 0.6694 | Iran | 0.5872 | Chile | 0.011504 |
| 25 | Egypt | 0.6562 | Singapore | 0.5872 | Malaysia | 0.010566 |
| 26 | Pakistan | 0.6374 | Pakistan | 0.5792 | Egypt | 0.009642 |
| 27 | Norway | 0.6337 | Malaysia | 0.5792 | Belgium | 0.008931 |
| 28 | Malaysia | 0.6288 | Brazil | 0.5792 | Vietnam | 0.007256 |
| 29 | Hong Kong | 0.6250 | Norway | 0.5766 | Indonesia | 0.007052 |
| 30 | Denmark | 0.6180 | Hong Kong | 0.5740 | Kazakhstan | 0.005631 |
| 31 | Austria | 0.6134 | Denmark | 0.5714 | Morocco | 0.005486 |
| 32 | Ireland | 0.5841 | Austria | 0.5714 | Poland | 0.005233 |
| 33 | Vietnam | 0.5729 | Vietnam | 0.5714 | United Arab Emirates | 0.005064 |
| 34 | Portugal | 0.5718 | Portugal | 0.5639 | Czech Republic | 0.004926 |
| 35 | Brazil | 0.5537 | Ireland | 0.5614 | Ukraine | 0.004664 |
| 36 | Israel | 0.5403 | Israel | 0.5590 | Pakistan | 0.004453 |
| 37 | Morocco | 0.5378 | Morocco | 0.5565 | Singapore | 0.004379 |
| 38 | Thailand | 0.5227 | Mexico | 0.5565 | Hong Kong | 0.003883 |
| 39 | Finland | 0.5148 | South Africa | 0.5541 | Iraq | 0.003748 |
| 40 | South Africa | 0.5004 | Finland | 0.5517 | Denmark | 0.00365 |
| 41 | Slovenia | 0.4757 | Indonesia | 0.5517 | Switzerland | 0.003573 |
| 42 | Mexico | 0.4655 | Thailand | 0.5494 | Ireland | 0.003304 |
| 43 | Indonesia | 0.4641 | Iraq | 0.5470 | Netherlands | 0.003138 |
| 44 | Tunisia | 0.4431 | Slovenia | 0.5424 | Argentina | 0.002801 |
| 45 | Iraq | 0.4431 | Chile | 0.5424 | Norway | 0.002762 |
| 46 | Bulgaria | 0.4178 | United Arab Emirates | 0.5356 | Portugal | 0.002632 |
| 47 | Chile | 0.4154 | Tunisia | 0.5311 | Rwanda | 0.002112 |
| 48 | Ukraine | 0.3843 | Bulgaria | 0.5267 | Finland | 0.001968 |
| 49 | United Arab Emirates | 0.3804 | Ukraine | 0.5224 | Jordan | 0.001643 |
| 50 | Kazakhstan | 0.3599 | Qatar | 0.5224 | Israel | 0.001607 |
| 51 | Qatar | 0.3569 | Kazakhstan | 0.5203 | Serbia | 0.001601 |
| 52 | Romania | 0.3538 | Oman | 0.5203 | Slovenia | 0.001281 |
| 53 | Oman | 0.3478 | Estonia | 0.5203 | Romania | 0.001256 |
| 54 | Estonia | 0.3451 | Jordan | 0.5182 | Puerto Rico | 0.001115 |
| 55 | Argentina | 0.3398 | Argentina | 0.5161 | Thailand | 0.001078 |
| 56 | Greece | 0.3381 | Greece | 0.5120 | Hungary | 0.000885 |
| 57 | Jordan | 0.3344 | Romania | 0.5079 | Tunisia | 0.000857 |
| 58 | Ethiopia | 0.3325 | Nigeria | 0.5079 | Oman | 0.0008 |
| 59 | Algeria | 0.2889 | Ethiopia | 0.5059 | Qatar | 0.000615 |
| 60 | Macao | 0.2834 | Luxembourg | 0.5039 | Ghana | 0.000613 |
| 61 | Luxembourg | 0.2789 | Algeria | 0.5020 | Estonia | 0.000598 |
| 62 | Nigeria | 0.2783 | Ecuador | 0.5020 | Cuba | 0.000569 |
| 63 | Ecuador | 0.2755 | Macao | 0.5000 | Ecuador | 0.00048 |
| 64 | Hungary | 0.2744 | Hungary | 0.5000 | Lithuania | 0.000461 |
| 65 | Colombia | 0.2611 | New Zealand | 0.4923 | New Zealand | 0.00042 |
| 66 | Slovakia | 0.2452 | Colombia | 0.4867 | Sudan | 0.000406 |
| 67 | New Zealand | 0.2377 | Slovakia | 0.4848 | Greece | 0.00026 |
| 68 | Serbia | 0.2344 | Serbia | 0.4830 | Slovakia | 0.000251 |
| 69 | Bangladesh | 0.2290 | Sudan | 0.4830 | Bulgaria | 0.000238 |
| 70 | Cuba | 0.2037 | Bangladesh | 0.4794 | Colombia | 0.000223 |
| 71 | Sudan | 0.1988 | Philippines | 0.4776 | Ethiopia | 0.000209 |
| 72 | Sri Lanka | 0.1863 | Uzbekistan | 0.4741 | Algeria | 0.000195 |
| 73 | Lithuania | 0.1830 | Cuba | 0.4723 | Costa Rica | 0.000194 |
| 74 | Philippines | 0.1822 | Lithuania | 0.4723 | Bangladesh | 0.000132 |
| 75 | Lebanon | 0.1506 | Puerto Rico | 0.4706 | Belarus | 0.00008 |
| 76 | Croatia | 0.1384 | Sri Lanka | 0.4689 | Peru | 0.000053 |
| 77 | Uzbekistan | 0.1343 | Ghana | 0.4672 | Lebanon | 0.000038 |
| 78 | Puerto Rico | 0.1284 | Lebanon | 0.4638 | Macao | 0.000034 |
| 79 | Belarus | 0.1259 | Belarus | 0.4621 | Yemen | 0.000021 |
| 80 | Peru | 0.1238 | Rwanda | 0.4621 | Cyprus | 0.000018 |
| 81 | Bahrain | 0.1225 | Croatia | 0.4604 | Palestine | 0.000017 |
| 82 | Yemen | 0.1195 | Bahrain | 0.4555 | Uruguay | 0.000015 |
| 83 | Democratic Republic Congo | 0.1000 | Myanmar | 0.4555 | Malawi | 0.000012 |
| 84 | Ghana | 0.0984 | Democratic Republic Congo | 0.4507 | Sri Lanka | 0.00001 |
| 85 | Malawi | 0.0979 | Malawi | 0.4491 | Croatia | 0.00001 |
| 86 | Rwanda | 0.0930 | Peru | 0.4460 | Libyan Arab Jamahiriya | 0.000007 |
| 87 | Myanmar | 0.0910 | Kuwait | 0.4399 | Luxembourg | 0.000005 |
| 88 | Cyprus | 0.0853 | Nepal | 0.4399 | Philippines | 0.000005 |
| 89 | Kuwait | 0.0837 | Yemen | 0.4369 | Uzbekistan | 0.000005 |
| 90 | Palestine | 0.0833 | Azerbaijan | 0.4369 | Bahrain | 0 |
| 91 | Mongolia | 0.0826 | New Caledonia | 0.4339 | Myanmar | 0 |
| 92 | Venezuela | 0.0754 | North Macedonia | 0.4324 | Democratic Republic Congo | 0 |
| 93 | Uruguay | 0.0554 | Zimbabwe | 0.4310 | Kuwait | 0 |
| 94 | Azerbaijan | 0.0553 | Congo | 0.4310 | Nepal | 0 |
| 95 | Brunei Darussalam | 0.0524 | Georgia | 0.4310 | Azerbaijan | 0 |
| 96 | Zimbabwe | 0.0503 | Kenya | 0.4310 | New Caledonia | 0 |
| 97 | Nepal | 0.0491 | Laos | 0.4310 | North Macedonia | 0 |
| 98 | New Caledonia | 0.0487 | Niger | 0.4310 | Zimbabwe | 0 |
| 99 | Libyan Arab Jamahiriya | 0.0483 | Cyprus | 0.4281 | Congo | 0 |
| 100 | Armenia | 0.0420 | Palestine | 0.4281 | Georgia | 0 |
| 101 | Bolivia | 0.0417 | Mongolia | 0.4267 | Kenya | 0 |
| 102 | Costa Rica | 0.0399 | Venezuela | 0.4224 | Laos | 0 |
| 103 | Latvia | 0.0394 | Armenia | 0.4224 | Niger | 0 |
| 104 | Panama | 0.0365 | Costa Rica | 0.4211 | Mongolia | 0 |
| 105 | North Macedonia | 0.0320 | Panama | 0.4197 | Venezuela | 0 |
| 106 | Cameroon | 0.0307 | Tanzania | 0.4156 | Armenia | 0 |
| 107 | Tanzania | 0.0281 | Zambia | 0.4156 | Panama | 0 |
| 108 | Zambia | 0.0281 | Uruguay | 0.4142 | Tanzania | 0 |
| 109 | Congo | 0.0259 | Libyan Arab Jamahiriya | 0.4129 | Zambia | 0 |
| 110 | Georgia | 0.0259 | Cameroon | 0.4116 | Cameroon | 0 |
| 111 | Kenya | 0.0259 | Brunei Darussalam | 0.4076 | Brunei Darussalam | 0 |
| 112 | Laos | 0.0259 | Eritrea | 0.4063 | Eritrea | 0 |
| 113 | Niger | 0.0259 | Sierra Leone | 0.4063 | Sierra Leone | 0 |
| 114 | Iceland | 0.0240 | Cambodia | 0.4063 | Cambodia | 0 |
| 115 | Moldova | 0.0240 | Iceland | 0.4025 | Iceland | 0 |
| 116 | Eritrea | 0.0234 | Moldova | 0.4025 | Moldova | 0 |
| 117 | Sierra Leone | 0.0234 | Bolivia | 0.3988 | Bolivia | 0 |
| 118 | Cambodia | 0.0233 | Latvia | 0.3963 | Latvia | 0 |
| 119 | French Polynesia | 0.0216 | French Polynesia | 0.3926 | French Polynesia | 0 |
| 120 | Syrian Arab Republic | 0.0216 | Syrian Arab Republic | 0.3926 | Syrian Arab Republic | 0 |
| 121 | Burkina Faso | 0.0176 | Burkina Faso | 0.3754 | Burkina Faso | 0 |
| 122 | Uganda | 0.0156 | Mozambique | 0.3678 | Mozambique | 0 |
| 123 | Mozambique | 0.0143 | Uganda | 0.3647 | Uganda | 0 |
| 124 | Barbados | 0.0128 | El Salvador | 0.3585 | El Salvador | 0 |
| 125 | El Salvador | 0.0120 | Barbados | 0.3575 | Barbados | 0 |
| 126 | Papua New Guinea | 0.0073 | Papua New Guinea | 0.3377 | Papua New Guinea | 0 |
References
- Thomas, R.; Garbuio, L.; Gerbaud, L.; Chazal, H. Modeling and design analysis of the Tesla Model S induction motor. In Proceedings of the 2020 International Conference on Electrical Machines (ICEM), Gothenburg, Sweden, 23–26 August 2020; pp. 495–501. [Google Scholar]
- Powell, W.W.; Koput, K.W.; Smith-Doerr, L. Interorganizational collaboration and the locus of innovation: Networks of learning in biotechnology. Adm. Sci. Q. 1996, 41, 116–145. [Google Scholar] [CrossRef]
- Ahuja, G. Collaboration networks, structural holes, and innovation: A longitudinal study. Adm. Sci. Q. 2000, 45, 425–455. [Google Scholar] [CrossRef]
- Katz, J.S.; Martin, B.R. What is research collaboration? Res. Policy 1997, 26, 1–18. [Google Scholar] [CrossRef]
- Todo, Y.; Matous, P.; Inoue, H. The strength of long ties and the weakness of strong ties: Knowledge diffusion through supply chain networks. Res. Policy 2016, 45, 1890–1906. [Google Scholar] [CrossRef]
- Miotti, L.; Sachwald, F. Co-operative R&D: Why and with whom? Res. Policy 2003, 32, 1481–1499. [Google Scholar] [CrossRef]
- Fritsch, M. Cooperation and the efficiency of regional R&D activities. Camb. J. Econ. 2004, 28, 829–846. [Google Scholar] [CrossRef]
- Belderbos, R.; Carree, M.; Lokshin, B. Cooperative R&D and firm performance. Res. Policy 2004, 33, 1477–1492. [Google Scholar] [CrossRef]
- Tether, B.S. Who co-operates for innovation, and why: An empirical analysis. Res. Policy 2002, 31, 947–967. [Google Scholar] [CrossRef]
- Lhuillery, S.; Pfister, E. R&D cooperation and failures in innovation projects: Empirical evidence from French CIS data. Res. Policy 2009, 38, 45–57. [Google Scholar] [CrossRef]
- Chinchilla-Rodriguez, Z.; Sugimoto, C.R.; Lariviere, V. Follow the leader: On the relationship between leadership and scholarly impact in international collaborations. PLoS ONE 2019, 14, e0218309. [Google Scholar] [CrossRef] [PubMed]
- Georghiou, L. Global cooperation in research. Res. Policy 1998, 27, 611–626. [Google Scholar] [CrossRef]
- Larivière, V.; Gingras, Y.; Sugimoto, C.R.; Tsou, A. Team size matters: Collaboration and scientific impact since 1900. J. Assoc. Inf. Sci. Technol. 2015, 66, 1323–1332. [Google Scholar] [CrossRef]
- Hottenrott, H.; Lopes-Bento, C. R&D Partnerships and Innovation Performance: Can There Be too Much of a Good Thing? J. Prod. Innov. Manag. 2016, 33, 773–794. [Google Scholar] [CrossRef]
- Wagner, C.S. Six case studies of international collaboration in science. Scientometrics 2005, 62, 3–26. [Google Scholar] [CrossRef]
- Hagedoorn, J. Inter-firm R&D partnerships: An overview of major trends and patterns since 1960. Res. Policy 2002, 31, 477–492. [Google Scholar]
- Corsi, S.; Feranita, F.; De Massis, A. International R&D partnerships: The role of government funding in reducing transaction costs and opportunistic behavior. RD Manag. 2021, 52, 530–547. [Google Scholar] [CrossRef]
- Hagedoorn, J.; Roijakkers, N.; Van Kranenburg, H. Inter-Firm R&D Networks: The Importance of Strategic Network Capabilities for High-Tech Partnership Formation1. Br. J. Manag. 2005, 17, 39–53. [Google Scholar] [CrossRef]
- Busom, I.; Fernández-Ribas, A. The impact of firm participation in R&D programmes on R&D partnerships. Res. Policy 2008, 37, 240–257. [Google Scholar] [CrossRef]
- Leifeld, P.; Ingold, K. Co-authorship Networks in Swiss Political Research. Swiss Polit. Sci. Rev. 2015, 22, 264–287. [Google Scholar] [CrossRef]
- Peters, H.; Van Raan, A. Structuring scientific activities by co-author analysis: An expercise on a university faculty level. Scientometrics 1991, 20, 235–255. [Google Scholar] [CrossRef]
- Moody, J. The structure of a social science collaboration network: Disciplinary cohesion from 1963 to 1999. Am. Sociol. Rev. 2004, 69, 213–238. [Google Scholar] [CrossRef]
- Barabâsi, A.-L.; Jeong, H.; Néda, Z.; Ravasz, E.; Schubert, A.; Vicsek, T. Evolution of the social network of scientific collaborations. Phys. A Stat. Mech. Its Appl. 2002, 311, 590–614. [Google Scholar] [CrossRef]
- Newman, M.E. The structure of scientific collaboration networks. Proc. Natl. Acad. Sci. USA 2001, 98, 404–409. [Google Scholar] [CrossRef] [PubMed]
- Yan, E.; Ding, Y.; Zhu, Q. Mapping library and information science in China: A coauthorship network analysis. Scientometrics 2009, 83, 115–131. [Google Scholar] [CrossRef]
- Liu, X.; Bollen, J.; Nelson, M.L.; Van de Sompel, H. Co-authorship networks in the digital library research community. Inf. Process. Manag. 2005, 41, 1462–1480. [Google Scholar] [CrossRef]
- Mongeon, P.; Paul-Hus, A. The journal coverage of Web of Science and Scopus: A comparative analysis. Scientometrics 2015, 106, 213–228. [Google Scholar] [CrossRef]
- Reidpath, D.D.; Allotey, P.; Pokhrel, S. Social sciences research in neglected tropical diseases 2: A bibliographic analysis. Health Res. Policy Syst. 2011, 9, 1–12. [Google Scholar] [CrossRef] [PubMed]
- Falagas, M.E.; Pitsouni, E.I.; Malietzis, G.A.; Pappas, G. Comparison of PubMed, Scopus, Web of Science, and Google Scholar: Strengths and weaknesses. FASEB J. 2008, 22, 338–342. [Google Scholar] [CrossRef] [PubMed]
- Wasserman, S.; Faust, K. Social Network Analysis: Methods and Applications; Cambridge University Press: Cambridge, UK, 1994; pp. 10–17. [Google Scholar]
- Mohr, J.W.; Bogdanov, P. Introduction—Topic models: What they are and why they matter. Poetics 2013, 41, 545–569. [Google Scholar] [CrossRef]
- Ahmed, F.; Nawaz, M.; Jadoon, A. Topic Modeling of the Pakistani Economy in English Newspapers via Latent Dirichlet Allocation (LDA). SAGE Open 2022, 12. [Google Scholar] [CrossRef]
Disclaimer/Publisher’s Note: The statements, opinions and data contained in all publications are solely those of the individual author(s) and contributor(s) and not of MDPI and/or the editor(s). MDPI and/or the editor(s) disclaim responsibility for any injury to people or property resulting from any ideas, methods, instructions or products referred to in the content. |
© 2024 by the authors. Licensee MDPI, Basel, Switzerland. This article is an open access article distributed under the terms and conditions of the Creative Commons Attribution (CC BY) license (https://creativecommons.org/licenses/by/4.0/).