Article

Comprehensive Analysis of Factors Underpinning the Superior Performance of Ducted Horizontal-Axis Helical Wind Turbines

by
Shaikh Zishan Suheel
1,
Ahmad Fazlizan
1,*,
Halim Razali
1,
Kok Hoe Wong
2,
Altaf Hossain Molla
3,
Rajkumar Singh Rathore
4,
M. S. Hossain Lipu
5,* and
Mahidur R. Sarker
6,7
1
Solar Energy Research Institute, Universiti Kebangsaan Malaysia, Bangi 43600, Malaysia
2
Carbon Neutrality Research Group (CNRG), University of Southampton Malaysia, Iskandar Puteri 79200, Malaysia
3
Department of Mechanical and Manufacturing Engineering, Faculty of Engineering and Built Environment, Universiti Kebangsaan Malaysia, Bangi 43600, Malaysia
4
Cardiff School of Technologies, Llandaff Campus, Cardiff Metropolitan University, Western Avenue, Cardiff CF5 2YB, UK
5
Department of Electrical and Electronic Engineering, Green University of Bangladesh, Dhaka 1207, Bangladesh
6
Institute of Visual Informatics, Universiti Kebangsaan Malaysia, Bangi 43600, Malaysia
7
Industrial Engineering and Automotive, Campus Princesa, Nebrija University, C. de Sta. Cruz de Marcenado, 27, 28015 Madrid, Spain
*
Authors to whom correspondence should be addressed.
Energies 2024, 17(12), 3029; https://doi.org/10.3390/en17123029
Submission received: 27 April 2024 / Revised: 28 May 2024 / Accepted: 14 June 2024 / Published: 19 June 2024
(This article belongs to the Section A3: Wind, Wave and Tidal Energy)

Abstract

:
The societal and economic reliance on non-renewable energy sources, primarily fossil fuels, has raised concerns about an imminent energy crisis and climate change. The transition towards renewable energy sources faces challenges, notably in understanding turbine shear forces within wind technology. To address this gap, a novel solution emerges in the form of the ducted horizontal-axis helical wind turbine. This innovative design aims to improve airflow dynamics and mitigate adverse forces. Computational fluid dynamics and experimental assessments were employed to evaluate its performance. The results indicate a promising technology, showcasing the turbine’s potential to harness energy from diverse wind sources. The venturi duct aided in the augmentation of the velocity, thereby increasing the maximum energy content of the wind by 179.16%. In addition, 12.16% of the augmented energy was recovered by the turbine. Notably, the integration of a honeycomb structure demonstrated increased revolutions per minute (RPM) by rectifying the flow and reducing the circular wind, suggesting the impact of circular wind components on turbine performance. The absence of the honeycomb structure allows the turbine to encounter more turbulent wind (circular wind), which is the result of the movement of the fan. Strikingly, the downwash velocity of the turbine was observed to be equal to the incoming velocity, suggesting the absence of an axial induction factor and, consequently, no back force on the system. However, limitations persist in the transient modelling and in determining optimal performance across varying wind speeds due to experimental constraints. Despite these challenges, this turbine marks a significant stride in wind technology, highlighting its adaptability and potential for heightened efficiency, particularly at higher speeds. Further refinement and exploration are imperative for broadening the turbine’s application in renewable energy generation. This research emphasizes the turbine’s capacity to adapt to different wind velocities, signaling a promising avenue for more efficient and sustainable energy production.

1. Introduction

Electric power stands as a cornerstone of societal and economic advancement, evidenced by its escalating utilization across diverse sectors, including manufacturing, transportation, and residential/commercial domains [1]. The persistent increase in electric energy consumption signifies its pivotal role in fostering development [2]. However, this reliance predominantly on non-renewable sources, notably fossil fuels, raises profound concerns about an impending energy crisis. Simultaneously, the escalating global temperatures intensify the urgency to seek alternative, environmentally friendly energy sources to mitigate the impacts of climate change.
Despite the imperative to transition towards renewable energy sources, numerous challenges hinder this shift away from fossil fuels [3]. These challenges underscore the complexity of reducing dependency on conventional energy sources and the multifaceted nature of establishing sustainable, renewable energy systems. As such, researchers have actively explored diverse methods of amplifying and harnessing wind-based energy sources, seeking innovative solutions to this pressing global issue.
Table 1 encapsulates a series of scientific endeavors aimed at optimizing wind turbine efficiency by harnessing unconventional sources of airflow. Al-Kayiem et al. [4] explored the utilization of industrial flue gas to bolster the performance of the solar chimney power plant (SCPP) through the implementation of a Savonius wind rotor, resulting in a notable velocity increase from 4.1 m/s to 4.6 m/s. Similarly, Chong et al. [5] focused on enhancing the horizontal axis wind turbine (HAWT) efficiency by incorporating guide vanes and side diffusers, utilizing steam from cooling towers, which led to a substantial velocity boost from 8 m/s to 30.4% with a five-bladed HAWT configuration.
Nikhita Chilugodu et al. [6] proposed the placement of vertical axis wind turbines (VAWT) in proximity to the MRT train system in Singapore, capitalizing on wind generated from the kinematic movement of trains, yielding wind speeds ranging from 6 to 8 m/s. Md. Abir et al. [7] provided insights into conserving velocity within air sourced from industrial exhaust systems to optimize wind turbine performance, achieving speeds between 14.5 and 16 m/s. Mann and Singh [8,9,10] advocated for augmenting velocity in industrial flue gas using appropriate diffusers, achieving remarkable velocities of 20 m/s and 57.2 m/s with VAWT configurations featuring NACA airfoils. Wachira Puttichaem et al. [11,12] proposed a novel design for small scale horizontal wind turbines (SSHWT) catered towards air conditioning systems’ exhaust, introducing innovative generator technology without specifying velocity increases. Lastly, Douglas Yeboah et al. [13] explored the potential of underground mine exhaust for power generation, achieving a velocity of 7.67 m/s, albeit without detailed velocity augmentation strategies. These collective endeavors underscore the ingenuity in leveraging diverse airflow sources and innovative turbine designs to advance renewable energy technologies. This table highlights the broad spectrum of approaches researchers are taking to address the growing demand for sustainable energy solutions, indicating promising avenues for future development and implementation of wind power systems. Additionally, Chikere et al. [14] highlighted various unconventional wind resources utilized globally for power generation, showcasing a range from solar chimneys to harnessing wind energy from fast-moving trains and utilizing ventilated exhaust from air conditioning systems. Venkatesh [15] explored power extraction from automobile engine exhaust gases, aiming to enhance power output through turbine redesign. These studies, among others, have underscored the breadth of possibilities and the significance of unconventional wind sources in addressing energy challenges and diversifying renewable energy portfolios.
Electric power’s indispensable role in societal and economic growth, coupled with the imperative to transition towards cleaner energy sources, has motivated a deeper exploration into diverse methodologies to harness wind energy from non-traditional sources [16]. Such initiatives hold promise in reducing reliance on fossil fuels and fostering sustainable living practices while addressing the critical issue of climate change [17].
The existing body of work in the literature on this topic reveals a notable trend: a solitary researcher has focused on mitigating the adverse effects caused by the actuator disk theory’s negative forces. This highlights the crucial importance of comprehending the implications of this theory within turbine technology. Nonetheless, a considerable challenge persists in the limited understanding of the detrimental outcomes arising from the back force resultant from the turbine shear. This deficiency in comprehensive understanding poses a substantial barrier, impeding progress and optimization within the field. Consequently, it hinders the advancement of superior and more efficient designs and operations for turbines.
To tackle these concerns, researchers have embarked on developing a new type of wind turbine called the ducted horizontal-axis helical wind turbine (DHAHWT). Initial expectations have centered on several hypotheses:
  • The inclusion of a duct was anticipated to augment the airflow passing through the turbine.
  • The turbine’s design aimed to function akin to a funnel, pulling air inward and potentially averting the generation of backward force.
  • The design’s intention was to facilitate smoother airflow through the turbine, preventing the formation of a concentrated stream tube around it.
Given the likelihood that traditional equations might inadequately capture the performance of this novel turbine, deviating from established assumptions, a comprehensive study using computational fluid dynamics (CFD) with a steady-state approach (employing Reynolds-averaged Navier–Stokes equations with Menter’s shear stress transport model) was deemed necessary. This approach prioritized understanding the collective effects rather than focusing solely on eddy currents, aiming for the improved visualization of wind–turbine interactions.
Subsequently, a DHAHWT prototype was developed and subjected to rigorous testing at various wind speeds. The venturi-based design helped in amplifying the velocity of the incoming wind stream. The helical design of the turbine successfully managed to maintain the downwash velocity due to its funnel-like behavior. Initial observations of the prototype lacking a honeycomb structure revealed two discernible components in the incoming wind from the fan: axial and circular velocities. The subsequent integration of a honeycomb structure aimed to boost the axial component at the expense of the circular wind component. The outcomes indicated a substantial increase in the turbine’s revolutions per minute (RPM) when the honeycomb structure was implemented, suggesting a potentially adverse impact of circular wind on turbine performance.

2. Materials and Methods

2.1. Geometry

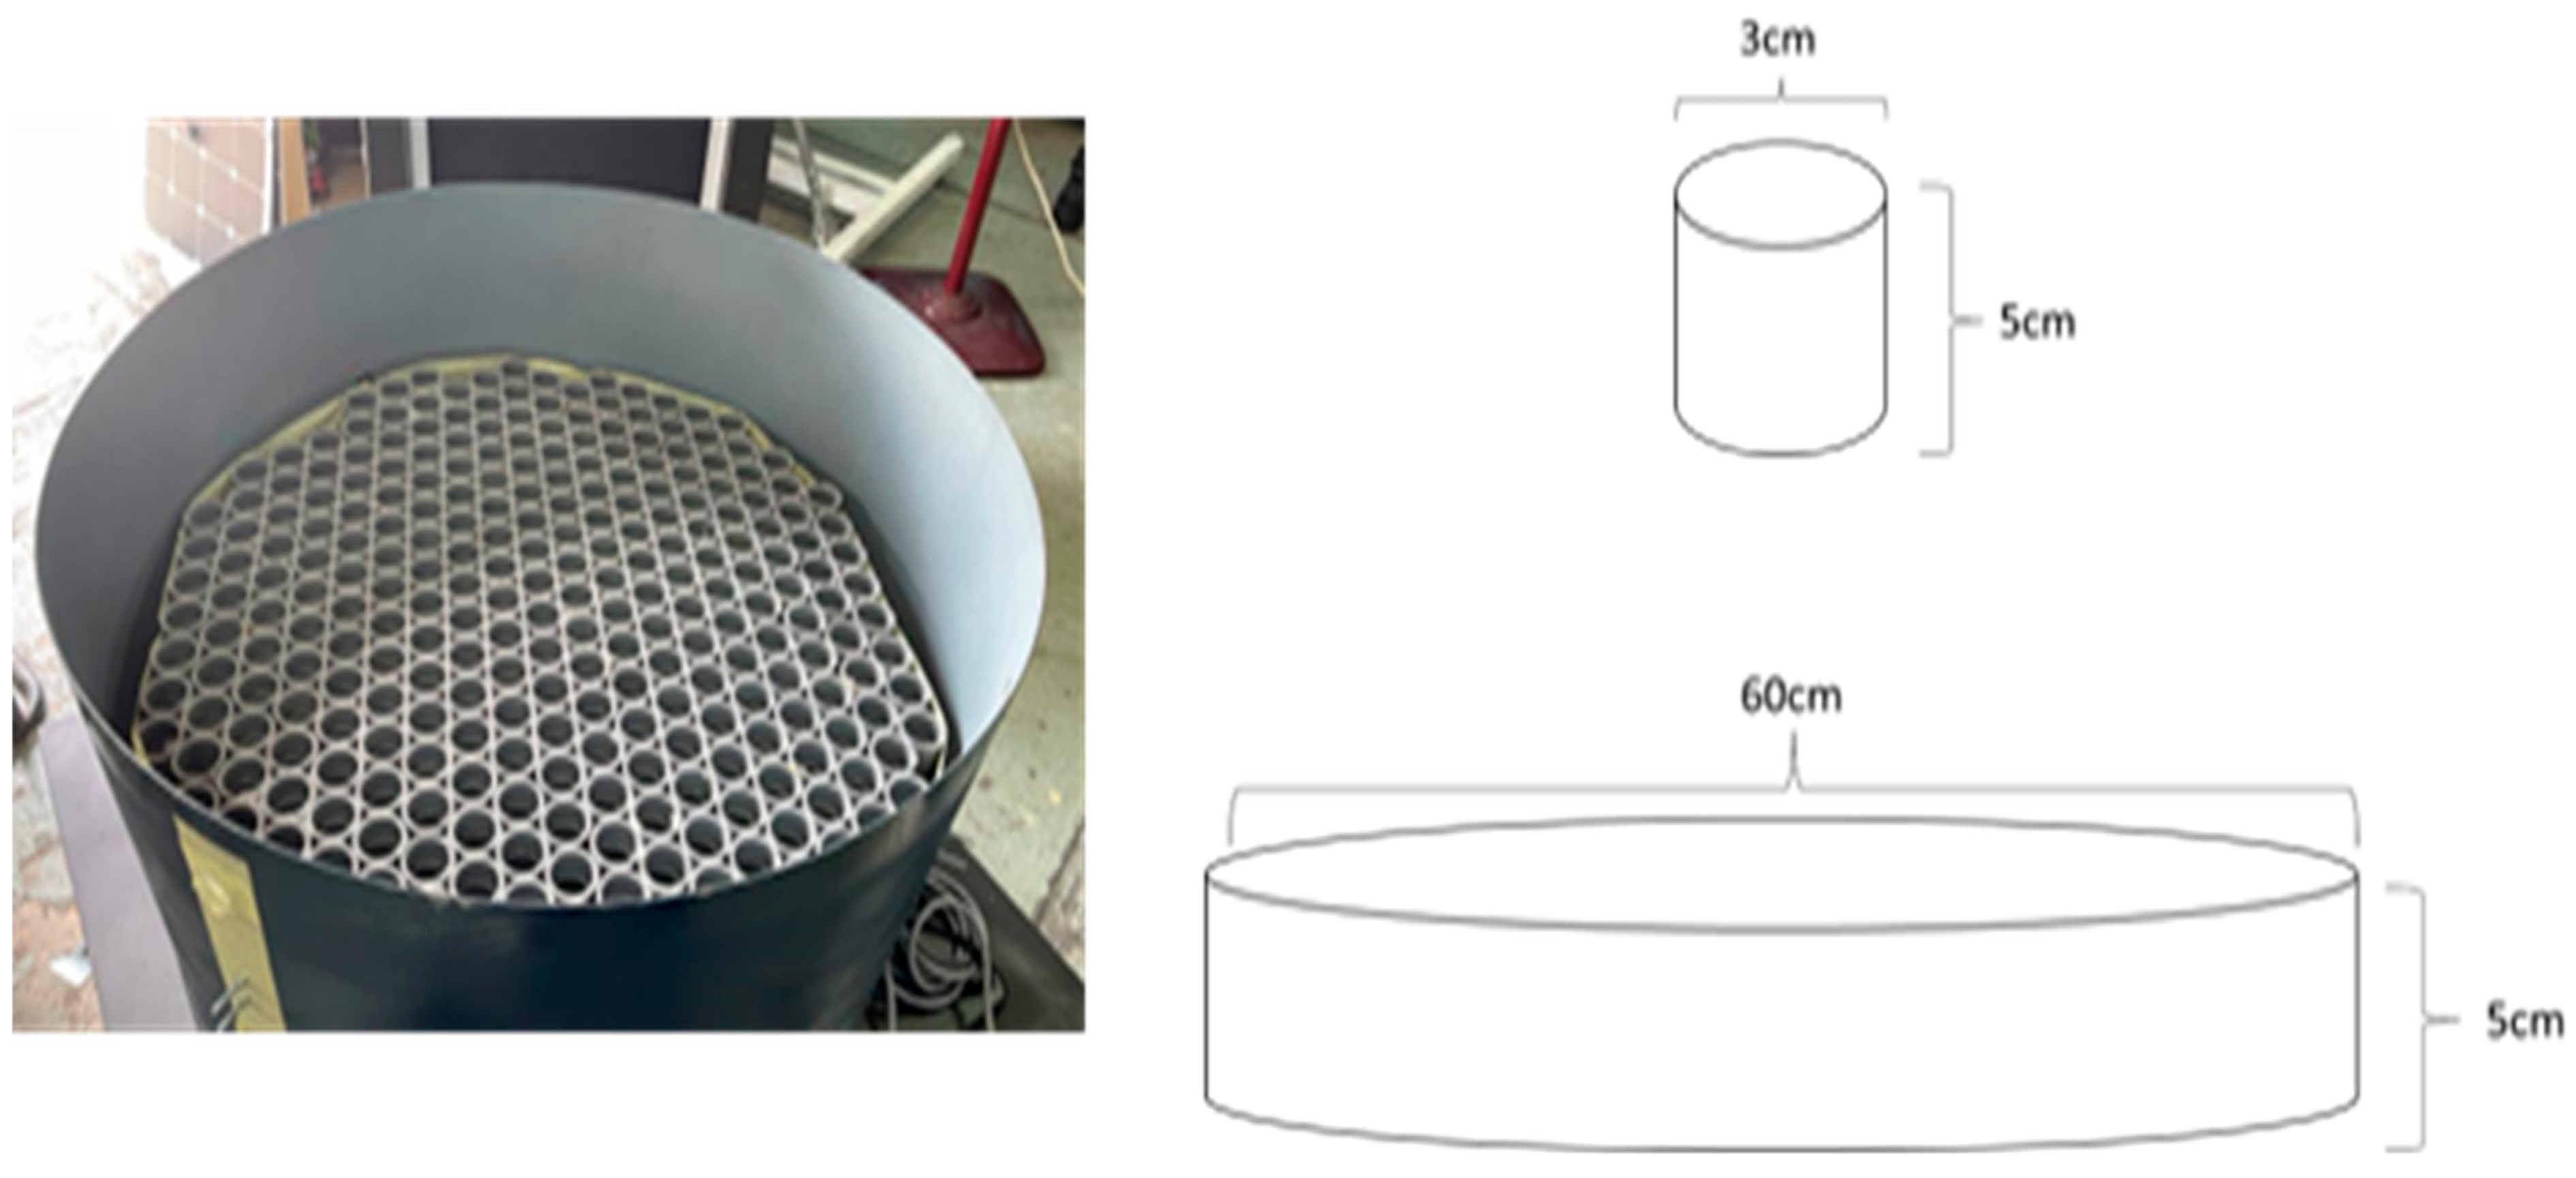
The experimental setup encompassed a comprehensive geometry designed for testing purposes. The construction methodology involved the utilization of personalized 3D printing techniques employing a thermoplastic polyester polylactide (PLA) material. This process facilitated the creation of three distinct duct types: cylindrical, convergent, and divergent. The cylindrical duct, measuring 1000 mm in height and 600 mm in diameter, constituted the primary element. In conjunction, the convergent duct was fashioned with a height of 500 mm, an inlet diameter of 600 mm, and an outlet diameter of 300 mm. Conversely, the divergent duct, standing at a height of 500 mm, comprised an inlet diameter of 300 mm and an outlet diameter of 400 mm. Notably, an alternative approach for the cylindrical duct involved the utilization of a steel sheet, providing a comparative analysis. Additionally, a test cylinder, with a diameter of 300 mm as per the client’s specifications, was integrated into the configuration. To facilitate the airflow dynamics within the system, an axial fan, boasting a diameter of 600 mm, was incorporated into the support base. Table 2 delineates the technical specifications of different sections and Figure 1 and Figure 2 show the detailed geometry of the system and the honeycomb structure, respectively. The recorded velocity of the fan during the experimental process amounted to 2.04 m/s. Further optimization of the axial airflow was achieved by introducing a 5 cm tall honeycomb structure with a 3 cm diameter, aiming to refine the airflow dynamics within the experimental setup.

2.2. CFD Simulation for Stationary Turbine

For a new type of wind turbine that does not align with some of the current assumptions, the equations typically used might not fully capture its performance. As a result, the following section will delve into the behavior of wind flow around the turbine. To comprehend this, a stable computational fluid dynamics (CFD) study was crucial for the ducted horizontal-axis helical wind turbine (DHAHWT). To facilitate this simulation, the Reynolds-averaged Navier–Stokes equation (RANS) using Menter’s shear stress transport (SST) model was employed. RANS was selected as this study aimed to comprehend the overall impact of wind–turbine interactions rather than solely focusing on eddies. Similarly, SST was chosen for its combined characteristics from k-ε and k-ω models, ensuring an improved visualization for both wall-bounded and free-stream flow.
For any given simulation, having an appropriate y + value, a dimensionless parameter is crucial. This value aids in categorizing boundary layers, defining the types of flow patterns near surfaces. The y + value is determined by the following equation:
y + = u · y v
where u is the shear velocity at the nearest wall; y is the absolute cell distance from the nearest wall; and v is the kinematic viscosity. A value of y + less than 5 is considered as sub-laminar. However, a y + value of more than 5 is excellent for the 3D visualization of simulation.
The boundary condition is the interaction between the system and the environment. The boundary conditions in a fluid dynamics study include the velocity inlet and outlet, wall (no-slip/slip), etc. For this topic of study, the boundary conditions were as follows:
  • The domain of the turbine was selected to be solid.
  • The domain of the duct was selected to be non-solid.
  • The fluid material selected was air of equilibrium discharge.
  • Properties of the fluid were user-defined to 30° Celsius.
  • The material at the walls of the duct was selected as polyvinyl chloride (PVC).
  • At the wall, NO SLIP condition was applied.
  • Inlet- and outlet-specified.
  • Outlet pressure was set to adjust in accordance with the ambient pressure to account for the back pressure.
  • Inlet velocity was for the range 1 m/s to 4 m/s.
The simulation was carried out considering the flow to be an incompressible range, hence the continuity equation would apply [18].
ρ u · u = · ρ I + K + F
ρ · u = 0
Here, ‘ u ’ is the fluid velocity, ρ is the fluid pressure, and ρ is the fluid density. ‘F’ represents the external forces that are fluid. However, in Equation (1), no additional forces have been added, hence F can be neglected. The value of K in Equation (1) is given by:
K = μ + μ T u + u T
ρ u · k = · μ + μ T σ k k + P β 0 ρ ω k
ρ u · ω = · μ + μ T σ ω ω + γ μ T ρ P ρ β 0 ω 2 + 2 1 f v 1 σ ω 2 ρ ω k · ω ,       ω = o m
Here, ‘om’ is the specific dissipation rate and ‘ k ’ is the turbulent kinetic energy.
G · G + σ w G · G = 1 + 2 σ w G 4 ,               l ω = 1 G · l r e f 2
Here, ‘G’ is the reciprocal wall distance.
μ T = ρ a 1 k m a x a 1 ω , S f v 2 ,   S = 2 S : S , S = 1 2 u + u T
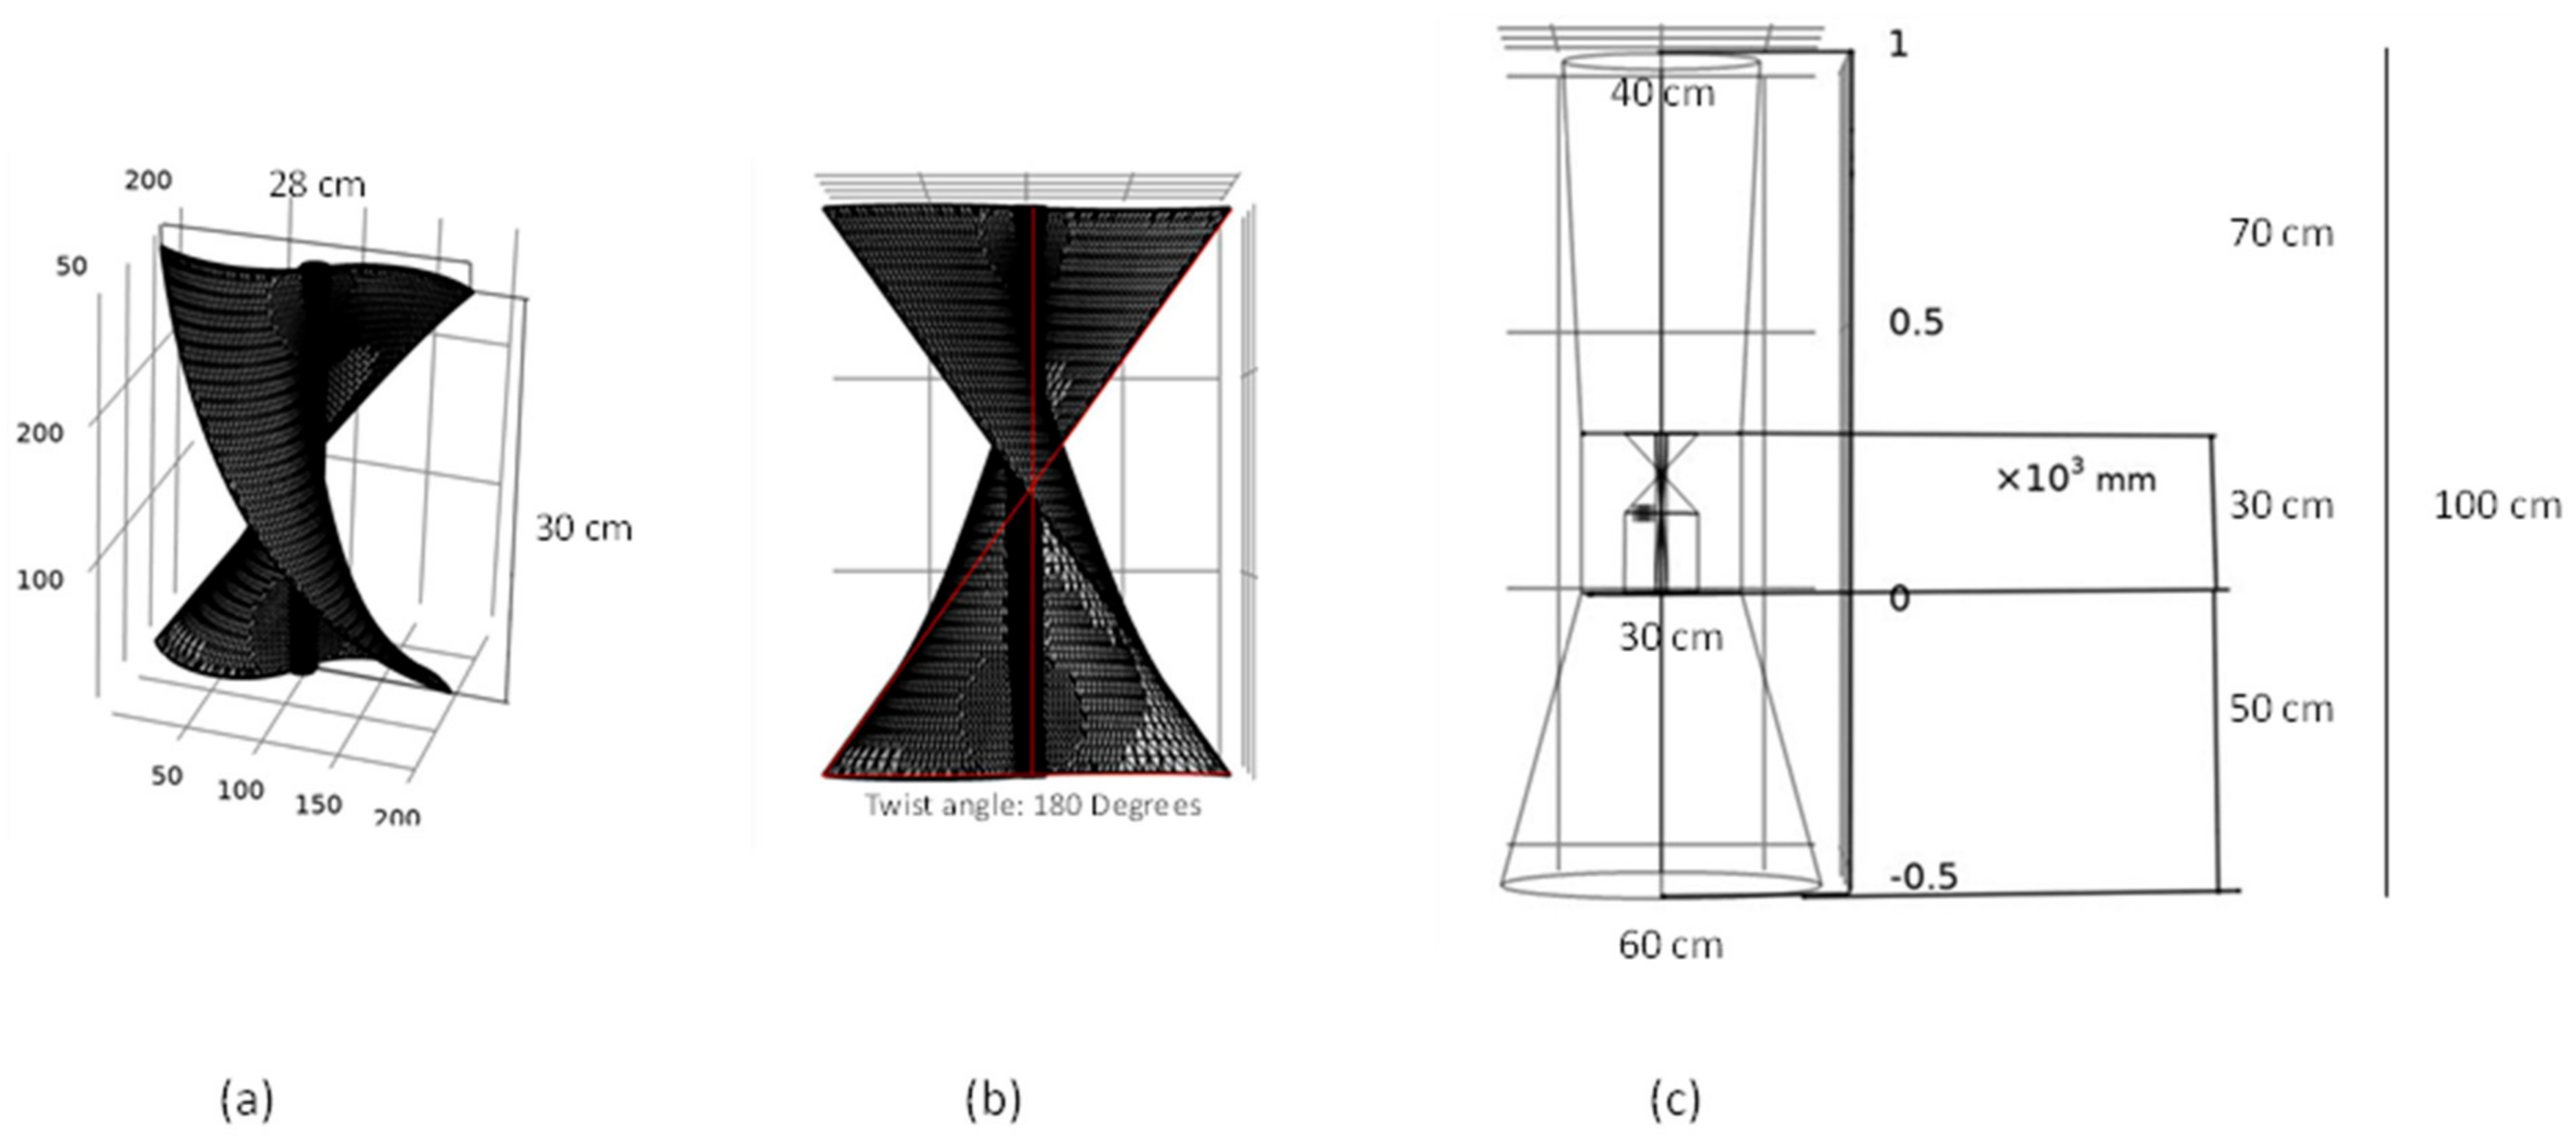
Figure 3 exhibits the schematic of the setup constructed and meshed using COMSOL. A physics-controlled mesh was employed for meshing the setup due to its ability to generate an optimal mesh with minimal errors. Additionally, a study was conducted to ensure the mesh’s independence from the results, investigating the impact of varying mesh sizes. The minimum element size was set at 0.9, the maximum at 13.8, with a maximum element growth rate of 1.08, resulting in an overall mesh quality of 0.234.
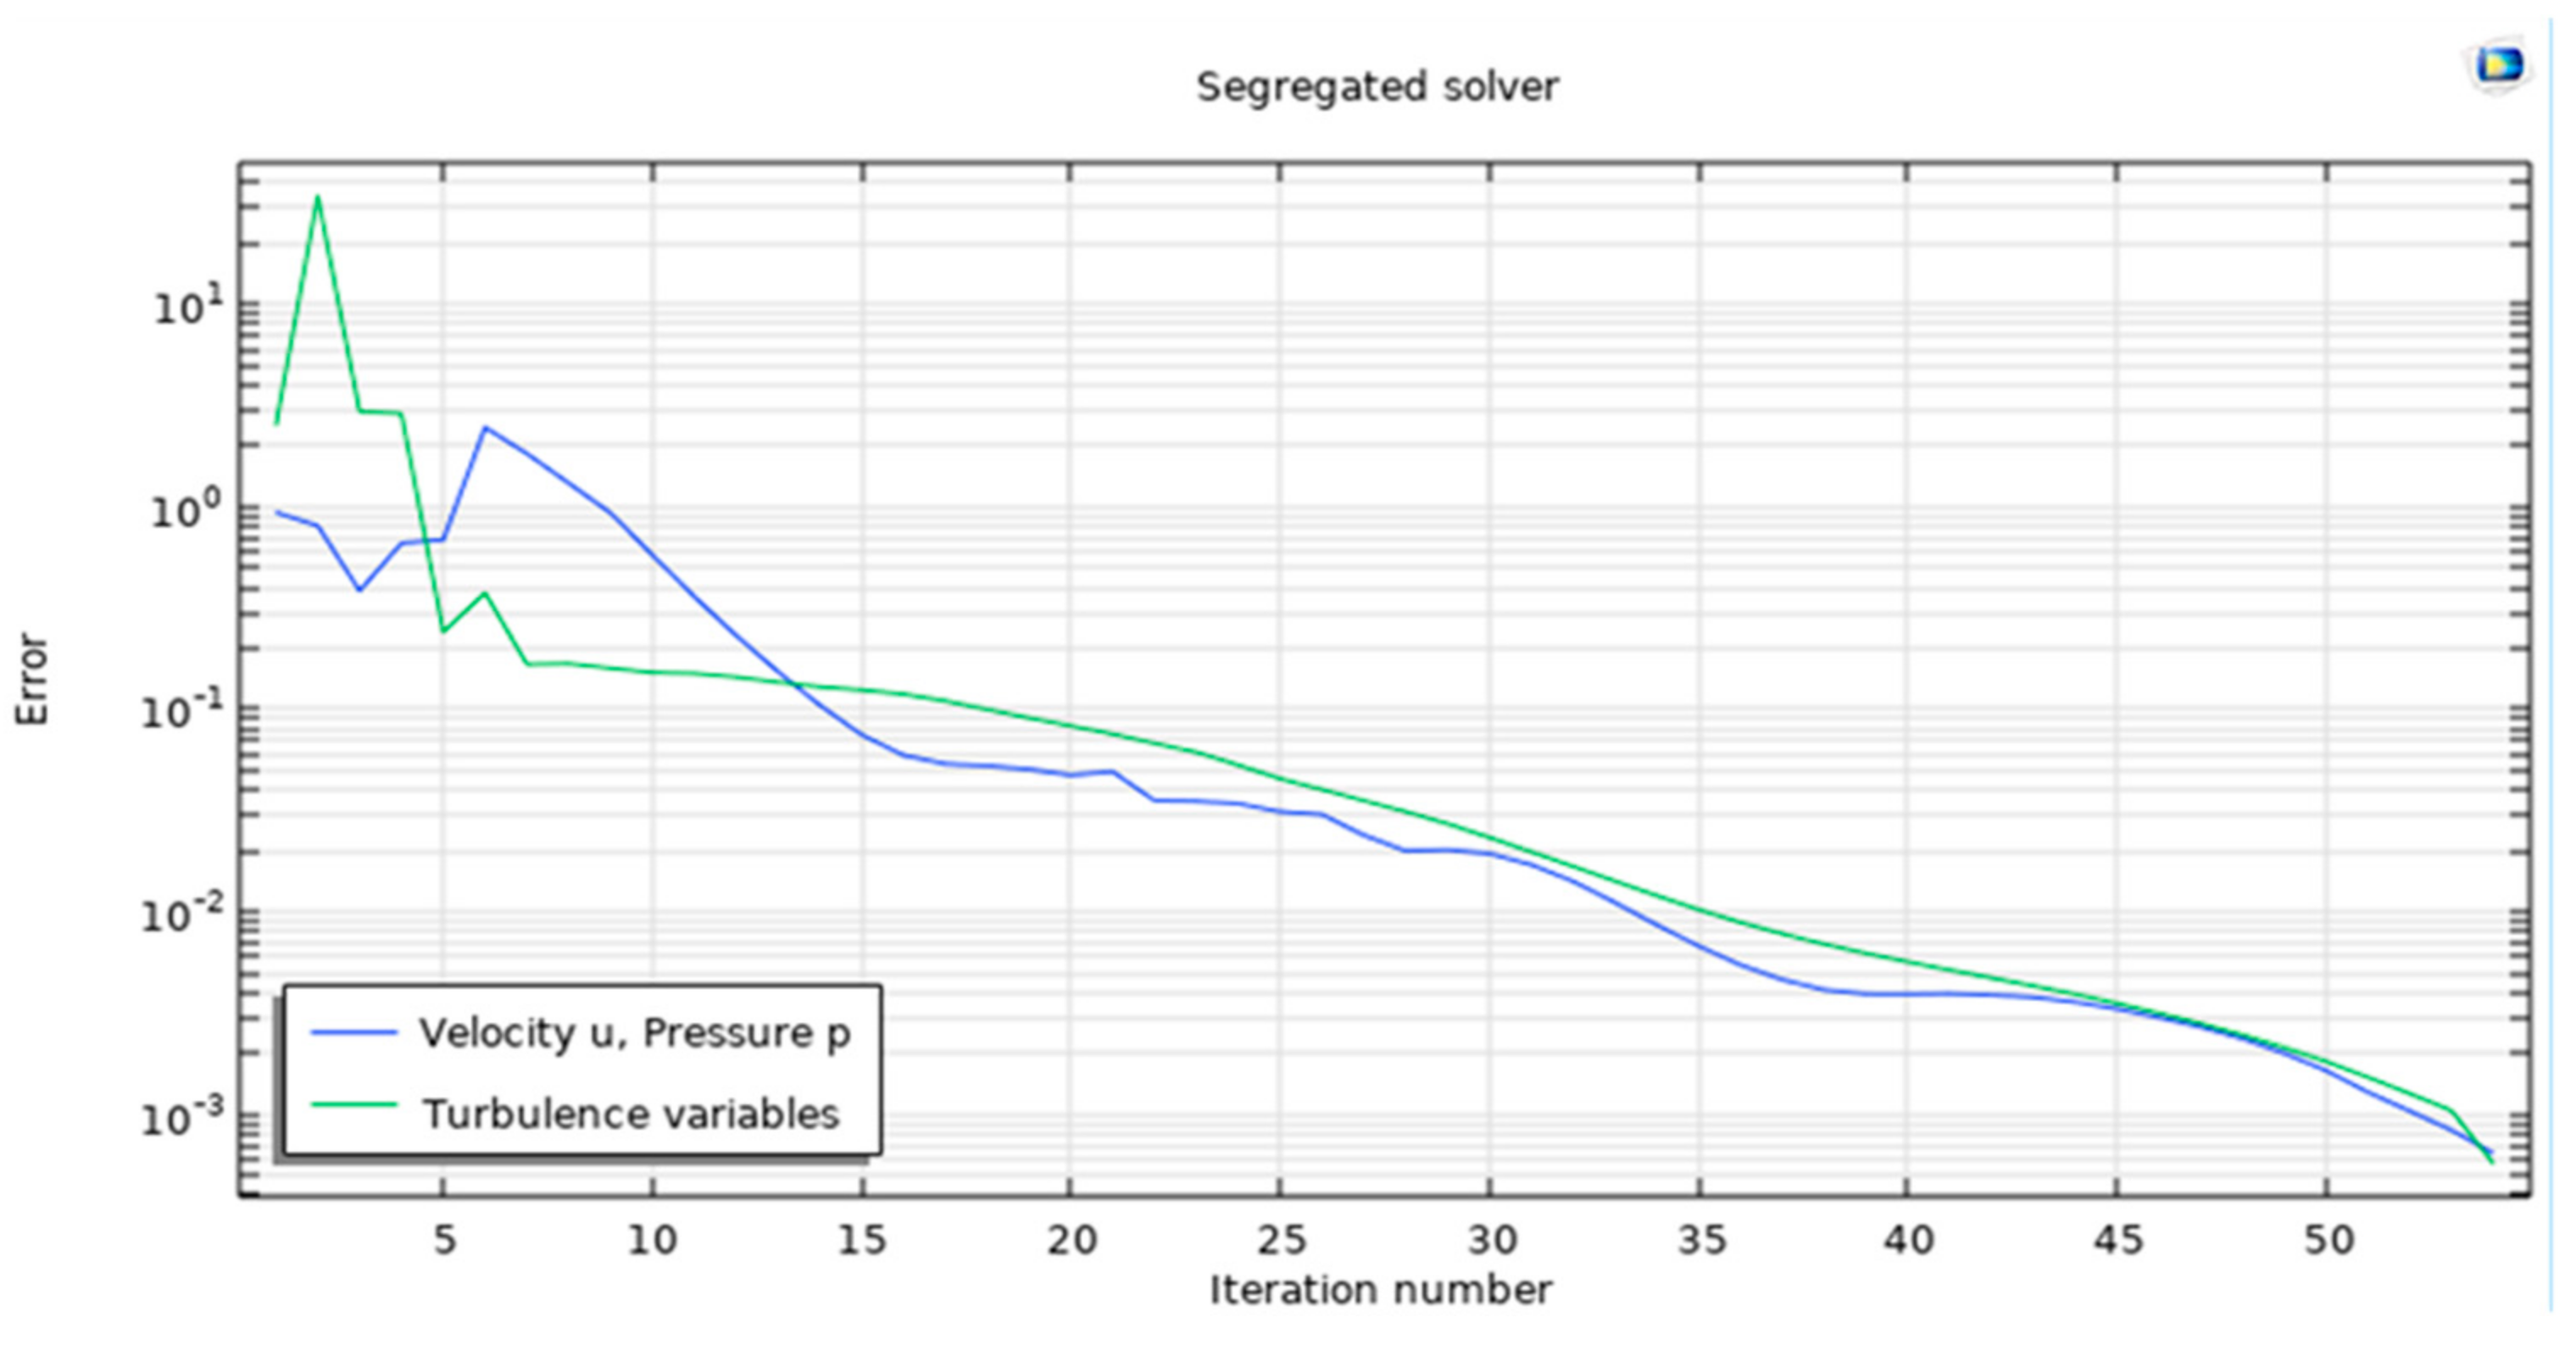
To verify the reliability of the results concerning mesh size, a grid convergence study was undertaken, revealing errors lower than 10−1, which is considered acceptable within industrial standards, as depicted in Figure 4.

2.3. Experimental Evaluation

Three primary parameters are commonly used to characterize the performance of a wind turbine: the power coefficient, the torque coefficient, and the overall efficiency. The power coefficient measures the amount of mechanical power generated by the wind turbine relative to the total available wind power. Mathematically, it is determined using the following expression [19,20]:
C p = P m e c h 1 2 ρ π r t 2 u 3
In the denominator of Equation (8), the total available wind power passing through the swept area of the wind turbine rotor is denoted. The second parameter, the torque coefficient, measures the shaft torque generated by the turbine rotor. A higher torque coefficient enables the wind turbine to start and operate at lower wind speeds. In certain applications, such as water pumping, the shaft torque is more critical than the power output. In these cases, the torque coefficient becomes the primary characteristic of the wind turbine. Mathematically, the torque coefficient ( C Q ) is given as follows [21]:
C Q = C P λ
The tip-speed ratio, denoted as λ , is the ratio of the blade tip speed to the free wind speed. The power and torque coefficients solely characterize the performance of the wind turbine rotor and do not account for losses from other components such as the electric generator, bearings, and gearbox. The third parameter, overall efficiency, is defined as the net electric power produced relative to the total available wind power. It is expressed as follows:
η = P e l e c 1 2 ρ π r t 2 u 3
In Equation (10), the denominator 1 2 ρ π r t 2 u 3 represents the total power available in the wind that can be captured by the turbine blades, while the numerator P e l e c represents the actual electrical power generated by the turbine. The efficiency η thus measures how effectively the wind turbine converts the available wind energy into electrical energy.

2.3.1. Measuring Velocity

In this investigation, velocity assessment was conducted using a hotwire anemometer. Velocity measurements were obtained at multiple positions indicated in Figure 5. To ensure precise velocity readings, each location was divided into concentric circles of equal surface areas. While it is theoretically expected that fluid flow will fully develop within the system, real-world conditions may cause deviations, potentially causing a more turbulent flow pattern. Additionally, the impact of the inflow fan might introduce both axial and circular components to the flow. Therefore, each concentric circle was analyzed to determine both the axial and circular velocities.

2.3.2. Measuring Electrical Output

The RPM was measured using a non-contact-type digital tachometer. The wind turbine’s generator was linked to a resistance box, which, in turn, connected to a multi-meter to quantify the voltage. Alterations in load resistance were achieved through adjustments in the resistance box while maintaining a constant wind velocity, allowing for the recording of the resultant output voltage. This process involved conducting multiple iterations of experiments under specified loading conditions and various wind speeds. Continuous data streams for voltage and current were logged, subsequently computing the arithmetic mean to establish representative values for the respective variables.

3. Results and Discussion

3.1. Air Velocity Profile

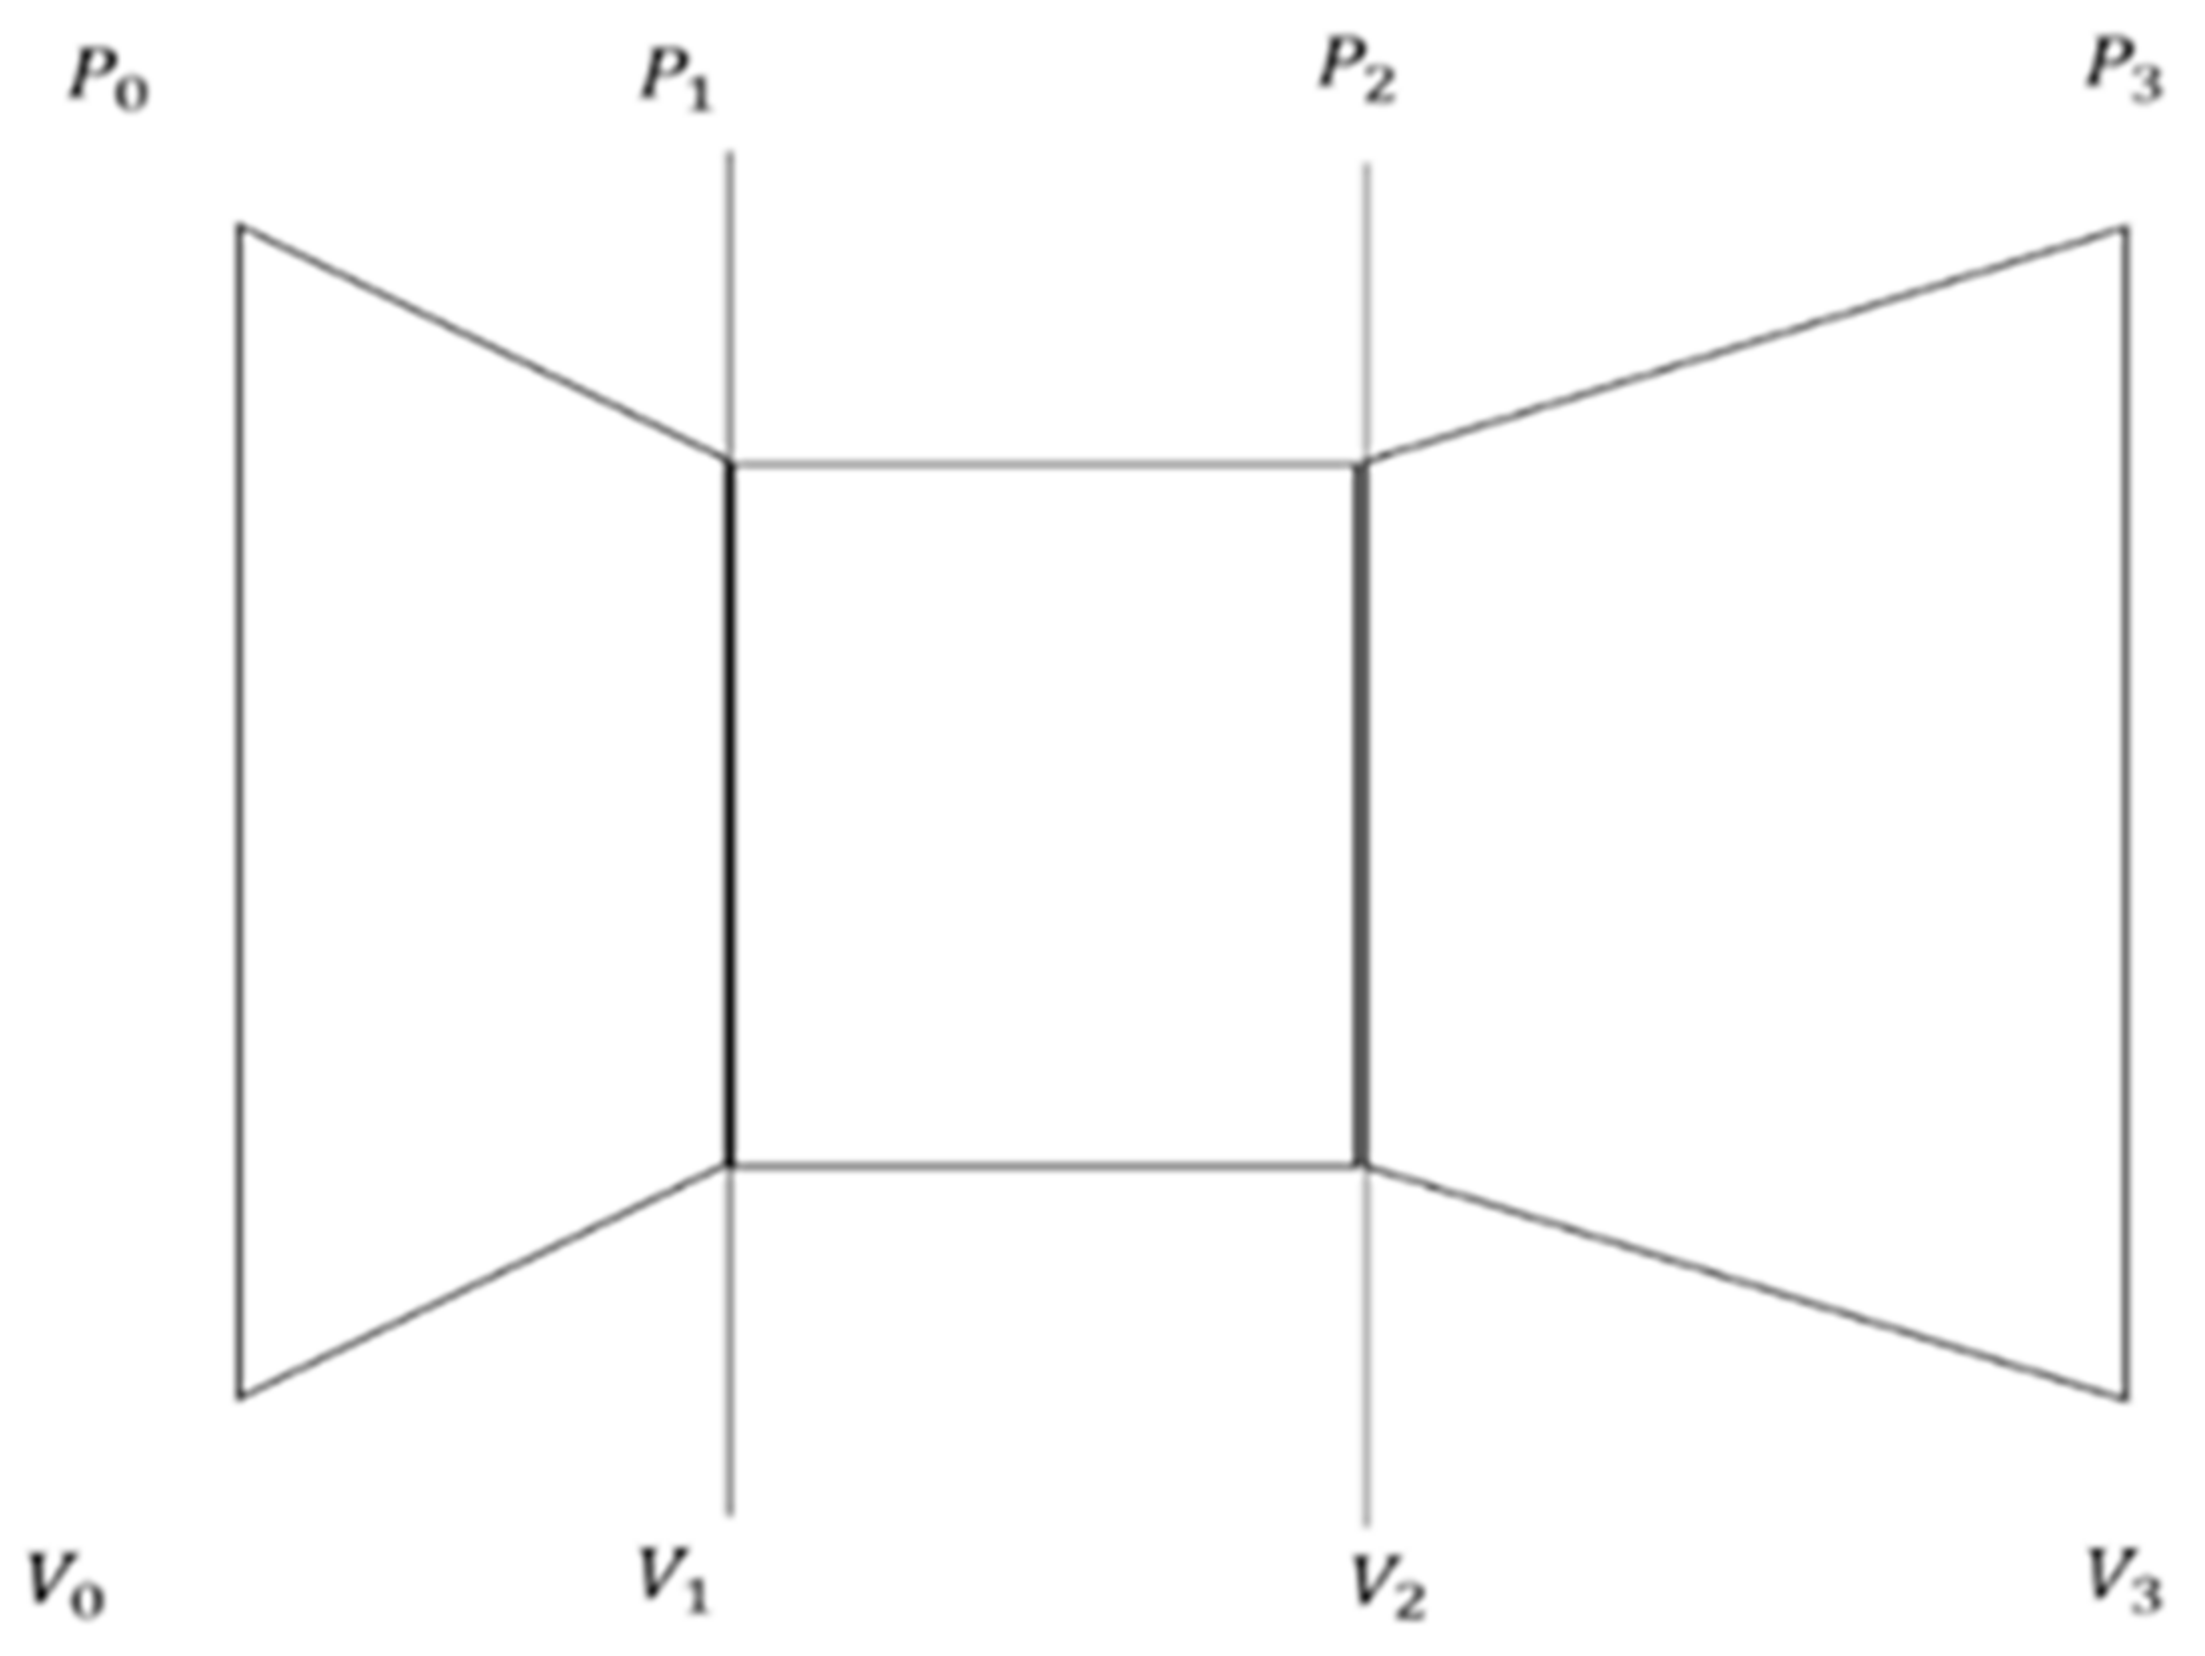
Figure 6 introduces the indexes used at various locations. Here, the ambient pressure is noted as P0, V1 is the velocity just before the turbine, P1 is the pressure just before the turbine, and P2 and V2 are the downwash pressure and velocity of the turbine, respectively. Finally, P3 and V3 represent the exit pressure and velocity, respectively.
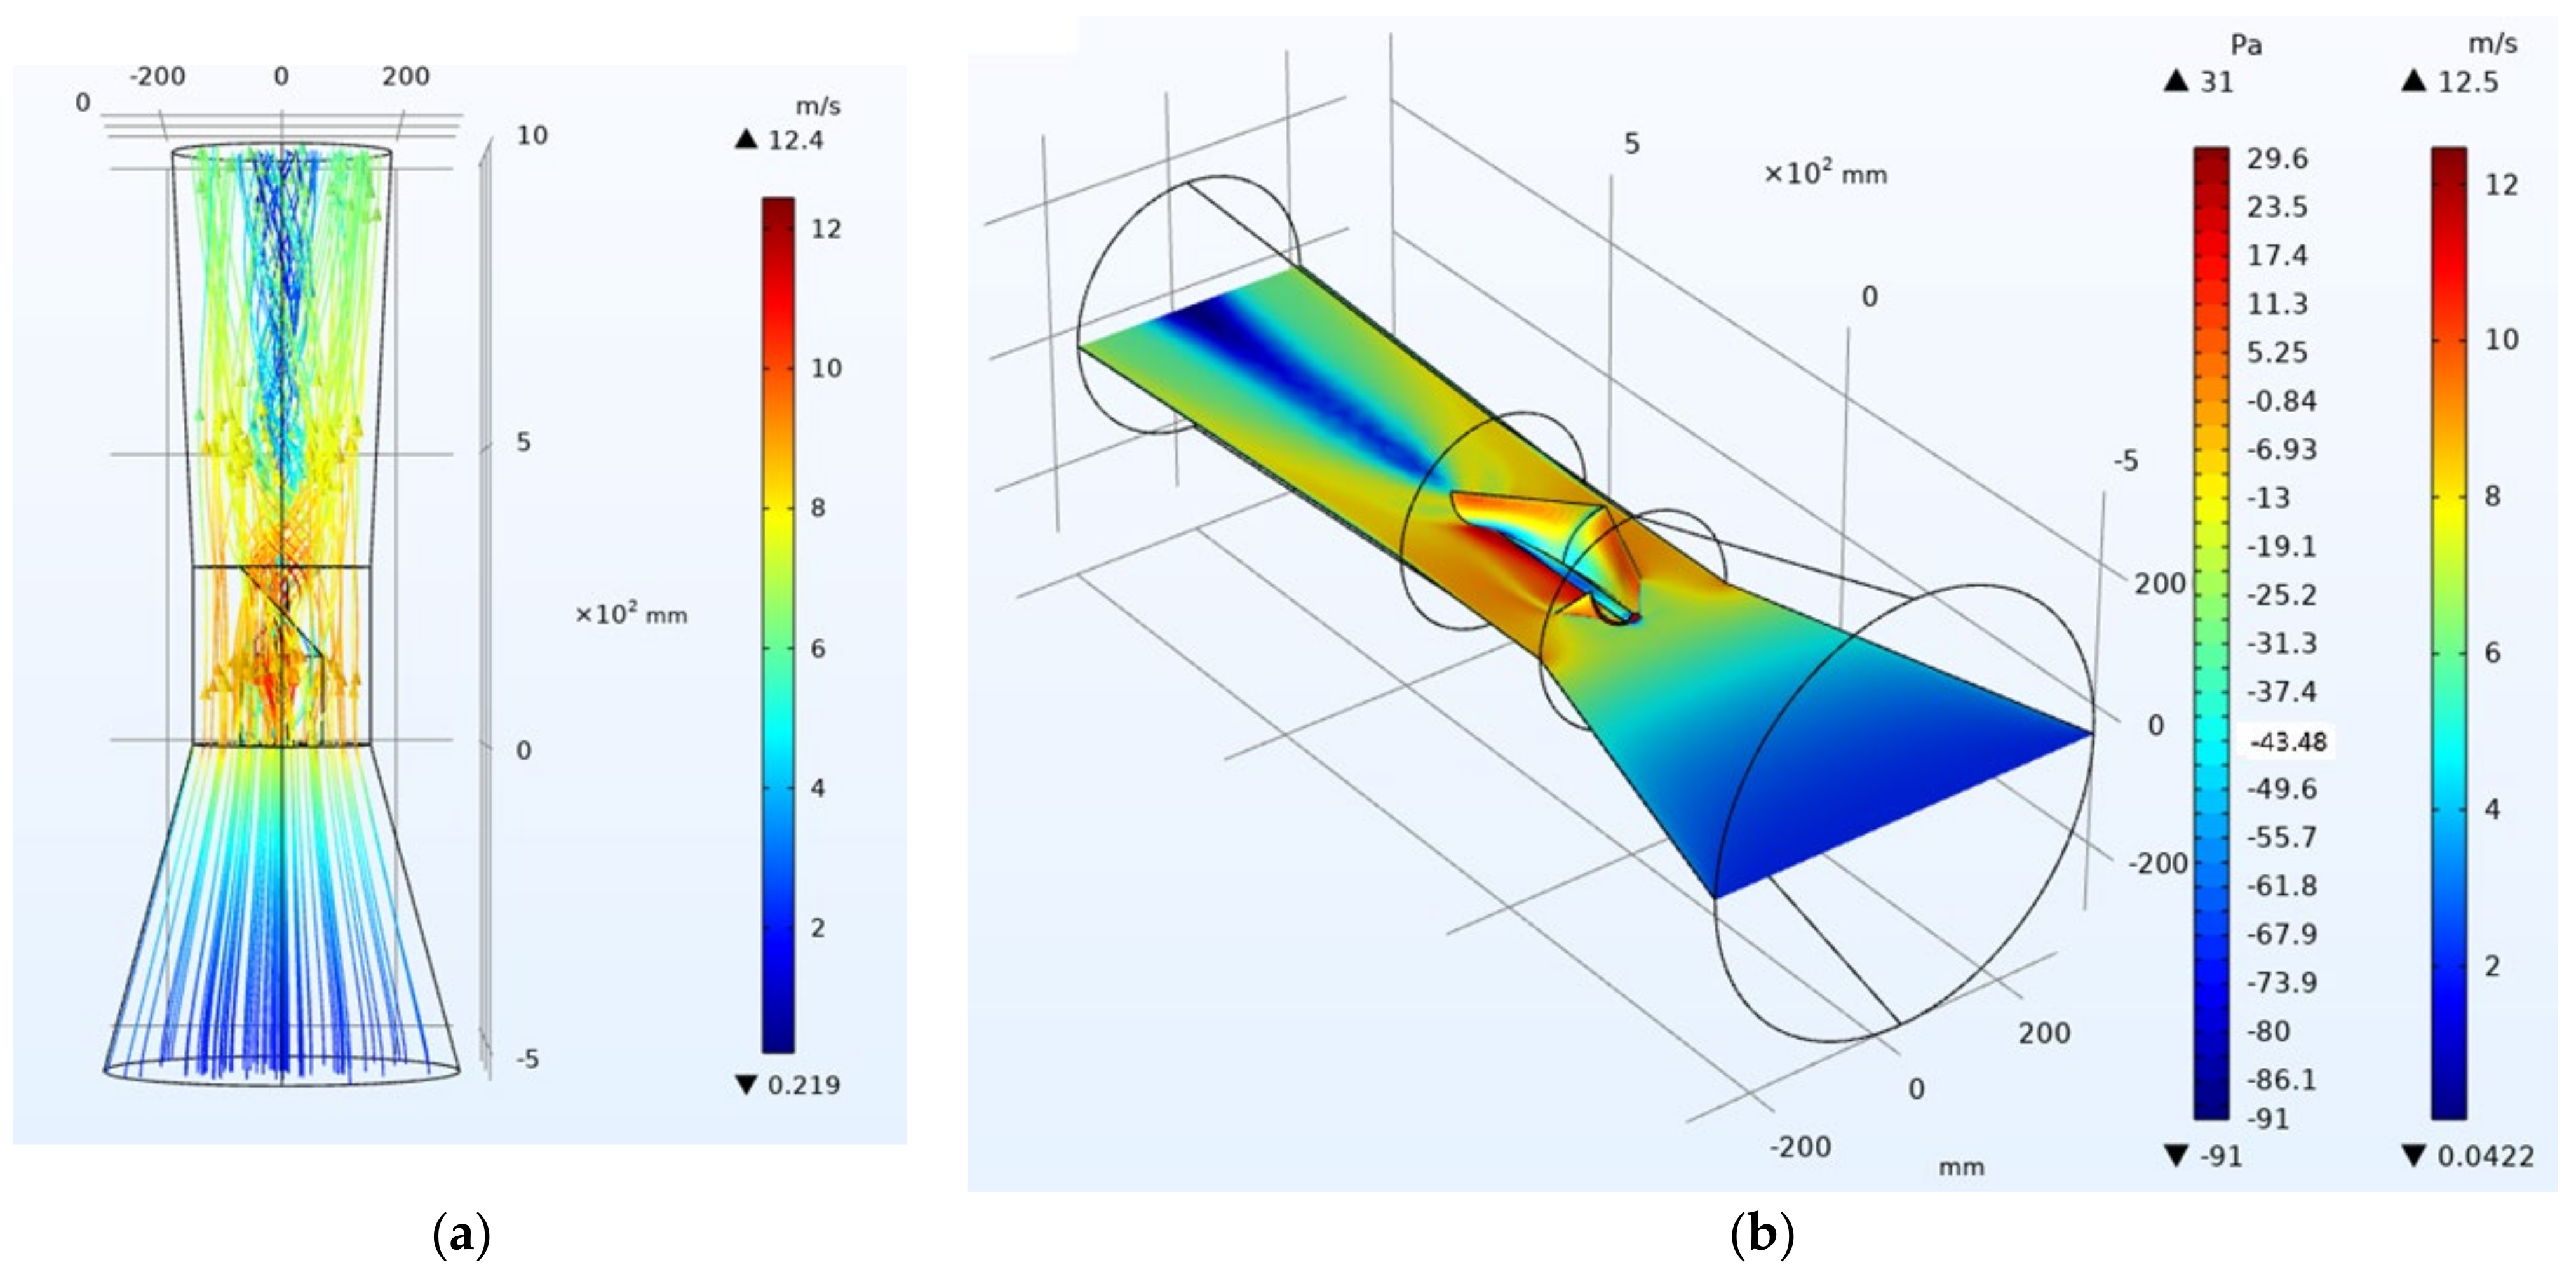
Figure 7 illustrates that the velocity before (V1) and after (V2) in the turbine remains equivalent, contradicting the actuator disk theory’s presumption of decreased velocity post-turbine. This discrepancy may arise from the airflow characteristics within the turbine. Additionally, a velocity gradient is evident across the turbine, indicating potential variation in the thrust throughout. The velocity curvature implies the presence of diverse velocity types within the turbine area, necessitating consideration of axial (Va) and tangential (Vc) velocities. Va is notable nearer the central axis, while Vc occurs between the central axis and the underside of the blade edge. Gathering more velocity profile data was essential to comprehensively understand this pattern, as further elaborated in the subsequent section.
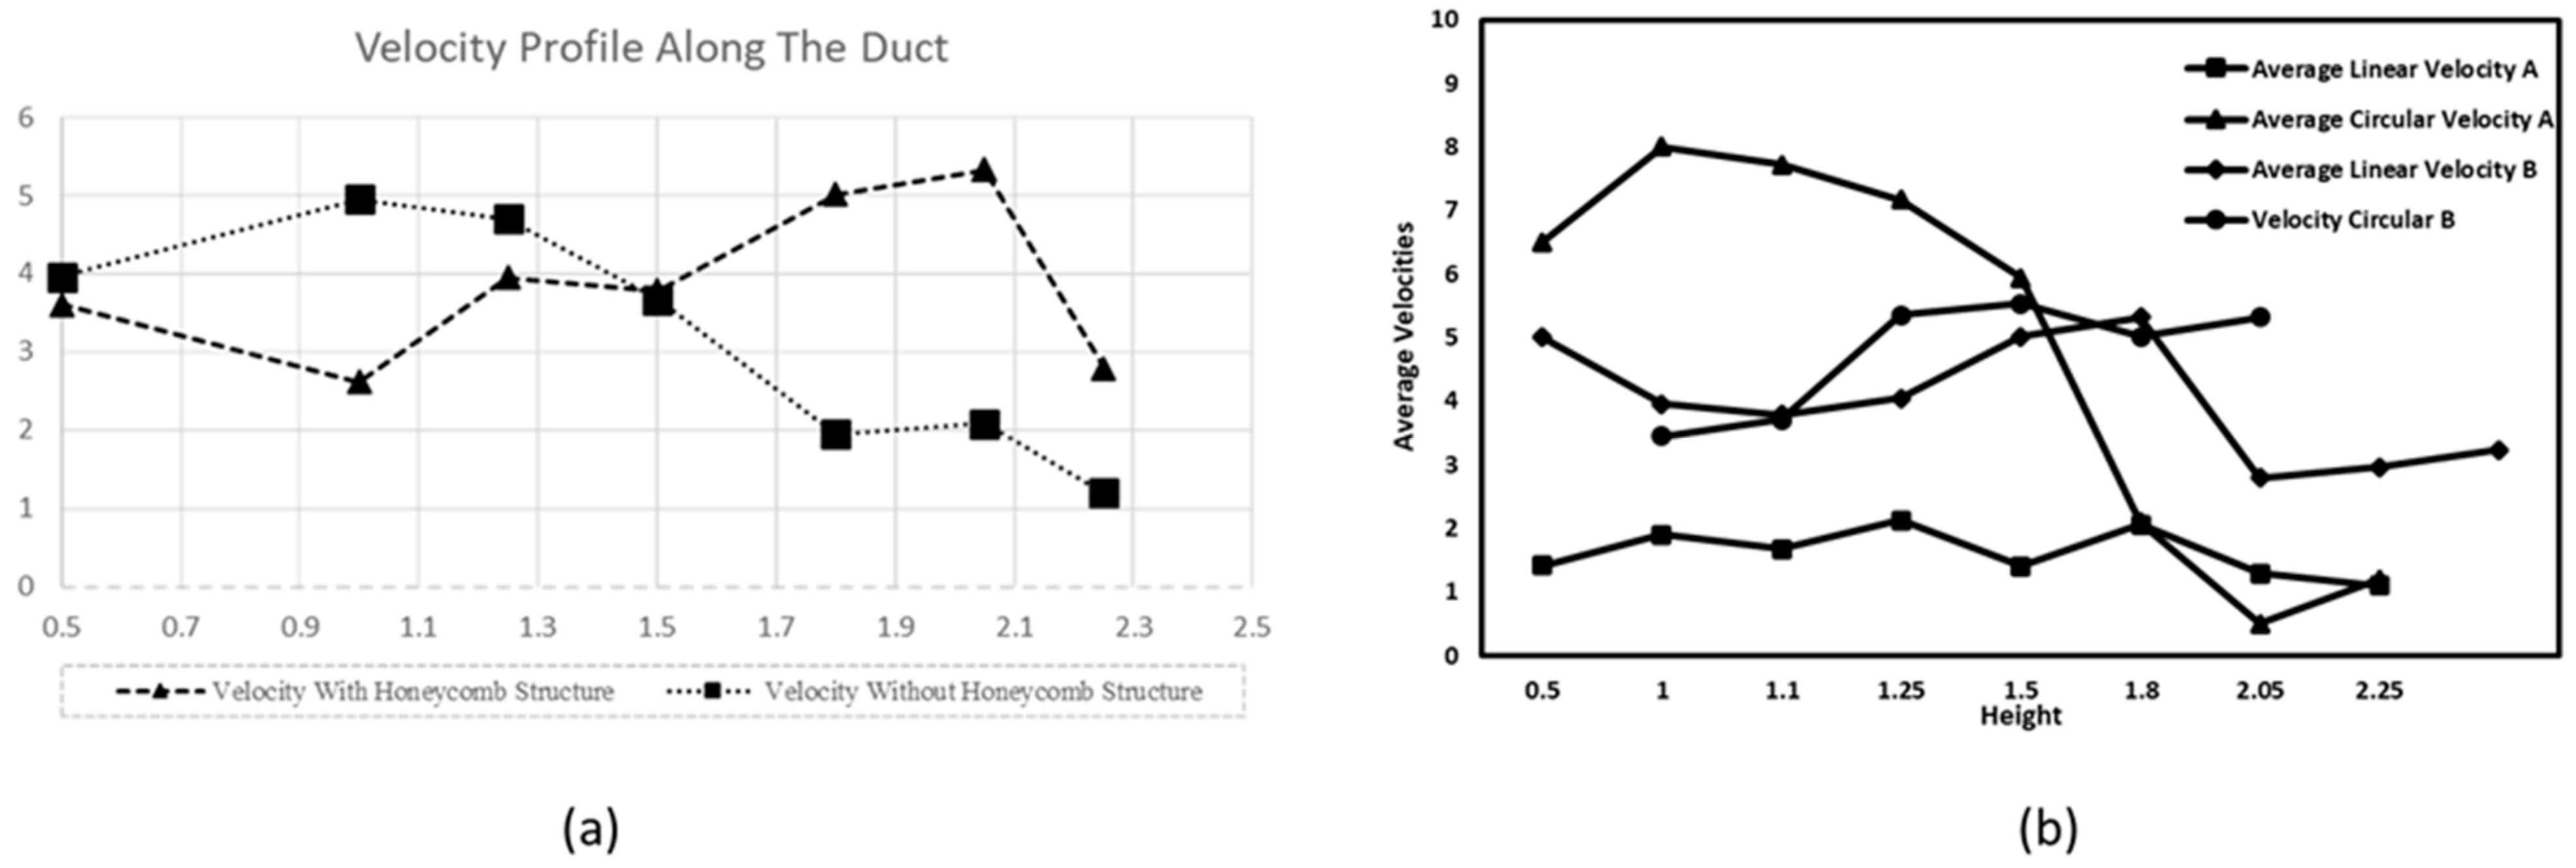
An interesting observation, depicted in Figure 7 and supported by the experimental data in Figure 8, revolves around the input and output velocities. The inlet velocity measures approximately 5 m/s, while the downwash velocity registers at 5.3 m/s. This velocity distribution suggests the absence of an axial induction factor, indicating a departure from the turbine’s behavior that resembles that of a semi-permeable disk towards functioning more like a funnel. This transformation promotes smoother airflow through the turbine, increasing the mass flow and potentially contributing to heightened power output.
Initial tests on the prototype (Figure 5) unveiled a prevailing circular wind profile, prominently displayed in Figure 8. At 1.5 m height (the turbine’s incoming velocity), the maximum linear velocity measured 1.4 m/s. In contrast, the circular wind profile peaked at 5.9 m/s, averaging an overall velocity of 3.6 m/s. This dominance of the circular wind profile, coupled with the notably low linear velocity, adversely affected the wind turbine performance, evident in a maximum RPM of 150.
Significant alterations occurred following the introduction of a honeycomb structure. Figure 8b depicts a rise in the average linear velocity at 1.5 m height to 4.05 m/s, accompanied by a slight decrease in the circular velocity to 5.5 m/s. This enhancement elevated the average velocity to 5 m/s, positively impacting the RPM. With the turbine enclosure, the RPM measured 830RPM; meanwhile, without it, it registered at 650RPM. This RPM variance can be attributed to the differing mass flow through the turbine. The enclosure concentrates airflow, thus augmenting mass flow, while its absence allows dispersion, reducing mass flow. Examination of the wind profile across the test rig indicated no adverse force on the system.

3.2. Wind Turbine Performance

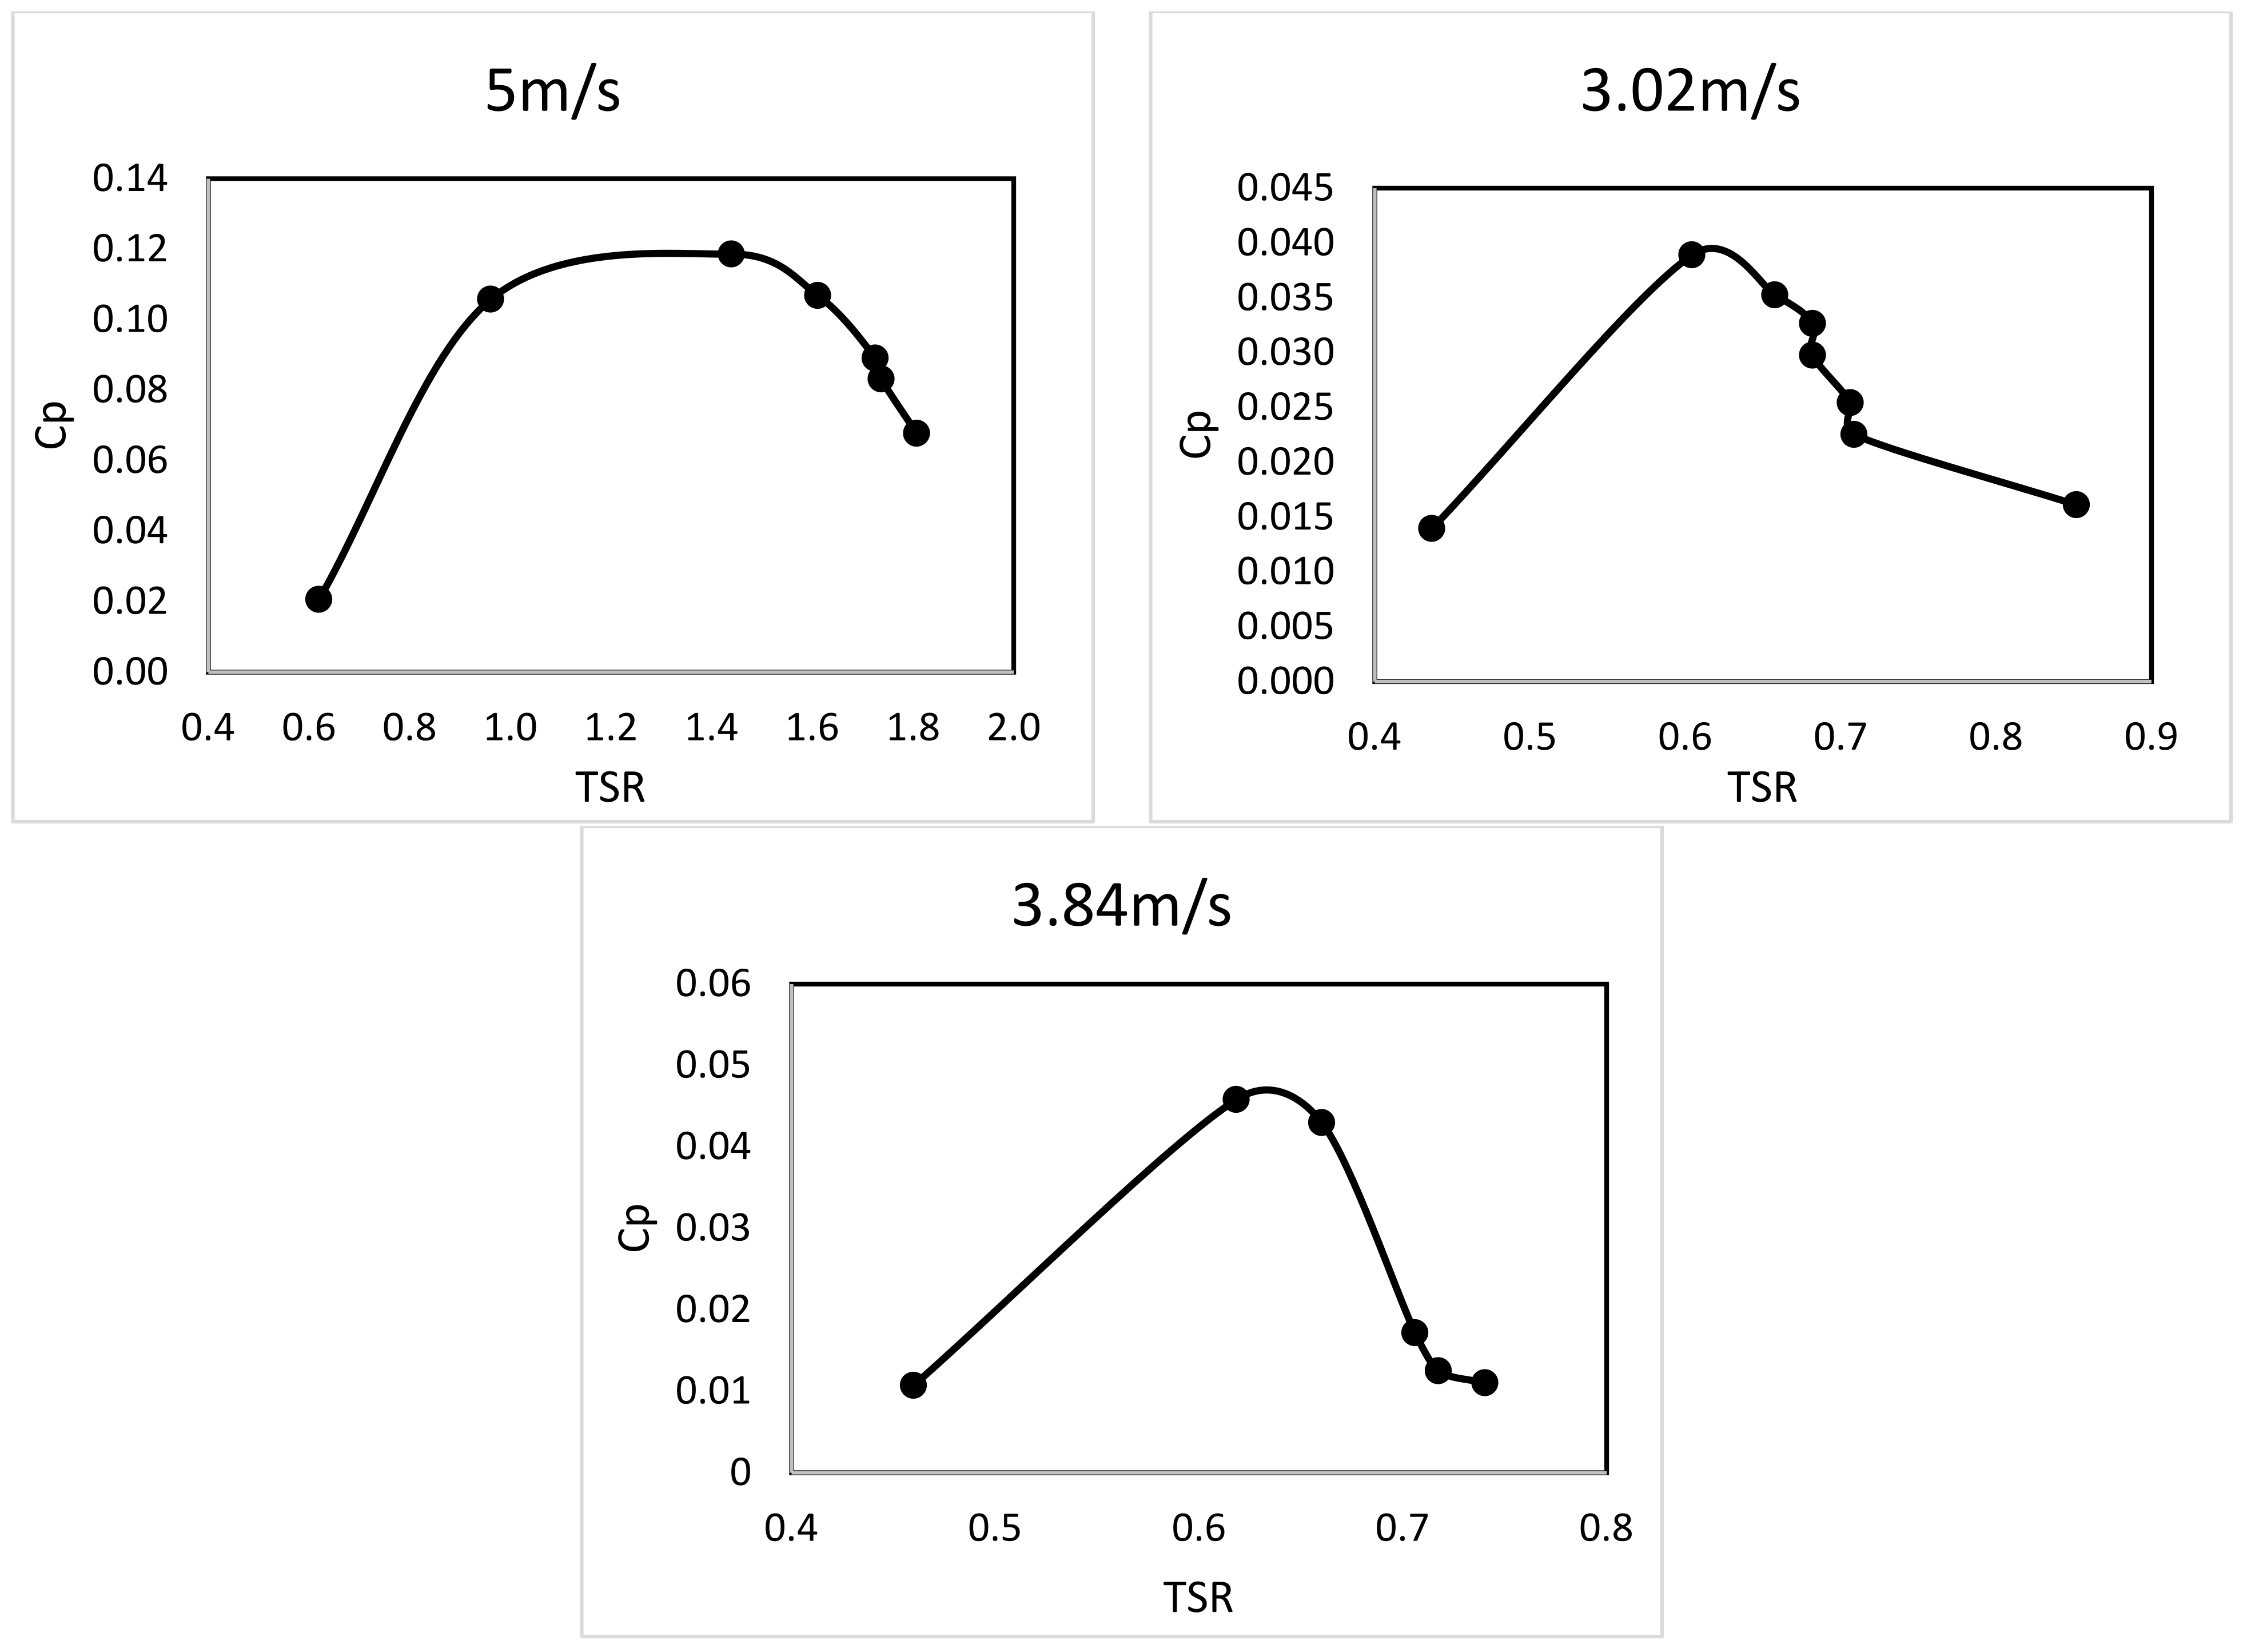
Understanding a wind turbine’s performance requires grasping the relationship between Cp (power coefficient) and TSR (tip-speed ratio). Within the scope of the current study, the system was tested under incoming wind speeds of 5 m/s, 3.84 m/s, and 3.02 m/s, chosen due to system constraints. However, Figure 9 demonstrates a consistent trend across all velocities. At 5 m/s, the graph peaks at approximately 0.2 Cp with a TSR of 1.4. Similarly, for the 3.84 m/s data, the Cp peaks at nearly 0.05 with a TSR slightly above 0.6. In the case of 3.02 m/s, the peak Cp is approximately 0.04 with a TSR of 0.6.
The results from Figure 9 also point towards the fact that the efficiency of the turbine increases with the increase in wind speed. Another point that comes to mind looking at the graphs is that the TSR changes to a significant extent with the change in velocity. Further, when comparing the power output to the resistance at varying wind velocities as in Figure 10, it was seen that in all three cases, the power output peaked between 1000 ohms and 1400 ohms, with performance at 5 m/s peaking at just under 0.6 W at 1000 ohms, at 3.84 m/s, the output was just under 0.1 W at 1200 ohms, and approximately 0.038 W at w1400 ohms at 3.02 m.s.
In wind turbine research, evaluating system performance involves considering torque, which is a pivotal factor. Torque represents the rotational force induced by wind acting upon the turbine. Figure 11 illustrates the correlation between torque and RPM, revealing a consistent trend across all velocities. This trend exhibits a torque surge followed by an exponential decline. At 5 m/s, the peak torque occurs at 328 RPM, diminishing to 0.014 Nm, while the minimum torque recorded is 0.004 Nm. Similarly, for 3.84 m/s and 3.02 m/s, the lowest torques observed are 0.002 Nm and 0.0015 Nm, respectively, with peaks slightly above 0.005 Nm and just above 0.003 Nm. This trend implies the requirement for optimal torques of 0.014 Nm, 0.005 Nm, and 0.003 Nm at 5 m/s, 3.84 m/s, and 3.02 m/s, respectively. Moreover, it suggests that higher RPMs demand considerably less torque, leading to reduced efficiency.
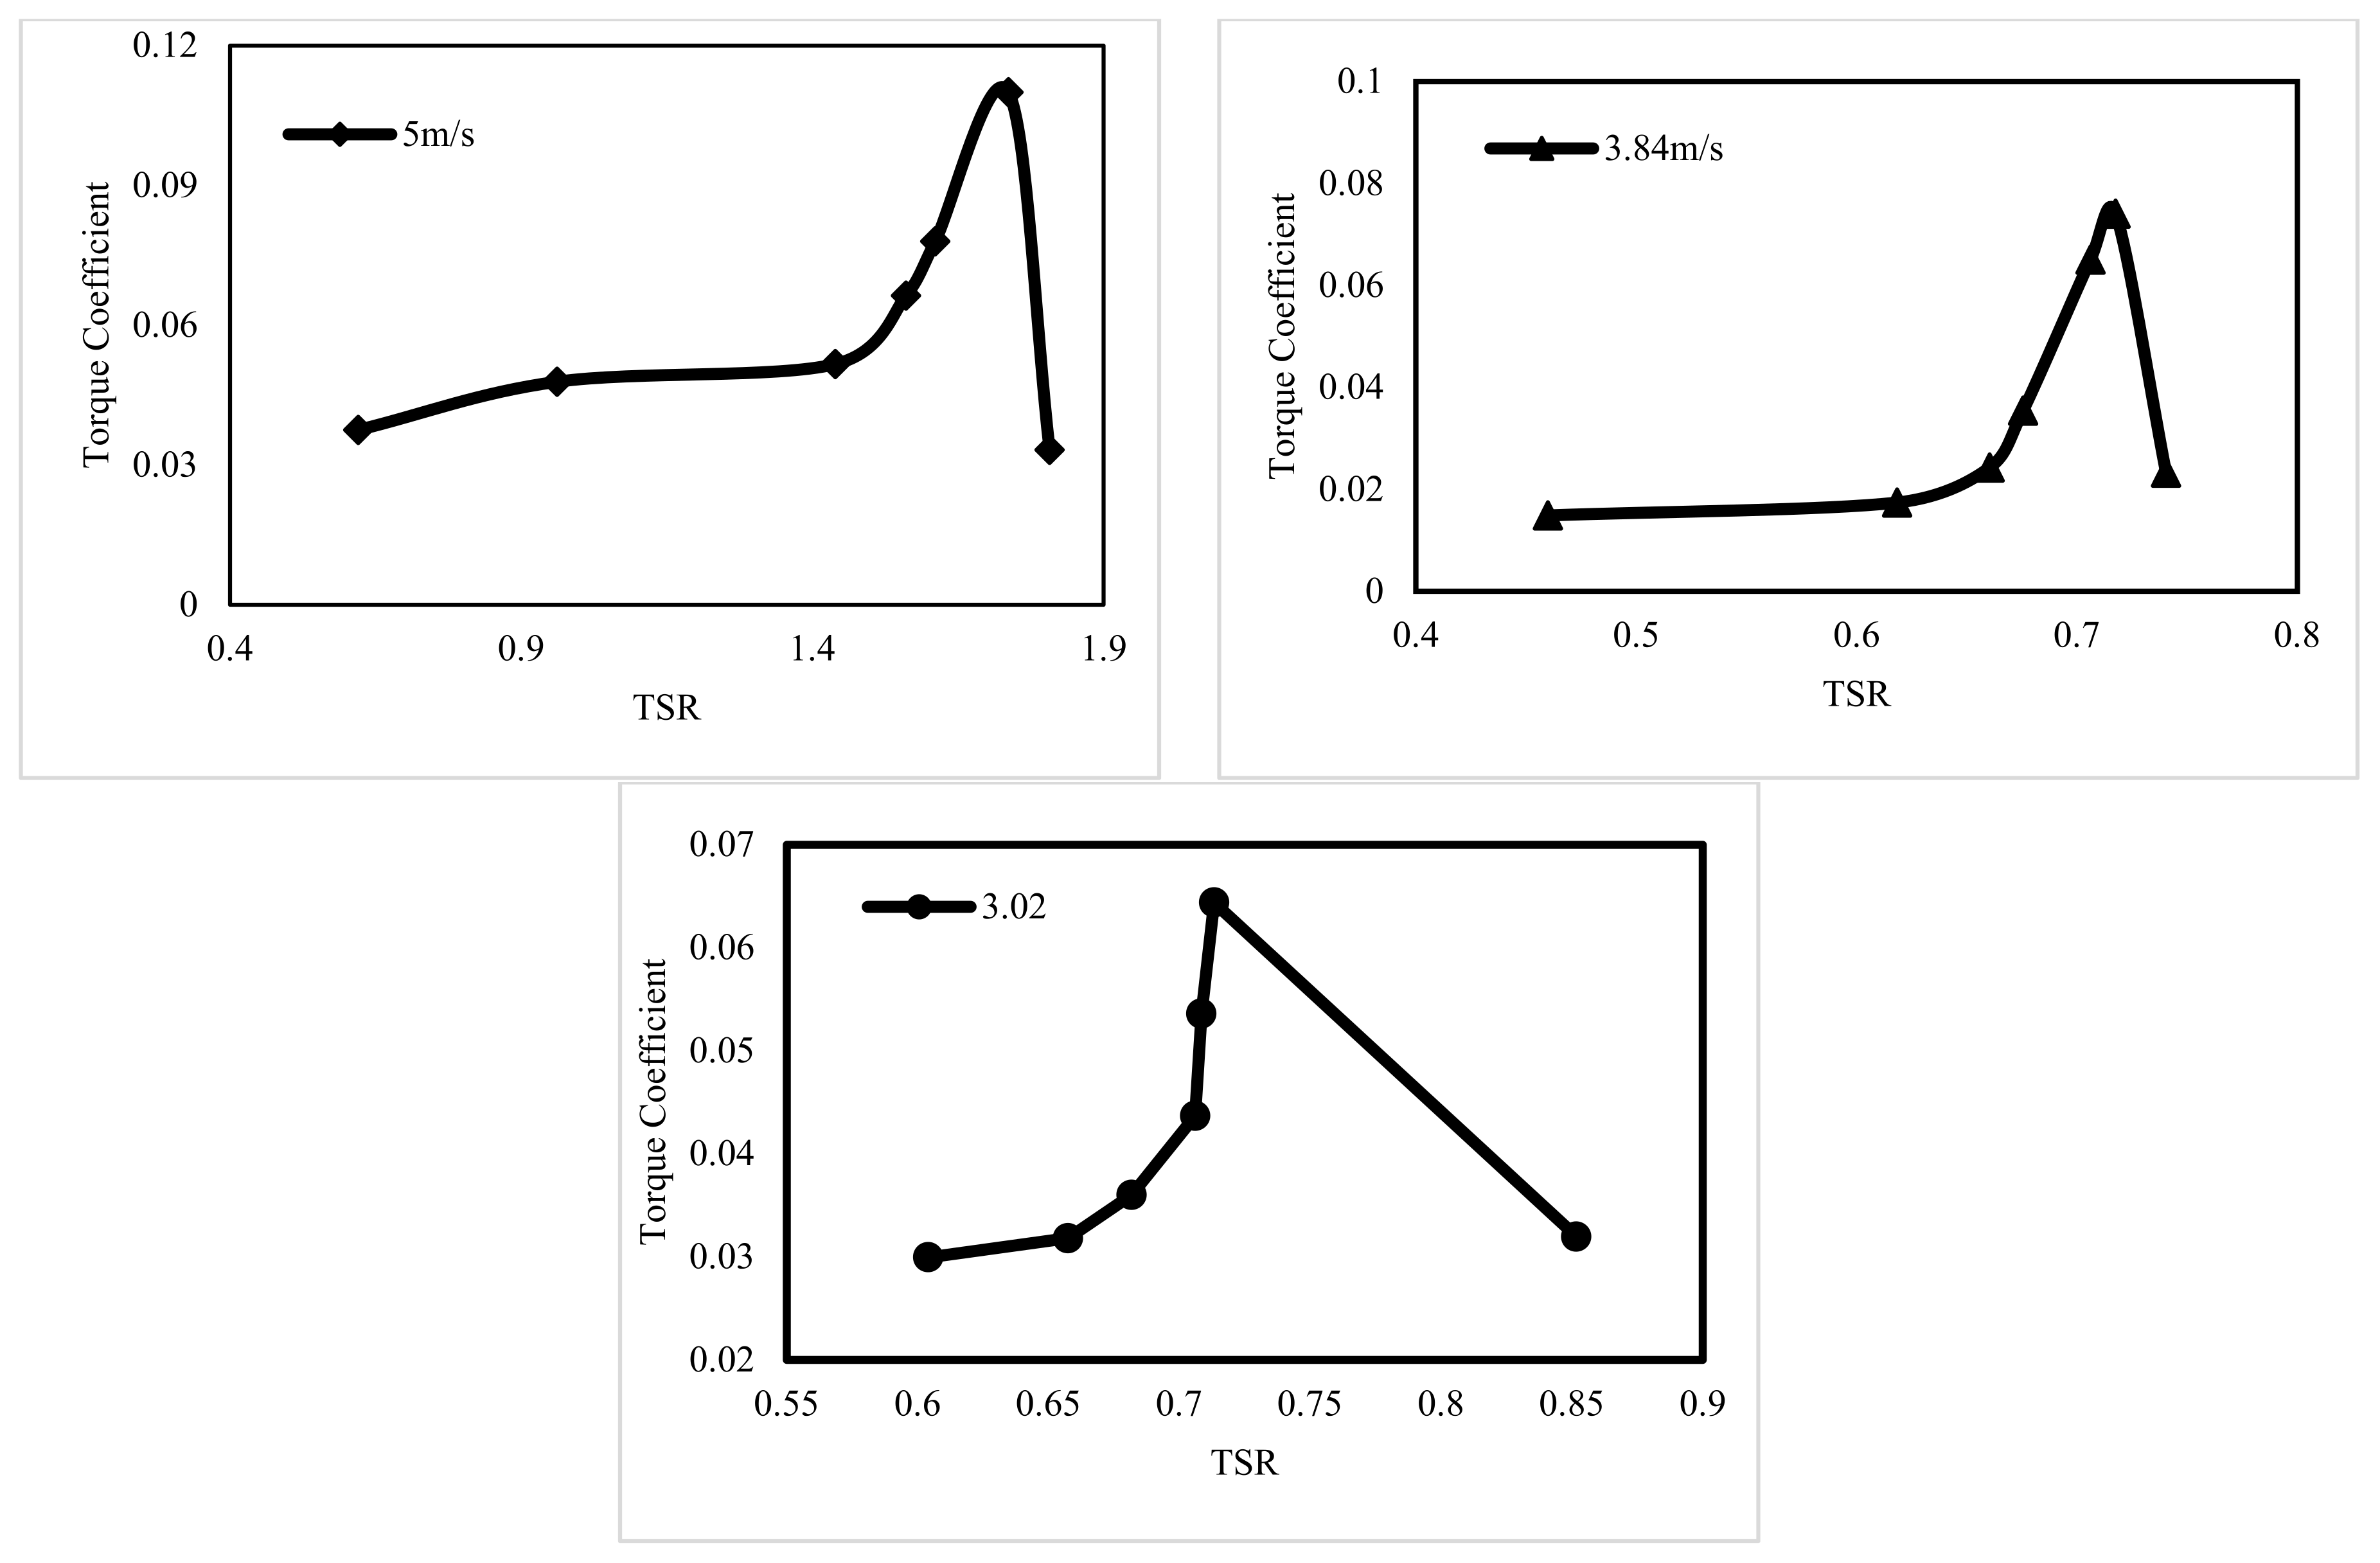
Following the assessment of torque versus RPM, an analysis of the torque coefficient versus TSR was conducted to deepen our comprehension of the turbine’s behavior. Figure 12 illustrates a direct relationship between both torque coefficient and TSR, exhibiting an increment corresponding to the rise in wind velocity. TSR peaks were observed at approximately 1.7, 0.7, and 0.68 for wind velocities of 5 m/s, 3.84 m/s, and 3.02 m/s, respectively. Likewise, the highest torque coefficients recorded were slightly above 0.1, 0.075, and 0.065 for the same respective velocities.
The observed trend and graphical representation imply a continued increase in torque coefficient with escalating wind velocity, indicating the wind turbine’s suitability for high-speed conditions. This characteristic extends its potential applications across a wide range of high-velocity scenarios. However, due to limitations inherent in the developed testing apparatus, the upper velocity limit for optimal turbine performance remains indeterminate.
Table 3 compares the performance of two energy recovery systems, DHAHWT and SHWT, in terms of wind velocity, system size, maximum power, and power harnessed. The DHAHWT, with a smaller diameter of 30 cm and operating at a lower wind velocity of 2.04 m/s, demonstrates a substantial improvement in power output when augmented, increasing from 0.311995152 W to 4.59375 W, which corresponds to a 179.16% increase. Despite its smaller size and lower wind velocity, the DHAHWT harnesses 12.16% of its augmented power, resulting in a harnessed power of 0.559 W. In contrast, the SHWT, with a larger diameter of 50 cm and a higher wind velocity of 5.1 m/s, maintains a constant maximum power of 15.9531523 W and harnesses 51.1% of this power, leading to a harnessed power of 7.4 W. Although the SHWT achieves a higher absolute power harnessed, the DHAHWT exhibits superior performance in terms of relative enhancement and efficiency, indicating its potential advantage in energy recovery applications.

4. Conclusions

In conclusion, the analysis of the air velocity profile and wind turbine performance provides valuable insights into the behavior and efficiency of the turbine system. The discrepancies in post-turbine behavior, departing from traditional actuator disk theory, were unveiled through velocity profile examinations. The introduction of a honeycomb structure notably improved airflow characteristics and turbine performance, particularly evident in the increased RPM. Evaluating turbine performance in terms of power coefficient (Cp), tip-speed ratio (TSR), and torque elucidated crucial relationships with wind velocity, emphasizing the turbine’s potential for high-speed conditions. However, maintaining specific torque levels at varying wind velocities is essential for optimal performance.
The observed direct relationship between the torque coefficient and TSR suggests the turbine’s suitability for diverse high-velocity scenarios. Nonetheless, this study’s limitations, including the absence of an upper velocity limit for optimal turbine performance, indicate the need for further research to comprehensively understand and maximize efficiency across a broader range of operating conditions. Moreover, the consistent trend of increasing efficiency with higher wind speeds underscores the turbine’s adaptability to various environmental conditions. However, the optimal performance of the turbine relies on maintaining specific torque levels at varying wind velocities, highlighting the importance of further investigation to optimize real-world applications.
Overall, these findings contribute to advancing our understanding of wind turbine behavior and optimizing their performance in real-world applications. By revealing discrepancies in post-turbine behavior and showcasing the impact of structural modifications, such as the introduction of a honeycomb structure, this analysis underscores the complexity of airflow dynamics within turbine systems. Addressing this study’s limitations and conducting further research will be pivotal in unlocking the full potential of wind turbines and maximizing their efficiency across diverse operating conditions, ultimately driving advancements in renewable energy technology.

Author Contributions

Conceptualization, S.Z.S.; data curation, S.Z.S.; formal analysis, S.Z.S. and A.H.M.; funding acquisition, A.F., R.S.R., M.S.H.L. and M.R.S.; investigation, S.Z.S.; methodology, S.Z.S.; project administration, A.F. and M.R.S.; resources, S.Z.S. and M.S.H.L.; software, K.H.W.; supervision, A.F., H.R., K.H.W., R.S.R., M.S.H.L. and M.R.S.; validation, S.Z.S.; visualization, S.Z.S.; writing—original draft, S.Z.S.; writing—review and editing, A.F., H.R. and A.H.M. All authors have read and agreed to the published version of the manuscript.

Funding

This research received no external funding.

Data Availability Statement

The original contributions presented in the study are included in the article, further inquiries can be directed to the corresponding authors..

Conflicts of Interest

The authors declare no conflicts of interest.

References

  1. Irvine, K.N.; Suwanarit, A.; Likitswat, F.; Srilertchaipanij, H.; Ingegno, M.; Kaewlai, P.; Boonkam, P.; Tontisirin, N.; Sahavacharin, A.; Wongwatcharapaiboon, J.; et al. Smart City Thailand: Visioning and Design to Enhance Sustainability, Resiliency, and Community Wellbeing. Urban Sci. 2022, 6, 7. [Google Scholar] [CrossRef]
  2. Abbas, J.; Wang, L.; Ben Belgacem, S.; Pawar, P.S.; Najam, H.; Abbas, J. Investment in Renewable Energy and Electricity Output: Role of Green Finance, Environmental Tax, and Geopolitical Risk: Empirical Evidence from China. Energy 2023, 269, 126683. [Google Scholar] [CrossRef]
  3. Raihan, A.; Rashid, M.; Voumik, L.C.; Akter, S.; Esquivias, M.A. The Dynamic Impacts of Economic Growth, Financial Globalization, Fossil Fuel, Renewable Energy, and Urbanization on Load Capacity Factor in Mexico. Sustainability 2023, 15, 13462. [Google Scholar] [CrossRef]
  4. Al-Kayiem, H.H.; Git, H.M.; Lee, S.L. Experimental Investigation on Solar—Flue Gas Chimney. J. Power Energy Eng. 2009, 3, 25–31. [Google Scholar]
  5. Wong, K.H.; Chong, W.T.; Yap, H.T.; Fazlizan, A.; Omar, W.Z.W.; Poh, S.C.; Hsiao, F.B. The Design and Flow Simulation of a Power-Augmented Shroud for Urban Wind Turbine System. Energy Procedia 2014, 61, 1275–1278. [Google Scholar] [CrossRef]
  6. Chilugodu, N.; Yoon, Y.J.; Chua, K.S.; Datta, D.; Baek, J.D.; Park, T.; Park, W.T. Simulation of Train Induced Forced Wind Draft for Generating Electrical Power from Vertical Axis Wind Turbine (VAWT). Int. J. Precis. Eng. Manuf. 2012, 13, 1177–1181. [Google Scholar] [CrossRef]
  7. Hossain, M.T.; Hasan, A.; Paul, R.; Akter, N. Producing Electrical Energy by Using Wastage Wind Energy from Exhaust Fans of Industries. Int. J. Sci. Eng. Res. 2013, 4, 1184–1187. [Google Scholar]
  8. Mann, H.S.; Singh, P.K. Effect of Number of Blades in Ducted Turbine System on Kinetic Energy Extraction from Chimney Flue Gases—Benchmarking with Wind Energy System. J. Mech. Sci. Technol. 2018, 32, 5443–5455. [Google Scholar] [CrossRef]
  9. Mann, H.S.; Singh, P.K. Kinetic Energy Recovery from the Chimney Flue Gases Using Ducted Turbine System. Chin. J. Mech. Eng. 2017, 30, 472–482. [Google Scholar] [CrossRef]
  10. Mann, H.S.; Singh, P.K. Conceptual Development of an Energy Recovery from the Chimney Flue Gases Using Ducted Turbine System. J. Nat. Gas Sci. Eng. 2016, 33, 448–457. [Google Scholar] [CrossRef]
  11. Puttichaem, W.; Putivisutisak, S.; Boonyongmaneerat, Y.; Vadhanasindhud, P. Early Development of a Shaftless Horizontal Axis Wind Turbine for Generating Electricity from Air Discharged from Ventilation Systems. Int. J. Energy Res. 2020, 46, 212–222. [Google Scholar] [CrossRef]
  12. Puttichaem, W.; Boonyongmaneerat, Y.; Vadhanasindhu, P.; Putivisutisak, S. Performance of the Prototype Shaftless Small Scale Horizontal Wind Turbine for Electricity Generating from Industrial Exhaust Air System. IOP Conf. Ser. Earth Environ. Sci. 2020, 463, 012140. [Google Scholar] [CrossRef]
  13. Yeboah, D.; Ackor, N.; Abrowah, E. Evaluation of Wind Energy Recovery from an Underground Mine Exhaust Ventilation System. J. Eng. 2023, 2023, 8822475. [Google Scholar] [CrossRef]
  14. Chikere, A.O.; Al-Kayiem, H.H.; Karim, Z.A.A. Review on the Enhancement Techniques and Introduction of an Alternate Enhancement Technique of Solar Chimney Power Plant. J. Appl. Sci. 2011, 11, 1877–1884. [Google Scholar] [CrossRef]
  15. Venkatesh, G. Power Production Technique Using Exhaust Gas from Present Automobiles via Convergent-Divergent Nozzle. In Proceedings of the 2006 IEEE Conference on Electric and Hybrid Vehicles ICEHV, Pune, India, 18–20 December 2006. [Google Scholar] [CrossRef]
  16. Kolte, A.; Festa, G.; Ciampi, F.; Meissner, D.; Rossi, M. Exploring Corporate Venture Capital Investments in Clean Energy—A Focus on the Asia-Pacific Region. Appl. Energy 2023, 334, 120677. [Google Scholar] [CrossRef]
  17. Zishan, S.; Molla, A.H.; Rashid, H.; Wong, K.H.; Fazlizan, A. Comprehensive Analysis of Kinetic Energy Recovery Systems for Efficient Energy Harnessing from Unnaturally Generated Wind Sources. Sustainability 2023, 15, 15345. [Google Scholar] [CrossRef]
  18. Suheel, S.Z.; Fazlizan, A. Workability of a New Kinetic Energy Recovery System Proven Mathematically. AIP Conf. Proc. 2021, 2339, 020159. [Google Scholar] [CrossRef]
  19. Kishore, R.A.; Coudron, T.; Priya, S. Small-Scale Wind Energy Portable Turbine (SWEPT). J. Wind Eng. Ind. Aerodyn. 2013, 116, 21–31. [Google Scholar] [CrossRef]
  20. Anant Kishore, R.; Priya, S. Design and Experimental Verification of a High Efficiency Small Wind Energy Portable Turbine (SWEPT). J. Wind Eng. Ind. Aerodyn. 2013, 118, 12–19. [Google Scholar] [CrossRef]
  21. Duquette, M.M.; Visser, K.D. Numerical Implications of Solidity and Blade Number on Rotor Performance of Horizontal-Axis Wind Turbines. J. Sol. Energy Eng. Trans. ASME 2003, 125, 425–432. [Google Scholar] [CrossRef]
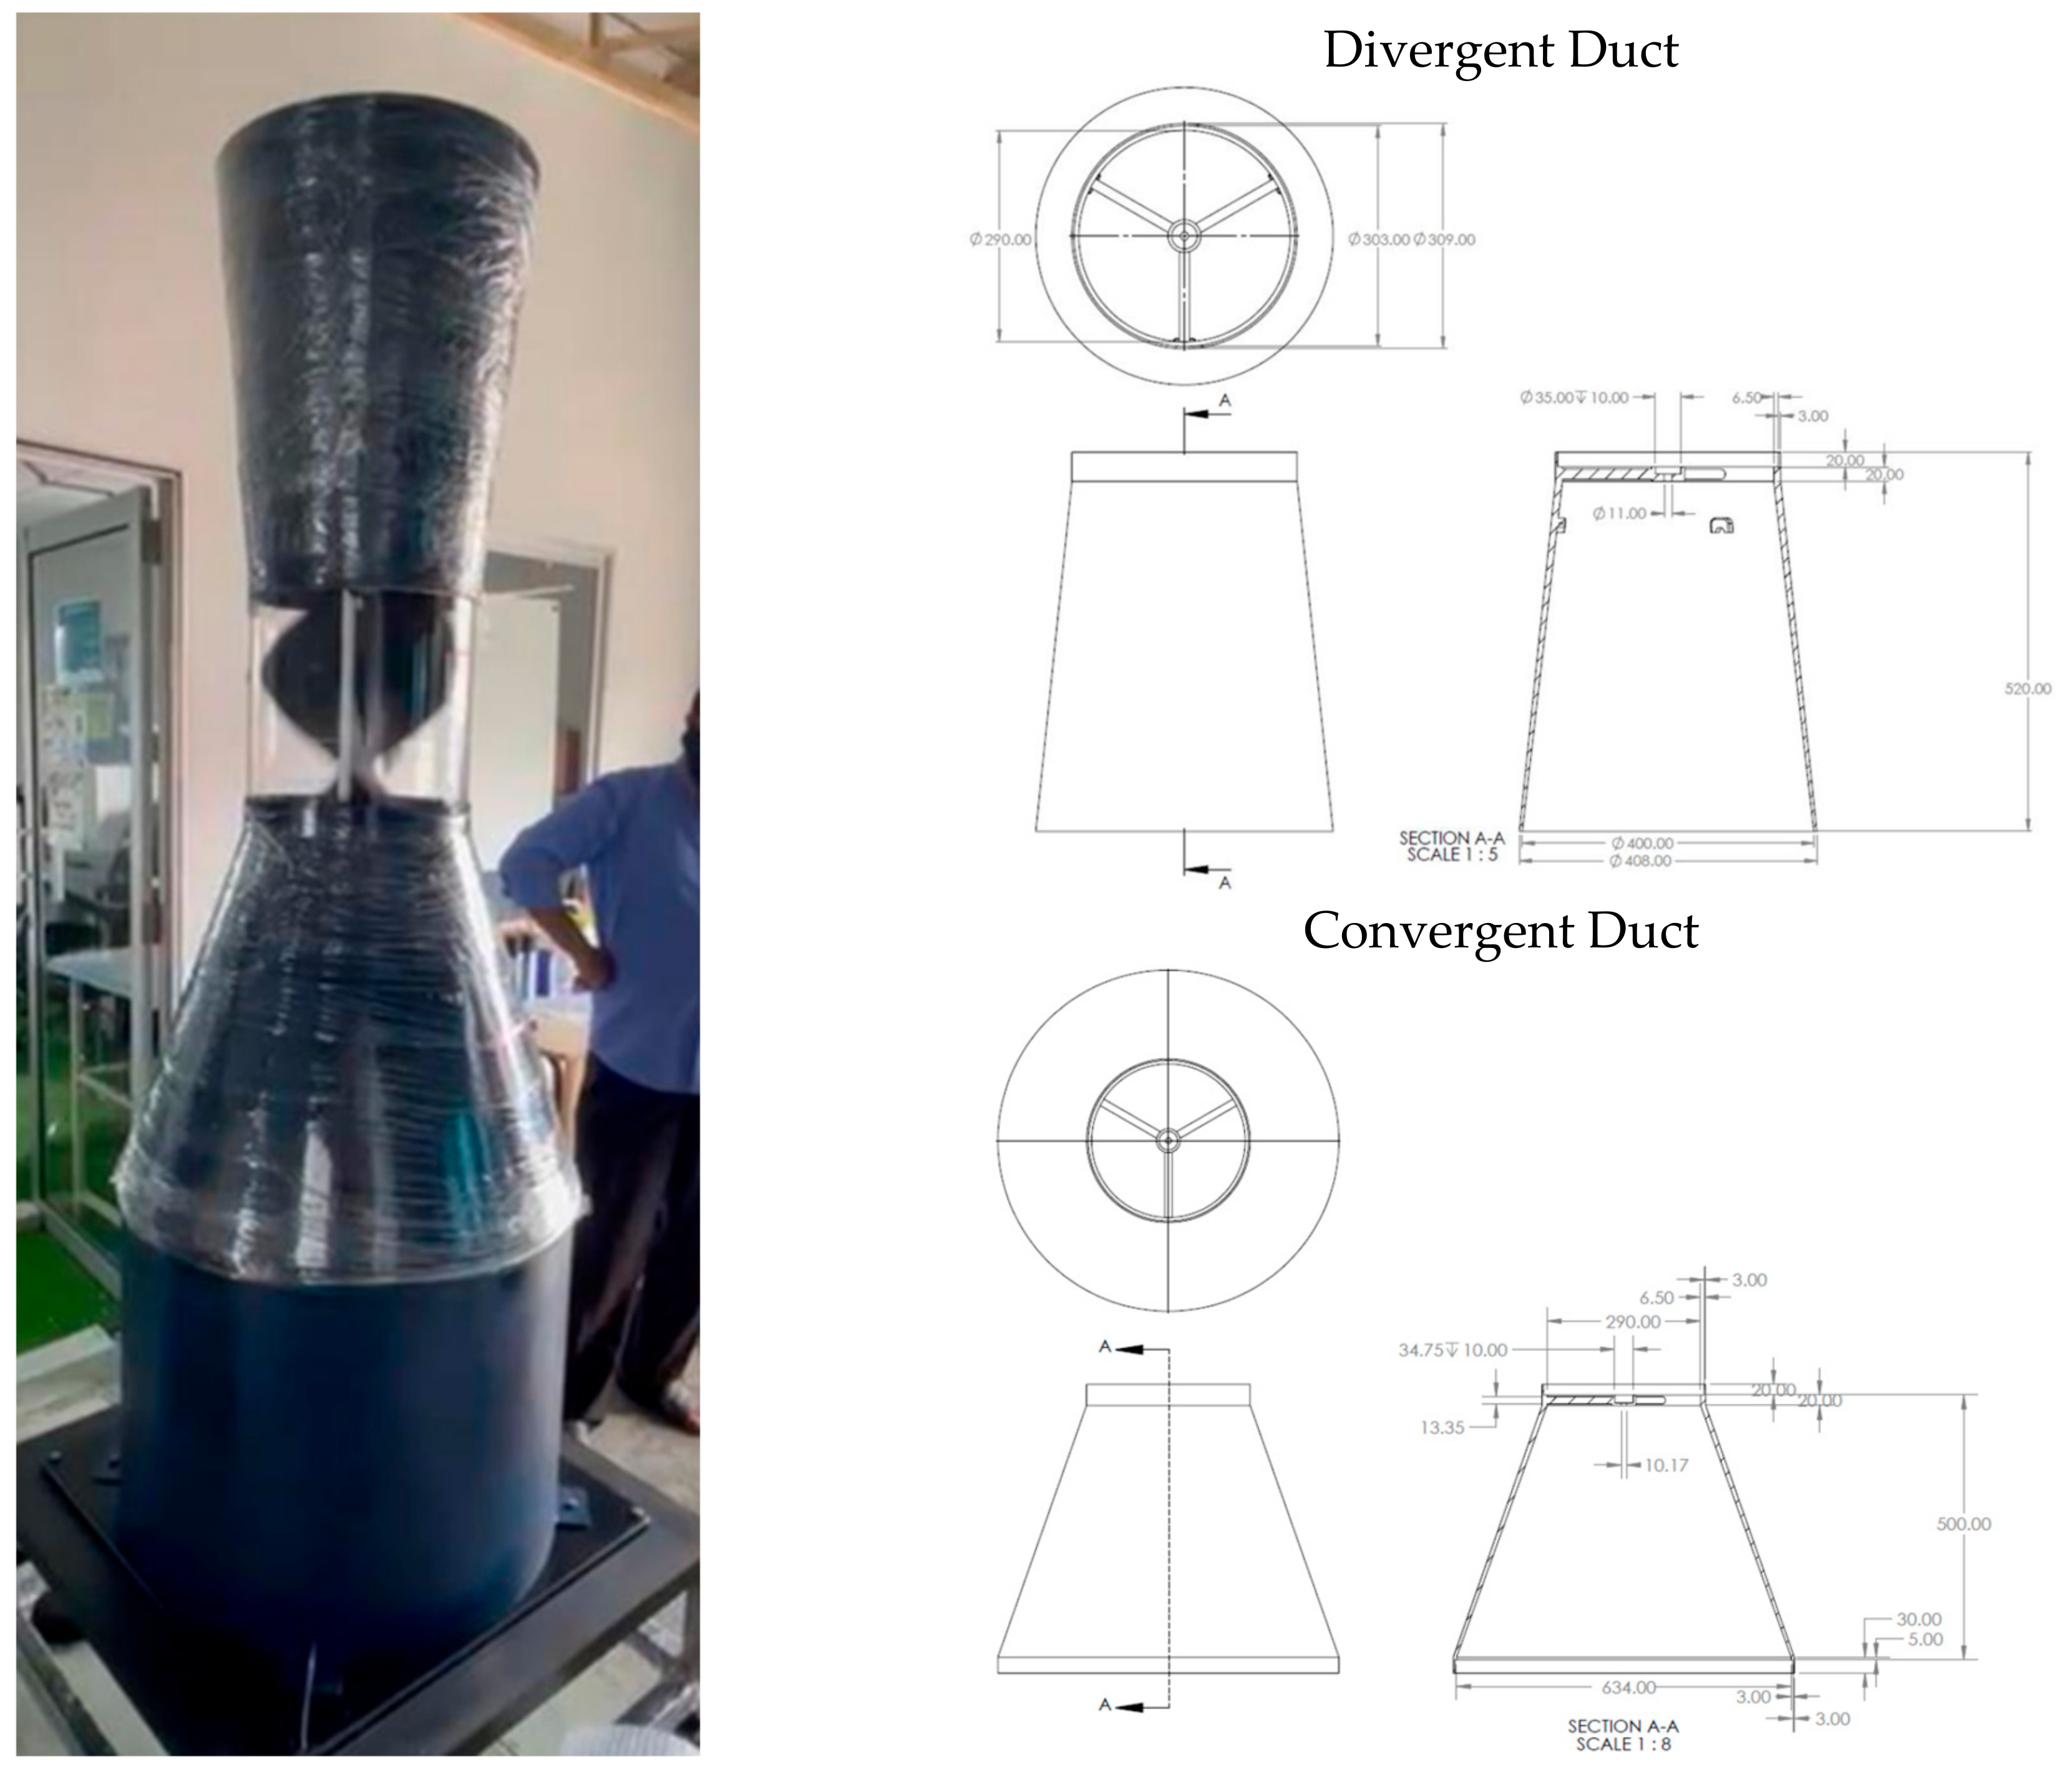
Figure 1. Technical specifications of the convergent and divergent duct.
Energies 17 03029 g001
Figure 2. Technical specifications of the honeycomb structure.
Energies 17 03029 g002
Figure 3. (a) The meshing and geometry of the helical turbine; (b) meshing and twist angle of the turbine in COMSOL; (c) the geometry of the complete system.
Energies 17 03029 g003
Figure 4. Grid study.
Energies 17 03029 g004
Figure 5. (a) Velocity measurement points throughout the test rig. (b) Points of measurement of velocity across various cross-sections.
Energies 17 03029 g005
Figure 6. Pressure and velocity relationship in an empty diffuser.
Energies 17 03029 g006
Figure 7. Velocity and pressure profiles generated from the CFD studies (a) Velocity Streamlines throughout the system and around the turbine; (b) velocity slice at point 0 on the grid and the pressure contour on the turbine surface.
Energies 17 03029 g007
Figure 8. (a) Average velocity profile along the test rig. (b) Average velocities across the test rig.
Energies 17 03029 g008
Figure 9. Cp vs. TSR graph at different velocities.
Energies 17 03029 g009
Figure 10. (a) Power vs. resistance graph at various speeds; (b) power vs. RPM graph at different velocities.
Energies 17 03029 g010
Figure 11. Torque vs. RPM graph at different velocities.
Energies 17 03029 g011
Figure 12. Torque coefficient vs. TSR graph at different velocities.
Energies 17 03029 g012
Table 1. Development of energy recovery system.
ResearcherSystem SourceNoveltyVelocityVelocity AugmentedTurbine Type
Al-Kayiem et al. [4]Industrial flue gasUsed industrial flue gas to increase the efficiency of the SCPP4.1 m/s4.6 m/sSavonius wind rotor
Chong et al. [5]Steam from cooling towersUsed guide vanes and side diffusers for an HAWT8 m/s30.4%5-bladed HAWT
Nikhita Chilugodu et al. [6]Wind is generated from the kinematic movement of trains.The use of VAWT in the vicinity of the MRT train system in Singapore6–8 m/s6% (with the increase in altitude)VAWT
Md. Abir et al. [7]Air from industrial exhaust systemsSuggested methods to conserve velocity until the wind turbine14.5–16 m/s--
Mann and Singh [8,9,10]Industrial flue gasSuggested augmenting the velocity using the most appropriate diffuser and harnessing the kinetic energy in industrial flue gas20 m/s57.2 m/sVAWT (NACA airfoils)
Wachira Puttichaem et al. [11,12]Air conditioning systems’ exhaustSuggested the use of a novel design of SSHWT equipped with a novel BDC generator1–5 m/s-SSHWT
Douglas Yeboah et al. [13]Underground mine exhaustSuggested the use of exhaust wind from underground mines7.67 m/s--
Table 2. Technical specifications of the test rig.
SectionsTechnical Specifications
MaterialCylindrical, convergent, and divergent ducts to be fabricated by custom 3D printing, using thermoplastic polyester polylactide (PLA) material. Note: alternative solution for cylindrical duct to use steel sheet.
Cylindrical DuctCylindrical duct: height 1000 mm; diameter 600 mm.
Convergent DuctConvergent Duct: height 500 mm in flow diameter; 600 mm out flow diameter—300 mm.
Divergent DuctDivergent duct: height 500 mm; in flow diameter = 300 mm; out flow diameter = 400 mm.
Test CylinderTest cylinder (provided by client): diameter 300 mm.
Support BaseSupport base: including axial fan diameter 600 mm.
Table 3. Performance evaluation against shaftless horizontal-axis wind turbine (SHWT).
Energy Recovery SystemVelocity
(m/s)
System Size
(cm)
Maximum PowerPower Harnessed (W)Power Percentage
(%)
OriginalIncomingDiameterOriginalAugmentedAugmentedRecovered
DHAHWT2.04530 cm0.3114.590.559179.16%12.16%
SHWT [11]5.15.150 cm15.9515.957.4N/A51.1%
Disclaimer/Publisher’s Note: The statements, opinions and data contained in all publications are solely those of the individual author(s) and contributor(s) and not of MDPI and/or the editor(s). MDPI and/or the editor(s) disclaim responsibility for any injury to people or property resulting from any ideas, methods, instructions or products referred to in the content.