Abstract
Microwave plasma sources are used in various applications, but inefficiency can limit their usefulness. Researchers have investigated a new approach with which to improve efficiency by using a waveguide with a special tuner. A standard waveguide was compared to one equipped with a stub tuner, which allows for the fine-tuning of the electrical properties. The experiment used a frequency of 2.45 GHz and tested input powers of 1 kW and 1.5 kW. Experiments showed that waveguides with tuners transferred power more efficiently, with fewer reflected and more transmitted microwaves. While peak temperatures remained similar, the tuned waveguide produced a hotter plasma flame (30–60 °C) at the same distance. Notably, increasing the input power further boosted the flame temperature by 300 °C. These findings suggest that stub tuners can significantly improve the efficiency of microwave plasma sources. This paves the way for more efficient plasma generation technologies and potentially allows for applications requiring even higher power.
1. Introduction
A variety of resources exist for harnessing thermal energy, including electricity, natural gas, coal, nuclear fission, and cutting-edge plasma thermal technology. Each option presents a unique set of advantages and disadvantages, and their suitability depends heavily on the specific application. This research delves into the exploration and design of plasma thermal energy, a burgeoning field with immense potential. Within this domain, two primary methodologies dominate: high-frequency electromagnetic plasma heating and DC/AC plasma heating. The prevalent application of thermal plasma technology leverages the principle of gas ionization achieved through a continuous electric arc established between the anode and cathode of a DC plasma torch. This process generates a plasma flame exceeding 1000 degrees Celsius in temperature. Plasma’s inherent properties—high density and extreme heat—facilitate efficient heat transfer and substrate processing; however, the current method of plasma generation through continuous DC arcing suffers from drawbacks, including significant operational costs and high energy consumption [1,2,3].
High-frequency plasma technology offers a more efficient and adaptable approach to plasma generation compared to traditional methods [4,5]. This approach utilizes high-frequency electromagnetic fields to excite and subsequently ionize high-density gas molecules, thereby producing a stream of charged particles known as a plasma jet. This process boasts a significantly lower power requirement, typically ranging from only 1 kW to 10 kW [6,7,8,9,10,11,12]. The generation of high-frequency plasma occurs through the excitation of electrons by high-frequency electromagnetic fields. These excited electrons then undergo fission, releasing energy in the form of continuous heat. Plasma itself is a distinct state of matter characterized by the presence of a roughly equal number of free electrons, positive ions, and neutral gas particles, resulting in an overall neutral electrical charge. This fundamental concept of plasma was first introduced by Irving Langmuir in 1928. In simpler terms, when a gas is subjected to extremely high temperatures, it undergoes a state change into plasma. Within laboratory settings, two primary classifications of plasma are generated: high-temperature plasma, also known as fusion plasma, and low-temperature plasma, alternatively termed gas discharge plasma. Thermal plasma, a type of low-temperature plasma, is produced through the application of an electric current across electrodes within a gaseous environment. This current initiates the ionization process by causing some of the gas molecules to lose electrons, thus transforming them into positively charged ions. The resulting electric field then excites and further ionizes the remaining gas, culminating in the emission of light. Microwave-generated plasma, another form of high-temperature plasma, utilizes microwave radiation to stimulate matter. This stimulation causes the matter to break down into free electrons and ions, creating the plasma state. Microwave-generated plasma offers numerous advantages, including ease of control, low power consumption, rapid response times, high energy density within the plasma itself, and overall low energy usage for the generation process [12,13]. The point of plasma generation can be strategically located at the tip of an electrode or a dedicated sharp metal object [7]. By adopting this refined approach, high-frequency plasma technology unlocks a wide range of potential applications due to its efficient nature, ease of implementation, and precise control over the plasma generation process [14,15,16,17,18].
This research endeavors to present a novel prototype leveraging high-frequency thermal plasma technology. The core principle behind this prototype lies in the utilization of high-frequency electromagnetic fields. These fields excite a continuous splitting process of high-density ions, culminating in the formation of plasma jets. These jets function as efficient thermal plasma sources capable of generating heat energy exceeding a remarkable 1000 degrees Celsius [8,19]. To ensure the precise regulation of the electromagnetic field intensity, a standard WR340 waveguide was employed within the design [4,6,19,20,21,22,23,24]. The researchers further enhanced the electromagnetic field intensity by strategically combining a stub tuner waveguide with a waveguide featuring a reduced end. This combined approach successfully facilitated plasma dissociation, a crucial step in plasma generation. A meticulous experimental design and a subsequent analysis were meticulously conducted to evaluate the prototype’s suitability for its intended application. This evaluation process involved a comprehensive analysis of the critical ratios required to achieve maximum efficiency in plasma generation. By meticulously examining these ratios, the researchers aimed to optimize the prototype’s performance [25].
2. Materials and Methods
This section presents the design methodology for a thermal plasma source utilizing high-frequency electromagnetic waves. The approach involves the computational modeling of waveguides in various configurations. Computer simulations were employed to identify key trends in the system’s behavior before physical construction and subsequent experimentation. This iterative process aimed to optimize the design and enhance the efficiency of plasma source development (Figure 1).

Figure 1.
Block diagram of a high-frequency electromagnetic wave thermal plasma generation system.
2.1. Design of a Waveguide for a Plasma Source
The ideal waveguide geometry was selected through a standardized approach. Standard rectangular waveguide sizes were utilized, with the appropriate standard chosen based on the desired operating frequency. In this project, the applied frequency was 2.45 GHz [5,7,15,16,26]. To adhere to Electronic Industries Alliance (EIA) regulations, a WR340 waveguide was employed [6,23,24]. This waveguide possessed a width (a) of 8.6 cm and a narrow side dimension (b) of 4.3 cm. The operating mode for this waveguide was the TE₁₀ mode. The subsequent calculation of the cavity dimensions was based on the variables below [21,25,27].
By calculating the lowest cutoff frequency at which a wave may travel through the cavity waveguide in the TE10 mode, with m = 1 and n = 0, the cutoff frequency can be determined using the following equation [7,9,26,28,29]:
Using the following equation, we obtain the cutoff wavelength:
We use the following equation to calculate the wavelength in a waveguide:
From , we replace the values to obtain cm.
From cm, we obtain cm.
Therefore, the wavelength in the waveguide will be cm.
We calculate the conductor surface losses by using the following equation:
Based on the calculations performed for the aforementioned square waveguide dimensions, the chosen size demonstrably allows for the propagation of the 2.45 GHz frequency spectrum within the waveguide [27]. This translates to a predicted wavelength (λ) within the waveguide of cm. The value of λ is a critical parameter that will be utilized in the subsequent design of the cavity waveguide (Figure 2).

Figure 2.
Cavity waveguide parameters.
This, based on the computation of the prior parameters, has an a side size of 8.6 cm and a b side size of 4.3 cm, and cm is utilized to determine the size, as indicated in Figure 3, by calculating the wavelength based on the frequency of usage.
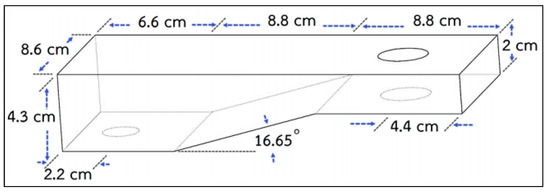
Figure 3.
Waveguide design dimensions.
The design of the waveguide emanating from the plasma source facilitated the transition to practical experimentation. Leveraging the dimensional information of the waveguide, a computer simulation was conducted to visualize key parameters (Figure 4) [30]. This simulation allowed for the observation of the plasma flame’s location and the region of maximum electric field intensity (Figure 5), situated at a quarter-wavelength (λ/4) from the tip of the cavity waveguide. This critical wavelength (λ/4) was utilized to determine the optimal location for gas and air infusion, thereby establishing the ideal point for plasma flame generation. Furthermore, the simulation encompassed the analysis of the wave reflection (S11 parameter), the transmission coefficient (S21 parameter), as shown in Figure 6, and the distribution of the electromagnetic field intensity within the waveguide, as shown in Figure 5 [29]. The combined data obtained from this simulation were instrumental in refining the design and optimizing the performance of the plasma source [6,13,18,22,26,28].
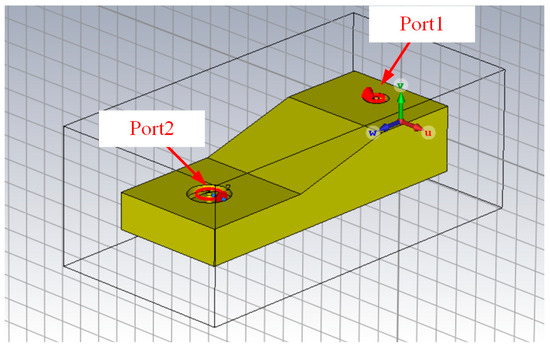
Figure 4.
A waveguide model without a stub tuner shown using a computer program.

Figure 5.
Intensity of the electromagnetic field inside of the waveguide.
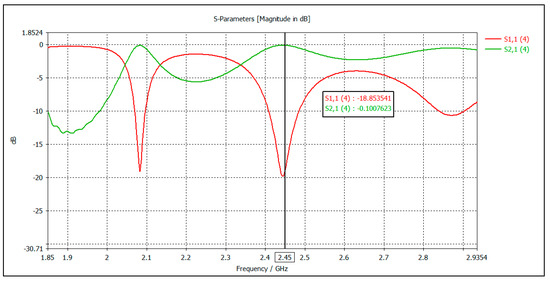
Figure 6.
Graph of the reflection of the wave and transmission coefficient.
The simulation of the electromagnetic field within the waveguide [28] was conducted by using CST MICROWAVE STUDIO 2024 software at a frequency of 2.45 GHz. The results illustrate the distribution of the field intensity, with the maximum intensity observed at the downstream end of the waveguide (plasma generation point), reaching a value of 2035 V/m [13,29].
The provided figure depicts the results of the waveguide simulation, specifically the scattering parameters S11 (wave reflection) and S21 (transmission coefficient). As can be observed, the S11 parameter exhibited a value of −18 dB, indicating the presence of a reflected wave within the designed waveguide. Conversely, the S21 parameter approaches 0 dB, signifying minimal wave attenuation during transmission. This favorable combination of reflection and transmission coefficients translated to a theoretically low wave loss within the waveguide to be suitable for the intended application [6,31].
Building upon the aforementioned simulation results, the researchers investigated the potential for enhanced waveguide efficiency. Figure 7 illustrates a modified waveguide design incorporating tuner stubs positioned at intervals corresponding to a full wavelength (λ) [7]. The introduction of these tuner stubs aimed to mitigate wave reflection and consequently bolster the transmission coefficient within the waveguide. This design iteration represented an effort to optimize waveguide performance by minimizing wave reflections and maximizing wave transmission (Figure 8).
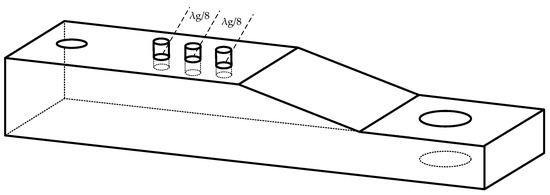
Figure 7.
Waveguide with a tuner stub.
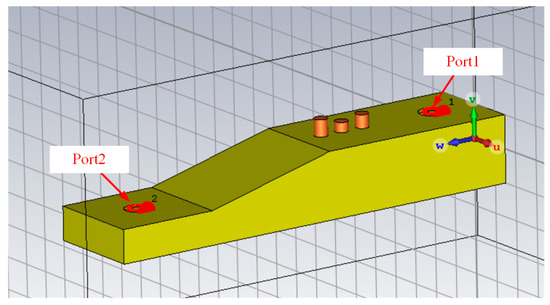
Figure 8.
Shows a waveguide model with a stub tuner through a computer program.
The simulation results presented in Figure 9 demonstrate the effectiveness of the stub tuner waveguide design [22,30]. The reflectivity (S11 parameter) exhibited a significant decrease of 5 dB, reaching a value of −23 dB compared to the original waveguide. Conversely, the transmittance coefficient (S21 parameter) experiences a substantial improvement, increasing to −0.06 dB from the original value of −0.1 dB. This translates to a more efficient transmission of the wave signal within the waveguide. Furthermore, Figure 10 illustrates the impact of the stub tuner on the electromagnetic field intensity distribution. The simulation results indicate a significant enhancement of 928 V/m in the field intensity compared to the design without the stub tuner.
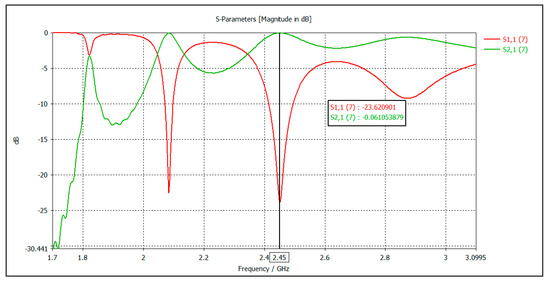
Figure 9.
Graph of the reflection of the wave and the transmission coefficient of the waveguide with the tuner stub.
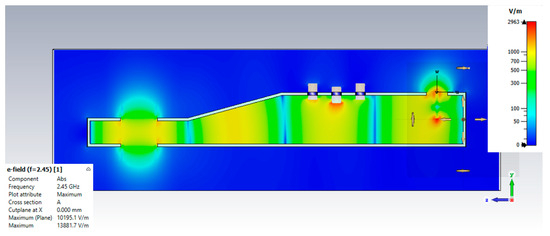
Figure 10.
Electromagnetic field intensity inside a stub tuner waveguide.
In conclusion, the incorporation of a stub tuner demonstrably optimizes the waveguide performance. This optimization manifests as a reduction in the reflected wave energy (lower S11) and a concomitant increase in the transmitted wave energy (higher S21). Additionally, the field intensity within the waveguide is demonstrably enhanced. These findings validate the effectiveness of the stub tuner design in improving waveguide efficiency.
2.2. Design of a Heat Plasma Source
To validate the simulation results and assess the effectiveness of the stub tuner design, two sets of heated plasma were generated: one utilizing a waveguide with a tuner stub and another without. This real-world trial provided empirical data with which to corroborate the aforementioned simulation findings. The trial involved a comprehensive evaluation of various parameters directly influenced by the waveguide design. These parameters were meticulously measured and analyzed to determine their impact on plasma generation. The thermal plasma source, designed to operate at a frequency of 2.45 GHz, played a critical role in this experiment. Figure 11 illustrates the three main components that constitute this plasma source. A thorough understanding of the source’s functionality and its interaction with the waveguides is essential for successful plasma generation [21].
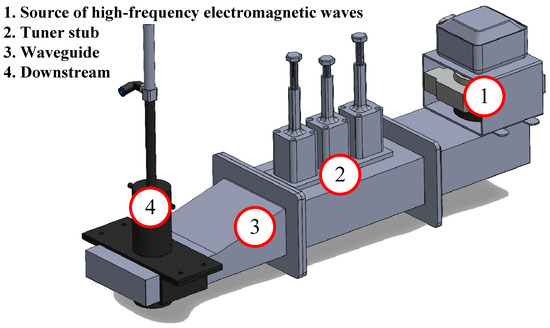
Figure 11.
Block diagram of a high-frequency electromagnetic thermal plasma source component. It consists of a magnetic source, a waveguide, a stub tuner waveguide, and a downstream section.
- The high-frequency electromagnetic wave source employed in this experiment utilized a magnetron design. This design incorporated a tungsten coil filament acting as the cathode. The filament was housed within a vacuum tube surrounded by a copper anode. The application of a high voltage across the cathode and anode established an electric field within the tube. Additionally, a ring of permanent magnets generated a magnetic field. The interaction between the electric field and the magnetic field allowed for the conversion of high-voltage direct-current (DC) electrical energy into microwave energy. The generated microwave energy was subsequently transmitted through a probe-like antenna [1,4,9,25,32].
- Waveguides: There were two types of waveguides designed and constructed—a simple waveguide without a tuner stub and another with a tuner stub for comparison of efficiency. The waveguide was the part that carried electromagnetic energy. A typical waveguide is a metal tube with a specific internal cross-sectional size depending on the frequency. If the wave has a high frequency, the wavelength is low and the size of the waveguide is smaller. The size of the most effective waveguide is half the wavelength transmitted inside of the tube, and it has less power loss. They are generally round or square tubes made of copper or aluminum. In this research, a standard WR340 optical waveguide made of 1100-grade aluminum was used due to its good thermal and conductive properties [4,6,21,25].
- The waveguide stub tuner was a compact section of a waveguide strategically inserted into the main waveguide. By adjusting its position and length, the tuner could manipulate the overall impedance characteristics of the combined structure. This allowed for fine-tuning to achieve an optimal impedance match. The ability to adjust the waveguide stub tuner proved invaluable. Changes in operating frequency or other system parameters can potentially disrupt the initial impedance match. The stub tuner provided the flexibility to rectify these disruptions, ensuring that the waveguide continued to operate at maximum efficiency [18,30,33].
- The downstream section of the waveguide, also known as the plasma generation zone, served as the location where high-frequency electromagnetic waves were extracted from the waveguide. This extraction was facilitated by the utilization of high-temperature quartz glass [23,26,34]. The rationale behind this choice lies in the material’s ability to withstand the intense electromagnetic field while remaining transparent to the microwave radiation. The high intensity of the electromagnetic field within the waveguide was sufficient to induce pneumatic actuation. This phenomenon refers to the conversion of electromagnetic energy into mechanical motion. In this specific case, the actuation resulted in the excitation of high-frequency electromagnetic waves within the plasma generation zone. These newly excited waves promoted ion ionization, stripping electrons from gas molecules and ultimately generating the desired thermal plasma [17,35].
3. Results and Discussion
This section is divided into the construction and measurement of the waveguide assembly designed and simulated in the preceding section. The primary focus aims at evaluating the performance of the waveguide through the characterization of its scattering parameters. The reflection coefficient (S11) and the transmission coefficient (S21) were meticulously measured by using a network analyzer and a power meter. Furthermore, a comprehensive thermal analysis was undertaken to assess the thermal characteristics of the thermal plasma source under two operating conditions: with and without the incorporation of stub tuners. This comparative analysis aims to elucidate the influence of stub tuners on the thermal behavior of the plasma source. The findings gleaned from the waveguide measurements and the thermal analysis were instrumental in refining the waveguide design and optimizing the overall performance of the thermal plasma source. (In Section 3.1 and Section 3.2, an RG-142-type coaxial cable designed for a frequency of 2.45 GHz was employed. Calibration procedures were meticulously conducted to ensure the utmost accuracy in the experimental results).
3.1. Measurement of Wave Reflection and Transmittance Coefficient
The reflection and transmission characteristics of the waveguides were evaluated by using a network analyzer (Figure 12). As depicted in Figure 13, the S11 and S22 parameters measured at 2.45 GHz were −8.25 dB and −9.49 dB, respectively. These parameters correspond to the reflection coefficients at the input and output ports of the waveguide, respectively. Figure 14 illustrates the measured values of the S12 and S21 parameters, representing the transmission coefficients between the input and output ports and those between the output and input ports, respectively [31]. These values were recorded as −1.44 dB and −1.69 dB, respectively. By analyzing these parameters, the overall transmission efficiency of the waveguides was determined to be approximately 70%. Notably, this level of efficiency was observed in both the standard waveguide and the waveguide equipped with a stub tuner (Figure 15).
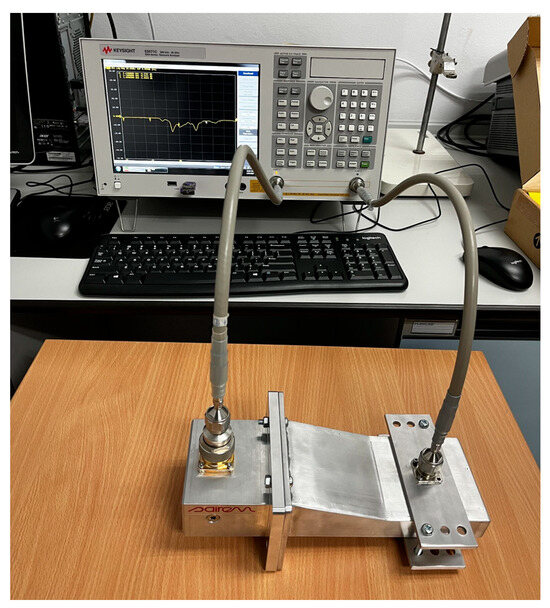
Figure 12.
Experimental measurement of wave reflections and transmission coefficients of a stubless waveguide.
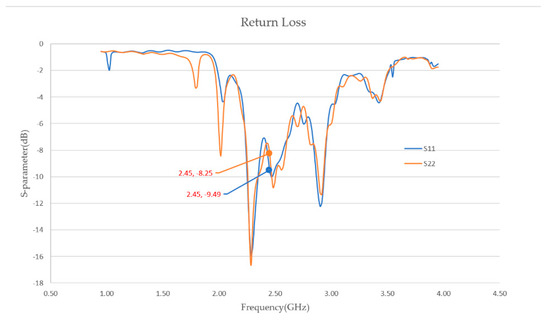
Figure 13.
Reflection measurement experiment (S11, S22).
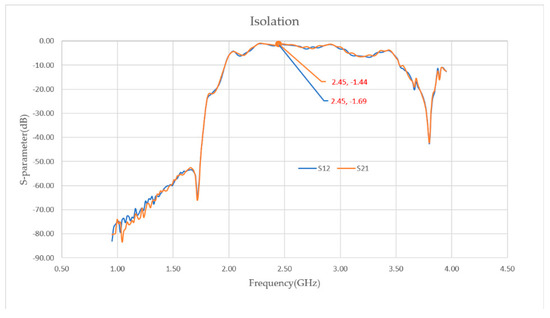
Figure 14.
Transmission coefficient measurement experiment (S12, S21).
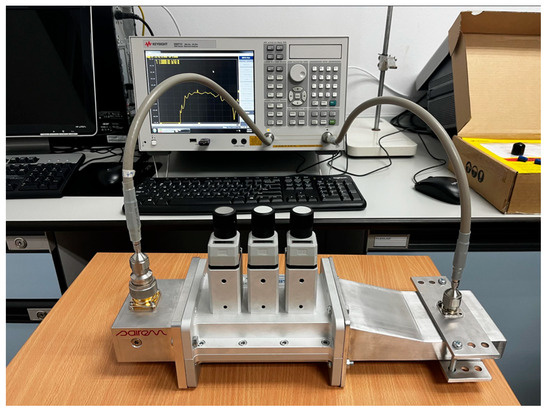
Figure 15.
Experimental measurement of wave reflections and transmission coefficients of a stub tuner waveguide.
Figure 16 presents the measured reflection coefficients of the waveguides with stub tuners. As is evident from the data, the introduction of stub tuners resulted in a significant decrease in the reflection coefficients (S11 and S22 parameters) at the operating frequency of 2.45 GHz. The S11 parameter improved from −8.25 dB (without a tuner) to −13.63 dB (with a tuner), while the S22 parameter exhibited a similar improvement, decreasing from −9.49 dB to −10.02 dB. These reductions in reflection coefficients indicate a more efficient transfer of electromagnetic waves through the waveguide with stub tuners. Figure 17 portrays the corresponding changes in the transmission coefficients (S12 and S21 parameters) upon introducing the stub tuners. While the values increased slightly (S12 from −1.44 dB to −0.85 dB, and S21 from −1.69 dB to −1.12 dB), the overall trend suggests improved wave transmission efficiency.
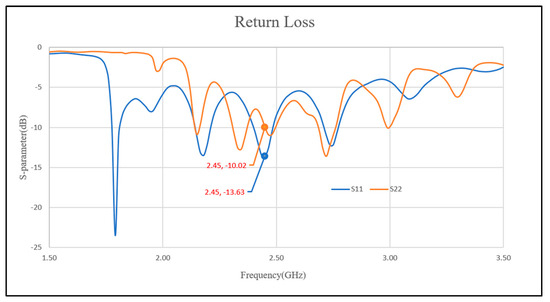
Figure 16.
Reflection measurement experiment with a stub tuner (S11, S22).
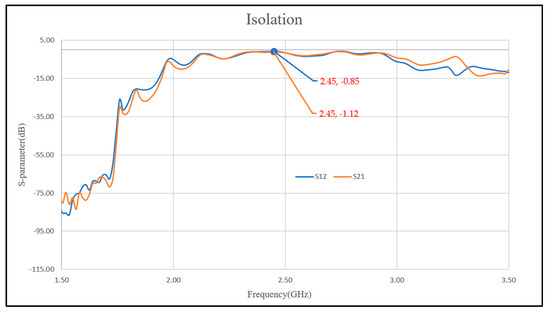
Figure 17.
Transmission coefficient measurement experiment with a stub tuner (S12, S21).
These observations support the hypothesis that the incorporation of stub tuners leads to a more efficient waveguide design compared to the design without them. The next section will substantiate this claim by presenting measurements of the transmitted power within both waveguide configurations.
3.2. Power Measurement of a Thermal Plasma Source
The experiment employed a high-frequency electromagnetic wave source, specifically a magnetron [32], to generate the required power for the thermal plasma source. The output power of the magnetron was directly measured using a power meter, and the recorded value was 1.38 kW (Figure 18).
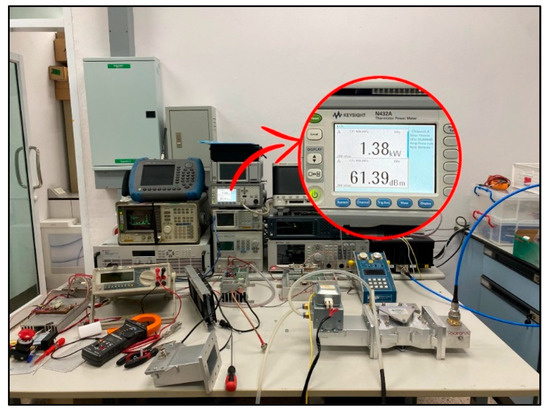
Figure 18.
Output power of a high-frequency electromagnetic wave source.
Figure 19 depicts the results of the power transfer measurements conducted within the waveguides. Figure 19a illustrates the power measured at the output of the waveguide without a stub tuner. The recorded value is approximately 1.17 kW. This value represents the power successfully transmitted through the waveguide and available for plasma generation. Figure 19b presents the power transfer measurements for the waveguide equipped with a stub tuner. It is important to note that the stub tuner tuning value employed here corresponds to the optimal value determined from the previous reflection coefficient measurements (S11 parameter). The transmission coefficient (S21 parameter) measured for this configuration indicates a transmitted power of approximately 1.31 kW. By comparing the results from both waveguides, we can observe an increase in the transmitted power achieved through the use of a stub tuner. This finding was consistent with the improved transmission efficiency observed in the scattering parameter measurements (refer to previous sections). The stub tuner effectively minimized wave reflections within the waveguide, leading to a greater portion of the input power being transmitted towards plasma generation.
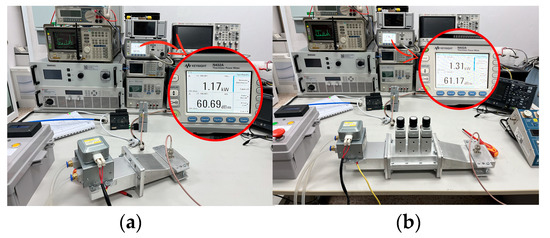
Figure 19.
Output power of the thermal plasma source waveguide.
3.3. Plasma Flame Experiment with a Microwave Plasma Source Using the Principle of a Variable-Impedance Waveguide
This section provides the details of the methodology employed for measuring the temperature profile of the plasma flame. The experiment involved recording temperature values at various distances relative to the plasma plume. These temperature measurements were facilitated by a K-type thermocouple, also referred to as a thermocouple probe type K.
The experiment encompassed two primary sets of measurements:
- Plasma flame temperature at varying power levels: The temperature of the plasma flame was measured at two distinct power levels, 1000 W and 1500 W. Then, the data elucidated the relationship between the input power and the resulting plasma temperature.
- Accumulated heat within the waveguide: In addition to the direct measurement of the plasma flame temperature, the experiment also quantified the heat accumulated within the waveguide itself. This measurement was accomplished using a TrueIR KEYSIGHT U5857A thermal imaging camera. The thermal camera provided a comprehensive spatial distribution of the heat within the waveguide, offering valuable insights into the thermal behavior of the system.
3.3.1. Experiment on Plasma Flame Temperature Measurement at 1000 Watts
This experiment aimed to assess the efficiency of a thermal plasma wave source with a stub tuner compared to a design without a waveguide (Figure 20). To achieve this objective, the following measurements were conducted.
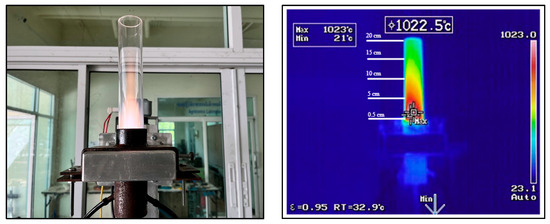
Figure 20.
Temperature measurement of a thermal plasma flame without a stub tuner.
- Plasma flame temperature measurement: The temperature distribution of the plasma flame was recorded at various distances, as illustrated in Figure 21. These data will provide insights into the spatial profile of the thermal energy within the plasma.
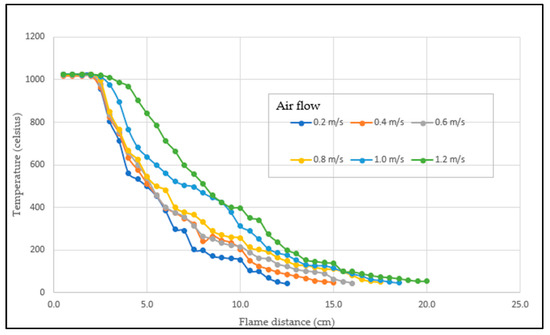 Figure 21. Graph showing the temperature at different distances and different air velocities.
 - Air flow rate measurement: The air velocity was adjusted starting at 0.2 m/s and increased by increments of 0.2 m/s until the formation of unstable plasma [4]. The results are shown in Table 1.
 Table 1. Plasma flame temperature without a stub tuner.
By analyzing the collected temperature data and air flow rate measurements, researchers can evaluate the relative efficiency of the thermal plasma source with and without a stub tuner. The configuration demonstrating a higher plasma flame temperature at a comparable air flow rate will be considered the more efficient design.
Data from Table 1 reveal that within a distance of 0.5 cm from a source (likely the nozzle tip), the plasma temperature exhibits minimal variation across the air velocity range of 0.2 to 1.2 m/s. This temperature remains relatively constant at approximately 1025 degrees Celsius; however, the temperature consistently decreases as the distance from the source increases. This observation aligns with the inherent nature of thermal plasmas, where the highest temperature zone is located closest to the point of generation. Furthermore, independent experiments conducted on a thermal plasma source without a stub tuner (as illustrated in Figure 21) suggest that an air velocity of 1.2 m/s yields the optimal balance between maximum flame length and stable plasma operation. This information can be crucial for applications where both a long working reach and stable plasma characteristics are desired.
An experimental investigation of the plasma flame temperature from a source with a stub tuner was conducted. The experimental procedure was identical to that of the temperature measurement of the plasma flame from a source without a stub tuner, as described above (Figure 22).
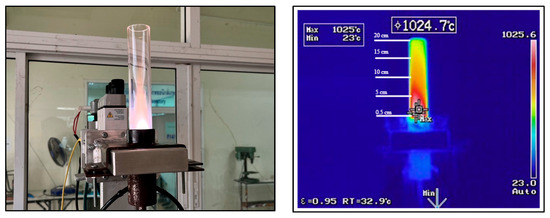
Figure 22.
Temperature measurement of a thermal plasma flame with a stub tuner.
Table 2 demonstrates that the temperature difference between plasma sources with and without a stub tuner ranges between 30 and 40 degrees Celsius.

Table 2.
Temperature of plasma flame with a stub tuner.
Figure 23 presents a graph of the temperature of plasma sources with and without a stub tuner. The experiments were conducted at a fixed air velocity of 1.2 m/s. It can be observed that a source with a stub tuner exhibits a temperature approximately 30 to 40 degrees Celsius higher than one without a stub tuner. The cumulative temperature at the plasma source was measured by the researchers and is shown in Figure 24.
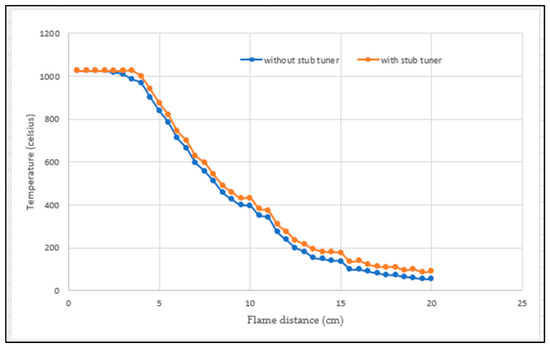
Figure 23.
Graph of temperature of plasma sources with and without a stub tuner.
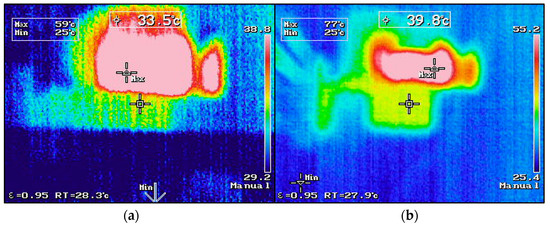
Figure 24.
Cumulative temperature of plasma sources with (a) and without (b) a stub tuner.
Figure 24 presents the cumulative temperature measurements of the waveguide of the thermal plasma sources. Figure 24a shows that the temperature inside of the waveguide with a stub tuner is approximately 33.5 degrees Celsius, while Figure 24b shows that the temperature of the waveguide without a stub tuner is approximately 39.8 degrees Celsius. It can be observed from the figures that the use of a stub tuner in the waveguide can reduce the cumulative temperature compared to the case without a stub tuner.
3.3.2. Experiment on Plasma Flame Temperature Measurement at 1500 Watts
The experiment used a thermal plasma wave source with and without a stub tuner in the waveguide, which was similar to the temperature measurement of the plasma flame at 1000 watts, to compare the efficiency of the sources. The experiment measured the temperature of the plasma flame at different distances, as shown in Figure 25, and the air flow rate used for the generation of thermal plasma.
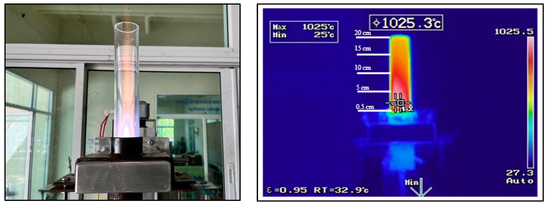
Figure 25.
Temperature measurement of thermal plasma flame without a stub tuner.
Temperature measurements were conducted using a thermocouple at different distances, as shown in Figure 25. The air velocity was adjusted from 0.2 m/s and increased by 0.2 m/s increments until unstable plasma was generated. The results are shown in Table 3.

Table 3.
Plasma flame temperature without a stub tuner.
Table 3 shows that at an air velocity of 0.2–1.6 m/s at a distance of 0.5 cm, the temperature was approximately 1025 degrees Celsius. The temperature decreased as the distance increased. From the experiment of the thermal plasma source without a stub tuner, the air velocity that is suitable and gives the longest flame is 1.6 m/s, as shown in Figure 26.
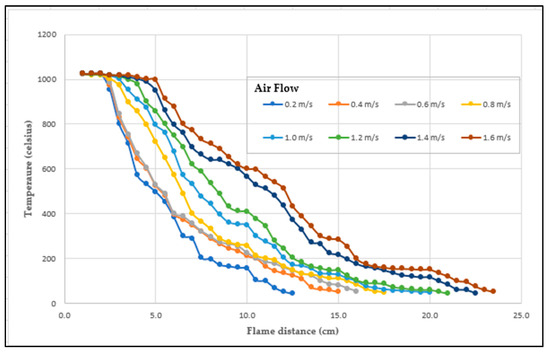
Figure 26.
Graph of the temperature at different distances and air velocities.
An experimental investigation of the plasma flame temperature from a source with a stub tuner was conducted (Figure 27). The experimental procedure was identical to that of the temperature measurement of the plasma flame from a source without a stub tuner, as described above.
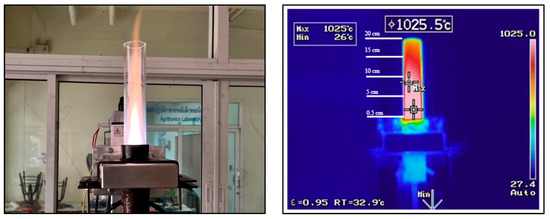
Figure 27.
Temperature measurement of thermal plasma flame with stub tuner.
Table 4 shows that the temperature difference between the plasma sources with and without a stub tuner is approximately 40 to 60 degrees Celsius.

Table 4.
Temperature of plasma flame with a stub tuner.
Figure 28 shows the temperature of plasma sources with and without a stub tuner. The experiments were conducted at a constant air velocity of 1.6 m/s. It can be seen that a plasma source with a stub tuner can achieve a temperature approximately 40 to 60 degrees Celsius higher than a plasma source without a stub tuner. The cumulative temperature measured at the plasma source is shown in Figure 29.
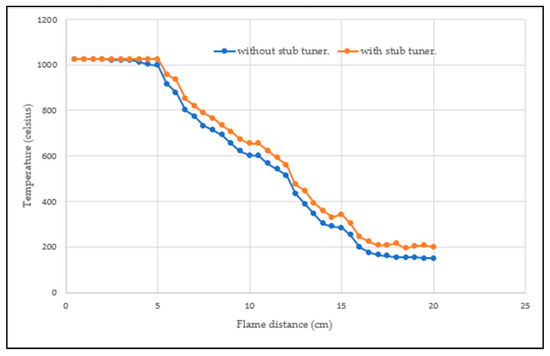
Figure 28.
Graph of temperature of plasma sources with and without a stub tuner.
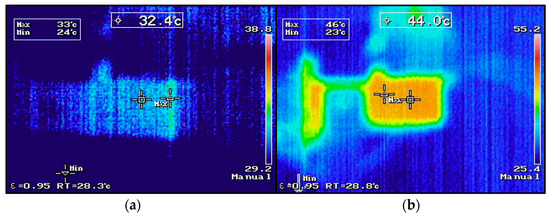
Figure 29.
Cumulative temperature of plasma sources with (a) and without (b) a stub tuner.
Figure 29 shows the cumulative temperature of the waveguide of the thermal plasma source. Figure 29a shows that the temperature inside of the waveguide with a stub tuner is approximately 32.4 degrees Celsius, and Figure 29b shows that the temperature of the waveguide without a stub tuner is approximately 44.0 degrees Celsius. It can be seen from the figure that the use of a stub tuner in the waveguide can reduce the cumulative temperature by more than that achieved without a stub tuner.
Figure 30 shows the temperature of the plasma flame at different input powers of 1000 watts and 1500 watts. It can be seen that increasing the input power results in a longer plasma flame length. At the same distance, the plasma flame at 1500 watts has a temperature approximately 200–300 degrees Celsius higher than that at 1000 watts.
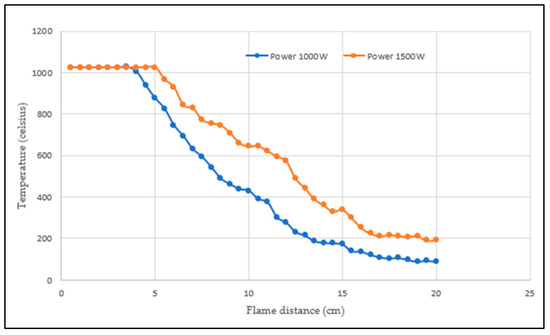
Figure 30.
Temperature graph of plasma sources with a stub tuner at different input powers.
This study investigated the concept of enhancing a microwave plasma source’s energy efficiency by incorporating a variable-impedance waveguide equipped with stub tuners. These stub tuners essentially act as fine-tuning mechanisms that adjust the electrical properties of the waveguide to optimize its interaction with plasma. The experiments were meticulously conducted at two distinct input power levels: 1000 watts and 1500 watts. This allowed for a comprehensive understanding of how the stub tuners perform across different power demands. A crucial aspect of the study involved comparing waveguides with and without stub tuners. The results are compelling. Waveguides equipped with stub tuners demonstrably exhibit lower wave reflection (S11). A lower S11 reading indicated a more efficient transfer of microwave energy into plasma, leading to less wasted power. Additionally, these waveguides boasted a superior transmission coefficient (S21). A higher S21 translates to a greater amount of usable energy reaching plasma, ultimately contributing to improved efficiency. Following the waveguide analysis, the research team conducted experiments on actual microwave plasma sources using both waveguide configurations with and without stub tuners. Interestingly, both configurations achieved a peak plasma temperature of 1025 °C [16,25] at both input power levels (1000 W and 1500 W). This initial observation suggests that the presence or absence of a stub tuner might not directly influence the maximum achievable temperature; however, the true advantage of the stub tuner emerges when we examine the overall performance of the plasma source. The configuration employing the waveguide with a stub tuner exhibited significantly enhanced performance. This translates to a higher plasma flame temperature, exceeding that achieved without a stub tuner by a significant margin of approximately 30–60 degrees Celsius at the same flame distance. Furthermore, this study explored the impact of increasing the input power on the plasma source equipped with a stub tuner. The results are quite remarkable. By boosting the input power, the plasma flame temperature was approximately 300 degrees Celsius at the same flame distance. This observation suggests that stub tuners not only enhance efficiency at base power levels but also facilitate efficient operation at higher power demands. The study proposes that the stub tuner likely plays a role in accommodating the increased power input. As the power increased, various parameters within the system inevitably changed. A stub tuner helps the system adapt to these changes, ensuring efficient energy transfer and optimal plasma generation even at higher power levels. In conclusion, the implementation of stub tuners in microwave plasma sources demonstrably improved their energy efficiency. The lower wave reflection, superior transmission coefficient, and significantly enhanced plasma flame temperature all point towards a more effective utilization of microwave energy. This research provides valuable insights into the design and operation of microwave plasma sources, paving the way for more efficient and powerful plasma generation technologies.
4. Conclusions
The researchers investigated using stub tuners to improve the efficiency of microwave plasma sources. Stub tuners are like fine-tuning knobs that optimize how microwaves interact with plasma. The study tested waveguides with and without tuners at different power levels. Tuned waveguides showed less reflected microwave energy (S11) and better transmission (S21), indicating more efficient energy transfer to the plasma. Interestingly, both configurations reached the same peak temperature. However, the one with a tuner achieved a significantly higher overall performance, with a hotter plasma flame (by 30–60 degrees Celsius). The study also showed that stub tuners allow for efficient operation even when increasing the power input. They seem to help the system adapt to these changes, thus maintaining good energy transfer and plasma generation. Overall, the study demonstrates that stub tuners can significantly improve the energy efficiency of microwave plasma sources.
Author Contributions
Conceptualization, T.T., C.T. and S.S.; methodology, T.T. and W.B. (Watcharapong Bunpradit); validation, T.T., C.T. and W.B. (Worawut Boonpeang); formal analysis, S.K.; investigation, C.T.; resources, S.K.; data curation, T.T.; writing—original draft preparation, W.B. (Watcharapong Bunpradit); writing—review and editing, T.T.; visualization, W.B. (Watcharapong Bunpradit); supervision, T.T. and C.T.; project administration, T.T. and C.T.; funding acquisition, T.T. and C.T. All authors have read and agreed to the published version of the manuscript.
Funding
This research was funded by the Suranaree University of Technology (SUT), the Thailand Science Research and Innovation (TSRI), and the National Science Research and Innovation Fund (NSRF) (NRIIS no. 179341).
Data Availability Statement
No new data were created or analyzed in this study. Data sharing is not applicable to this article.
Acknowledgments
This work was supported by the Suranaree University of Technology (SUT), Thailand Science Research and Innovation (TSRI), and the National Science Research and Innovation Fund. The authors deeply appreciate the valuable comments and recommendations provided by the reviewers, which greatly improved this article.
Conflicts of Interest
The authors declare no conflicts of interest.
References
- Oliveira, M.; Ramos, A.; Ismail, T.M.; Monteiro, E.; Rouboa, A. A Review on Plasma Gasification of Solid Residues: Recent Advances and Developments. Energies 2022, 15, 1475. [Google Scholar] [CrossRef]
- Stryczewska, H.D.; Stępień, M.A.; Boiko, O. Plasma and Superconductivity for the Sustainable Development of Energy and the Environment. Energies 2022, 15, 4092. [Google Scholar] [CrossRef]
- Rutberg, P.; Safronov, A.A.; Popov, S.D.; Surov, A.V.; Nakonechny, G.V. Investigation of Voltage and Current Variations in a Multiphase AC Electric Arc System. In Proceedings of the 12th International Congress on Plasma Physics, Nice, France, 25–29 October 2004. [Google Scholar]
- Xiao, W.; Liao, Y.; Wang, F.; Zhang, Z.; Zhu, H.; Yang, Y.; Huang, K. Determining Electron Density of Atmospheric Microwave Air Plasma Torch by Microwave Power Measurement. IEEE Trans. Plasma Sci. 2022, 50, 1781–1789. [Google Scholar] [CrossRef]
- Czylkowski, D.; Hrycak, B.; Jasiński, M.; Dors, M.; Mizeraczyk, J. Microwave plasma-based method of hydrogen production via combined steam reforming of methane. Energy 2016, 113, 653–661. [Google Scholar] [CrossRef]
- Yang, F.; Zhu, H.; Yang, W.; Huang, K. An Noval High-efficiency Microwave Plasma Torch. In Proceedings of the 2023 24th International Vacuum Electronics Conference (IVEC), Chengdu, China, 25–28 April 2023; pp. 1–2. [Google Scholar]
- Al-Shamma’a, A.I.; Wylie, S.; Lucas, J.; Yan, J.D. Atmospheric microwave plasma jet for material processing. IEEE Trans. Plasma Sci. 2002, 30, 1863–1871. [Google Scholar] [CrossRef]
- Wal, R.V.; Sengupta, A.; Musselman, E.; Skoptsov, G. Microwave-Driven Plasma-Mediated Methane Cracking: Product Carbon Characterization. C 2018, 4, 61. [Google Scholar] [CrossRef]
- Wnukowski, M. Methane Pyrolysis with the Use of Plasma: Review of Plasma Reactors and Process Products. Energies 2023, 16, 6441. [Google Scholar] [CrossRef]
- Mitsingas, C.M.; Rajasegar, R.; Hammack, S.; Do, H.; Lee, T. High Energy Efficiency Plasma Conversion of CO2 at Atmospheric Pressure Using a Direct-Coupled Microwave Plasma System. IEEE Trans. Plasma Sci. 2016, 44, 651–656. [Google Scholar] [CrossRef]
- Cho, W.; Lee, S.-H.; Ju, W.-S.; Baek, Y.; Lee, J.K. Conversion of natural gas to hydrogen and carbon black by plasma and application of plasma carbon black. Catal. Today 2004, 98, 633–638. [Google Scholar] [CrossRef]
- Chun, S.M.; Hong, Y.C.; Choi, D.H. Reforming of methane to syngas in a microwave plasma torch at atmospheric pressure. J. CO2 Util. 2017, 19, 221–229. [Google Scholar] [CrossRef]
- Zhang, W.; Tao, J.; Huang, K.; Wu, L. Numerical Investigation of the Surface Wave Formation in a Microwave Plasma Torch. IEEE Trans. Plasma Sci. 2017, 45, 2929–2939. [Google Scholar] [CrossRef]
- Belmonte, T.; Cardoso, R.P.; Noël, C.; Henrion, G.; Kosior, F. Microwave plasmas at atmospheric pressure: Theoretical insight and applications in surface treatment. Eur. Phys. J. Appl. Phys. 2008, 42, 41–46. [Google Scholar] [CrossRef]
- Chia, S.R.; Nomanbhay, S.; Milano, J.; Chew, K.W.; Tan, C.-H.; Khoo, K.S. Microwave-Absorbing Catalysts in Catalytic Reactions of Biofuel Production. Energies 2022, 15, 7984. [Google Scholar] [CrossRef]
- Antonov, I.N.; Komarov, V.V.; Durakov, A.V. Experimental Study of Nano-Structural Coatings Formed by Microwave Plasma. IEEE Trans. Plasma Sci. 2022, 50, 2845–2849. [Google Scholar] [CrossRef]
- Ojha, A.; Pandey, H.; Pandey, S. Metastable Controlled Plasma Profile in a Packed-Bed Microwave Plasma Reactor. IEEE Trans. Plasma Sci. 2023, 51, 3510–3517. [Google Scholar] [CrossRef]
- Xiao, W.; Huang, K.; Zhang, W.; Lin, Y. Modeling of Argon Plasma Excited by Microwave at Atmospheric Pressure in Ridged Waveguide. IEEE Trans. Plasma Sci. 2016, 44, 1075–1082. [Google Scholar] [CrossRef]
- Savu, S.V.; Tarnita, D.; Benga, G.C.; Dumitru, I.; Stefan, I.; Craciunoiu, N.; Olei, A.B.; Savu, I.D. Microwave Technology Using Low Energy Concentrated Beam for Processing of Solid Waste Materials from Rapana thomasiana Seashells. Energies 2021, 14, 6780. [Google Scholar] [CrossRef]
- Tang, Q.; Hu, Z.; Cui, X.; Tao, Z.; Tang, J. A Simple and Stable Atmospheric Pressure Electrodeless Water Vapor Microwave Plasma Torch. Appl. Sci. 2022, 12, 6813. [Google Scholar] [CrossRef]
- Sturm, G.S.J.; Munoz, A.N.; Aravind, P.V.; Stefanidis, G.D. Microwave-Driven Plasma Gasification for Biomass Waste Treatment at Miniature Scale. IEEE Trans. Plasma Sci. 2016, 44, 670–678. [Google Scholar] [CrossRef]
- Nowakowska, H.; Jasinski, M.; Mizeraczyk, J. Numerical Analysis of Tuning Procedure of a Waveguide-Based Microwave Plasma Source. IEEE Trans. Plasma Sci. 2011, 39, 2906–2907. [Google Scholar] [CrossRef]
- Dors, M.; Nowakowska, H.; Jasiński, M.; Mizeraczyk, J. Chemical Kinetics of Methane Pyrolysis in Microwave Plasma at Atmospheric Pressure. Plasma Chem. Plasma Process. 2013, 34, 313–326. [Google Scholar] [CrossRef]
- Henriques, J.; Bundaleska, N.; Tatarova, E.; Dias, F.; Ferreira, C. Microwave plasma torches driven by surface wave applied for hydrogen production. Int. J. Hydrog. Energy 2011, 36, 345–354. [Google Scholar] [CrossRef]
- Bang, C.U.; Hong, Y.C.; Cho, S.C.; Uhm, H.S.; Yi, Y.J. Methane-Augmented Microwave Plasma Burner. IEEE Trans. Plasma Sci. 2006, 34, 1751–1756. [Google Scholar] [CrossRef]
- Gulec, A.; Bozduman, F.; Hala, A.M. Atmospheric Pressure 2.45-GHz Microwave Helium Plasma. IEEE Trans. Plasma Sci. 2015, 43, 786–790. [Google Scholar] [CrossRef]
- Fahmi, M.M.; Ruiz-Cruz, J.A.; Mansour, R.R. Rectangular Waveguide Radial Combiners with Coaxial or Circular Intermediate Waveguide Sections Based on Stub Matching. IEEE Trans. Compon. Packag. Manuf. Technol. 2023, 13, 1642–1653. [Google Scholar] [CrossRef]
- Rybicki, T.; Stempien, Z.; Karbownik, I. EMI Shielding and Absorption of Electroconductive Textiles with PANI and PPy Conductive Polymers and Numerical Model Approach. Energies 2021, 14, 7746. [Google Scholar] [CrossRef]
- Apaydin, G.; Sevgi, L. Three-dimensional split-step-fourier and finite difference time domain-based rectangular waveguide filter simulators: Validation, verification, and calibration. Int. J. RF Microw. Comput.-Aided Eng. 2016, 26, 660–667. [Google Scholar] [CrossRef]
- Zhang, J.-Y.; Zhang, J.D.; Chen, Q.Y.; Wu, W.; Fang, D.G. Broadband Millimeter-Wave Circularly Polarized Open-Ended Waveguide Antenna Using Stubs and Its Application in Forming an Array. IEEE Trans. Antennas Propag. 2023, 71, 542–549. [Google Scholar] [CrossRef]
- Navarro-Tapia, M.; Esteban, J.; Varela, J.E.; Camacho-Penalosa, C. Simulation and Measurement of the S-Parameters of Obstacles in Periodic Waveguides. IEEE Trans. Microw. Theory Tech. 2012, 60, 1146–1155. [Google Scholar] [CrossRef]
- Mi, C.; Zhao, C.; Liu, Z.; Luo, T.; Huang, C.; Agrawal, D.K.; Zhang, Y.; Huang, K. Compact Four-Port Waveguide Circulator Using Discrete Ferrites for Injection-Locking Magnetron System. Electronics 2024, 13, 997. [Google Scholar] [CrossRef]
- Choe, H.; Lim, S. Millimeter-Wave Continuous Transverse Stub (CTS) Antenna Array Using Substrate Integrated Waveguide (SIW) Technology. IEEE Trans. Antennas Propag. 2014, 62, 5497–5503. [Google Scholar] [CrossRef]
- Ouyang, Z.; Surla, V.; Cho, T.S.; Ruzic, D.N. Characterization of an Atmospheric-Pressure Helium Plasma Generated by 2.45-GHz Microwave Power. IEEE Trans. Plasma Sci. 2012, 40, 3476–3481. [Google Scholar] [CrossRef]
- Wnukowski, M.; Gerber, J.; Mróz, K. Shifts in Product Distribution in Microwave Plasma Methane Pyrolysis Due to Hydrogen and Nitrogen Addition. Methane 2022, 1, 286–299. [Google Scholar] [CrossRef]
Disclaimer/Publisher’s Note: The statements, opinions and data contained in all publications are solely those of the individual author(s) and contributor(s) and not of MDPI and/or the editor(s). MDPI and/or the editor(s) disclaim responsibility for any injury to people or property resulting from any ideas, methods, instructions or products referred to in the content. |
© 2024 by the authors. Licensee MDPI, Basel, Switzerland. This article is an open access article distributed under the terms and conditions of the Creative Commons Attribution (CC BY) license (https://creativecommons.org/licenses/by/4.0/).