Article

Research on Photovoltaic Maximum Power Point Tracking Control Based on Improved Tuna Swarm Algorithm and Adaptive Perturbation Observation Method

1
State Key Laboratory of Disaster Prevention and Reduction for Power Grid, Changsha University of Science and Technology, Changsha 410114, China
2
School of Electrical and Information Engineering, Changsha University of Science and Technology, Changsha 410114, China
*
Author to whom correspondence should be addressed.
Energies 2024, 17(12), 2985; https://doi.org/10.3390/en17122985
Submission received: 22 May 2024 / Revised: 12 June 2024 / Accepted: 14 June 2024 / Published: 17 June 2024
(This article belongs to the Section A2: Solar Energy and Photovoltaic Systems)

Abstract

:
In situations where photovoltaic (PV) systems are exposed to varying light intensities, the conventional maximum power point tracking (MPPT) control algorithm may become trapped in a local optimal state. In order to address this issue, a two-step MPPT control strategy is suggested utilizing an improved tuna swarm optimization (ITSO) algorithm along with an adaptive perturbation and observation (AP&O) technique. For the sake of enhancing population diversity, the ITSO algorithm is initialized by the SPM chaos mapping population. In addition, it also uses the parameters of the spiral feeding strategy of nonlinear processing and the Levy flight strategy adjustment of the weight coefficient to enhance global search ability. In the two-stage MPPT algorithm, the ITSO is applied first to track the vicinity of the global maximum power point (MPP), and then it switches to the AP&O method. The AP&O method’s exceptional local search capability enables the global MPP to be tracked with remarkable speed and precision. To confirm the effectiveness of the suggested algorithm, it is evaluated against fuzzy logic control (FLC), standard tuna swarm optimization (TSO), grey wolf optimization (GWO), particle swarm optimization (PSO), and AP&O. Finally, the proposed MPPT strategy is verified by the MATLAB R2022b and RT-LAB experimental platform. The findings indicate that the suggested method exhibits improved precision and velocity in tracking, efficiently following the global MPP under different shading conditions.

1. Introduction

Since the beginning of the Industrial Revolution, the global environment has been subjected to a deterioration process that has been accelerated by the extensive exploitation of fossil energy sources, including coal, oil, and natural gas. This exploitation has led to a severe depletion of non-renewable energy sources [1]. As a result, research on electricity generation using renewable energy has been carried out in many countries. The advantages of photovoltaic power generation, including high reliability, low maintenance requirements, and environmental friendliness, have contributed to an increase in the market share of this technology [2]. Many countries have conducted research on related technologies to enhance the efficiency of solar power generation and minimize system power losses. Among them, MPPT control is one of the most efficacious techniques for enhancing the efficiency of solar energy utilization, a topic that has received considerable attention from researchers [3].
Common MPPT techniques consist of the perturbation and observation method (P&O) [4], the incremental conductance (INC) method [5], and the constant voltage method [6]. Nevertheless, in cases of partial shading conditions (PSCs), the conventional method is at risk of becoming stuck in a local solution, leading to significant power reduction [7].
A multitude of MPPT control techniques, which make use of swarm optimization, are proposed as a means of enhancing the efficiency of solar energy utilization in PV systems when PSC is employed [8,9]. Among the most commonly utilized intelligent MPPT methodologies are PSO [10], GWO [11], the multiverse algorithm [12], the cuckoo search algorithm [13], black widow optimization [14], and the whale optimization algorithm [15], etc. In Ref. [16], an MPPT method is presented based on a search and rescue optimization algorithm. This approach is relatively straightforward, can be easily implemented, and effectively reduces oscillation. However, its tracking speed could be improved. Moreover, Ref. [17] investigated the MPPT based on a horse racing algorithm, which reduces both calculation requirements and transient oscillations in the system output power. However, this approach has been identified as having a slow convergence speed as a disadvantage. The authors of Ref. [18] employed the cat swarm algorithm for MPPT control and compared it with the PSO algorithm in a simulation study. The results demonstrate that the proposed algorithm markedly enhances convergence accuracy and speed; however, it also exhibits a more pronounced system power oscillation. Aiming at the problems of low convergence accuracy and poor stability of the standard intelligent algorithm, the researchers have made relevant improvements and achieved good results compared with the original algorithm. A more advanced MPPT control algorithm utilizing mayfly optimization was suggested by Ref. [19]. The suggested approach enhances the algorithm’s speed and precision by implementing various enhancements, including genetic variation in offspring and a gravity coefficient mechanism, although there is a slight oscillation range. Traditional PSO has inconsistent convergence under PSCs, and in order to improve its MPPT performance, Ref. [20] proposed a PSO scheme based on Levy flight. The outcomes demonstrated that the suggested control technique successfully boosted the operational productivity of the photovoltaic system and minimized the output’s stable-state fluctuation, although it required a lengthy period to follow the MPP. All of the above algorithms can track the global MPP, but they have the problem that the output oscillation is large, and the tracking speed and accuracy cannot be taken into account at the same time.
In addition, other scholars have used MPPT control methods based on artificial intelligence techniques to enhance the performance of PV systems, such as FLC, neural networks, machine learning, etc. In Ref. [21], a more advanced T-S fuzzy control approach was suggested, demonstrating that it is capable of quickly following the MPP. Still, the proposed scheme requires five input quantities, which means additional sensors are needed, increasing the controller’s complexity and control cost. The authors of Ref. [22] made some improvements to the backpropagation neural network and proposed a new MPPT control method based on it, which performed well in output power tracking efficiency, stability, and other aspects. However, in order to guarantee the accurate and efficient operation of the MPPT controller in various settings, extensive data are required for training purposes. The authors of Ref. [23] developed a pair of MPPT regulators utilizing deep reinforcement learning to address the issue of conventional approaches being unable to follow the MPP. Nevertheless, due to the complexity of neural networks, practical operation has some difficulties. Although these methods can track MPP under PSCs, they suffer from disadvantages such as overreliance on the system, high controller cost and complexity, and the need for a large amount of data for training.
In an effort to enhance the optimization performance of a single MPPT control method, researchers have recently attempted to combine several algorithms [24,25,26]. This hybrid MPPT control method effectively integrates the advantages of various algorithms, offering a promising avenue for future research. This paper suggests a hybrid MPPT control strategy that combines intelligent algorithms with conventional methods, drawing inspiration from these techniques. The TSO algorithm, as described in reference [27], is a recently developed smart algorithm with straightforward principles and minimal adjustable parameters. It is possible that future enhancements could be made to both the tracking speed and accuracy. In order to enhance the worldwide search capability of the typical TSO algorithm, an SPM chaotic map is utilized for population initialization. In conjunction with this, the Levy flight strategy is implemented for the weight coefficient. This approach serves to boost population diversity and broaden the search scope of individuals. As a result of these factors, the algorithm is able to escape from local optima. Since the traditional P&O algorithm makes it easy to produce oscillations near the MPP, a step regulator is introduced to improve the tracking speed and reduce the generation of oscillations. Hence, this study merges the enhanced ITSO method with AP&O [28] in order to create a fresh MPPT regulator, enhancing the speed and precision of the algorithm. Initially, the ITSO algorithm rapidly reaches the global MPP and then transitions to the AP&O algorithm for precise monitoring until it settles at the MPP. The new algorithm outperforms traditional AP&O, FLC, PSO, GWO, and TSO algorithms in terms of speed and stability when dealing with various shading conditions. This paper’s principal focus is as follows.
  • The TSO and P&O algorithms, which are standard in this context, have undergone improvement to enhance both the speed and the accuracy of convergence;
  • This MPPT controller employs an intelligent switching technique based on the ITSO and AP&O algorithms. It is designed to address the limitations of traditional MPPT methodologies, which are prone to failure in tracking the MPP and exhibiting erratic behavior in the presence of local shadowing;
  • The standard TSO, PSO, GWO, FLC, and AP&O are compared with the proposed algorithm to verify its performance;
  • The real-time simulation platform of PV MPPT based on RT-LAB was constructed with the objective of validating the superiority of the proposed MPPT control method.
The following is the organizational structure of this paper: Section 2 discusses the output characteristics of PV systems under PSC. Section 3 describes the MPPT algorithm based on ITSO-AP&O. Section 4 shows the results of the simulation. Section 5 employs RT-LAB to assess the feasibility and efficacy of ITSO-AP&O. Lastly, Section 6 concludes the paper.

2. Output Characteristics of PV System under Partial Shade

In practice, since PV systems are affected by the terrain, environment, weather, and other factors, the sunlight cannot be evenly irradiated on each PV cell, resulting in PSCs. When shaded, the PV cells will absorb the energy produced by the entire system and transform it into heat, resulting in a total power generated by the system that is less than the sum of the individual PV cell powers. The prolonged operation of a PV system in PSCs may raise the battery temperature and, subsequently, form localized heat, commonly referred to as the hot spot effect. This phenomenon has the potential to significantly impact the output power and safety of the PV system when operating under PSCs.
Parallel diodes at the two poles of each PV cell can effectively prevent the cell from overheating and burning out, and this is because the diodes connected in parallel to the shielded PV cells will be turned on and short-circuited during the PSCs. While the parallel diode prevents localized overheating, it also alters the P-U output properties of the solar cell, leading to the appearance of several local peaks. To confirm the efficiency of the suggested MPPT technique, a 5 × 1 solar panel array is utilized in the simulation analysis. Each photovoltaic cell is maintained at a temperature of 25 °C, with light intensity measured in W/m2, and three distinct lighting conditions are established based on the battery’s shading. The PV array’s P-U curve is depicted in Figure 1.
Figure 1 shows that the PV panel is unshaded in environment 1, with a single peak on its P-U characteristic curve. When the PV array is under environments 2 and 3, the number of cells in the shaded state of the PV array is four and three, respectively, and the peak points of the P-U characteristic curve are five and four, respectively, and the global MPP decreases in both cases. Therefore, a PV system operating in a shaded environment will have a significant loss in its output power. Moreover, the conventional MPPT algorithm may lead to a local optimum instead of tracking the global MPP. Thus, it is of great significance to study the MPPT algorithm that can track the global MPP.

3. MPPT Algorithm Based on ITSO-AP&O

3.1. Tuna Swarm Optimization

Tuna, a predatory fish that lives in the ocean, preys on different types of fish found in the middle and upper parts of the water column. Despite the tuna’s considerable swimming speed, it remains outpaced by the swift reactions of its smaller piscine counterparts. Consequently, the tuna swarm will employ the collective predatory strategy of group cooperation. Spiral foraging is the initial approach. When tuna forage, they form a spiral that drives their prey to shallow waters, where they are more vulnerable. Parabolic foraging is the second approach. Every tuna swims alongside the one before it, creating a curved formation to surround the prey. The TSO algorithm is mainly inspired by the above two foraging methods. In this paper, it is assumed that these two foraging methods are performed simultaneously, and the probability of selection is 50%.

3.1.1. Spiral Foraging

A predator will have a hard time targeting a small school of fish because they constantly change direction when encountering the predator. The majority of the tuna group is disoriented. When neighboring individuals share information by exchanging position information, the disoriented individuals will follow the nearby tuna that are oriented, eventually forming tight spirals to search for food. The formula for calculating the position to be updated in spiral foraging is as follows:
X i t + 1 = α 1 ( X b e s t t + β X b e s t t X i t ) + α 2 X i t , i = 1 α 1 ( X b e s t t + β X b e s t t X i t ) + α 2 X i 1 t , i = 2 , 3 , , N , r a n d t t max
α 1 = a + ( 1 a ) ( t / t max )
α 2 = ( 1 a ) ( 1 a ) ( t / t max )
β = e b l c o s ( 2 π b )
l = e ( ( ( t max + 1 / t ) 1 ) π )
where X i t + 1 is the position of the i-th individual after the t + 1 iteration, X b e s t t denotes the position of the current best individual, N denotes the number of populations, α1 and α2 represent the weight coefficients that control the movement trend of an individual in comparison to the optimal or previous individual, t is the current iteration number, a is a constant that represents the extent to which the tuna adheres to the initial optimal individual, b and rand are random variables that take values between 0 and 1, l denotes the helix parameter, β represents the distance between the ith individual and the optimal individual, and tmax denotes the maximum iteration number.
If the best individual is unable to locate the prey, it is not beneficial for the group foraging to blindly follow the best individual to search for food. Expanding the search area of each tuna by randomly generating a reference coordinate can enhance the algorithm’s capability for global exploration. The location update formula is as follows:
X i t + 1 = α 1 ( X r a n d t + β X r a n d t X i t ) + α 2 X i t   , i = 1 α 1 ( X r a n d t + β X r a n d t X i t ) + α 2 X i 1 t , i = 2 , 3 , , N , r a n d < t t max
where X r a n d t is the position of the current random individual.

3.1.2. Parabolic Foraging

As well as spiral foraging, tunas use parabolas to hunt. They use prey as a reference coordinate to hunt with a parabolic shape. Tuna schools use their prey as a reference point to form parabolas. At the same time, the tuna will search for prey in the surrounding area. The position update formula is as follows:
X i t + 1 = X b e s t t + r a n d ( X b e s t t X i t ) + T F p 2 ( X b e s t t X i t ) , i f   r a n d < 0.5 T F p 2 X i t , i f   r a n d 0.5
where TF denotes a random variable with a value of 1 or −1 and p denotes an adaptive parameter that changes depending on the number of iterations.

3.2. Improved Tuna Swarm Optimization

The TSO algorithm typically starts by creating a population using pseudorandom numbers, resulting in an overconcentration of individuals and impacting the algorithm’s speed and accuracy of convergence. Furthermore, the spiral foraging strategy linearly varies the weight coefficients α1 and α2. Consequently, during the initial stages of iteration, it is easy to become stuck in the local maximum. This phenomenon is exacerbated by the slow change in the coefficients during subsequent iterations.
To solve the above problems in the standard TSO, this paper improves it from two perspectives: enhances it by incorporating the SPM chaotic map for initializing the tuna population. This results in a more uniform distribution of individuals within the search space, leading to enhanced algorithm diversity and global optimization capabilities. Furthermore, the Levy flight strategy and parameter nonlinearization method are employed to adjust the weight coefficients and in the spiral foraging strategy, thereby enabling the algorithm to balance its local and global optimization capabilities.

SPM Chaotic Map

The standard TSO algorithm uses random numbers to initialize the population. Pseudorandom numbers are generated according to certain laws of operation, and the results are predictable and periodic, which can easily cause an uneven distribution of individuals among the populations and the clustering of individuals.
In this paper, the chaotic map is used to initialize the population to solve this problem. Chaotic maps serve to produce chaotic sequences, which are random sequences created by a straightforward deterministic system possessing strong ergodic and random characteristics. Examples of popular chaotic systems are the logistic map, tent map, piecewise linear chaotic map (PWLCM), circle map, and sine map. The SPM map is obtained by combining the sine map and the PWLCM map, which not only expands the range of the chaotic map but also has better ergodic properties. The specific formula is as follows:
y t + 1 = m o d y t δ + μ s i n π y t + h , 1 , 0 y t < δ m o d y t ( 0.5 δ ) δ + μ s i n π y t + h , 1 , δ y t < 0.5 m o d 1 y t δ ( 0.5 δ ) + μ s i n π 1 y t + h , 1 , 0.5 y t < 1 δ m o d 1 y t δ + μ s i n π 1 y t + h , 1 , 1 δ y t < 1
where yt and yt+1 represent the SPM chaotic sequence of iteration t and t + 1, respectively, δ and μ are customized parameters, and h represents the disturbance parameter of the chaotic system, which is a random number between 0 and 1. When δ is a value between 0 and 0.5, and μ is a number between 0 and 1, the system is in a chaotic state.
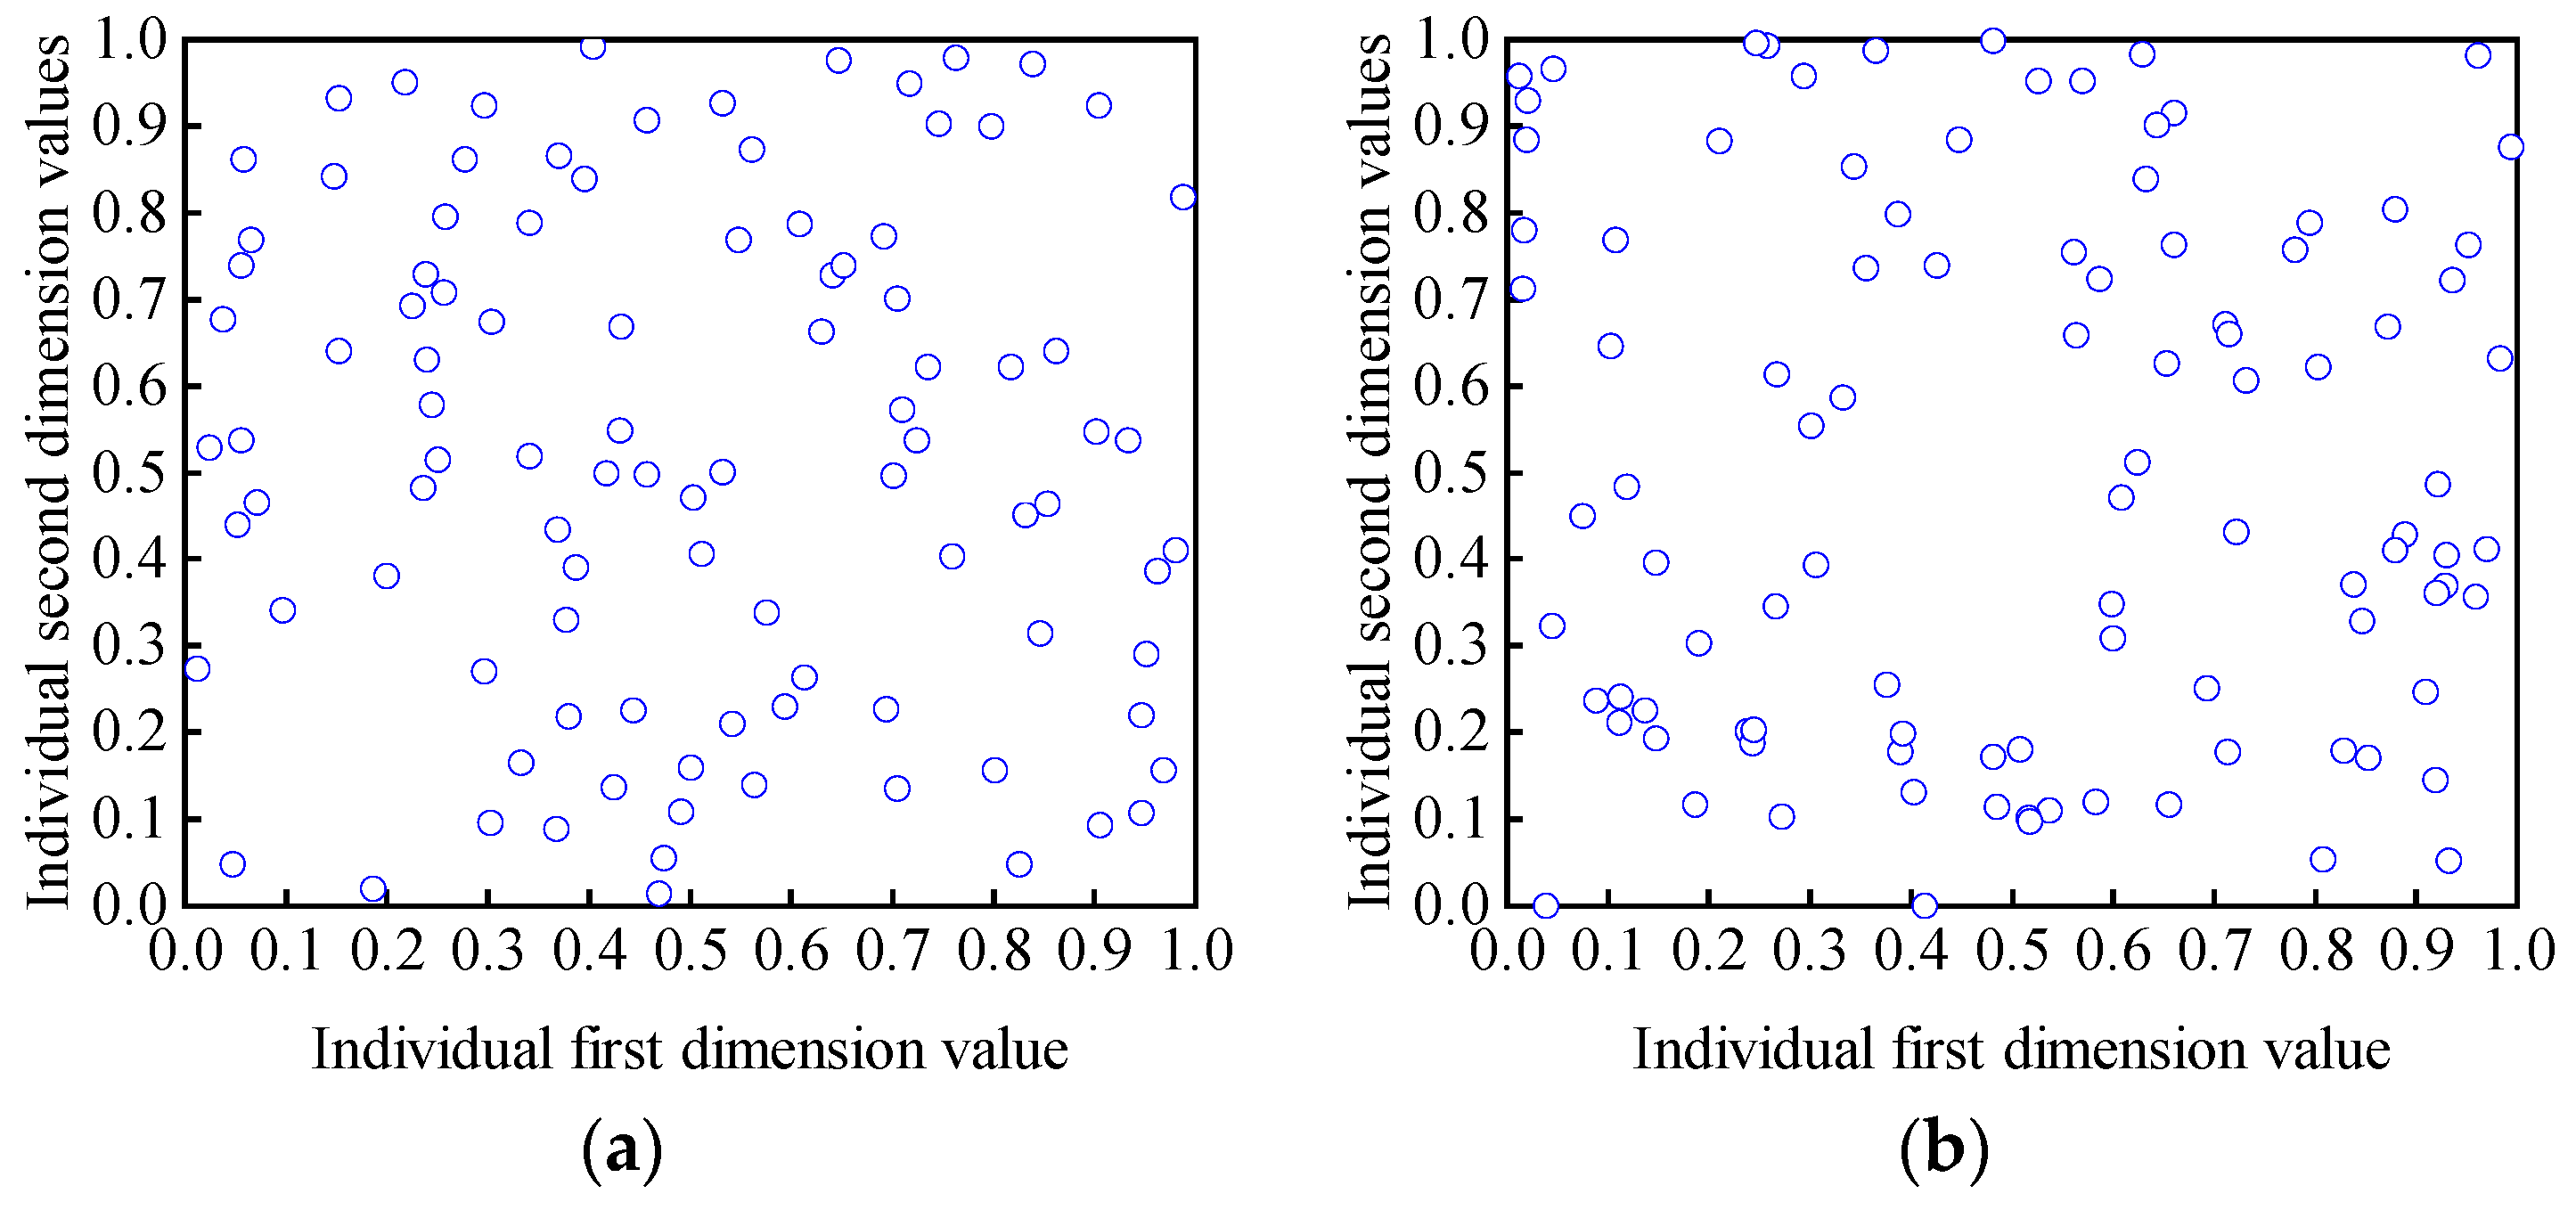
The distribution in the space of the population initialized with an SPM chaotic map and random numbers are compared in Figure 2. The initial population individuals produced by SPM mapping are widely dispersed in space, unlike those generated by random numbers. This ensures population diversity and aids in the algorithm’s ability to avoid local optima, as can be clearly seen from the figure.
The weight coefficients α1 and α2 in the spiral foraging strategy play crucial roles in optimizing the algorithm globally and locally. In the early stage of the iterations, a large weight coefficient should be applied to expand the search space. As the algorithm progresses, a small weight coefficient is preferred to improve local search accuracy. In this paper, the Levy flight strategy is employed to optimize the weight coefficients α1 and α2 [29]. Furthermore, parameter a in the spiral foraging strategy is nonlinearized in order to achieve a balance between the local and global optimization capabilities of the algorithm [30,31].
Levy flight represents a random walk strategy that incorporates both short- and long-distance searches. The step probability associated with this strategy follows a heavy tailed distribution. Consequently, Levy flight is likely to take big steps to help prevent becoming stuck in suboptimal solutions while searching. However, the Levy distribution is too complex, so it is generally simulated by the Mantegna algorithm [32], as shown in Equation (10):
L e v y ( λ ) = u v 1 β
where β is a constant generally taken as 1.5 and u and v follow a normal distribution and are defined as follows:
u N ( 0 , σ u 2 ) , v N ( 0 , σ v 2 ) σ u = Γ ( 1 + β ) sin π β 2 Γ 1 + β 2 β 2 β 1 2 1 β
where σv is generally set to 1, and Γ is the Gamma function.
Equations (2) and (3) in the spiral foraging strategy are modified as follows:
α 1 = a + ( 1 a ) t t max L e v y ( λ )
α 2 = ( 1 a ) ( 1 a ) t t max L e v y ( λ )
a = s i n π 2 + π 2 t t max
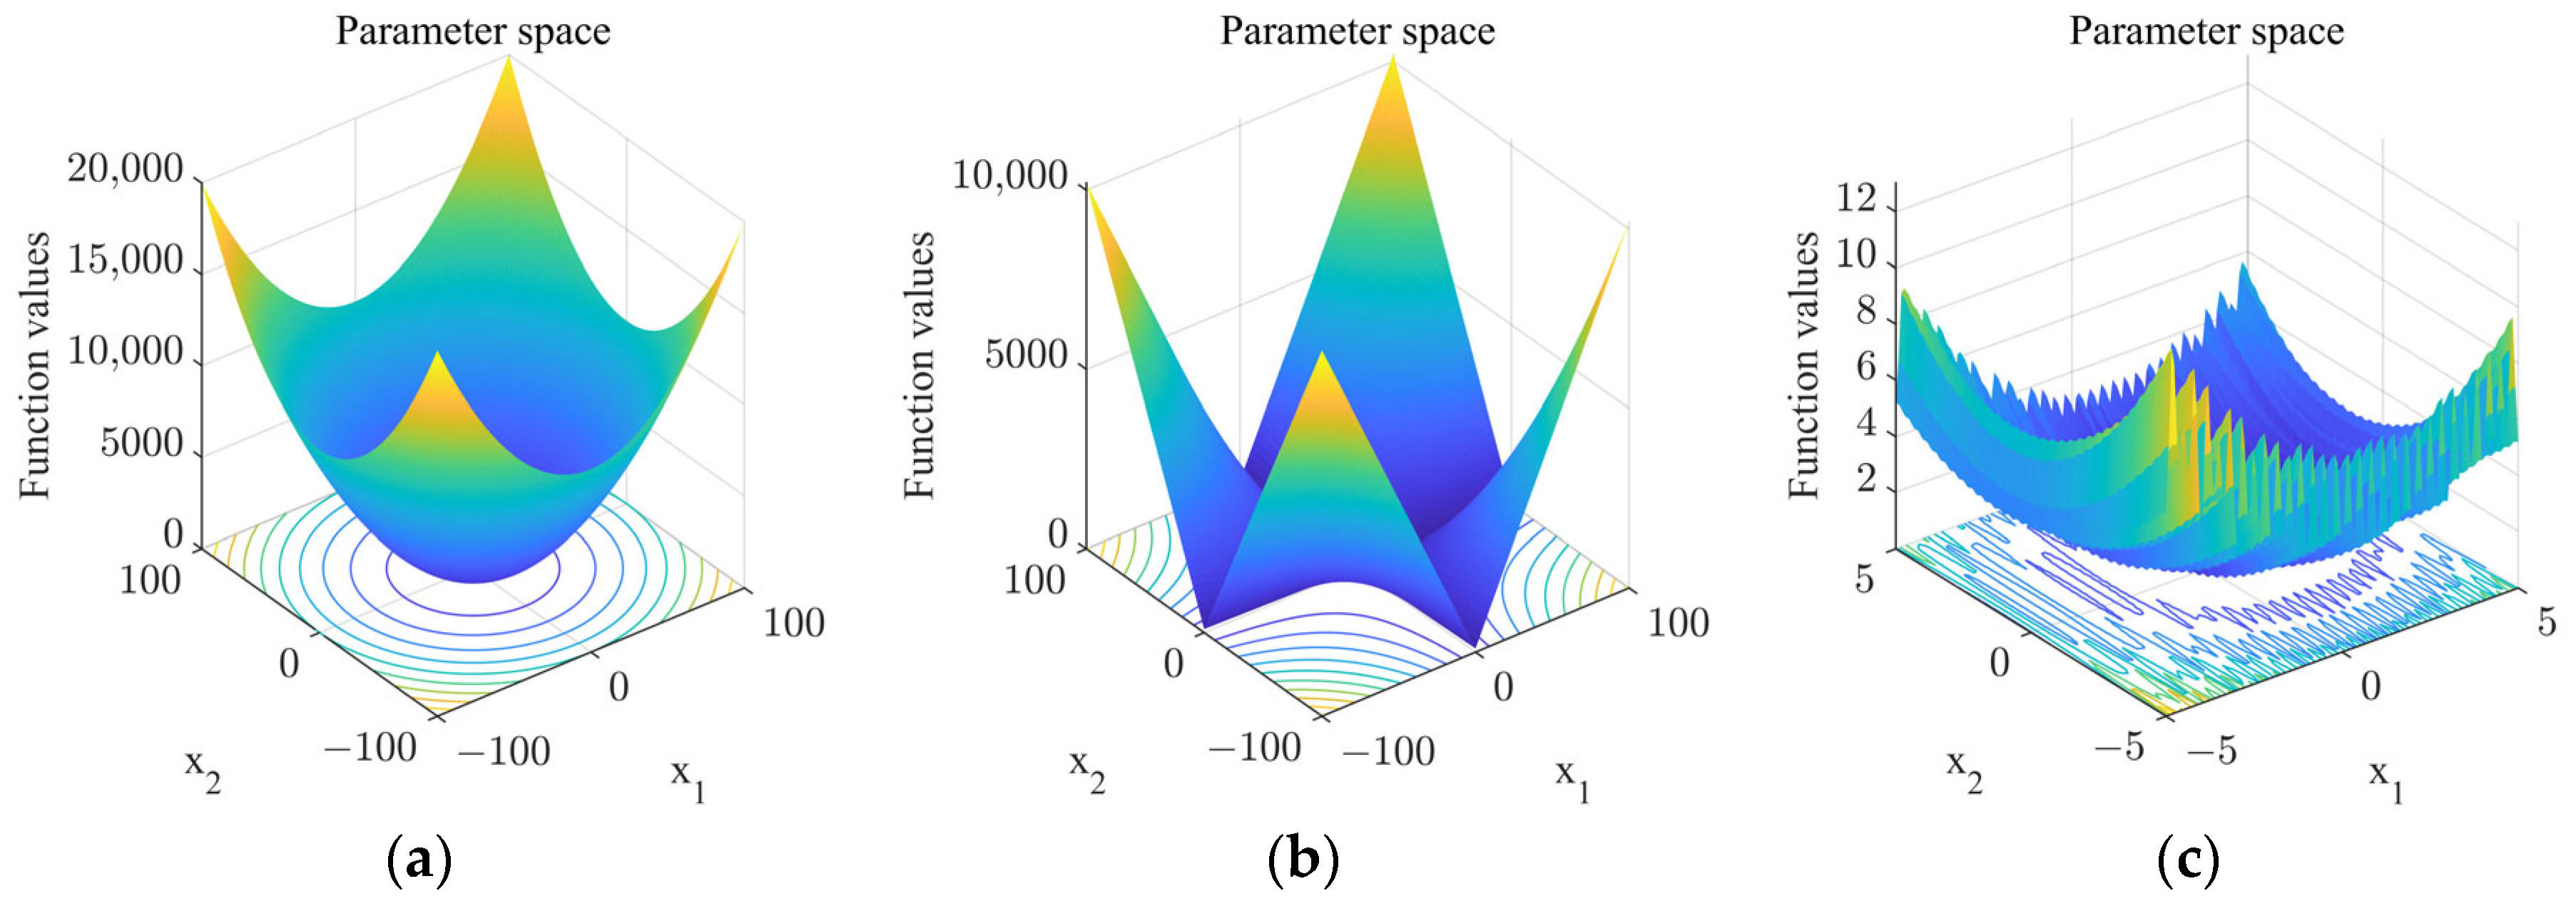
To assess the improved algorithm’s efficacy, this study chooses three traditional functions, Sphere, Schwefel 2.22, and Penalized 2, to evaluate its efficiency and contrast it with the standard TSO algorithm. Figure 3 gives a 3D view of these three test functions, and it can be seen that Sphere and Schwefel 2.22 exhibit a single peak, which can be employed to assess the precision of the algorithm’s search process. Penalized 2 contains several peaks that can be used to test the global exploration capabilities of the algorithm and the speed at which it converges. The minimum value of these three groups of benchmark functions in the search space is 0.
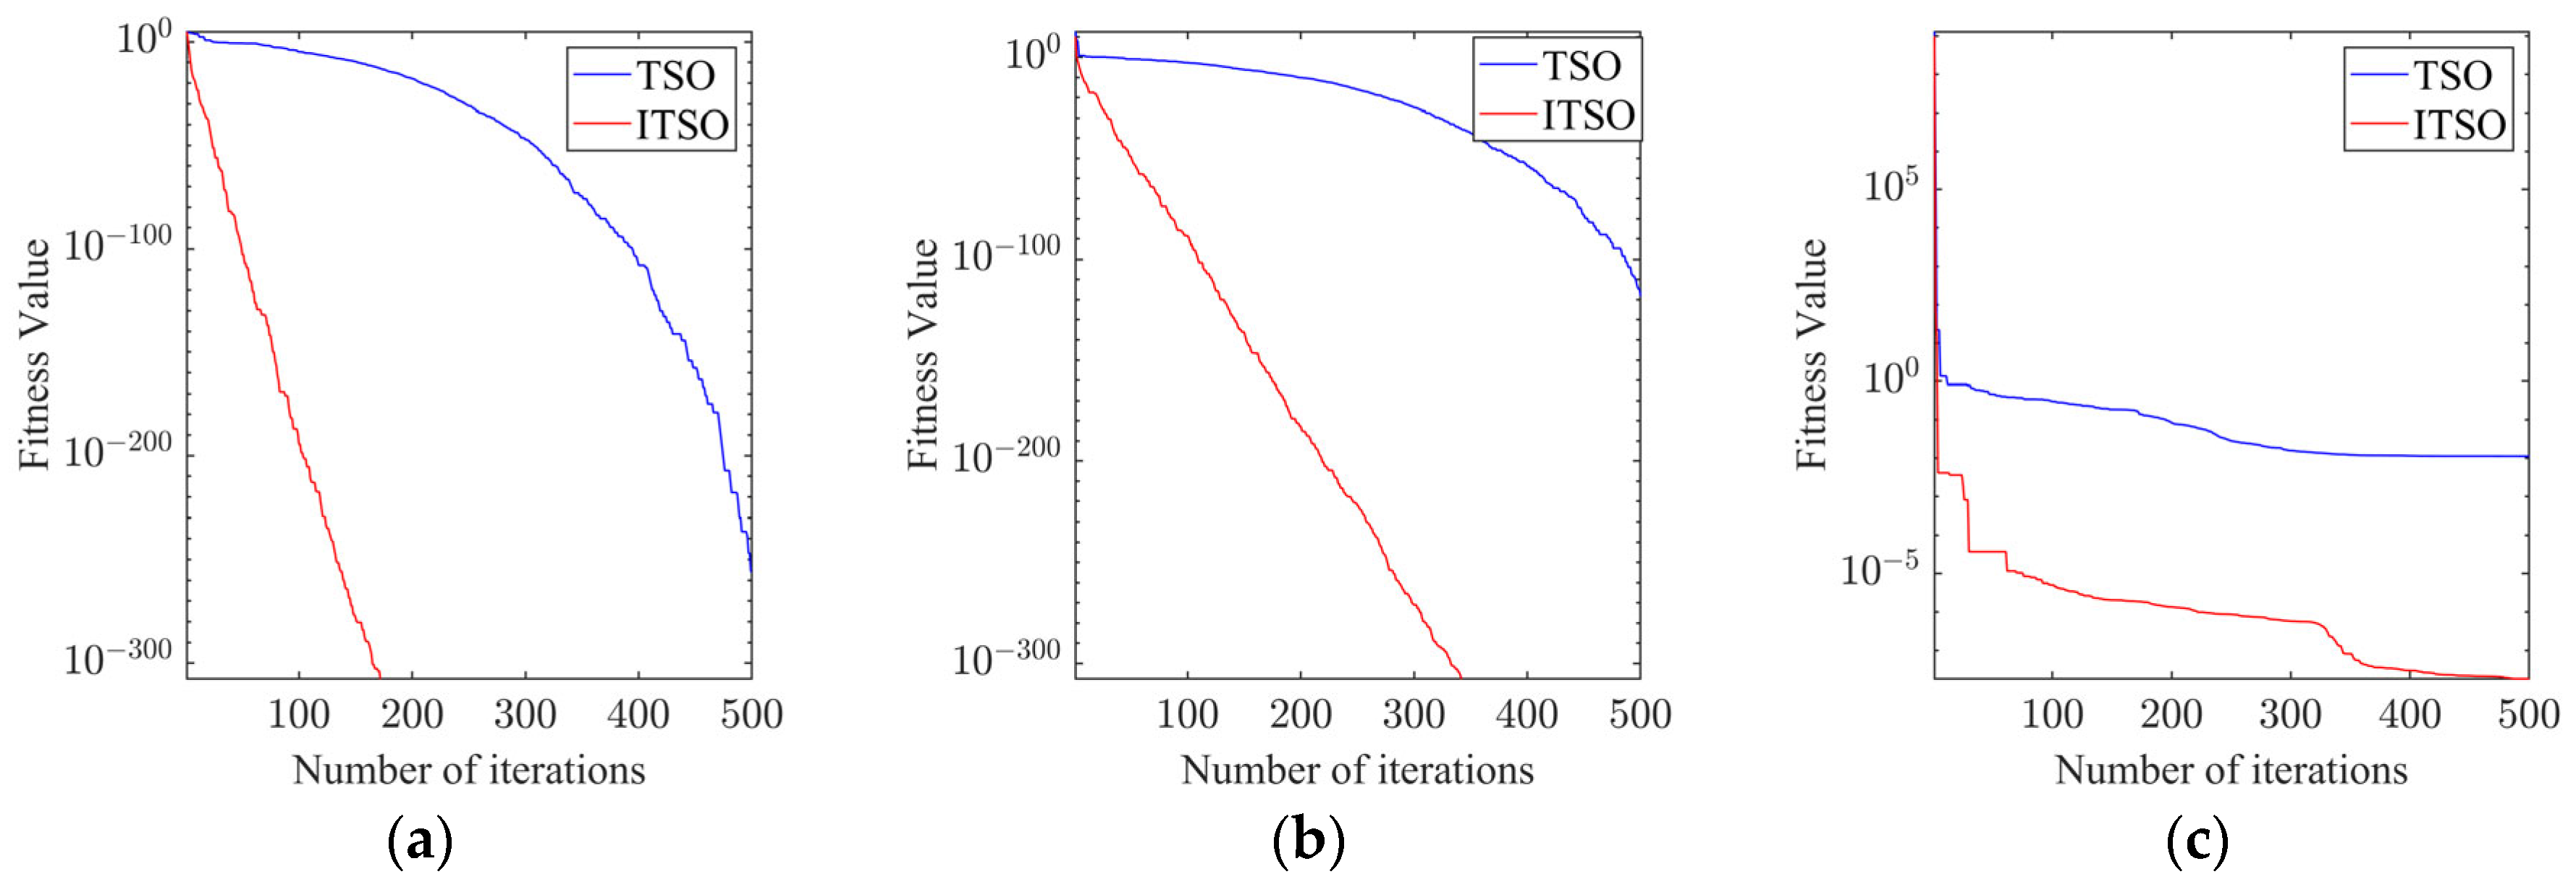
In the MATLAB R2022b running environment simulation test on the ITSO algorithm proposed in this paper, we set the population size to 30, the maximum number of iterations to 500, and respectively run 30 times independently. For the convergence test results, the function curve of the figure is shown in Table 1 and Figure 4.
It can be concluded from the analysis of Figure 4 that ITSO shows faster convergence speed and greater convergence accuracy for the solution of the three test functions. The results of 30 independent test experiments in Table 1 illustrate that ITSO has significantly higher accuracy for the optimal solutions of the three test functions. ITSO is also several orders of magnitude higher than the TSO algorithm in terms of mean and standard deviation. From the above findings, the proposed improvement strategy can effectively improve the sum convergence speed of the TSO algorithm and provide excellent global exploration and local utilization capabilities.

3.3. Adaptive Perturbation and Observation Method

P&O stands as a frequently utilized conventional MPPT control technique in PV systems, providing benefits like straightforward operation, limited measurement data, and effortless execution. Nevertheless, there are drawbacks to consider. If the perturbation step size is too big, the tracking speed increases but may oscillate close to the MPP. Conversely, tracking accuracy improves if the step size is too small, but the system will take longer to reach the MPP. Additionally, changes in light intensity can lead to misjudgments with the P&O method, potentially causing ‘voltage collapse’.
In order to solve the problem that P&O cannot take into account tracking speed and tracking accuracy at the same time, the AP&O algorithm is adopted in this paper, and the step size calculation formula is as follows:
s = ε a b s ( Δ P Δ U )
where ΔP is power variation, ΔU is the voltage change, ε is a constant, and abs is the absolute value of the data.
When abs(ΔP) is too large, it indicates a greater distance from the MPP, so a large step size is taken for tracking. When abs(ΔP) is too small, it indicates that it is near the MPP, and a small step is taken for accurate tracking at that time. As a result, the AP&O algorithm is capable of automatically modifying the disturbance step size depending on the system’s proximity to the MPP, which helps reduce oscillations and power loss.
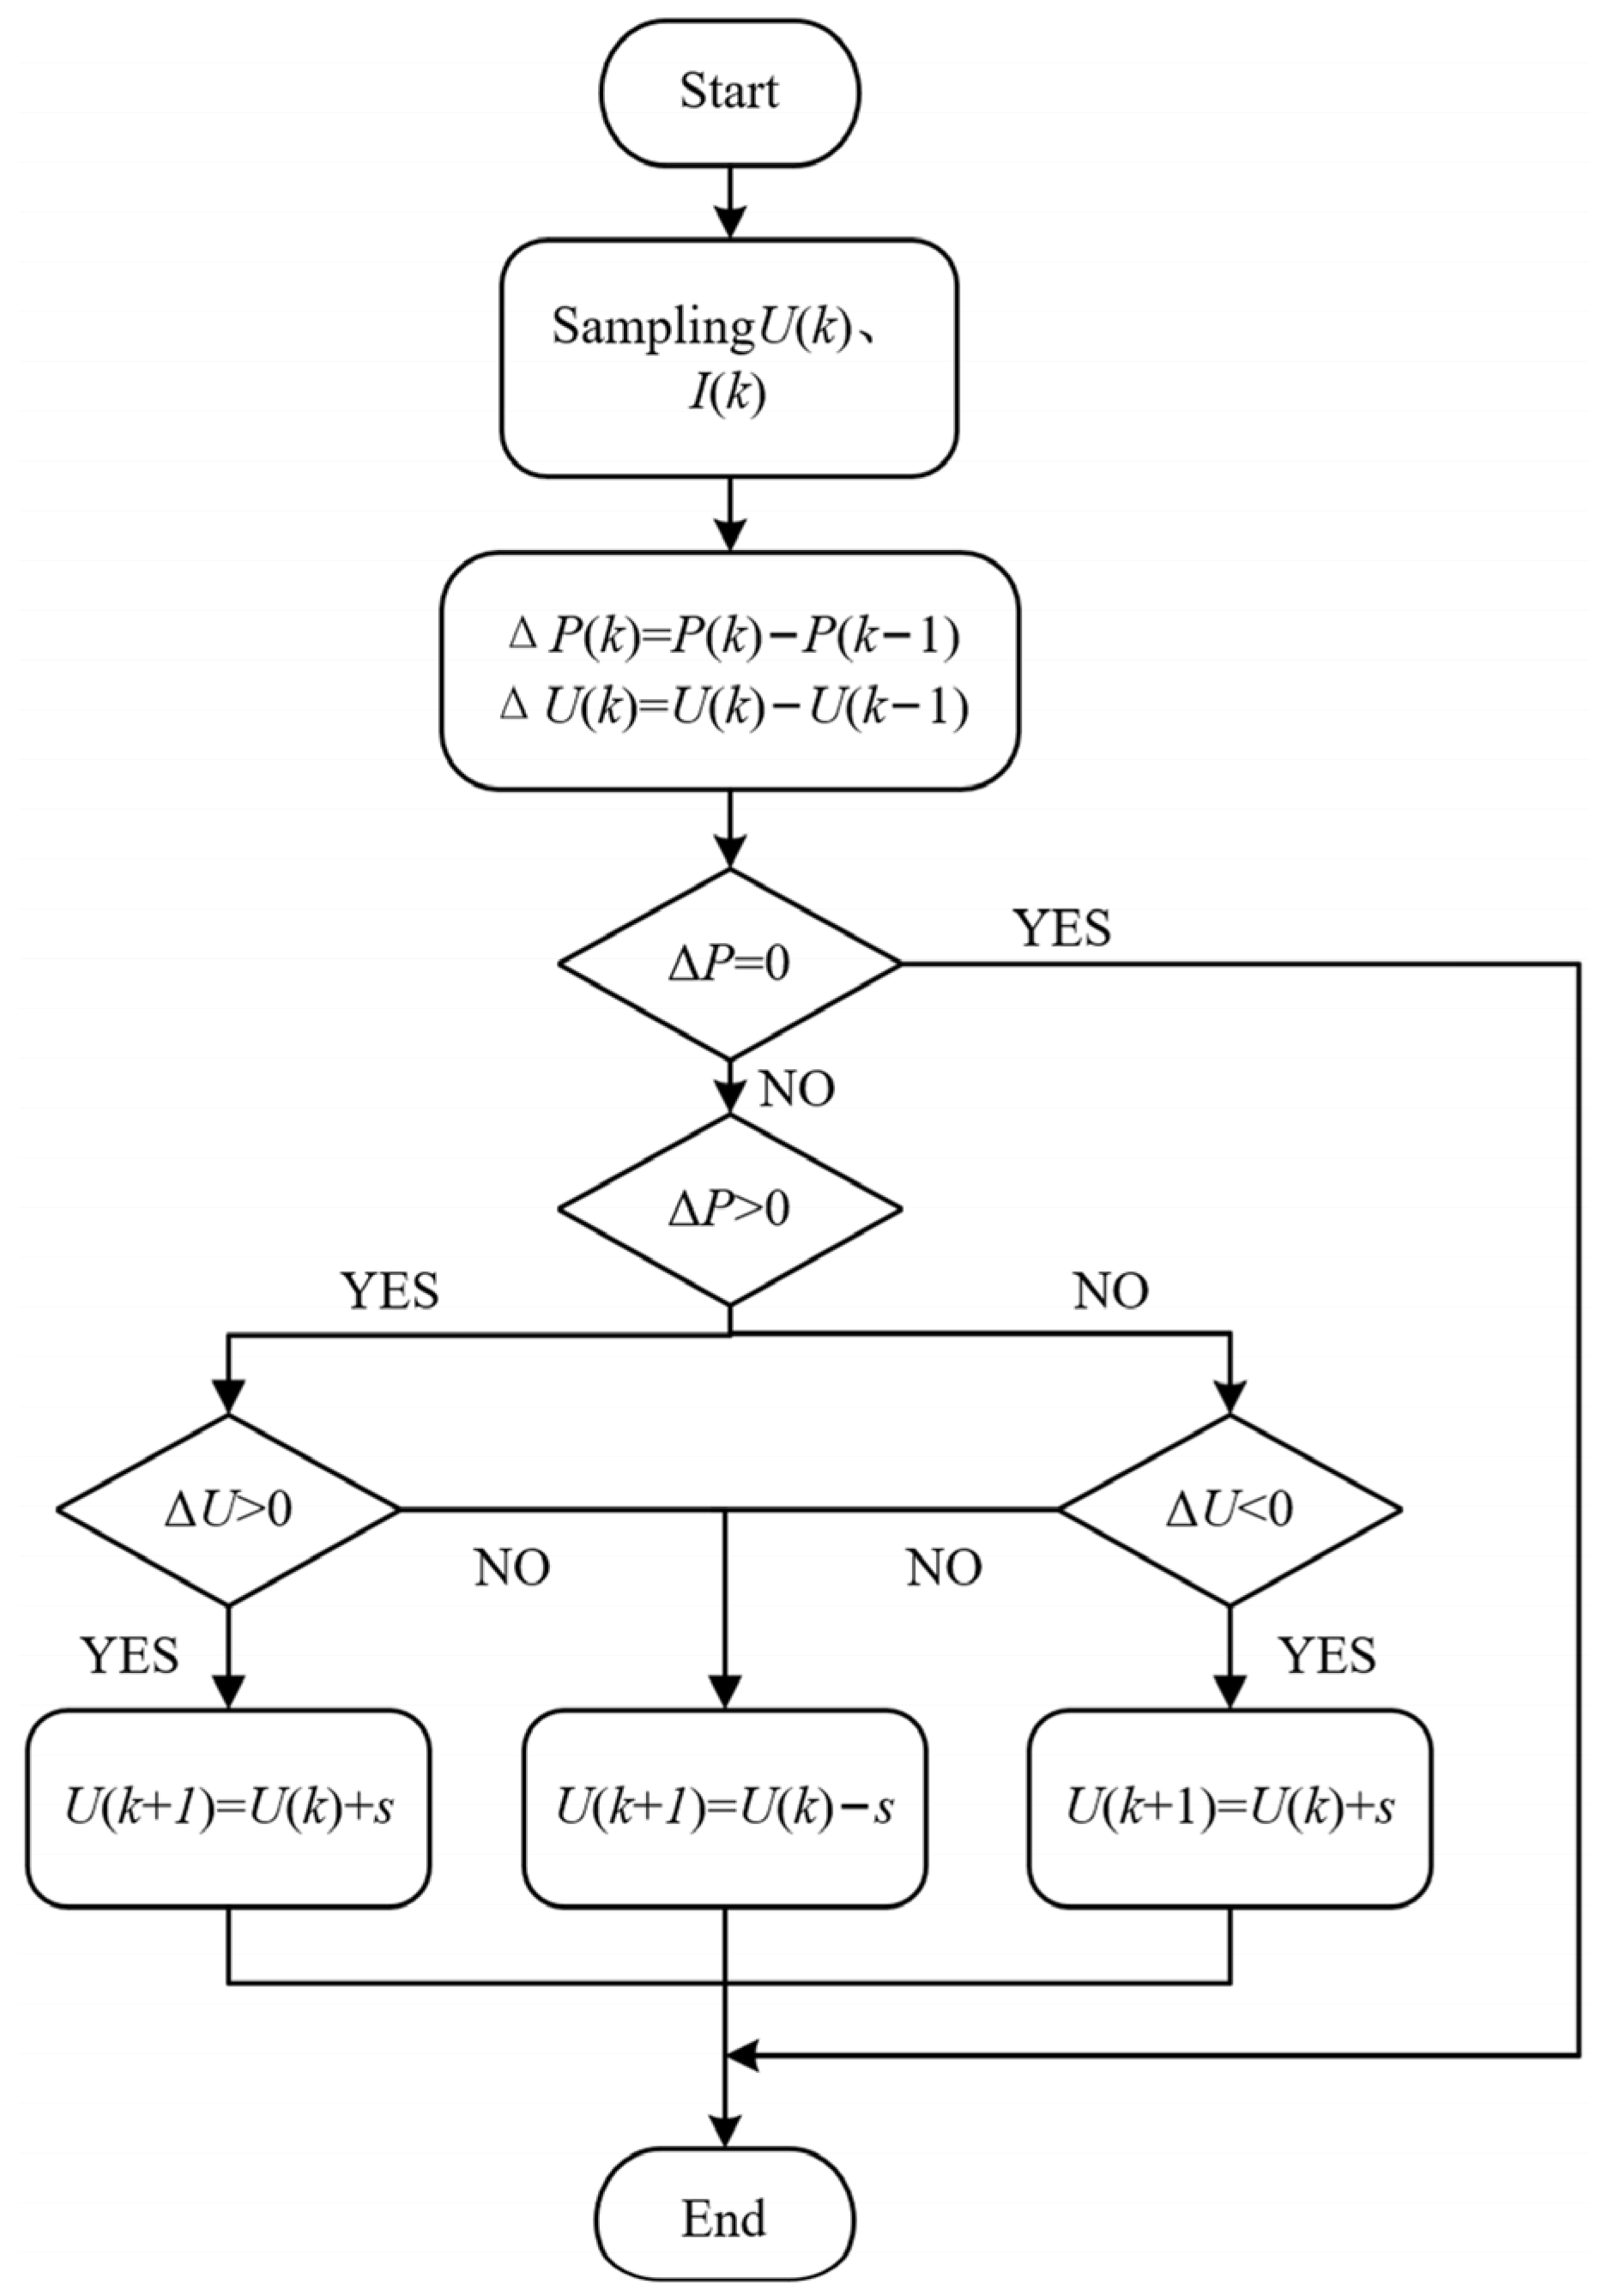
The AP&O algorithm compares the output voltage U(k) and output current I(k) of the PV cell measured at time k with the output voltage U(k − 1) and output current I(k − 1) at time k − 1 to obtain ΔP and ΔU. If both ΔP and ΔU are greater than 0, the negative perturbation step is used, that is, the duty cycle D(k) is reduced. The analysis of the other three cases follows the same process as described above, and the workflow is illustrated in Figure 5.

3.4. Application of ITSO-AP&O Algorithm in MPPT

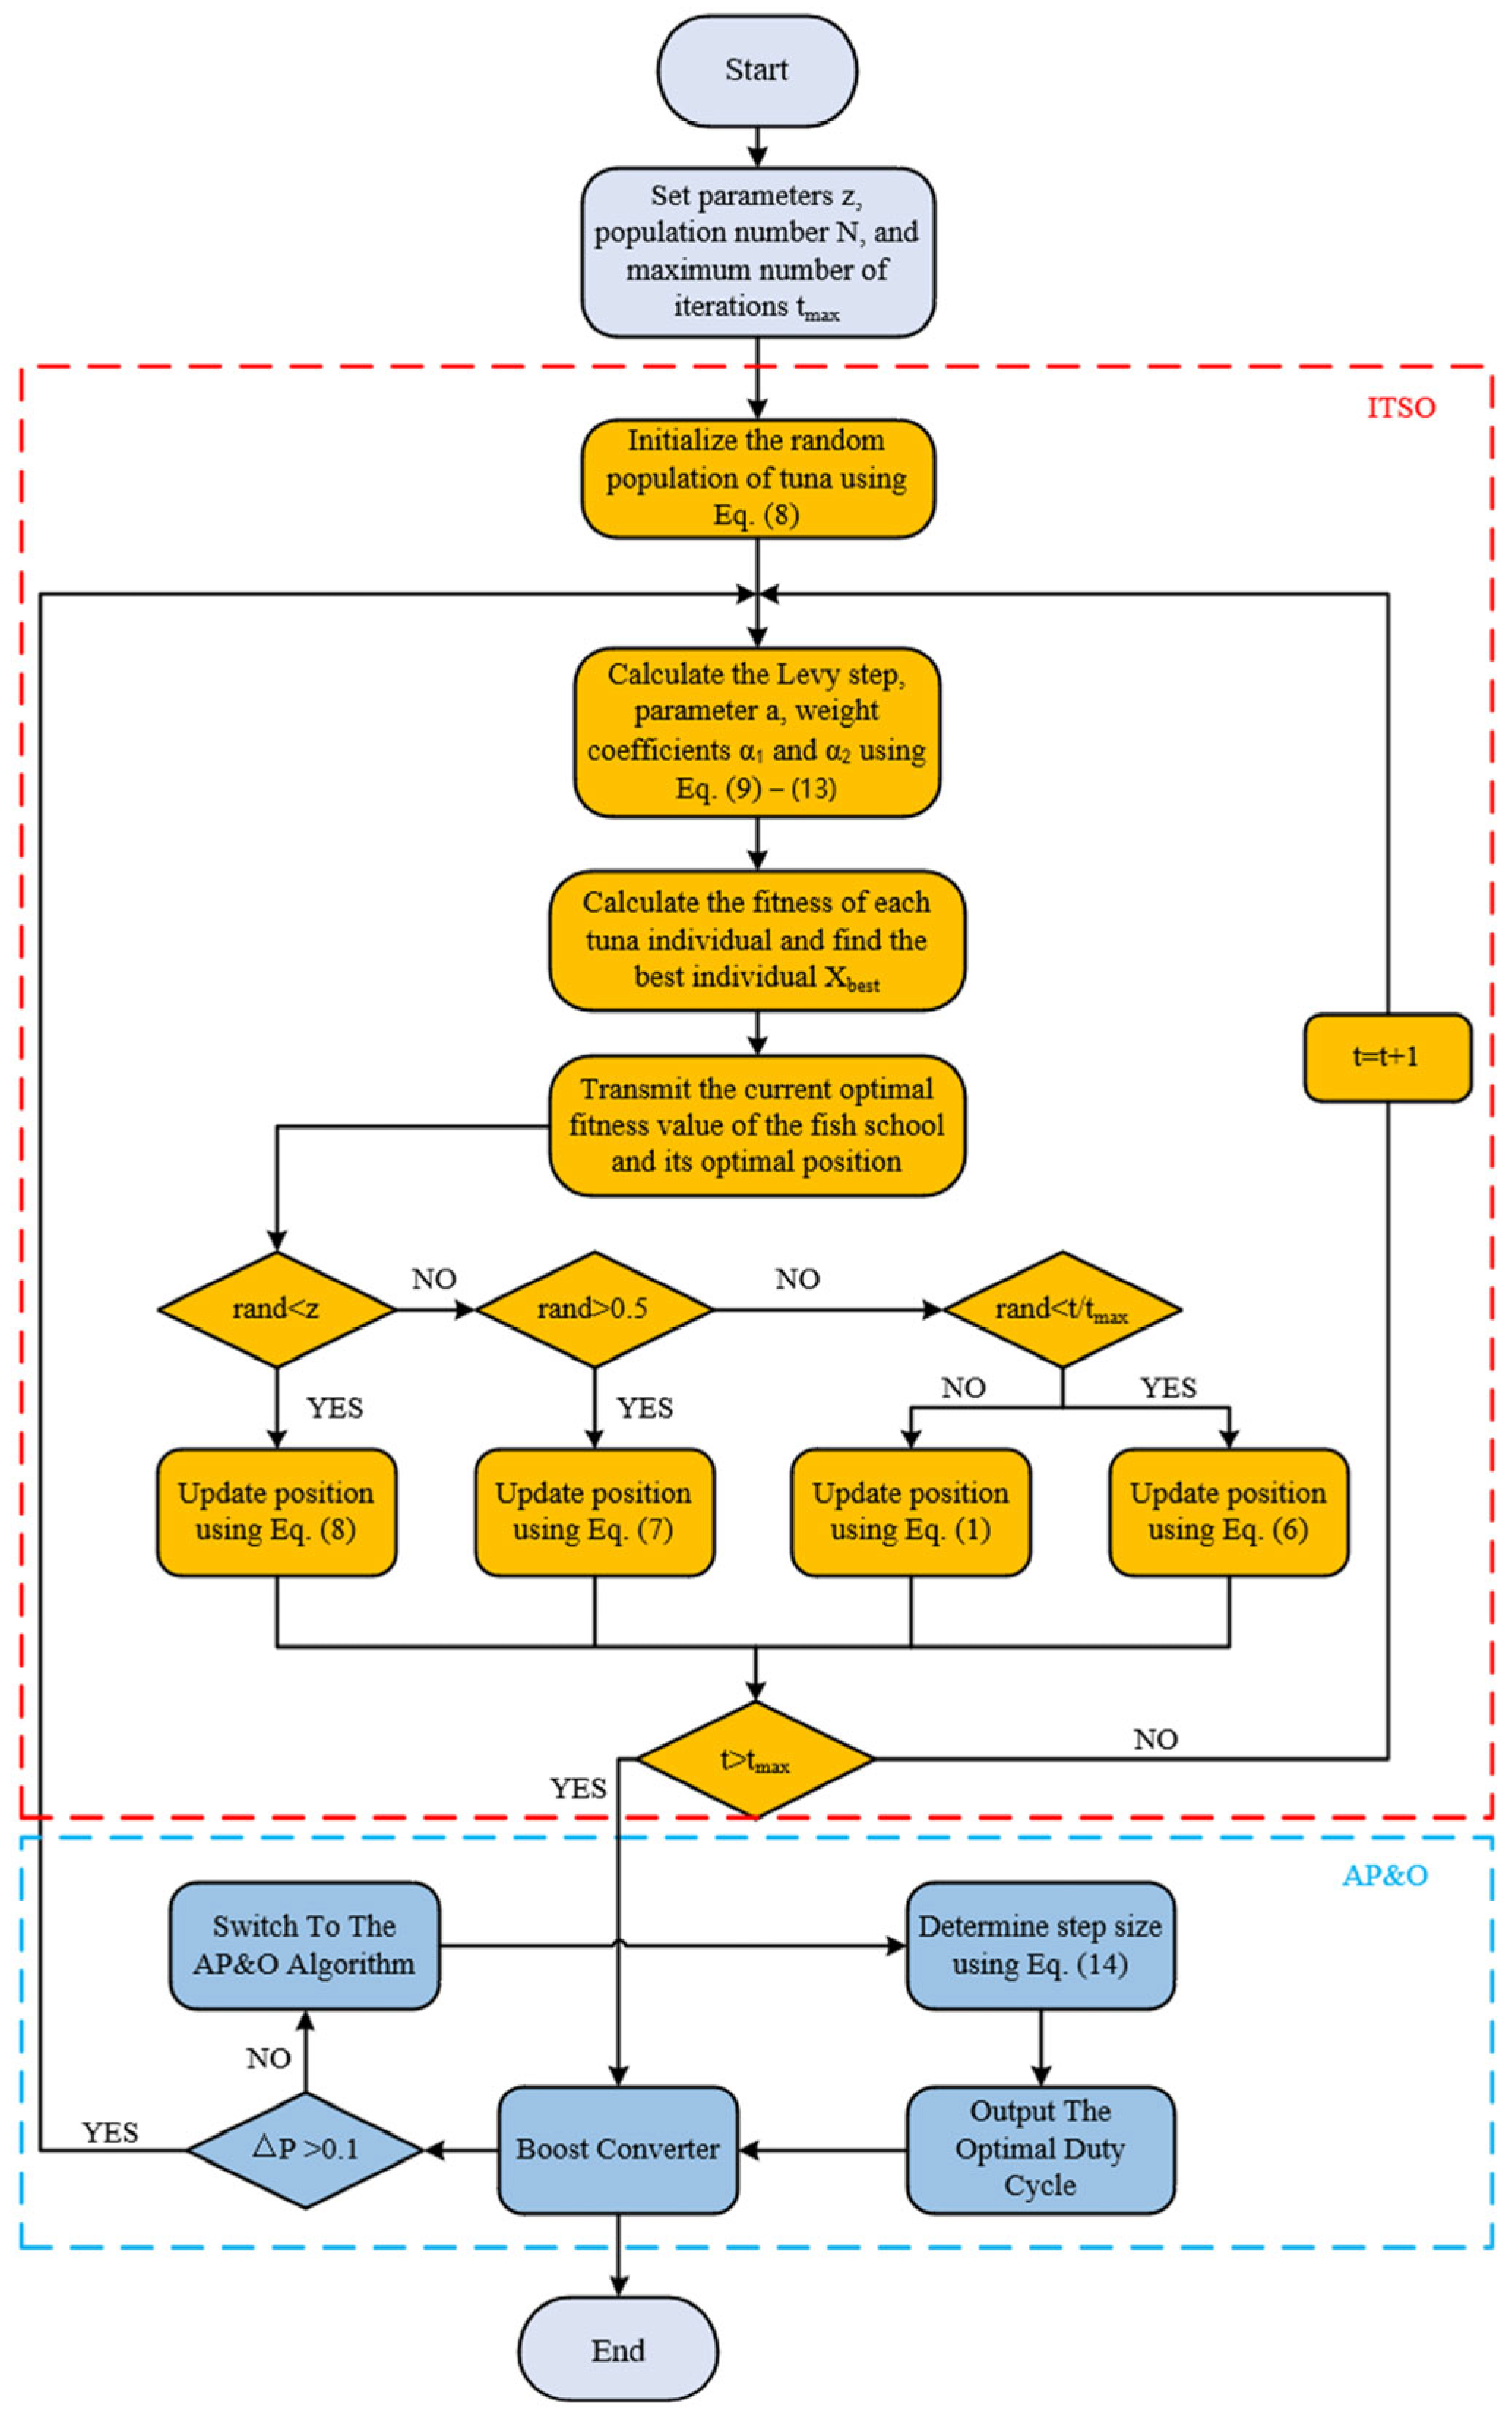
Continuing the ITSO algorithm in the later stages of tracking MPP could potentially extend the duration of MPP tracking. To address this issue, the paper employs the ITSO method along with AP&O, initially achieving rapid convergence to the global MPP with ITSO and then transitioning to AP&O for further tracking until reaching stability at MPP.

3.4.1. Algorithm Restart Condition

In practical applications, restarting the algorithm after changing the global MPP is necessary to reduce the system’s power loss because the PV system’s working environment changes, and its global MPP also changes. The restart condition is as follows:
Δ P = P t P t 1 P t > 0.1
where Pt represents the power of the PV system at the current time and Pt−1 represents the power of the PV system at the previous time.

3.4.2. Algorithm Switching Condition

In order to quickly switch the ITSO algorithm to the AP&O algorithm and avoid falling into an endless loop, a judgment condition is set in this paper: when the maximum number of iterations of the algorithm is reached, it will be immediately switched to AP&O for tracking. Figure 6 displays the flowchart for the ITSO-AP&O algorithm.

4. Simulation Verification and Analysis

To validate the efficiency of the ITSO-AP&O algorithm introduced in this study, a simulation model of the PV system is constructed in Matlab and contrasted with the TSO, GWO, PSO, AP&O, and FLC. The system, illustrated in Figure 7, comprises photovoltaic cells, an MPPT controller, and a boost circuit. The parameters of individual PV modules are shown in Table 2.

4.1. MPPT Tracking without Shadings

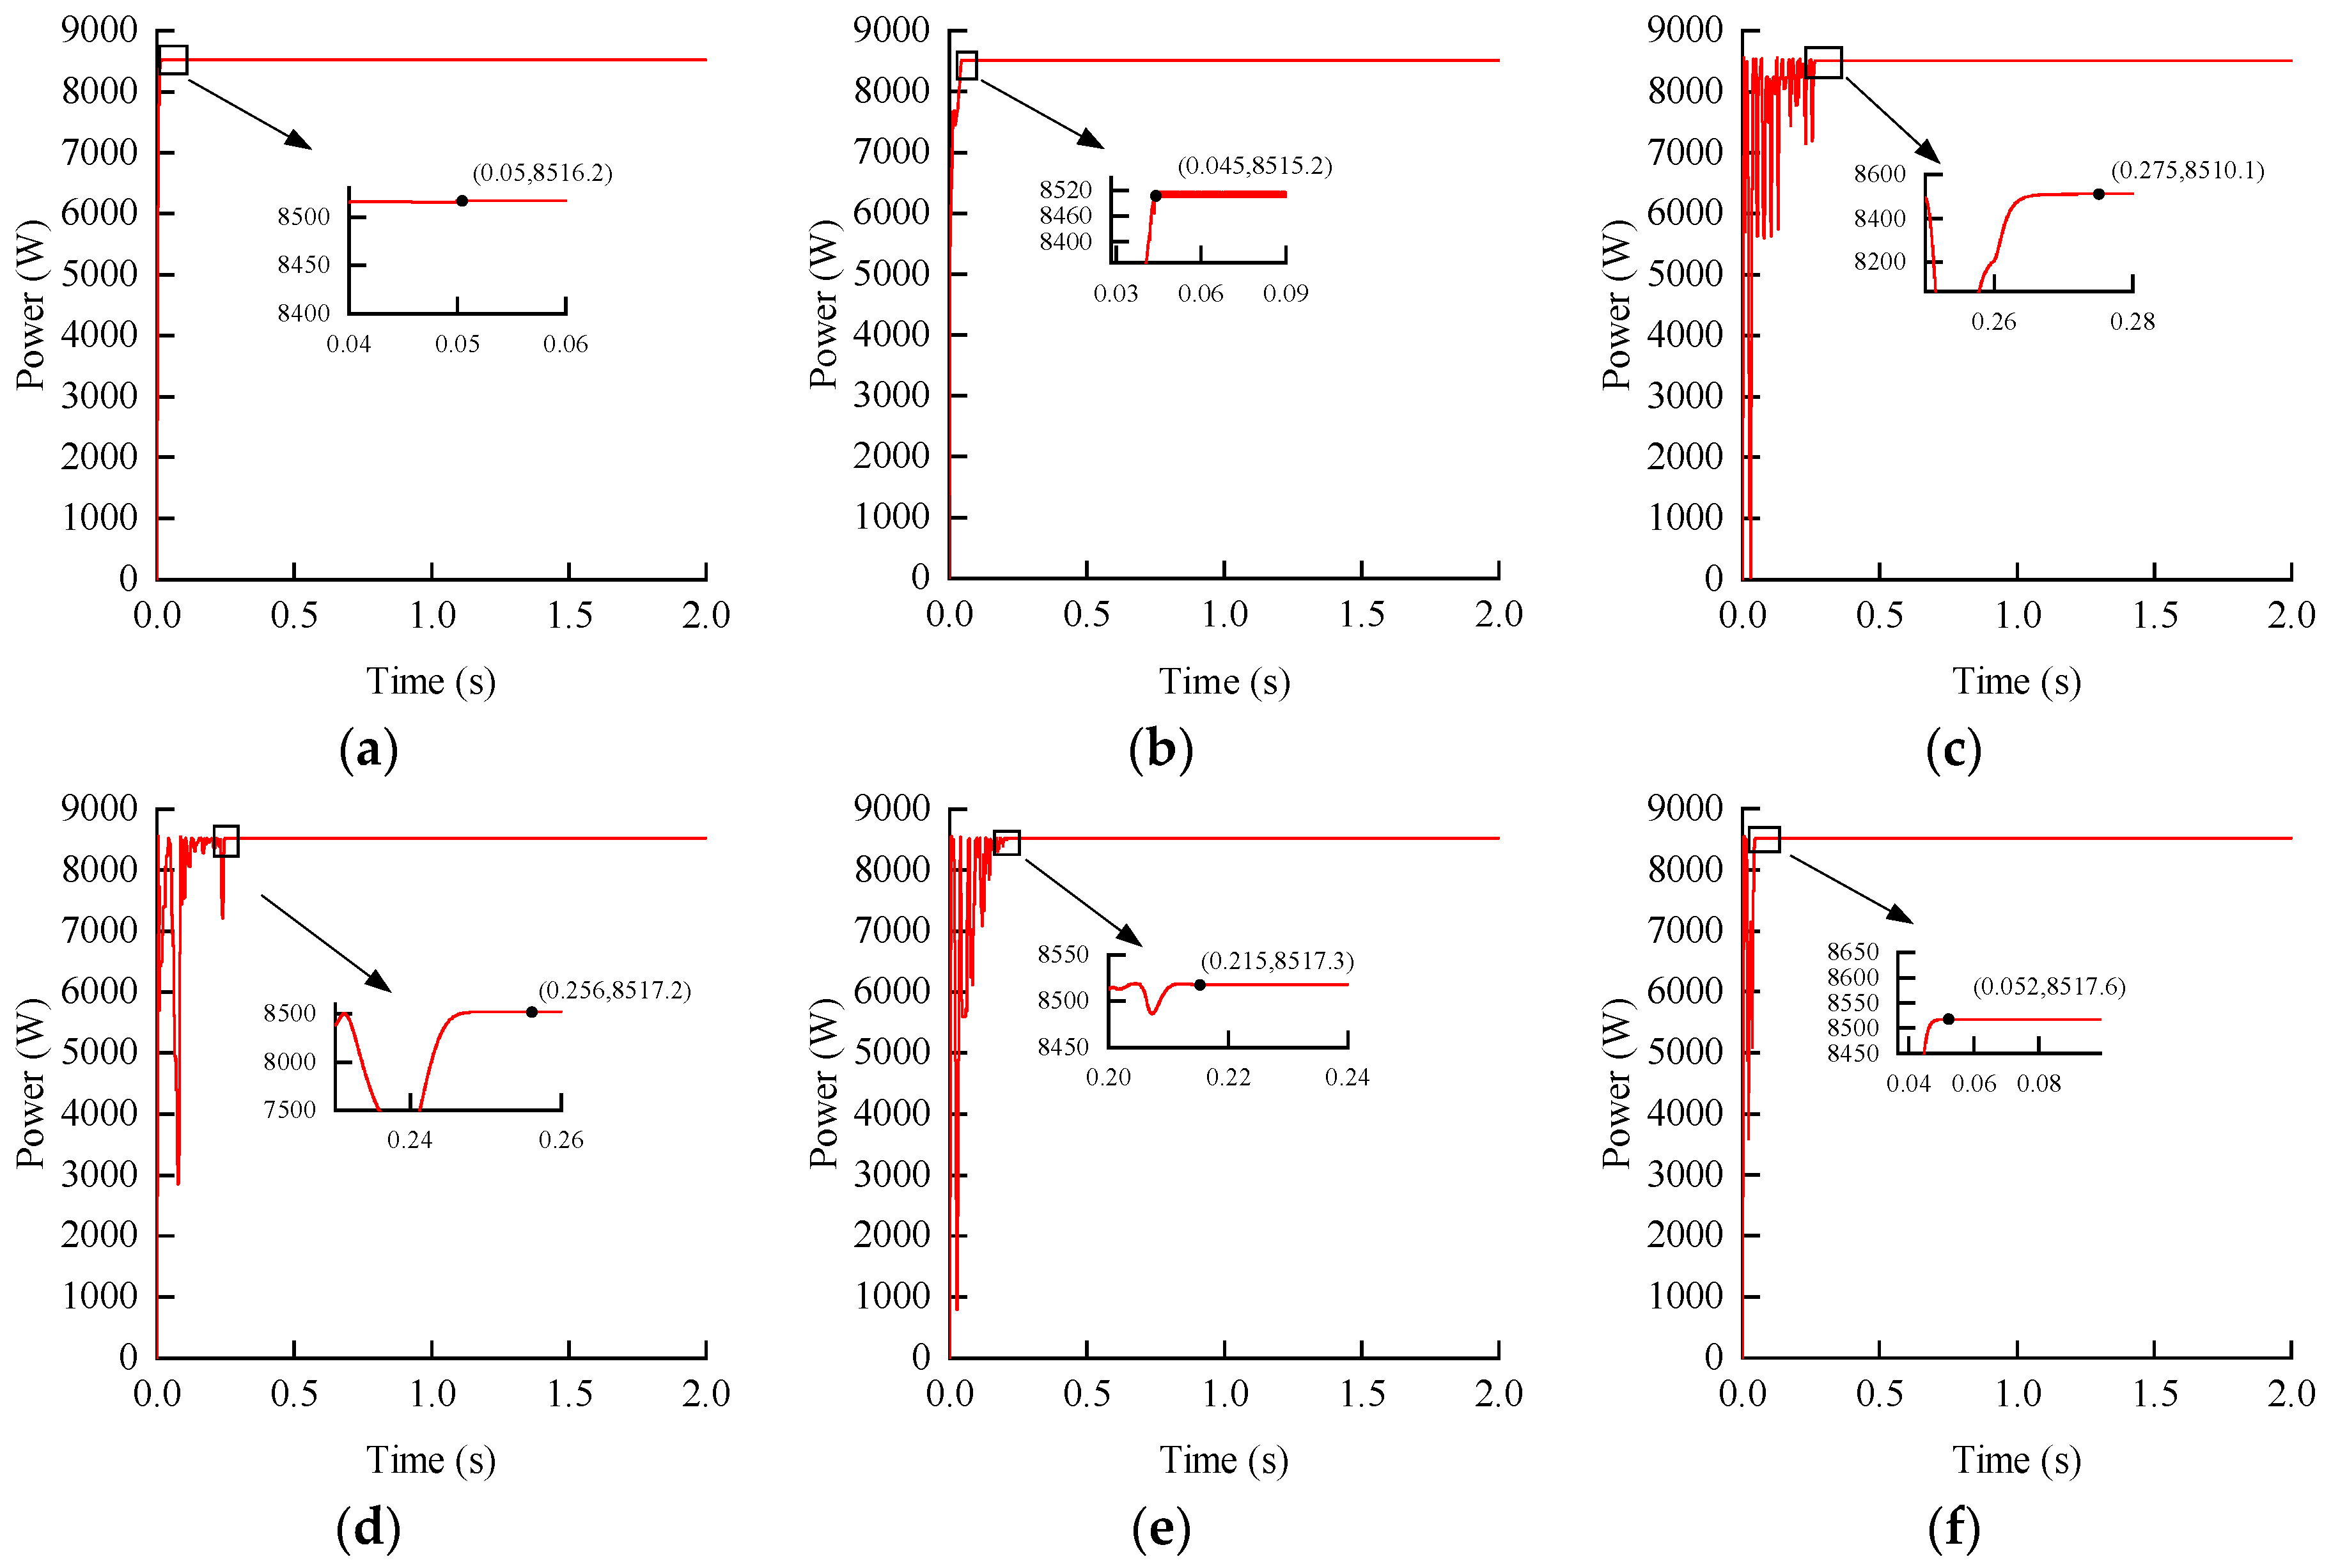
The operating temperature of the five photovoltaic cells is set at 25 °C, and the light intensity is 1000 W/m². The PV system has a peak power output of 8518 W. Figure 8 displays the MPPT simulation results for six different methods.
According to the analysis of Figure 8, all six algorithms can track MPP in an environment without shadows. Under the uniform illumination environment, ITSO-AP&O takes 0.052 s to complete power tracking, the maximum output power is 8517.6 W, and the tracking accuracy is 99.995%. The three intelligent algorithms, PSO, GWO, and TSO, take 0.275 s, 0.256 s, and 0.215 s, respectively, to complete power tracking, and their tracking time is relatively high due to the need for multiple iterations. The maximum power values tracked by these three methods are 8510.1 W, 8517.2 W, and 8517.3 W, respectively. The tracking accuracy is 99.907%, 99.991%, and 99.992%, respectively. Analysis results show that ITSO-AP&O has better tracking speed and accuracy than PSO, GWO, and TSO. FLC only takes 0.045 s to track the maximum power of 8515.2 W, which is the least time consuming among the six methods, but there is a small range of power fluctuations near the MPP, and its tracking accuracy is 99.967%. It takes 0.05 s for AP&O to track the maximum power of 8516.2 W, and its tracking accuracy reaches 99.979%. To summarize, the proposed ITSO-AP&O algorithm has the highest tracking accuracy, and the tracking time is slightly higher than that of FLC.

4.2. MPPT Tracking in the Case of Static Partial Shading

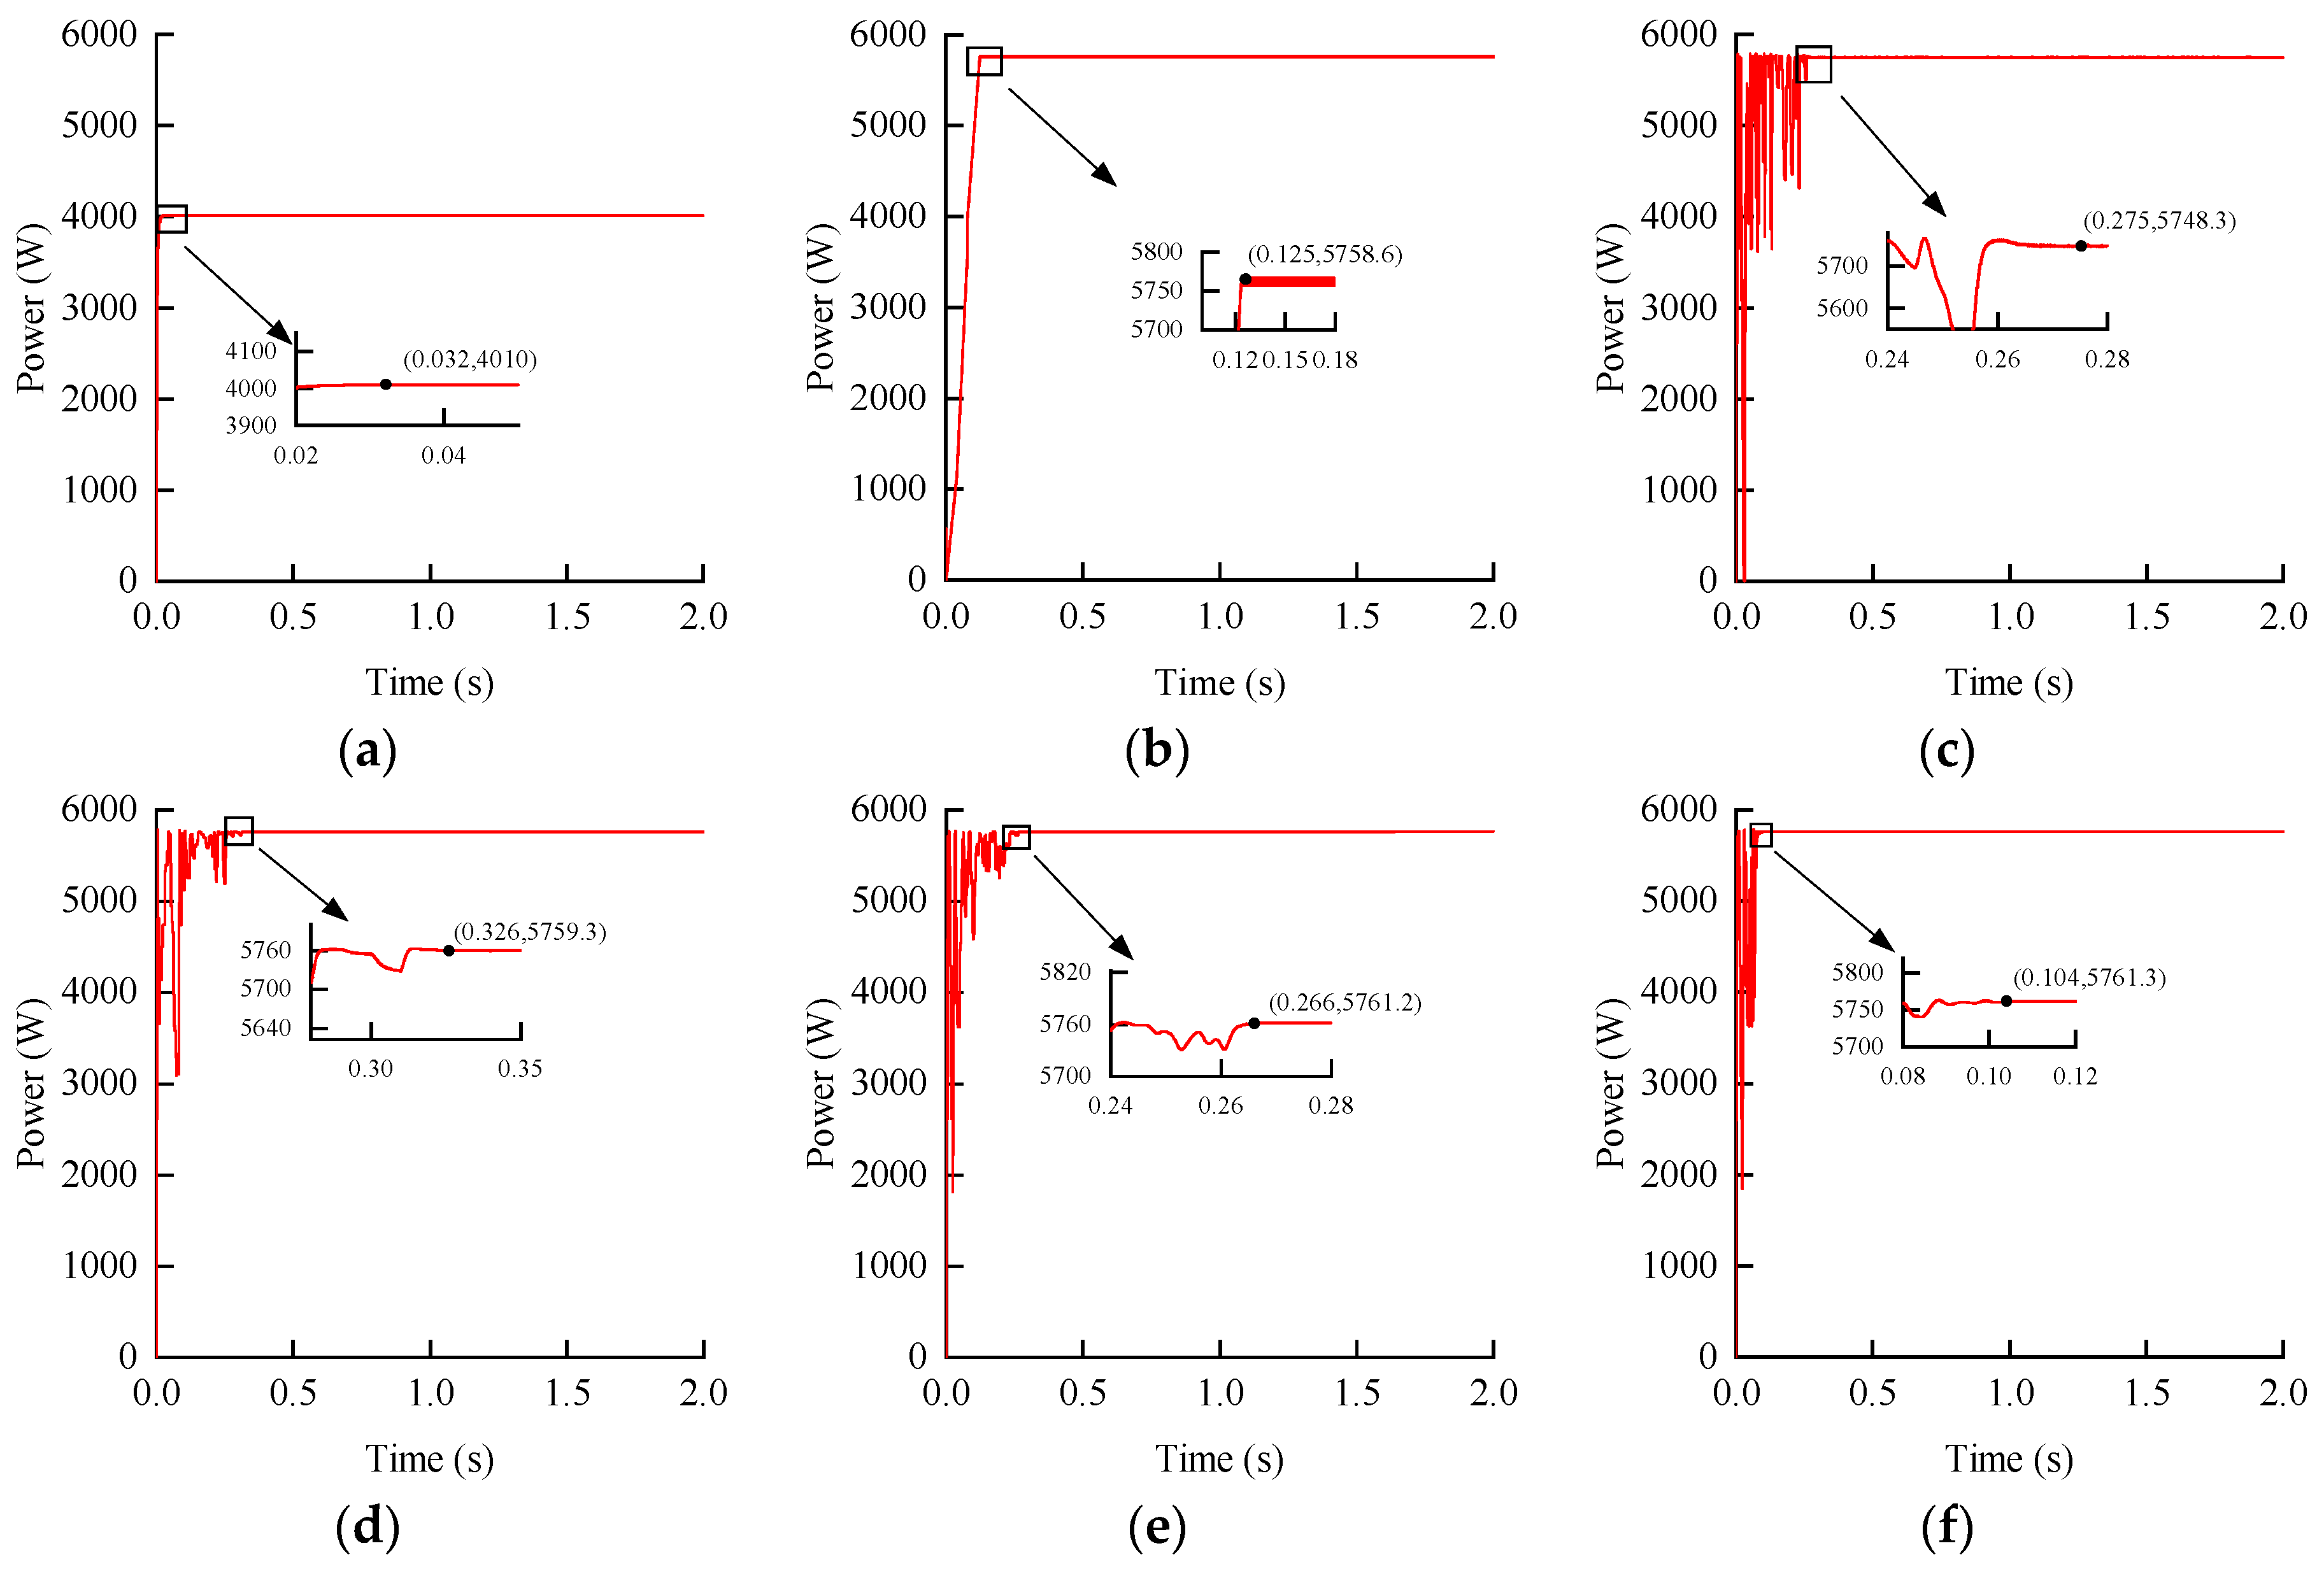
The P-U characteristic curve has multiple peaks when the PV array is under static PSC. Each PV cell has a light intensity of 1000 W/m², 1000 W/m², 400 W/m², 800 W/m², and 800 W/m². Figure 9 displays the MPPT simulation results of the six algorithms at an operating temperature of 25 °C and a maximum power output of 5762 W.
Figure 9 analysis indicates that PSO, GWO, and TSO algorithms require numerous iterations to find the best global solution, hence the slow convergence speed and significant output power oscillation. The three algorithms take 0.275 s, 0.326 s, and 0.266 s to complete power tracking, respectively. Their maximum powers are 5748.3 W, 5759.3 W, and 5761.2 W, respectively, and the errors with the actual MPP are 0.268%, 0.047%, and 0.014%, respectively. The AP&O algorithm does not find the MPP and falls into the local optimum point (4010 W) at the beginning of the operation (0.032 s), and its tracking accuracy is only 69.594%. FLC tracks the global MPP after 0.125 s, with an output power of 5758.6 W and tracking precision of 99.941%. The proposed method first finds the MPP by using the ITSO algorithm and then quickly switches to AP&O for tracking, which not only avoids falling into the local optimum but also reduces the number of iterations, effectively shorting the optimization time and reducing the power oscillation. Compared with AP&O, FLC, PSO, GWO, and TSO algorithms, ITSO-AP&O has the best tracking time and accuracy. It takes 0.104 s to complete power tracking, the output power is 5761.3 W, and the tracking accuracy is 99.988%. Based on simulation results, the proposed ITSO-AP&O performs best in the static shade environment, proving its effectiveness.

4.3. MPPT Tracking in the Case of Dynamic Partial Shading

This paper simulates the MPPT tracking of six algorithms under dynamic partial shading due to the constantly changing light intensity in practical environments.
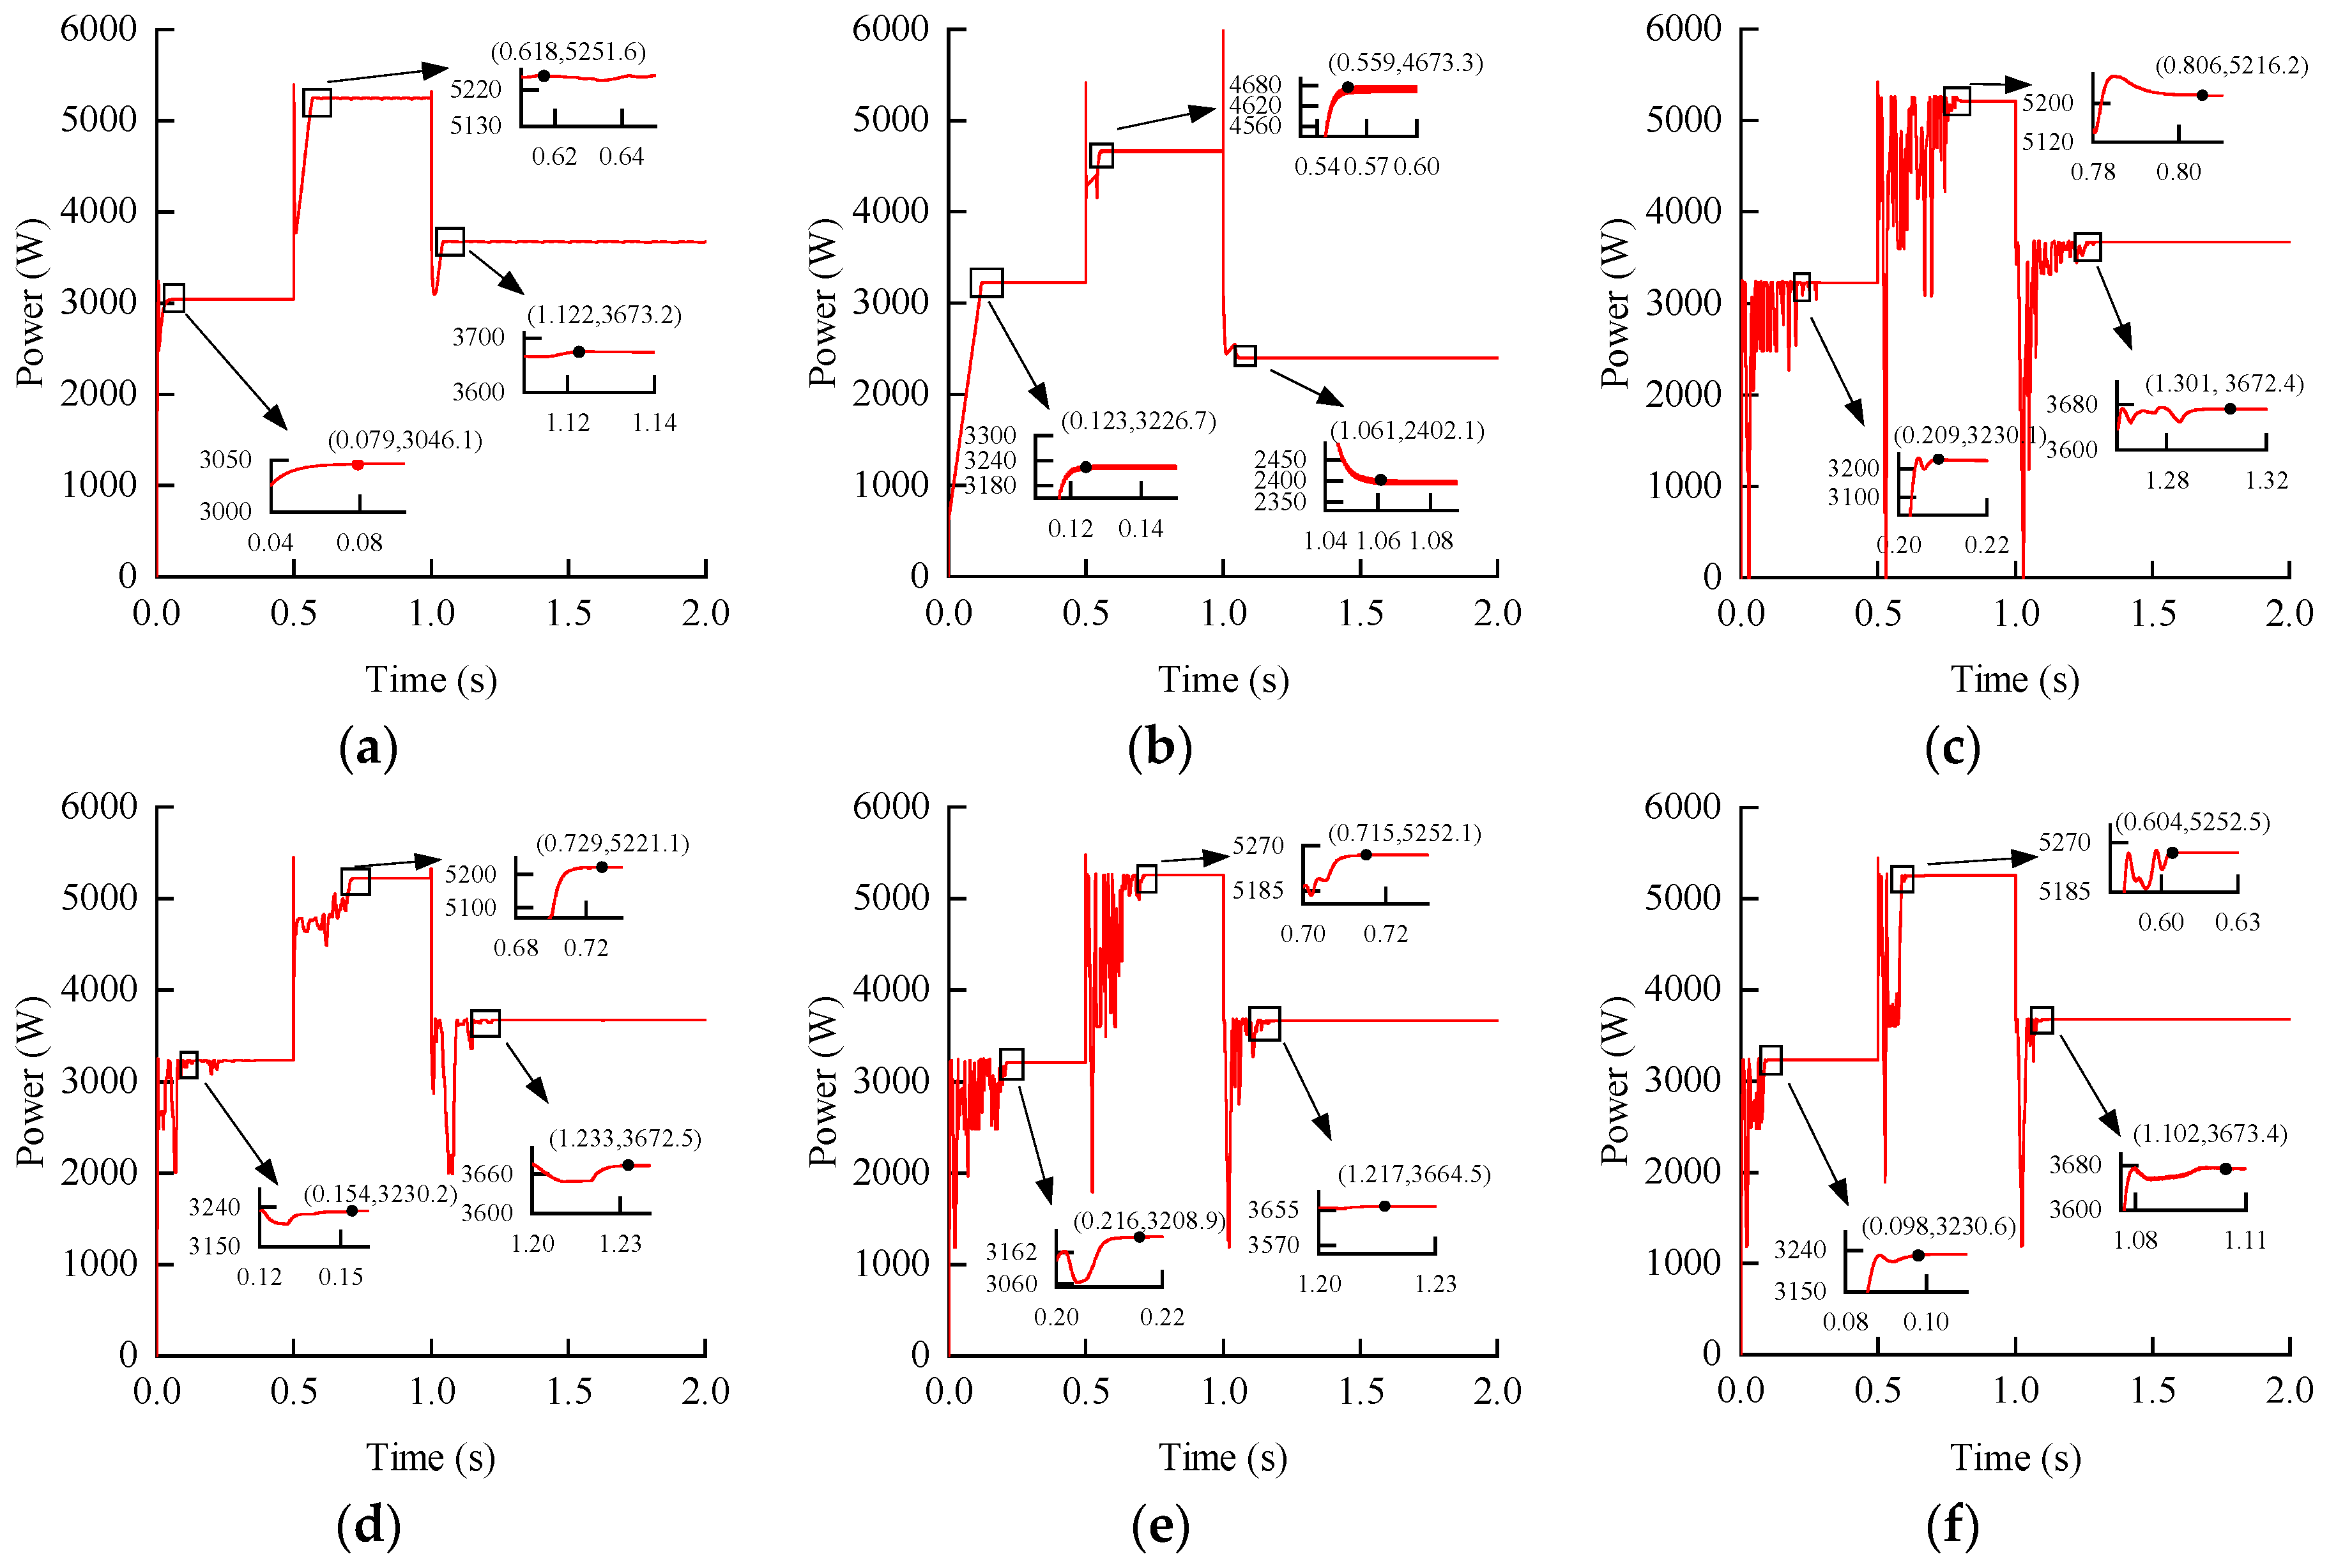
In environment 1, at t = 0 s, the light intensity of each PV cell is 1000 W/m², 300 W/m², 400 W/m², 600 W/m², and 600 W/m², and the maximum power is 3231 W. In environment 2, at t = 0.5 s, the light intensity changes to 800 W/m², 700 W/m², 300 W/m², 1000 W/m², and 1000 W/m², and the maximum power is 5254 W. In environment 3, at t = 1 s, the light intensity changes to 300 W/m², 600 W/m², 1000 W/m², 500 W/m², and 500 W/m², and the maximum power is 3675 W. The MPPT simulation results and performance comparisons under dynamic PSC are shown in Figure 10 and Table 3.
The results in Table 3 show that AP&O fails to find the MPP only in environment 1, while FLC fails to complete power tracking in environments 2 and 3. Both methods fail to maintain stability and have large power oscillations. However, PSO, GWO, TSO, and ITSO-AP&O all find the MPP in the three environments, which indicates that the swarm optimization algorithm is well suited to dealing with multi-extremum problems. In the following, the six MPPT control methods will be analyzed in detail according to Figure 10 and Table 3.
In environment 1, the AP&O falls into a local optimum (30,466.1 W) at 0.079 s, and the FLC takes 0.123 s to complete maximum power tracking. The power output is 3226.7 W, with a tracking precision of 99.867%. PSO, GWO, and TSO take 0.209 s, 0.154 s, and 0.216 s to track the MPP, and the final output values are 3230.1 W, 3230.2 W, and 3208.9 W, respectively. The tracking accuracy is 99.972%, 99.975%, and 99.316%, respectively. ITSO-AP&O takes 0.107 s to find the MPP, and its output power and tracking accuracy are 3230.6 W and 99.988%, respectively.
When the light intensity changes within 0.5 s, FLC fails to locate the MPP, with an output maximum value of 4673.3 W. AP&O, PSO, GWO, and TSO successfully complete power tracking in 0.118 s, 0.306 s, 0.229 s, and 0.215 s, respectively, with output powers of 5251.6 W, 5216.2 W, 5221.1 W, and 5252.1 W and tracking accuracies of 99.954%, 99.281%, 99.374%, and 99.964%, respectively. ITSO-AP&O completes power tracking again after 0.098 s, and the output power value and tracking accuracy are 5252.5 W and 99.971%, respectively.
Similarly, when in environment 3, FLC still does not find the MPP and outputs a maximum value of 2402.1 W. AP&O, PSO, GWO, and TSO find the MPP after 0.122 s, 0.301 s, 0.233 s, and 0.217 s, respectively, and the final power output values are 3673.2 W, 3672.4 W, 3672.5 W, and 3664.5 W, respectively. The tracking accuracy is 99.951%, 99.929%, 99.932%, and 99.714%, respectively. Because AP&O tracking is adopted in the later stage of the algorithm in this paper, the disturbance oscillation and optimization time at the MPP are reduced by automatically adjusting the disturbance step size. It only takes 0.102 s to complete power tracking, and its tracking accuracy and output power value are 99.956% and 3673.4 W, respectively.

5. Experimental Verification

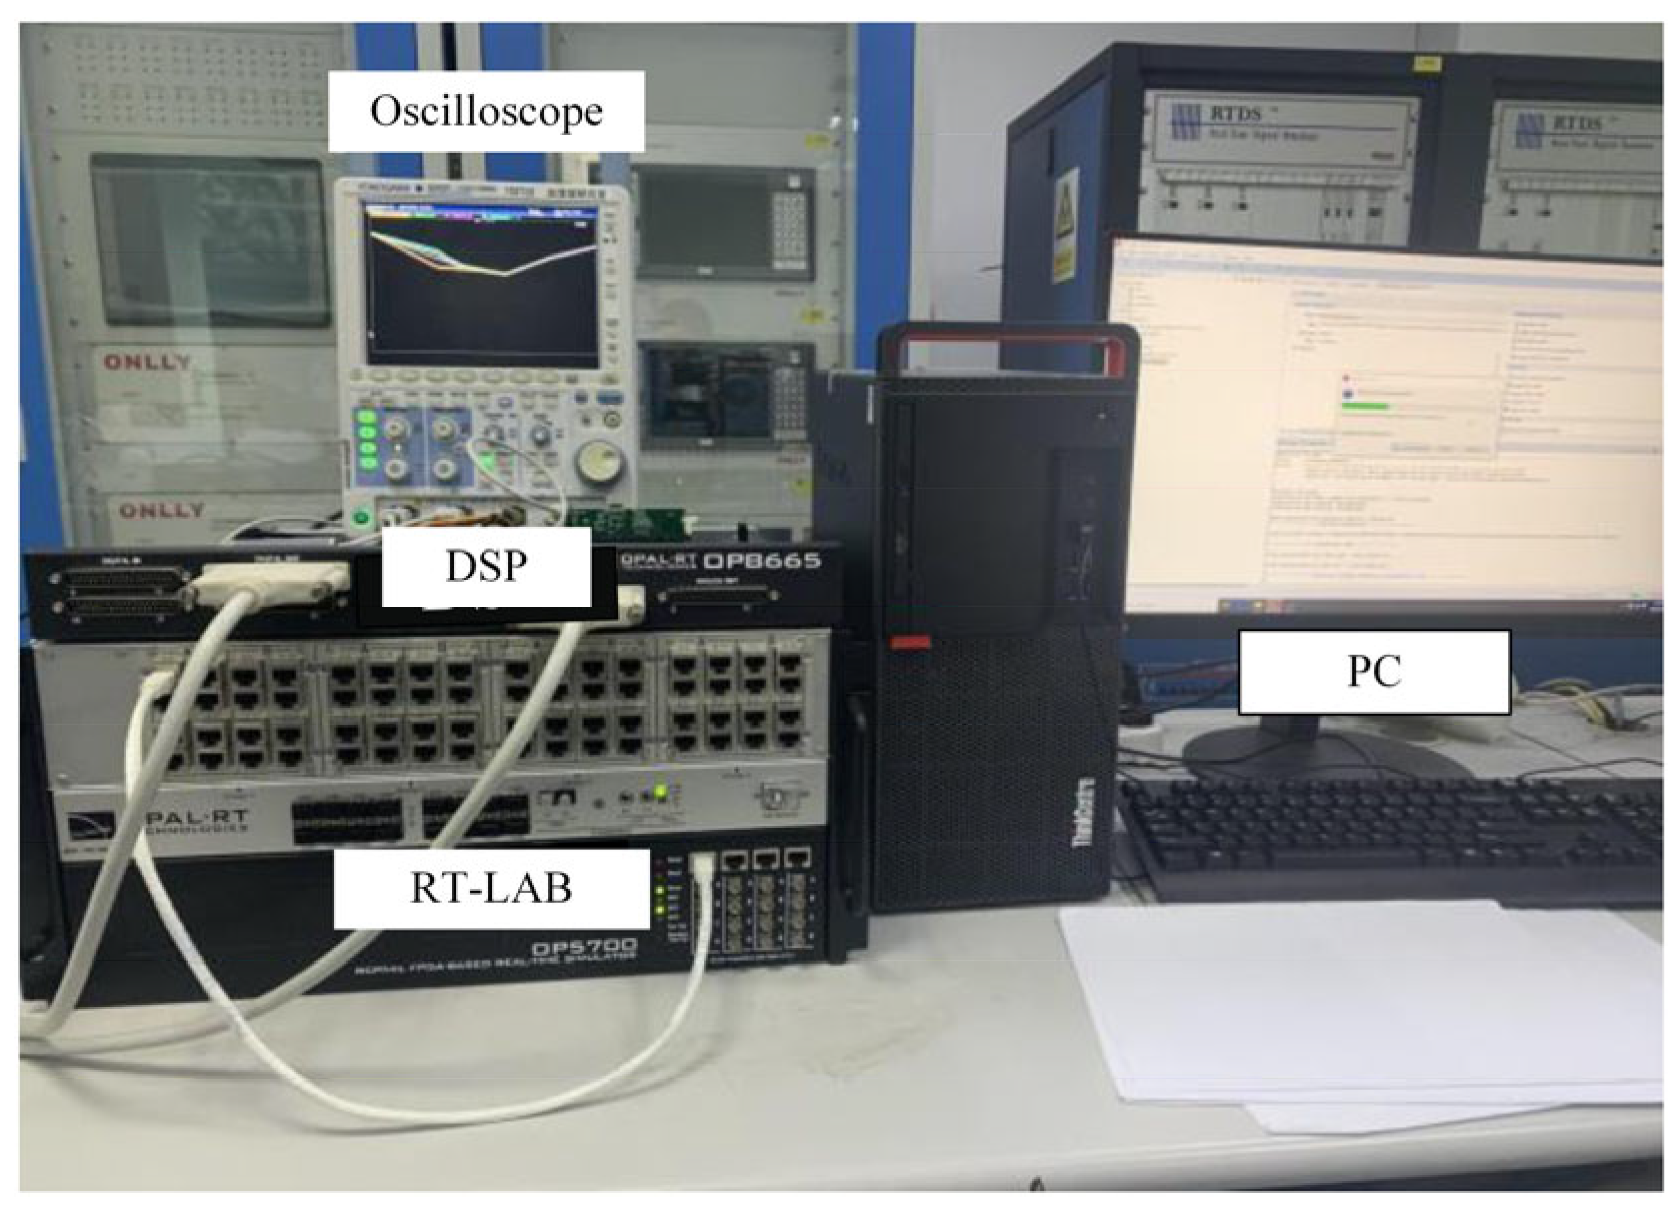
To confirm the efficacy of the suggested approach, a PV system model is constructed using the RT-LAB platform, and experimental trials are conducted. The experimental setup is displayed in Figure 11. Among them, the upper computer is used to download the simulation model to RT-LAB, and then the RT-LAB platform is used to run the PV system model. The DSP controller implements the ITSO-AP&O algorithm presented in this study, while the oscilloscope is utilized to measure the PV system’s output power in various conditions.
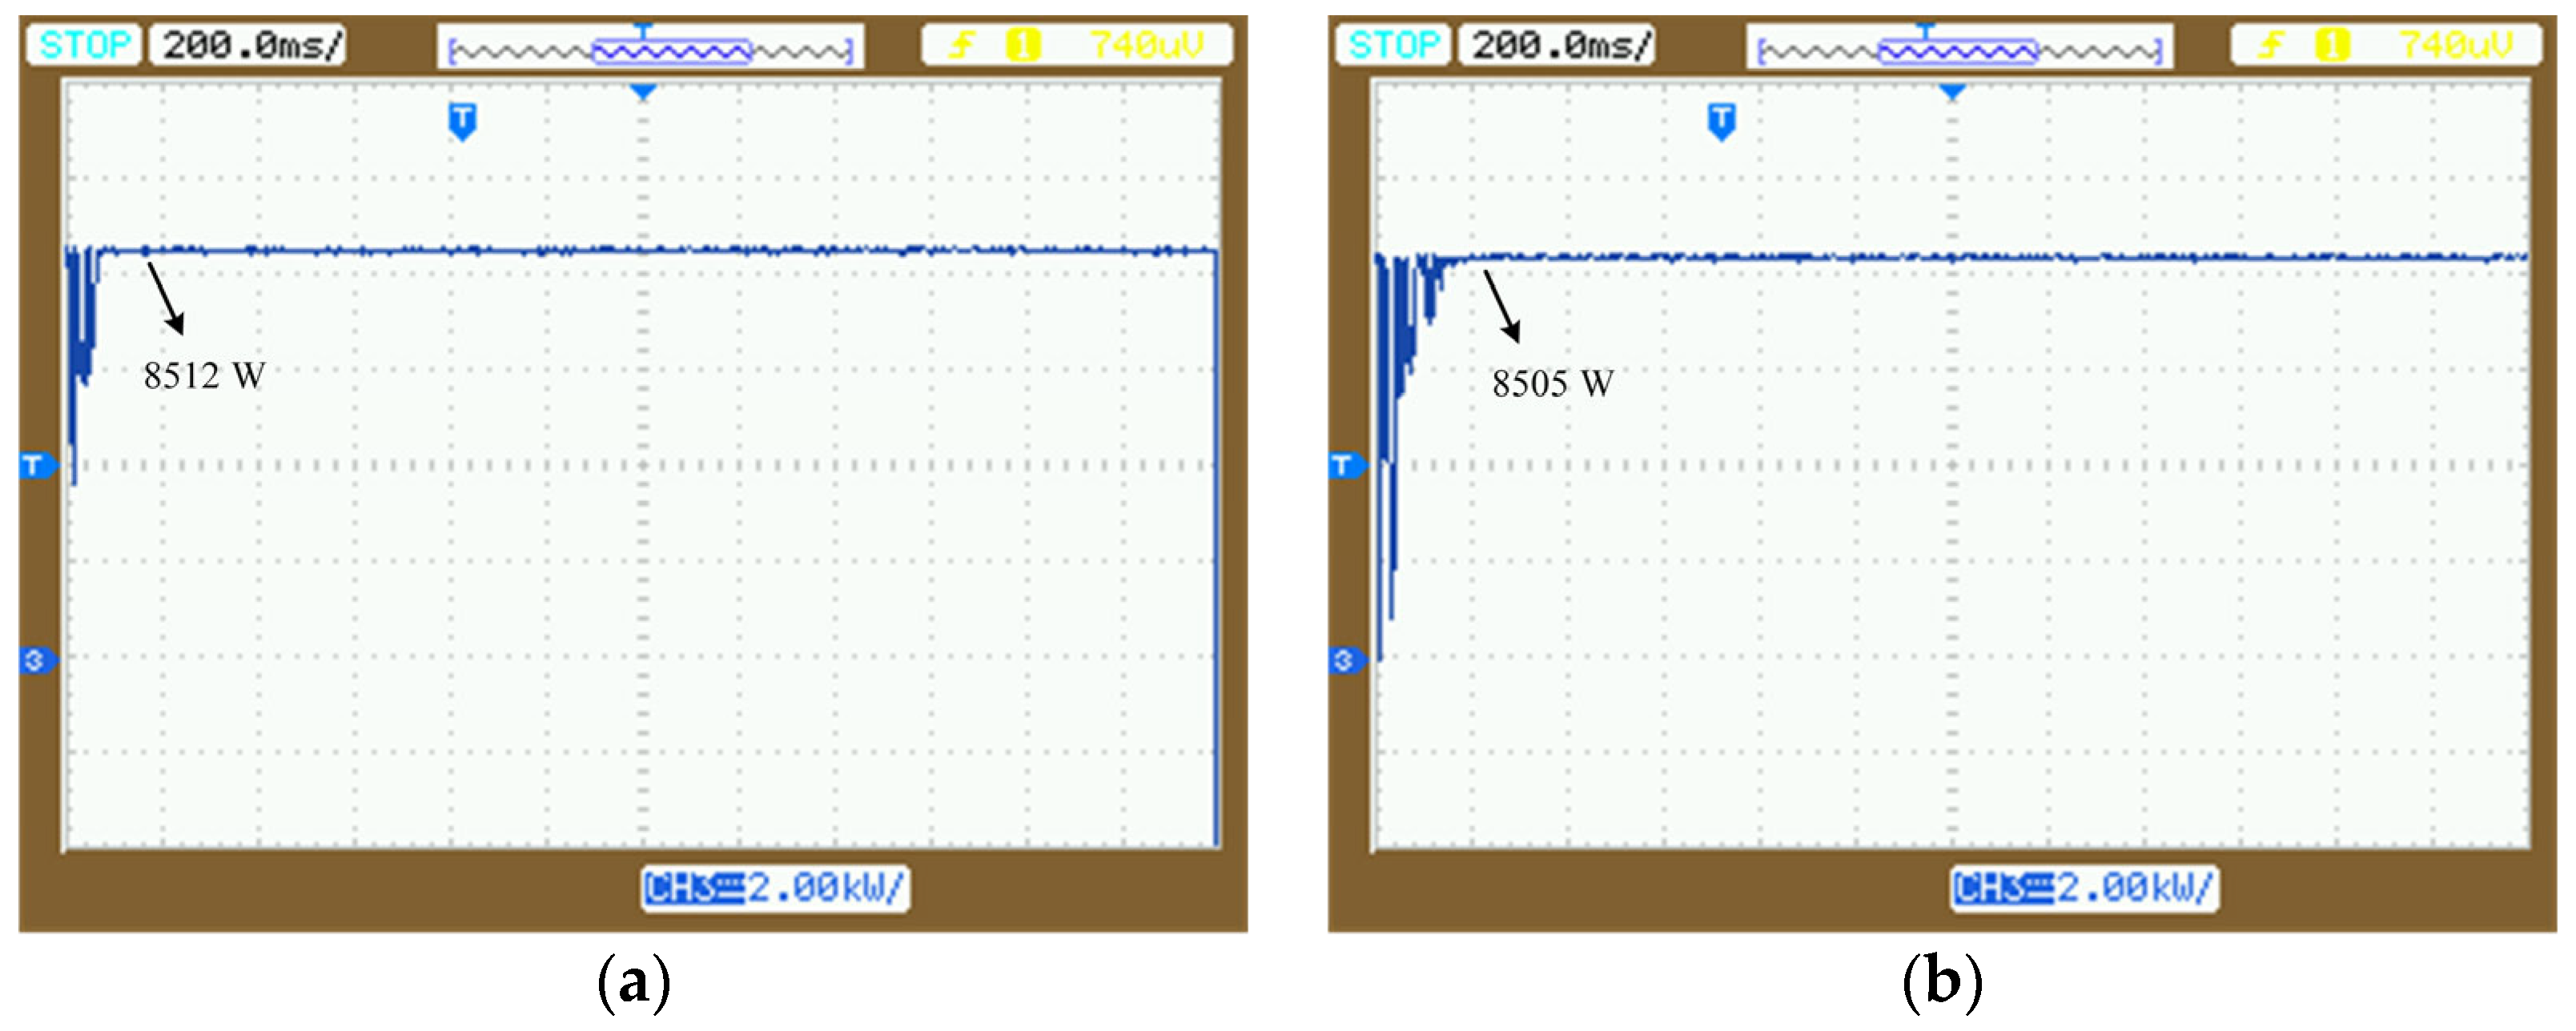
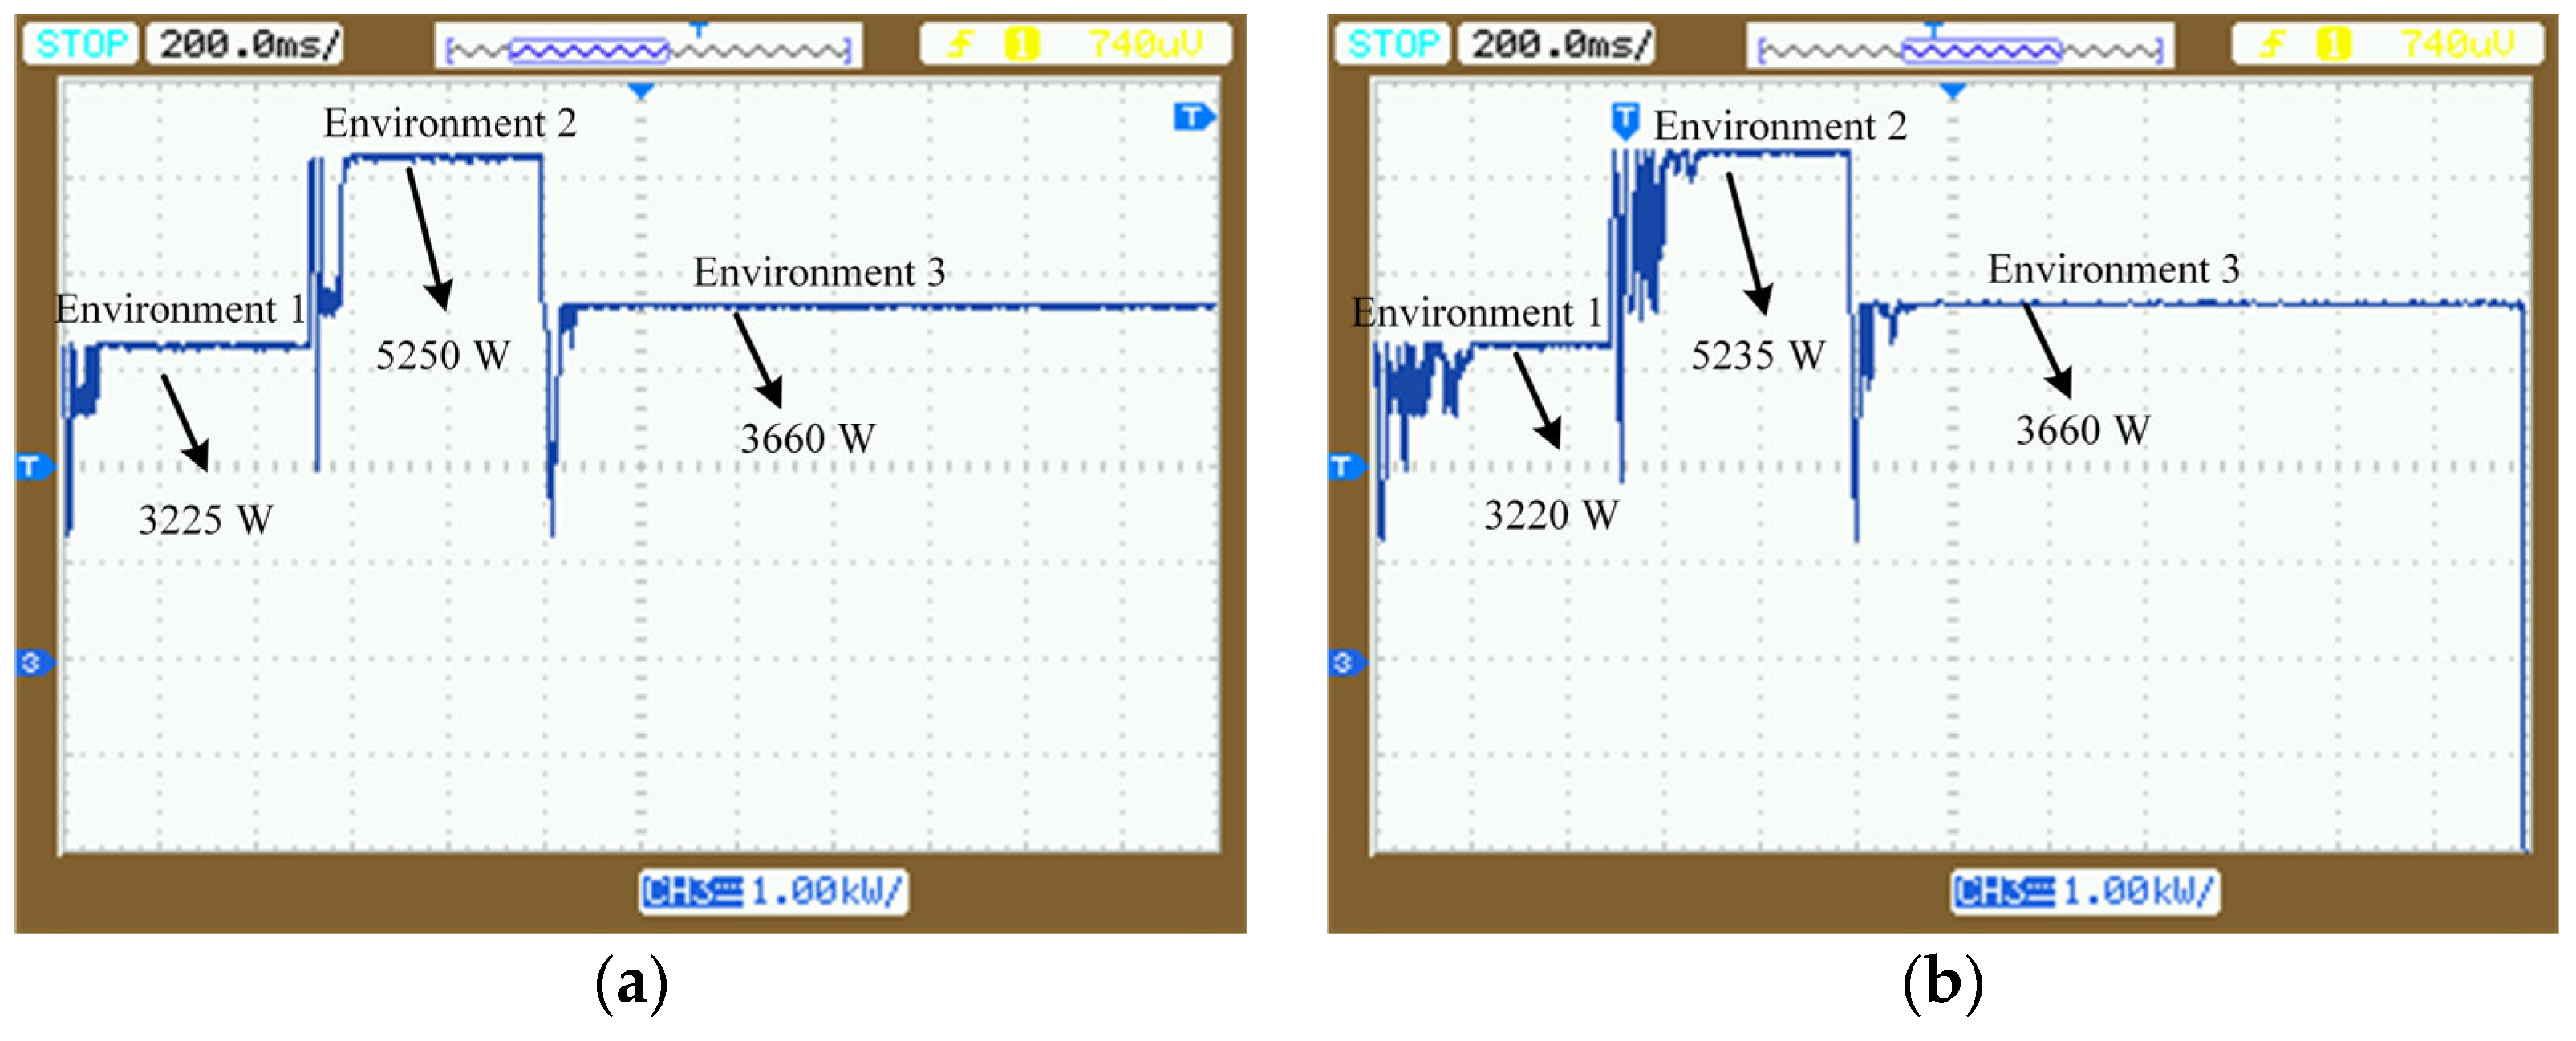
The basic parameters of the PV array in RT-LAB are completely consistent with those in the Matlab simulation system. Experiments are conducted to test the practicability of the ITSO-AP&O algorithm for the maximum power tracking control of a PV system under two conditions, no shadow and dynamic shade, and it is compared with the standard TSO. The output power waveforms obtained are shown in Figure 12 and Figure 13. The number 3 in the figure represents the zero position of the vertical axis.
The experimental waveform shows that the ITSO-AP&O and TSO algorithms can achieve maximum power tracking in the case of no shadow and dynamic shading. Furthermore, ITSO-AP&O has a much shorter tracking time compared to TSO, with less oscillation observed during the search. The analysis in Figure 12 reveals that ITSO-AP&O and TSO have maximum output powers of 8512 W and 8505 W, respectively, under ideal lighting conditions. Figure 13 analysis reveals that ITSO-AP&O tracks maximum powers of 3225 W, 5250 W, and 3660 W in three different settings, while TSO tracks 3220 W, 5235 W, and 3660 W in the same environments. In conclusion, all of the waveforms obtained in the experiments are consistent with the results predicted in theory by the proposed ITSO-AP&O method, proving its effectiveness.

6. Conclusions

Partial shading will result in multiple peak points on the PV array’s P-U curve. The conventional MPPT technique easily reaches a suboptimal solution, resulting in decreased power output from the photovoltaic system. This paper suggests a joint ITSO and AP&O photovoltaic MPPT control algorithm to solve the issue. Simulation and verification of the proposed control strategy are performed on Matlab/Simulink, and it is compared with the techniques of AP&O, FLC, PSO, GWO, and TSO. Ultimately, the experimental study is conducted using the RT-LAB real-time simulation platform. The results show that the ITSO-AP&O algorithm shows good tracking performance in three environments, and its tracking accuracy is above 99.9%. In the static shade environment, the tracking rate of ITSO-AP&O is 16.8%, 62.2%, 68.1%, and 60.9% higher than that of FLC, PSO, GWO, and TSO, respectively. In the dynamic shade environment, the tracking accuracy and speed of ITSO-AP&O are better than those of the other five methods. Taking environment 3 as an example, the tracking speed of ITSO-AP&O is 16.4%, 66.1%, 56.2%, and 52.9% higher than that of AP&O, PSO, GWO, and TSO, respectively. According to the above results, it can be concluded that the proposed ITSO-AP&O algorithm can track the MPP quickly and accurately, and the power fluctuation is more minor in the tracking process, whether in the ideal case of no shading or the case of static and dynamic partial shading.
The PV power generation system represents a significant component of the emerging energy infrastructure. To minimize the impact of power output loss, developing an MPPT algorithm that can function effectively in diverse environmental conditions is crucial. Simulation and experimental results demonstrate that this research has yielded promising outcomes. However, due to the limitation of research time and experimental conditions, there are still the following problems that need to be further discussed in future research work: first, the MPPT control method under a condition in which the system is integrated into the power grid is not considered; second, the model built in this paper is based on a DC-DC boost circuit, and its use in combination with a nonisolated DC-DC circuit was not attempted.

Author Contributions

Conceptualization, X.L.; methodology, X.L.; software, X.L. and Y.H.; validation, X.L., Y.H. and M.L.; formal analysis, Y.H.; investigation, M.L.; resources, X.L.; data curation, Y.H.; writing—original draft preparation, X.L. and Y.H.; writing—review and editing, X.L. and Y.H.; visualization, M.L.; supervision, Y.H.; project administration, M.L.; funding acquisition, Y.H. All authors have read and agreed to the published version of the manuscript.

Funding

This research was funded by the Natural Science Foundation of Hunan Province (grant no. 2022JJ40509) and the Hunan Provincial Department of Education Project (grant no. 21C0175).

Data Availability Statement

The data presented in this study are available on request from the corresponding author. The data is not publicly available due to privacy restrictions.

Conflicts of Interest

The authors declare no conflicts of interest.

References

  1. Wang, X.; Chen, G.; Afshan, S.; Awosusi, A.A.; Abbas, S. Transition towards sustainable energy: The role of economic complexity, financial liberalization and natural resources management in China. Resour. Policy 2023, 83, 103631. [Google Scholar] [CrossRef]
  2. Allouhi, A.; Rehman, S.; Buker, M.S.; Said, Z. Up-to-date literature review on Solar PV systems: Technology progress, market status and R&D. J. Clean. Prod. 2022, 362, 132339. [Google Scholar]
  3. Mao, M.; Cui, L.; Zhang, Q.; Guo, K.; Zhou, L.; Huang, H. Classification and summarization of solar photovoltaic MPPT techniques: A review based on traditional and intelligent control strategies. Energy Rep. 2020, 6, 1312–1327. [Google Scholar] [CrossRef]
  4. Devarakonda, A.K.; Karuppiah, N.; Selvaraj, T.; Balachandran, P.K.; Shanmugasundaram, R.; Senjyu, T. A comparative analysis of maximum power point techniques for solar photovoltaic systems. Energies 2022, 15, 8776. [Google Scholar] [CrossRef]
  5. Chellakhi, A.; El Beid, S.; Abouelmahjoub, Y.; Mchaouar, Y. Optimization of power extracting from photovoltaic systems based on a novel adaptable step INC MPPT approach. IFAC-Pap. 2022, 55, 508–513. [Google Scholar] [CrossRef]
  6. Baba, A.O.; Liu, G.; Chen, X. Classification and evaluation review of maximum power point tracking methods. Sustain. Futures 2020, 2, 100020. [Google Scholar] [CrossRef]
  7. Bhukya, L.; Kedika, N.R.; Salkuti, S.R. Enhanced maximum power point techniques for solar photovoltaic system under uniform insolation and partial shading conditions: A review. Algorithms 2022, 15, 365. [Google Scholar] [CrossRef]
  8. Wasim, M.S.; Amjad, M.; Abbasi, M.A.; Bhatti, A.R.; Rasool, A. An improved grasshopper-based MPPT approach to reduce tracking time and startup oscillations in photovoltaic system under partial shading conditions. PLoS ONE 2023, 18, e0290669. [Google Scholar] [CrossRef]
  9. Yang, B.; Zhu, T.; Wang, J.; Shu, H.; Yu, T.; Zhang, X.; Yao, W.; Sun, L. Comprehensive overview of maximum power point tracking algorithms of PV systems under partial shading condition. J. Clean. Prod. 2020, 268, 121983. [Google Scholar] [CrossRef]
  10. Wirateruna, E.S.; Millenia, A.F.A. Design of MPPT PV using particle swarm optimization algorithm under partial shading condition. Int. J. Artif. Intell. Robot. 2022, 4, 24–30. [Google Scholar] [CrossRef]
  11. Motahhir, S.; Chtita, S.; Chouder, A.; El Hammoumi, A. Enhanced energy output from a PV system under partial shaded conditions through Grey wolf optimizer. Clean. Eng. Technol. 2022, 9, 100533. [Google Scholar] [CrossRef]
  12. Chauhan, U.; Singh, V.; Kumar, B.; Rani, A. An improved MVO assisted global MPPT algorithm for partially shaded PV system. J. Intell. Fuzzy Syst. 2020, 38, 6715–6726. [Google Scholar] [CrossRef]
  13. Karunanidhi, B.; Ramasamy, L.; Samuel, C.R.; Vasanth, M. Development of novel Cuckoo search optimization-based controller for partially shaded Photovoltaic system. J. Intell. Fuzzy Syst. 2023, 45, 4447–4468. [Google Scholar] [CrossRef]
  14. Fu, C.; Zhang, L. A differential evolution optimization-based black widow spider method in PV systems under shading conditions. Appl. Soft Comput. 2023, 148, 110927. [Google Scholar] [CrossRef]
  15. Premkumar, M.; Kumar, C.; Anbarasan, A.; Sowmya, R. A new maximum power point tracking technique based on whale optimisation algorithm for solar photovoltaic systems. Int. J. Ambient Energy 2022, 43, 5627–5637. [Google Scholar] [CrossRef]
  16. Zafar, M.H.; Khan, N.M.; Mirza, A.F.; Mansoor, M.; Akhtar, N.; Qadir, M.U.; Khan, N.A.; Moosavi, S.K.R. A novel meta-heuristic optimization algorithm based MPPT control technique for PV systems under complex partial shading condition. Sustain. Energy Technol. Assess. 2021, 47, 101367. [Google Scholar]
  17. Ngo, S.; Chiu, C.S.; Ngo, T.D. A novel horse racing algorithm based MPPT control for standalone PV power systems. Energies 2022, 15, 7498. [Google Scholar] [CrossRef]
  18. Nagadurga, T.; Narasimham, P.; Vakula, V.S. Global maximum power point tracking of solar photovoltaic strings under partial shading conditions using cat swarm optimization technique. Sustainability 2021, 13, 11106. [Google Scholar] [CrossRef]
  19. Mo, S.; Ye, Q.; Jiang, K.; Mo, X.; Shen, G. An improved MPPT method for photovoltaic systems based on mayfly optimization algorithm. Energy Rep. 2022, 8, 141–150. [Google Scholar] [CrossRef]
  20. Charin, C.; Ishak, D.; Zainuri, M.A.A.M.; Ismail, B.; Alsuwian, T.; Alhawari, A.R.H. Modified levy-based particle swarm optimization (MLPSO) with boost converter for local and global point tracking. Energies 2022, 15, 7370. [Google Scholar] [CrossRef]
  21. Chaibi, R.; EL Bachtiri, R.; El Hammoumi, K.; Yagoubi, M. Photovoltaic system’s MPPT under partial shading using TS fuzzy robust control. IFAC-Pap. 2022, 55, 214–221. [Google Scholar]
  22. Chandra, S.; Gaur, P. Radial basis function neural network technique for efficient maximum power point tracking in solar photo-voltaic system. Procedia Comput. Sci. 2020, 167, 2354–2363. [Google Scholar] [CrossRef]
  23. Phan, B.C.; Lai, Y.C.; Lin, C.E. A deep reinforcement learning-based MPPT control for PV systems under partial shading condition. Sensors 2020, 20, 3039. [Google Scholar] [CrossRef]
  24. Rahman, M.M.; Islam, M.S. PSO and ANN based hybrid MPPT algorithm for photovoltaic array under partial shading condition. Eng. Int. 2020, 8, 9–24. [Google Scholar] [CrossRef]
  25. Senapati, M.K.; Pradhan, C.; Calay, R.K. A computational intelligence based maximum power point tracking for photovoltaic power generation system with small-signal analysis. Optim. Control Appl. Methods 2023, 44, 617–636. [Google Scholar] [CrossRef]
  26. Leopoldino AL, M.; Freitas, C.M.; Monteiro, L.F.C. Analysis of the hybrid PSO-InC MPPT for different partial shading conditions. Adv. Electr. Comput. Eng. 2022, 22, 29–36. [Google Scholar] [CrossRef]
  27. Xie, L.; Han, T.; Zhou, H.; Zhang, Z.-R.; Han, B.; Tang, A. Tuna swarm optimization: A novel swarm-based metaheuristic algorithm for global optimization. Comput. Intell. Neurosci. 2021, 2021, 9210050. [Google Scholar] [CrossRef]
  28. Mohammad, A.N.M.; Radzi, M.A.M.; Azis, N.; Shafie, S.; Zainuri, M.A.A.M. An enhanced adaptive perturb and observe technique for efficient maximum power point tracking under partial shading conditions. Appl. Sci. 2020, 10, 3912. [Google Scholar] [CrossRef]
  29. Iacca, G.; dos Santos Junior, V.C.; de Melo, V.V. An improved Jaya optimization algorithm with Lévy flight. Expert Syst. Appl. 2021, 165, 113902. [Google Scholar] [CrossRef]
  30. Wang, W.; Tian, J. An improved nonlinear tuna swarm optimization algorithm based on circle chaos map and levy flight operator. Electronics 2022, 11, 3678. [Google Scholar] [CrossRef]
  31. Tuerxun, W.; Xu, C.; Guo, H.; Guo, L.; Zeng, N.; Cheng, Z. An ultra-short-term wind speed prediction model using LSTM based on modified tuna swarm optimization and successive variational mode decomposition. Energy Sci. Eng. 2022, 10, 3001–3022. [Google Scholar] [CrossRef]
  32. Wang, C.; Wang, D.; Gu, M.; Huang, H.; Wang, Z.; Yuan, Y.; Zhu, X.; Wei, W.; Fan, Z. Bioinspired environment exploration algorithm in swarm based on levy flight and improved artificial potential field. Drones 2022, 6, 122. [Google Scholar] [CrossRef]
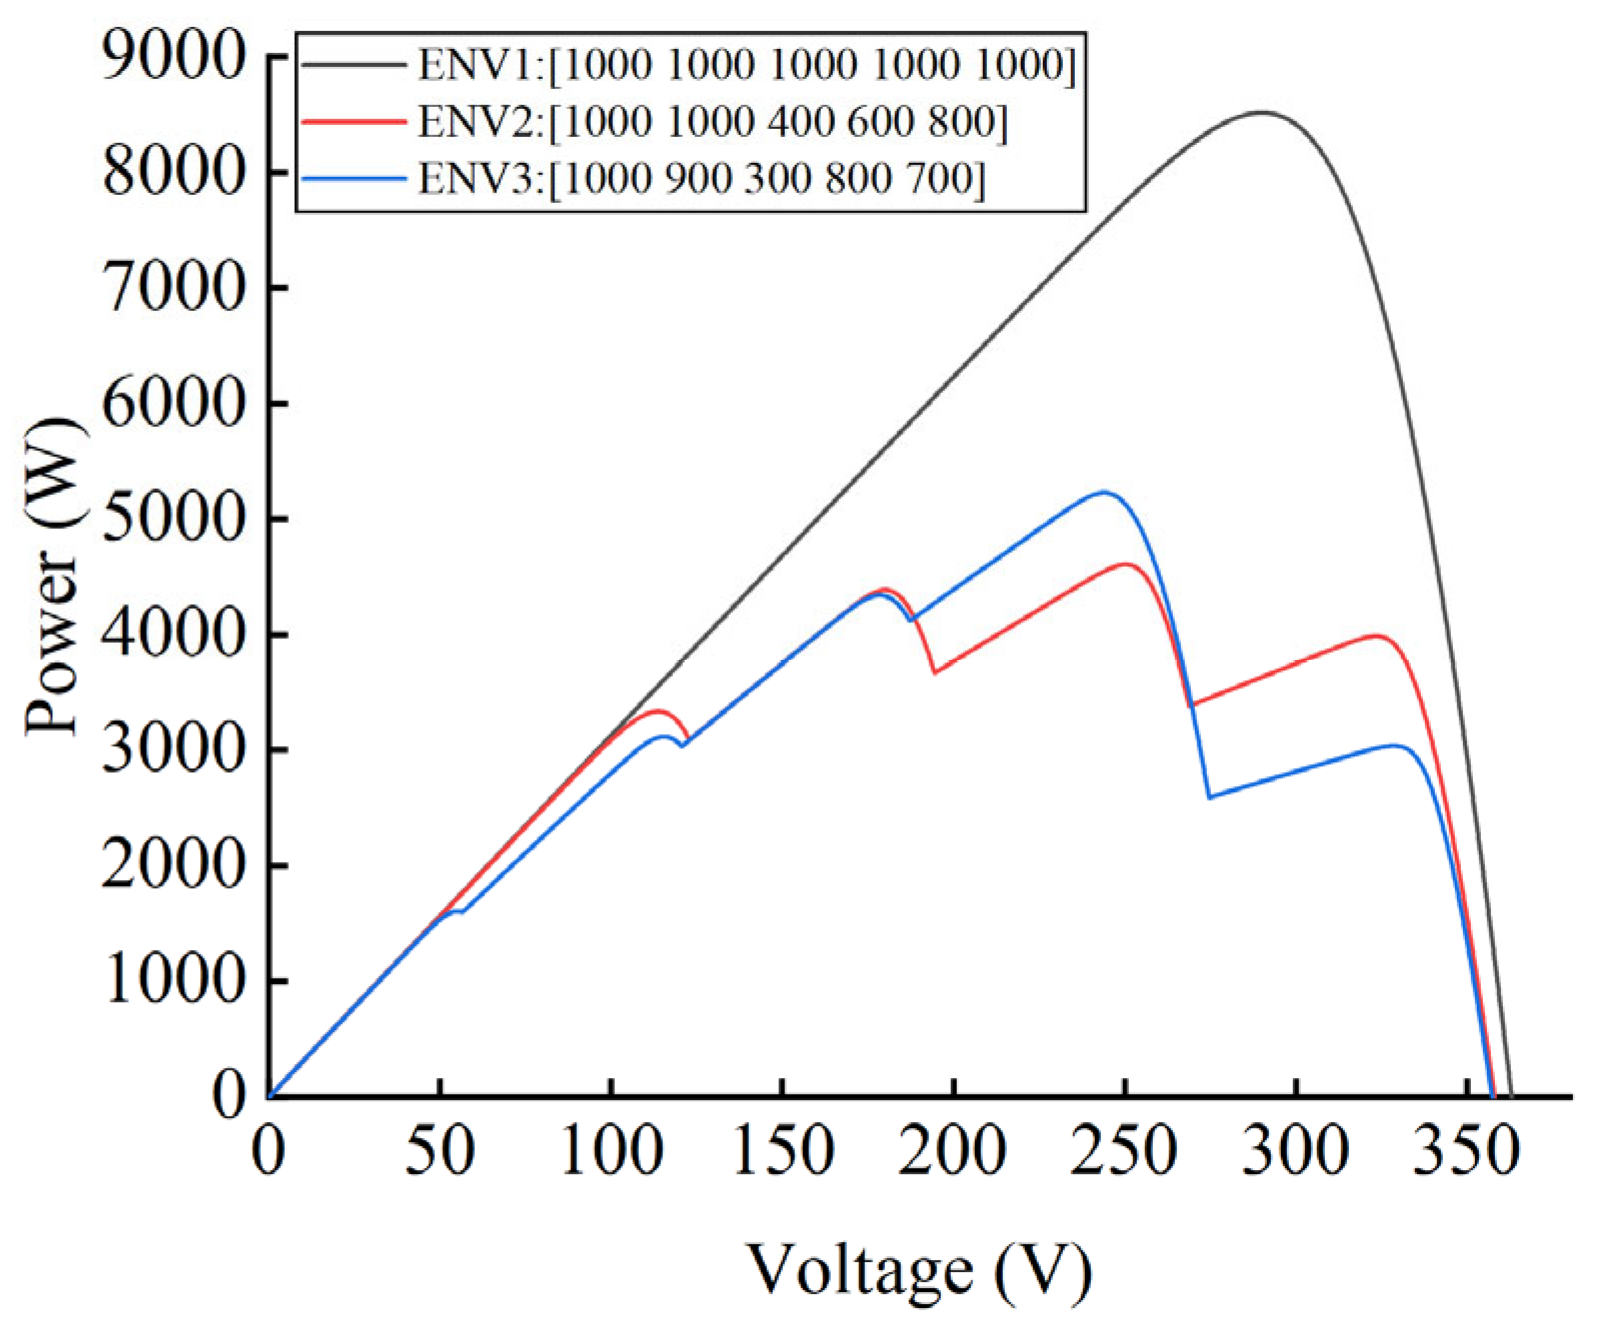
Figure 1. P-U characteristic curve.
Energies 17 02985 g001
Figure 2. Comparison of SPM map and random number initialization. (a) SPM map; (b) the random number.
Energies 17 02985 g002
Figure 3. Three-dimensional diagram of test function. (a). Sphere; (b). Schwefel 2.22; and (c). Penalized 2.
Energies 17 02985 g003
Figure 4. Convergence diagram. (a). Sphere; (b). Schwefel 2.22; and (c). Penalized 2.
Energies 17 02985 g004
Figure 5. Flowchart of the perturbation and observation method.
Energies 17 02985 g005
Figure 6. ITSO-AP&O workflow chart.
Energies 17 02985 g006
Figure 7. Photovoltaic system simulation model.
Energies 17 02985 g007
Figure 8. MPPT tracking without shadings. (a) AP&O; (b) FLC; (c) PSO; (d) GWO; (e) TSO; and (f) ITSO-AP&O.
Energies 17 02985 g008
Figure 9. MPPT tracking in the case of static partial shading. (a) AP&O; (b) FLC; (c) PSO; (d) GWO; (e) TSO; and (f) ITSO-AP&O.
Energies 17 02985 g009
Figure 10. MPPT tracking in the case of dynamic partial shading. (a) AP&O; (b) FLC; (c) PSO; (d) GWO; (e) TSO; and (f) ITSO-AP&O.
Energies 17 02985 g010
Figure 11. Based on the RT-LAB experiment platform.
Energies 17 02985 g011
Figure 12. The experimental waveform of power output in the case of no shadow. (a) ITSO-AP&O; (b) TSO.
Energies 17 02985 g012
Figure 13. The experimental waveform of power output in dynamic shadow case. (a) ITSO-AP&O; (b) TSO.
Energies 17 02985 g013
Table 1. The test results.
FunctionPerformanceITSOTSO
SphereOptimal value05.78446 × 10−273
Average value07.18554 × 10−227
Standard deviation00
Schwefel 2.22Optimal value01.16399 × 10−133
Average value05.20219 × 10−118
Standard deviation02.82359 × 10−117
Penalized 2Optimal value4.0874 × 10−93.5093 × 10⁻⁸
Average value7.6265 × 10−71.6872 × 10⁻⁵
Standard deviation2.5252 × 10−63.0156 × 10⁻⁵
Table 2. Parameters of PV panel.
ParameterValue
Maximum power1705.2 W
Voltage at MPP58 V
Current at MPP29.4 A
Open circuit voltage72.6 V
Table 3. Comparisons of the tracking performance in the case of dynamic partial shading.
EnvironmentAlgorithmTracking Time (s)Tracking Power (W)Tracking Accuracy (%)
1AP&O0.0793046.194.277
FLC0.1233226.799.867
PSO0.2093230.199.972
GWO0.1543230.299.975
TSO0.2163208.999.316
ITSO-AP&O0.0983230.699.988
2AP&O0.1185251.699.954
FLC0.0594673.388.947
PSO0.3065216.299.281
GWO0.2295221.199.374
TSO0.2155252.199.964
ITSO-AP&O0.1045252.599.971
3AP&O0.1223673.299.951
FLC0.0612402.165.363
PSO0.3013672.499.929
GWO0.2333672.599.932
TSO0.2173664.599.714
ITSO-AP&O0.1023673.499.956
Disclaimer/Publisher’s Note: The statements, opinions and data contained in all publications are solely those of the individual author(s) and contributor(s) and not of MDPI and/or the editor(s). MDPI and/or the editor(s) disclaim responsibility for any injury to people or property resulting from any ideas, methods, instructions or products referred to in the content.