1. Introduction
With the escalating cost of fossil fuels and the environmental issues [
1] associated with traditional energy sources, many countries have turned toward renewable power production. Governments often encourage the use of renewable energy production to achieve net-zero emission targets by 2050 [
2,
3]. However, the incorporation of renewable sources into the power system poses certain challenges. It often disrupts supply–demand matching due to the intermittency and uncertainty of renewable energy output [
4]. The amount of energy generated by wind farms is directly dependent upon ambient conditions and wind speed, which are inherently unpredictable. Similarly, the energy produced by solar panels relies on the availability of usable light rays, which is influenced by factors such as time of day, cloud cover, and panel positioning. As this type of production cannot be readily predicted or accessed on demand, balancing such a power system becomes complex. Traditionally, the power system was balanced based on the principle that production would align with consumption requirements. However, this approach is more challenging to uphold when the energy source cannot provide energy on demand.
In this paper, an independent system functioning in island mode was analyzed. The objective is to maximize the utilization of all energy generated from renewable sources, regardless of immediate consumption requirements. Any excess energy that cannot be immediately consumed is stored in an energy storage system. This stored energy can then be utilized during times when the energy demand exceeds the capacity of renewable sources.
This paper further explores the principles of hydrogen storage and the potential integration of electric vehicles into household systems. The concept involves utilizing excess energy from renewable sources to perform water electrolysis, generating hydrogen that can be stored in tanks for future energy use.
The principle of obtaining hydrogen from renewable sources has been analyzed in several studies [
5,
6], in which various types of electrolyzers have been analyzed [
7,
8,
9] and positive results have been shown.
To enable the storage and functional use of hydrogen, extensive research has been conducted on the principles of its creation and storage and the design of elements that support the development of this technology [
7]. Hydrogen production methods can have varying environmental impacts, depending on the principles employed. The cleanest form of hydrogen is produced from renewable energy sources, as it has minimal negative side effects [
10,
11]. One approach to producing hydrogen from renewable sources, specifically from PV panels during periods of excess solar energy, is discussed in [
9]. The study presents a developed mathematical model that explores different options for fixing the panels or using sun-tracking systems, along with the corresponding percentage outcomes for the thermal efficiency of the electrolyzer. Hydrogen is used through fuel cells when consumers demand energy. Extensive analyses of PEM fuel cells and the advantages of their operation have already been conducted in [
12].
The principle of harnessing energy from hydrogen offers several advantages, including high energy efficiency, environmental and societal benefits, and increased economic competitiveness compared to other energy sources [
13,
14].
When implementing a system for hydrogen production from renewable sources, such as PV panels and electrolyzers, it is crucial to have a device that controls their operation. This device plays a key role in determining the periods when excess energy is directed toward the electrolyzer for hydrogen production and storage, rather than being consumed by the grid [
15].
To ensure the proper functioning of such a system, it is essential to establish a well-designed control principle that guides the operation of its various elements. Creating such a control principle involves defining a set of conditions under which each element operates most effectively, and then implementing it in the actual system. There are several methods for developing control principles. Neural networks can be utilized, although they require a substantial number of precise measurements [
16]. Another approach is fuzzy logic, which allows for the definition of operating conditions without the need for extensive measurements [
17]. In this paper, a programming procedure was implemented in the system to monitor the current storage level. Based on this information and predefined conditions, the system sends signals to the corresponding elements, ensuring the optimal operation and control of the hydrogen production and storage process [
18].
In this paper, a distribution system powered by wind turbines, solar panels, and an electrolyzer was analyzed. The aim is to utilize excess energy from renewable sources for hydrogen extraction and storage, as well as storage in individual batteries and electric vehicle (EV) batteries. The focus of consumption in the analyzed area is households. The necessary data for the analysis were obtained from measurements conducted in the Republic of Serbia. The measurements were obtained from the local system operator.
This paper begins with an introductory discussion in
Section 2 that addresses the nature of the problem.
Section 3 presents the operating principle of the electrolyzer, while
Section 4 showcases the operating principle of the proposed system. Each individual element of the system is then modeled in detail in
Section 5. Finally,
Section 6 presents the results of the analysis.
3. Hydrogen Production via Electrolysis
Electrolysis is a process that uses electricity to dissolve water molecules into hydrogen and oxygen. In hydrogen production, electrolyzers use DC power from renewable sources, and only pure oxygen is produced as a byproduct [
21,
22,
23]. There are four types of electrolysis methods based on their electrolyte, operating conditions, and ionic agents. Here, PEM water electrolysis was observed [
24]. PEM water electrolysis is one of the favorable methods for the conversion of renewable energy into high pure hydrogen, which is one of the reasons researchers are developing methods for its use in power systems with renewable sources [
25].
Figure 5 illustrates the principle of a PEM electrolyzer [
6]. When an electric current is applied, water molecules are separated into oxygen and hydrogen protons and electrons. Electrons and protons move toward the cathode, while oxygen remains on the anode. The electric current passing through the proton-conducting membrane provides the necessary energy from external sources (electrolyzer voltage
Uel) for this reaction. At the electrodes, molecules re-combine, resulting in the formation of hydrogen gas at the cathode and oxygen gas at the anode.
The electrolyzer requires a single-phase voltage to be applied to both the anode and cathode. This voltage is the sum of the voltage across the electrodes and the losses, including activation losses, ion losses, and concentration losses. It is important that this voltage is provided by the energy from renewable sources to power the electrolyzer effectively [
26].
where
Urev—voltage across the electrodes;
ηact—activation losses;
ηΩ—ion losses; and
ηconc—concentration losses.
4. System Operating Principle
The analyzed system is designed to incorporate renewable energy sources, specifically, wind turbines and solar panels. Excess electricity generated by these sources is directed toward electricity storage.
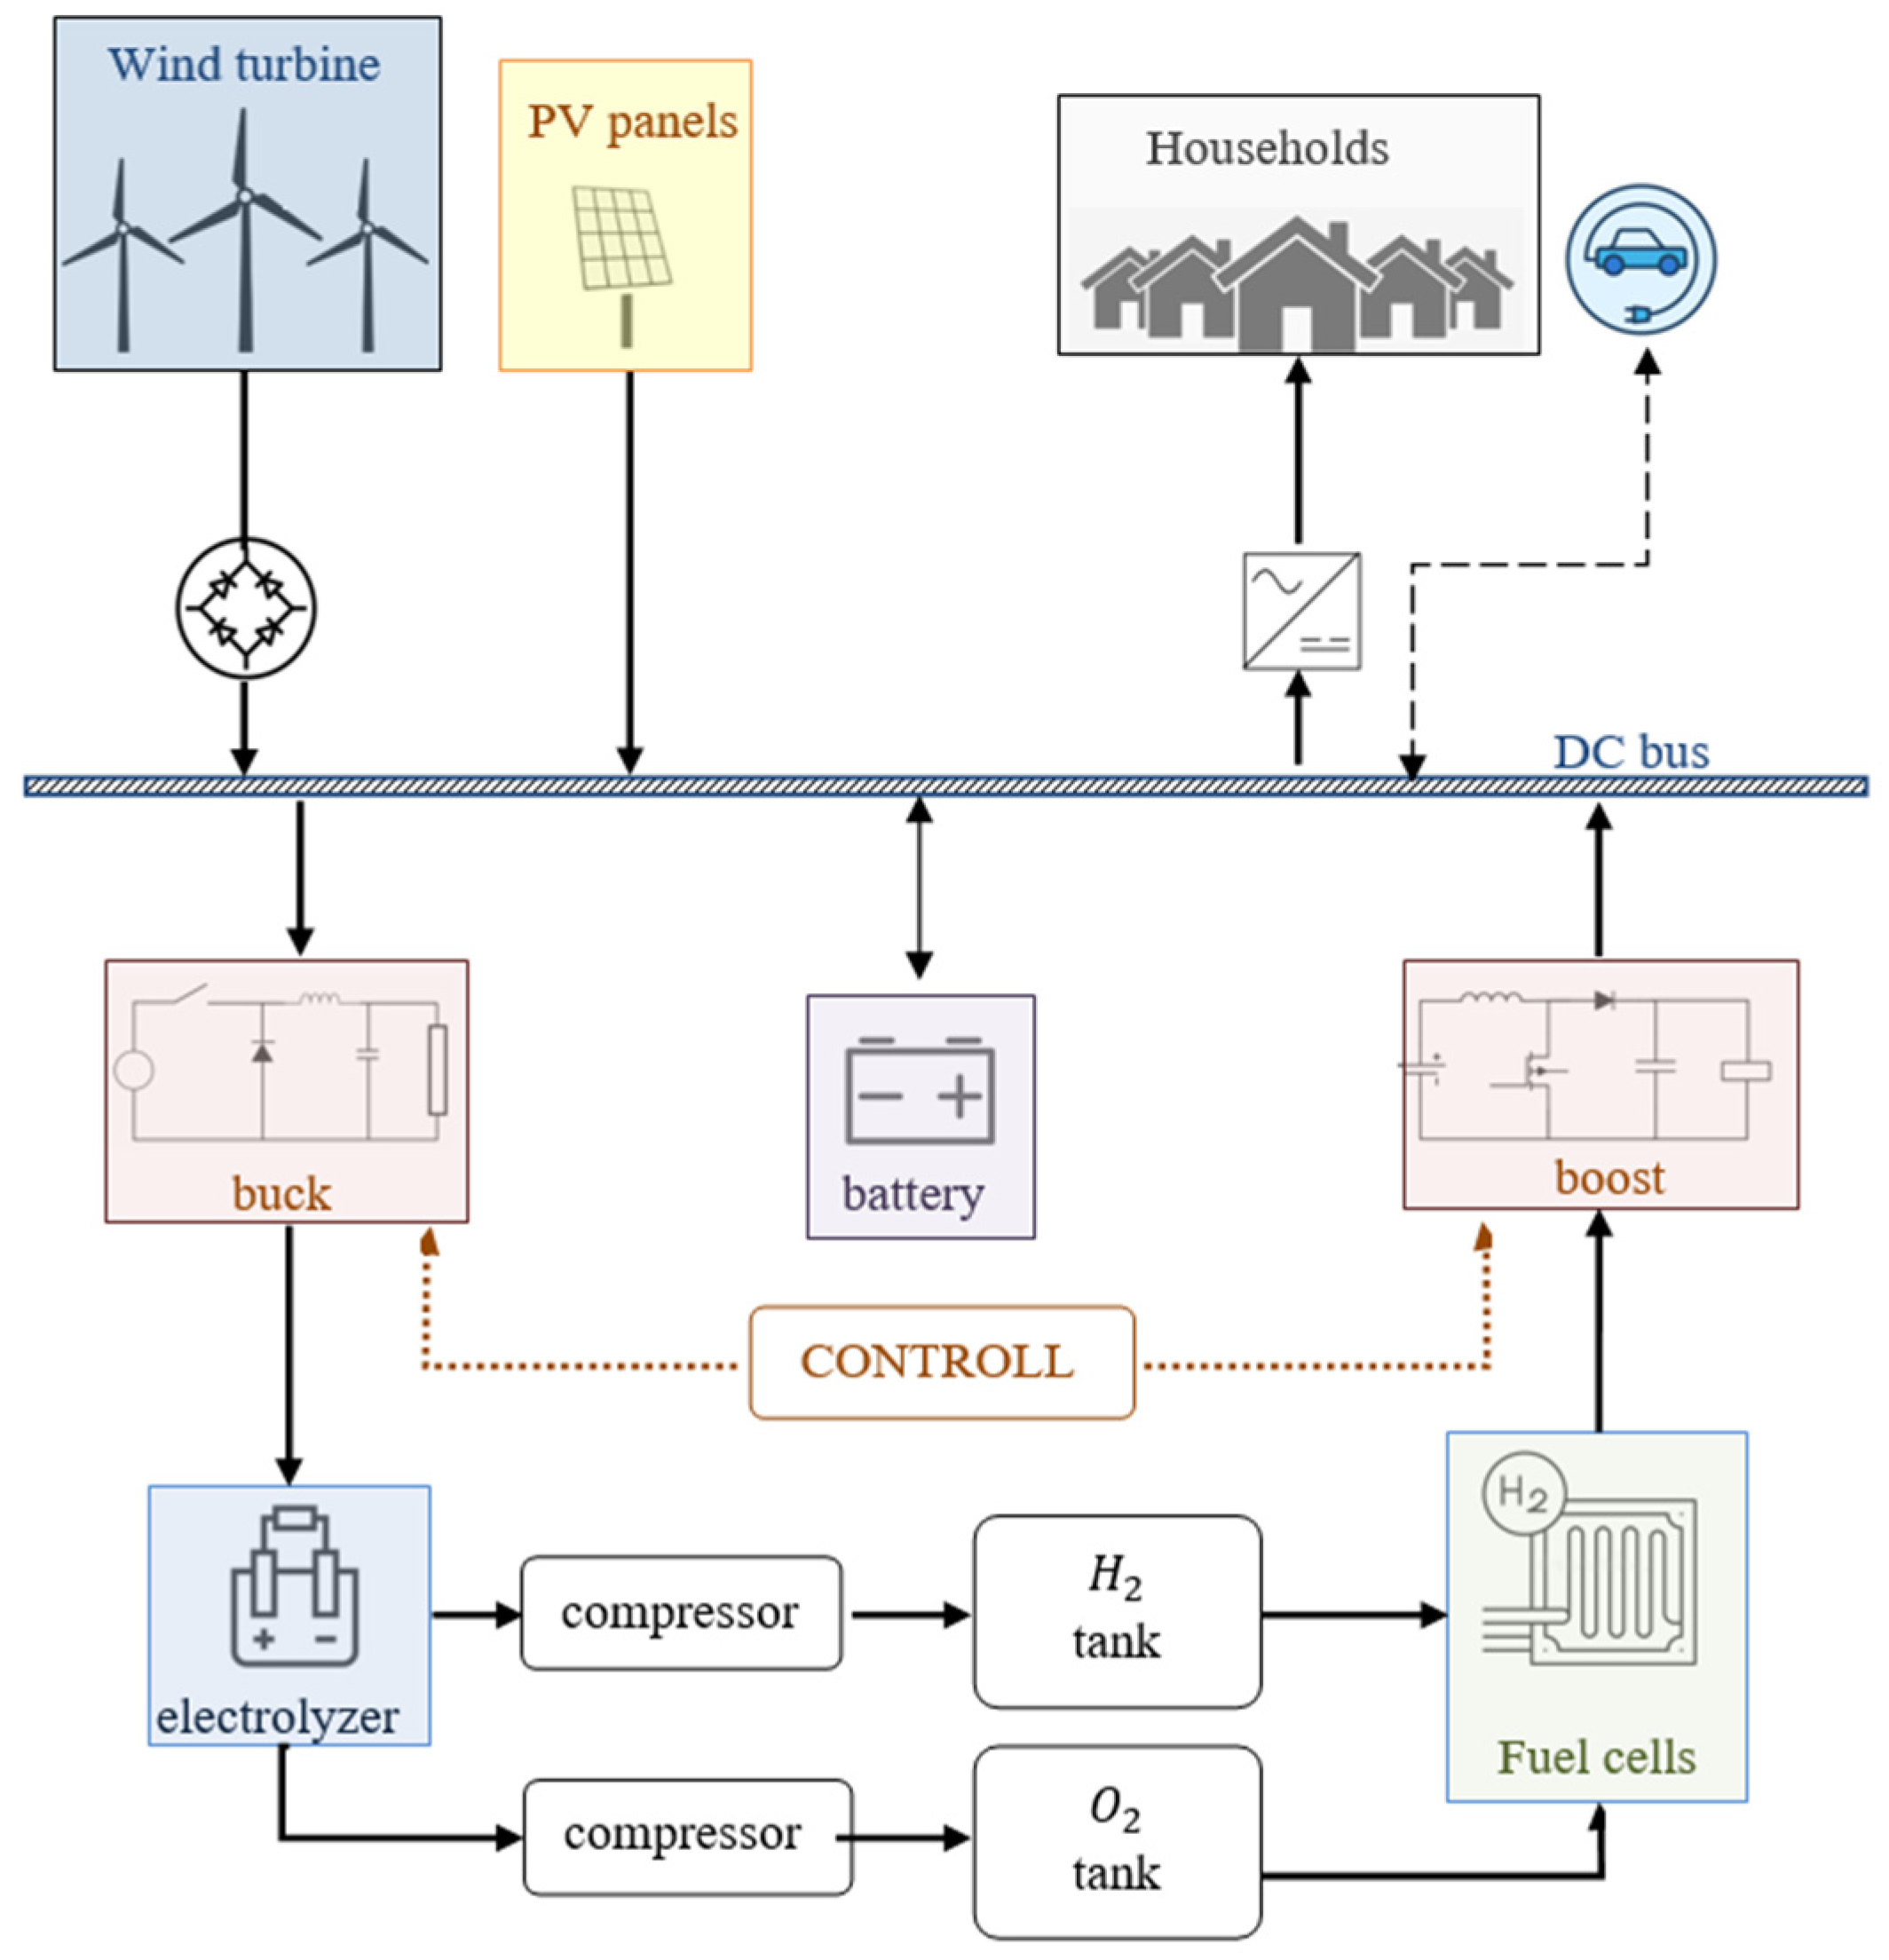
Figure 6 illustrates the fundamental principle of this system.
Storage facilities using the electrolysis process are more profitable for larger amounts of energy. Higher temperatures, achieved when storing more energy for longer periods, improve the efficiency of electrolyzers. However, it is not cost-effective to use these storage facilities for small or instant energy exchanges with the grid. In cases in which a larger amount of energy is stored, the hydrogen produced is transported to hydrogen storage. When needed, this stored hydrogen can be used to generate the required electrical energy for consumers when renewable energy sources are unable to meet the demand. By utilizing hydrogen as an energy carrier, the system can bridge the gap between renewable energy generation and consumer demand. This enables a reliable and continuous energy supply, even when renewable sources are insufficient [
26,
27].
Batteries or EVs are used for the short-term storage of small amounts of electricity. As a large number of charge and discharge cycles can reduce battery life, the goal is to reduce it whenever possible. Batteries are saved by reducing the period in which they would work by introducing the use of EVs during nighttime periods. Energy exchange with EVs takes place when the vehicles are connected to chargers in homes [
28,
29].
For more detailed modeling, it is necessary to consider the required conversion of energy from one type to another. The goal of this work is to enable the joint functioning of energy sources, consumers, and storage, which are connected via DC buses. The graphic representation of the analyzed system is given in
Figure 6.
The wind turbine is connected to the DC bus via a rectifier. The energy is taken from the DC bus through the inverter to consumption and through the buck converter (voltage reducer) to the electrolyzer. Batteries for temporary energy storage connect directly to the DC bus. The energy is fed from the fuel cells to the DC bus via a boost converter. The entire system is, by virtue of its state, under the management of global control [
30].
5. Individual Elements Modeling
All elements are individually modeled in order to adequately assess the flow of electrical energy. Units are divided by grouping individual elements with their converters.
The control affects the buck and boost converters when delivering energy to the DC bus from storage and taking energy for electrolysis.
The input data of the system are one-hour measurements of the production of wind turbines, solar panels, and consumption and data on the network elements and their functioning. Based on these values and the implemented rules, the control setting is also performed.
5.1. Electrolyzer and Buck Converter
As the dynamics of the converter are much faster than the dynamics of the rest of the system, they are taken as the ideal voltage source to which the electrolyzer is connected. The output power going to the electrolyzer,
PEl, is the power going into the step-down device,
PBu, reduced by its efficiency coefficient,
ηBu.
The voltage required for electrolysis is expressed as the ratio of the power of the electrolyzer and the current supplied to it from the converter [
31].
Equation (6) represents the dependence of voltage on current and temperature. The coefficients UEl,0, C1El, C2El, REl, and IEl,0 are experimentally defined for the electrolyzer, and TEl is its operating temperature.
By deriving from these two equations, the connection between the output of the converter and the electrolysis current is created by expressing the degree of production of the electrolyzer.
where
NCell,El is the number of cells;
ηI,El is the utilization factor of the electrolyzer; and
CH2 is the conversion coefficient.
5.2. Batteries and EV
Batteries connected to DC buses and EV batteries are simulated using the same operating principle. They are dimensioned in the same way, and the same principle of energy conversion applies to them in this paper. The batteries are connected in parallel with the DC buses. The current flowing through the battery is given by the following equation:
where
IPV is the current of solar panels;
IWind is the current from wind turbines;
IBu is the buck converter current;
IB0 is the boost converter current; and
ILoad is the system load current.
where
α is the discharge frequency;
UB,0 is the open circuit voltage for
t = 0; and
EB is the battery energy.
5.3. Fuel Cells and Boost Converter
The dynamics of the converter are much faster than the dynamics of the rest of the system, as in the case of buck converters. They are presented as ideal energy sources whose output depends on the converter’s efficiency,
ηBo. It is responsible for transferring energy to the DC bus, and its input voltage comes from the fuel cell and is expressed through its voltage using Equation (14).
In Equation (14), the dependence of the voltage on its current and temperature is expressed. The coefficients
UFC,0,
C1FC,
C2FC,
RFC, and
IFC,0 are experimentally defined for the fuel cell, and
TFC is its operating temperature. The degree of fuel cell production is expressed through Equation (15) as follows:
where
NCell,El is the number of cells;
ηI,El is the utilization factor of the electrolyzer; and
CH2 is the conversion coefficient.
5.4. Hydrogen Storage
The energy stored in hydrogen can be modeled through Equation (16), while energy stored in the form of hydrogen is expressed as a percentage according to Equation (18) through HL [%].
where
EH2 is the initial energy of hydrogen;
PEl is the electrolyzer production power; and
PFC is the power absorbed in fuel cells.
5.5. Control
The organization of the entire system’s functioning is indeed a complex problem. Simply transferring excess energy to storage is not enough. The control system must determine whether to direct the energy to hydrogen storage or batteries based on the amount of energy to be stored.
Energy storage in the form of hydrogen is not highly efficient for smaller amounts of energy. Therefore, the control system will direct the energy to hydrogen storage only if the amount needed to be stored is significant enough to make it profitable to start the electrolyzer. If the amount of energy to be stored is small, it should be sent to the batteries instead. The same principle applies to the opposite direction of energy flow. If the energy requirements for consumption are small and cannot be covered by production, then it should be taken from the batteries. If the requirements are higher, energy should be taken from fuel cells.
This is why batteries are included as temporary storage for smaller amounts of energy, in addition to hydrogen storage. The efficiency of the energy conversion from electricity to hydrogen and vice versa must be considered when determining the appropriate storage method.
The efficient use of batteries is also crucial. They should not be discharged beyond a certain limit, and frequent charge and discharge cycles should be avoided to maintain their lifespan. Therefore, the control system must monitor the state of energy stored in the batteries and direct their use accordingly.
The input data for the control system include the current state of the network. The following two values are considered: the difference between production and consumption (expressed as the energy flow) and the state of the batteries, which is defined through the state of charge (SOC) value. These inputs help inform the control system’s decisions. The H
2 limit is a predefined energy limit at which electrolyzers and fuel cells should be put into operation. Its value is defined by the electrolyzers’ capacity, which is chosen for the specific power system. In this study, its value is constant of 50 kW. If the energy that needs to be stored is less than this limit, then batteries and EVs are activated.
The following information is necessary for system control:
The desired behavior of this system can be readily defined through rules, offering numerous advantages for control. By employing such rule-based control, the entire spectrum of inputs can be effectively incorporated without escalating control complexity [
30]. This form of control presents certain advantages over machine learning algorithms. It does not necessitate substantial historical data, which might not be readily available for some technologies and systems in which they are all implemented.
For certain parts of this system, artificial neural network (ANN) control was implemented in order to predict the possible decisions made in the system (such as batteries and EV use). It requires greater complexity and a great amount of training data but has little significant impact on system functionality compared to the control presented here.
6. Simulation Results
6.1. Power Flow and Storage
The simulation results are presented in graphical form to observe the activation of different types of energy storage and the amount of power exchanged between each storage type and the entire system.
Measurement data used in this analysis for wind, solar, and load power are shown in the graphs in
Figure 2,
Figure 3 and
Figure 4. Parameters of the system elements are given in
Table 1.
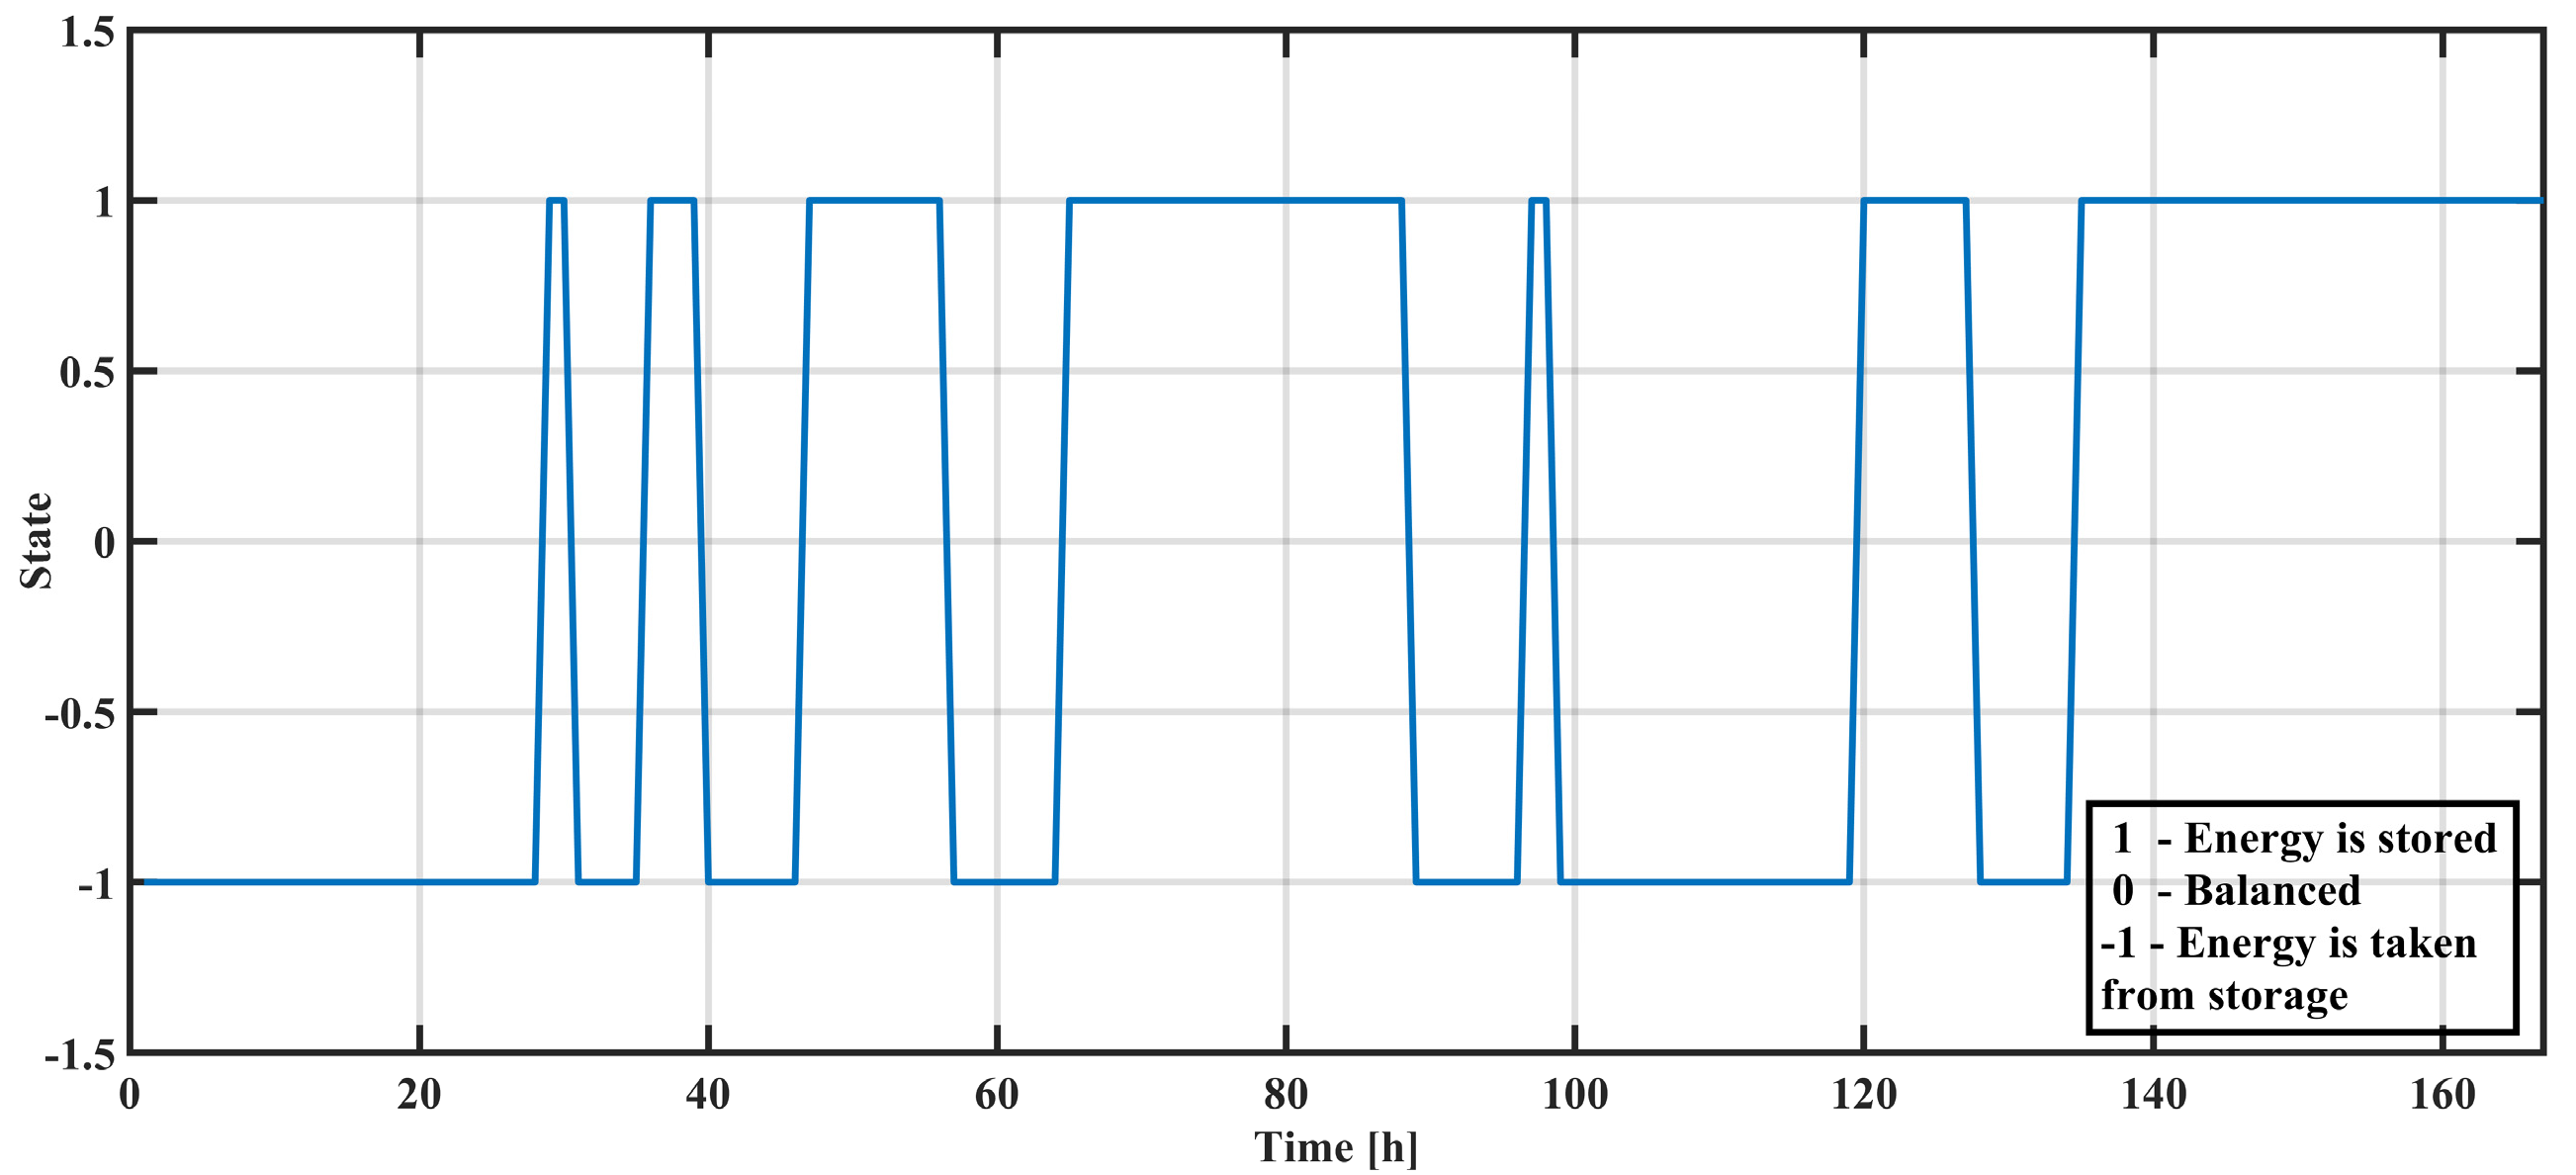
Figure 7 displays the temporal variations of system requirements. Positive values indicate periods when there was an excess of produced energy that needed to be stored, while negative values indicate periods when energy should have been taken from storage.
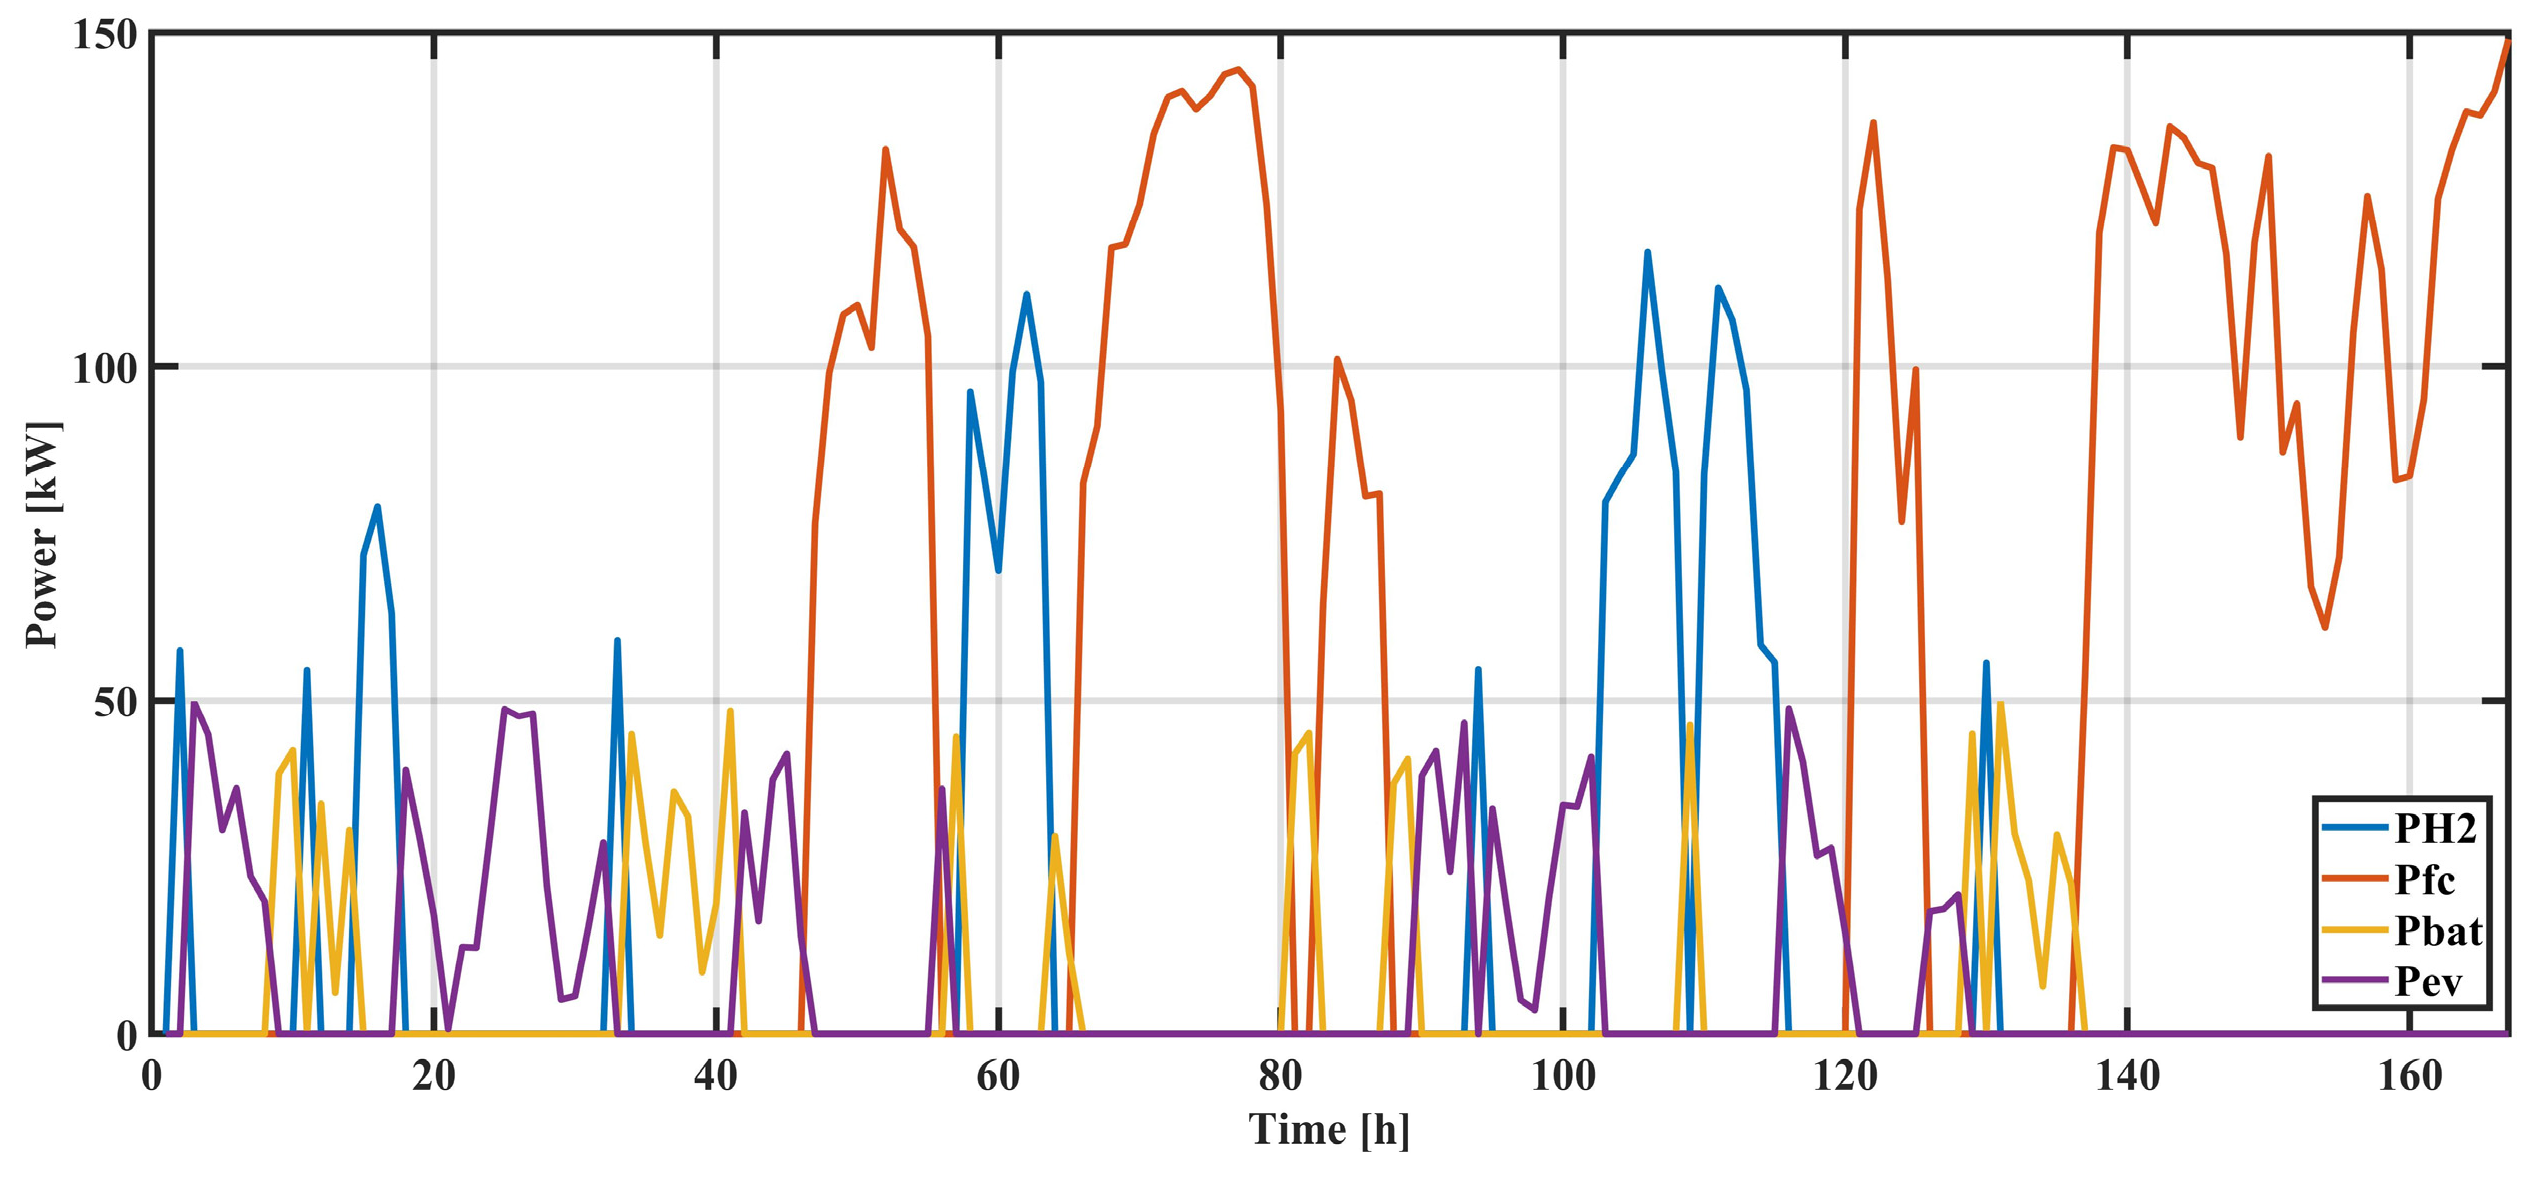
Figure 8 illustrates the periods during which each type of electricity storage was utilized. The power values shown are positive and represent the amount of power exchanged with individual storage systems. Smaller amounts of energy are exchanged with electric vehicles (EVs) during the night (purple), whereas during the day, they are exchanged with batteries (yellow). Electrolyzers (blue) and fuel cells (red) operate both during the day and at night, as they are not limited by weather conditions.
The input data provided to the control system only include the current state of the network. The following two values are considered: the difference between production and consumption (energy flow), as expressed in Equation (16), and the state of the batteries, as defined by the state of charge (SOC) value. These inputs guide the decision-making process of the control system.
The results presented in
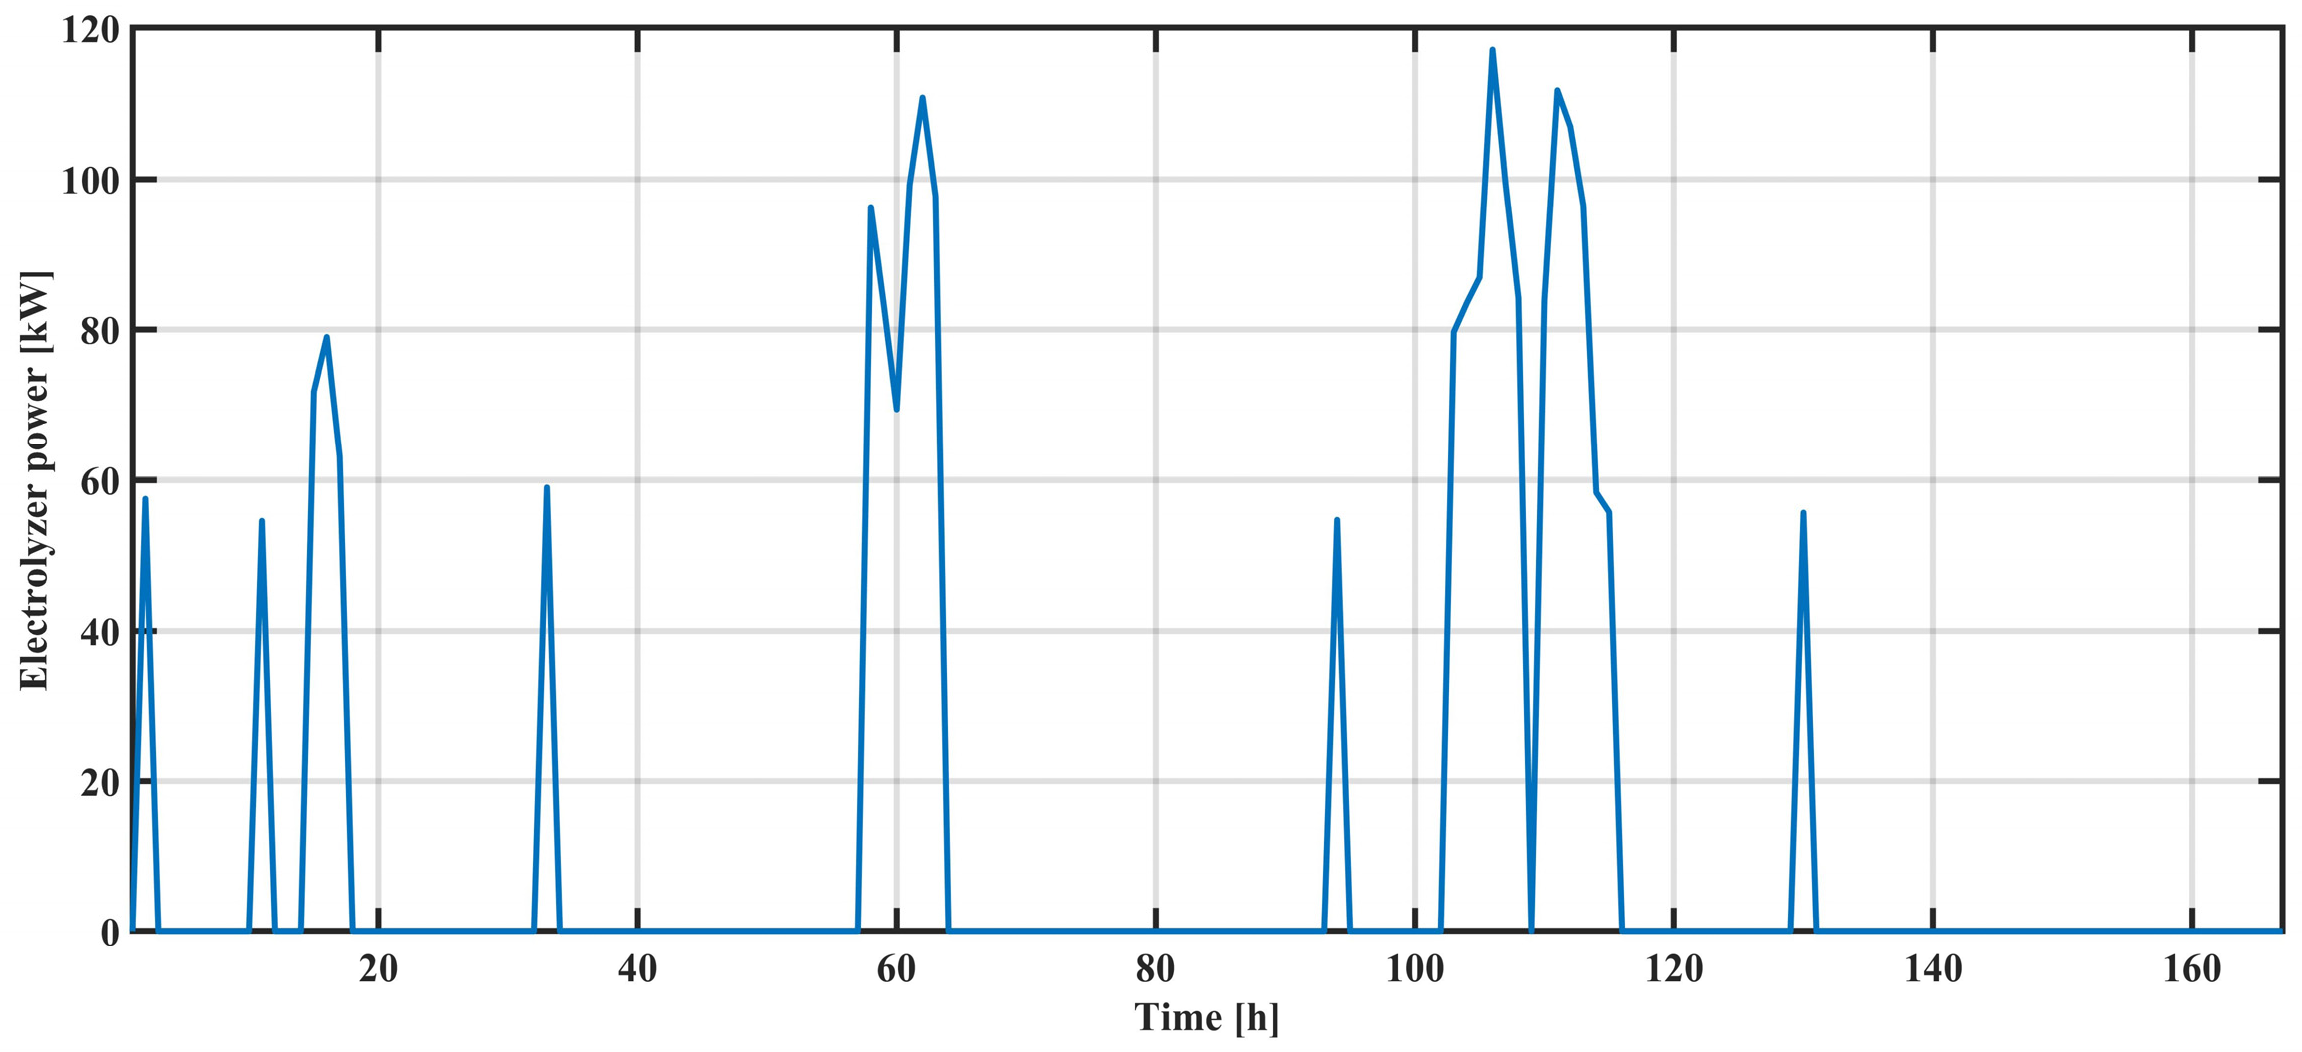
Figure 9,
Figure 10,
Figure 11 and
Figure 12 showcase the strengths of individual elements exchanged with the system over a one-week period. The energy flow direction is clearly indicated for power stored in the form of hydrogen and power generated by starting fuel cells. In the case of an electrolyzer, energy flows from the system to the hydrogen storage, while for fuel cells, energy flows from the storage to the system in which there is an energy deficit.
For batteries and electric vehicles (EVs), energy can flow in both directions, and this is observed through negative power values. A negative sign indicates that power is being supplied to the storage, while a positive sign indicates that energy from storage is being used to power consumers. These results provide valuable insights into the energy exchange dynamics and the utilization of different storage elements within the system.
In
Figure 13, the percentage state of charge of hydrogen storage and batteries is provided. This graphical representation allows for the observation of the variation in the state of charge during the operation of the system, as well as the percentage ratio of engagement between the two types of storage.
As excess energy appears more frequently in the system, which is of a smaller value, the batteries are utilized more. This results in a greater dynamic change in their state of charge. In this particular system, the batteries were engaged to a greater extent compared to their capacity, unlike hydrogen storage. However, a larger amount of energy was stored in the form of hydrogen, which aligns with the principle of this type of energy storage.
These observations highlight the dynamic behavior of the system and the varying utilization of different storage types based on energy requirements and availability.
6.2. Economic Analysis of the Storage System
The prices of electrolyzers, fuel cells, and batteries depend on the amount of energy that is planned to be stored in them (i.e., element capacity). This value was defined by the technical analysis conducted in the previous sections. In this chapter, a breakdown cost of storage elements is displayed. In
Table 2, the properties and costs of individual elements for a 1 kW capacity are shown.
The economic analysis was mainly based on calculating net present cost (
NPC), levelized cost of energy (
LCOE), and levelized cost of hydrogen-stored energy (
LCOH). These values are obtained through Equations (20)–(23).
where
CRF is the capital recovery factor;
Cannualized is the annualized cost;
i is the annual real discount rate;
Rproj is the project lifetime;
Cannualized,total is the total annualized cost of the system;
Cannualized,total,H2 is the total annualized cost of hydrogen production; and
Mhydrogen is the total production of energy from hydrogen.
The results are given in
Table 3 for multiple planned lifespans of the system and multiple discount rates associated with these lifespans [
32].
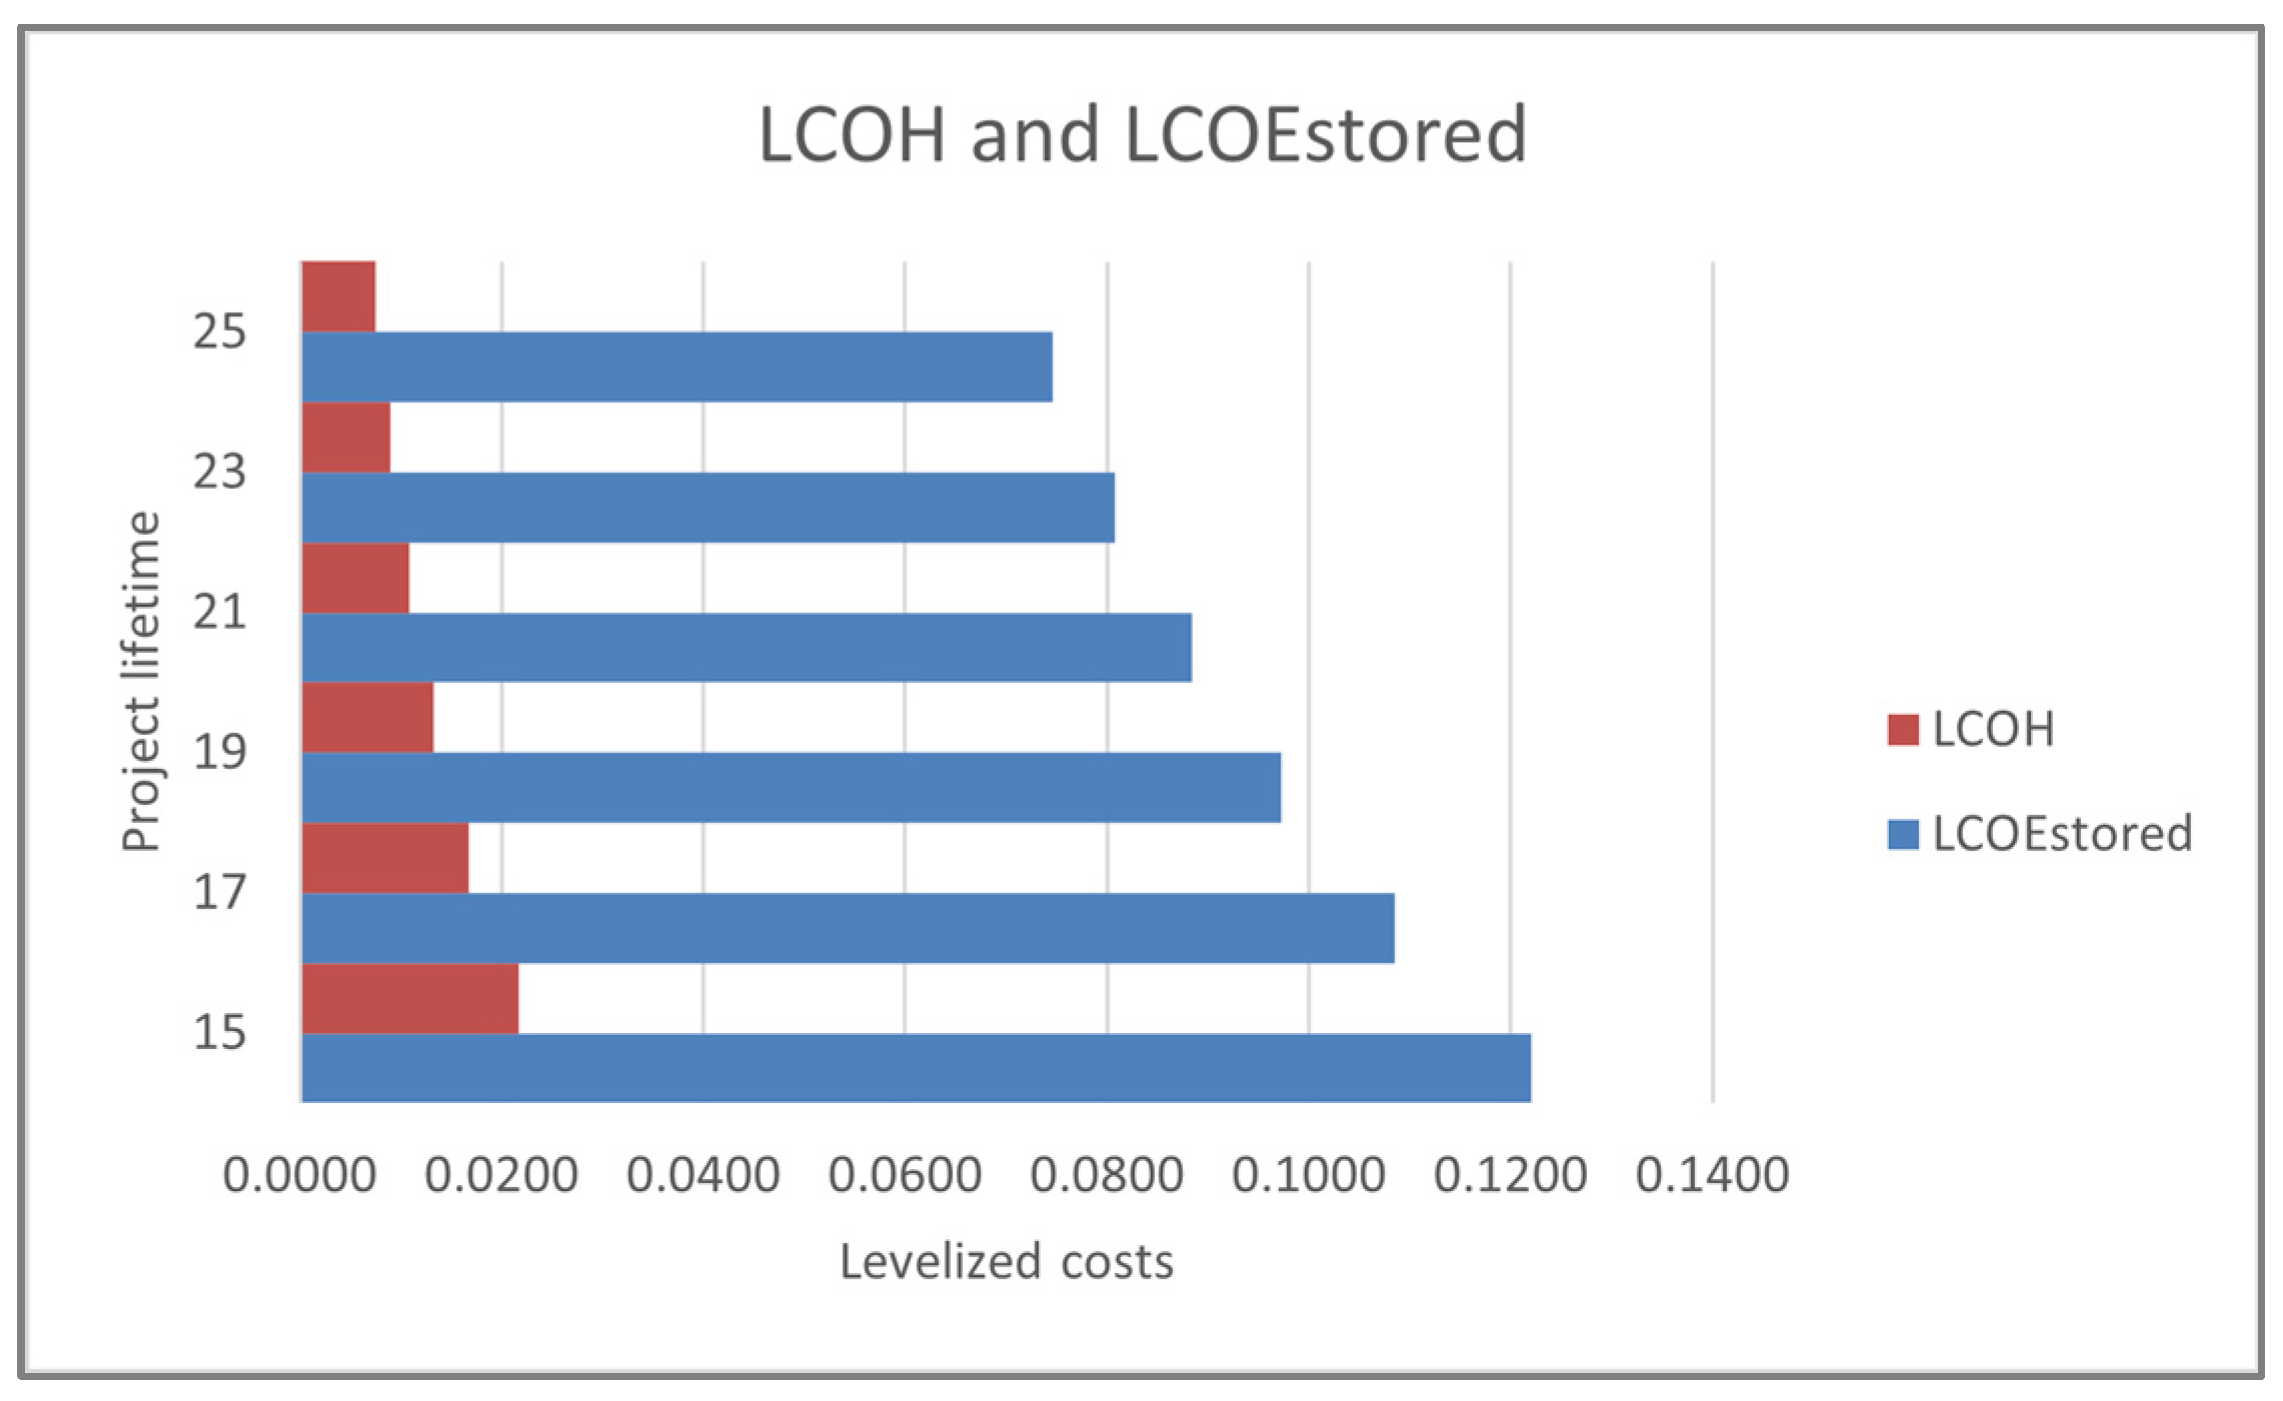
The levelized costs of the cumulative energy stored and energy stored only through hydrogen storage are displayed in
Figure 14. Here, a significant decrease in the cost can be detected with a longer predicted lifetime of the project. The levelized price of energy stored in hydrogen is more than 20% less than the cumulative stored energy, even though most energy was stored through hydrogen. This shows the economic effectiveness of this type of storage.
7. Conclusions
This paper deals with the principle of the functioning of an isolated system that has its own production from renewable energy sources, consumption that is reflected in the supply of households, and different types of energy storage that are responsible for maintaining the stability of such a network. The strength of the individual storage and the ratio of its involvement in the work of the entire system was observed. The ability of the independent and functional operation of such a system was observed, despite the large number of different types of unpredictable energy sources and their storage.
The expected dynamic behavior of the batteries was confirmed. In order to facilitate the operation of the batteries and preserve their life as additional storage, affordable EVs are used during the night. Rules have been successfully implemented that store a larger amount of energy in the form of hydrogen.
In such a system, the mutual assistance of elements is the most significant advantage that enables significant progress in the functioning of this type of network. The implementation of new technologies and ideas, such as hydrogen storage, in order to level the intermittency of renewable sources and balance the microgrid, which does not have to rely on a larger distribution network to maintain its stability, is shown. From all the results obtained, it was concluded that the grid/fuel cell/PV/electrolyzer hybrid system could be a promising solution in developing countries in general.
In the future development of such systems, a higher level of technology related to the formation of system control, more detailed observation of individual elements, or the implementation of additional energy sources and different types of consumers is planned. In order to have a future-forward control, ANN could be used to predict energy production and consumption in order to have systems that could possibly be defined in advance and bypass the obstacle of real-time planning.


