Abstract
The importance of energy transition was underlined at COP28 in Dubai, where governments committed to tripling renewables capacities and doubling the rate of energy efficiency by 2030. However, the power generated by climate-dependent energy sources exhibits greater vulnerability to potential climate changes in the long term. Therefore, climate models play a pivotal role in estimating the effects of climate change on renewables in the context of strategic planning for the development and operation of new renewable power plants. In this context, the World Meteorological Organization (WMO) developed a Global Energy Resilience Atlas aimed at providing insights into the climate change risks for the hydropower sector, the largest renewable electricity source for most countries, generating over 4300 TWh globally. This study focuses on defining four Hydro Climate Risk indices () using historical and climate projection precipitation data for three climate scenarios. The final product is a freely available and interactive tool. The developed methodology and tool address how climate changes have historically affected hydropower generation and how they will impact the future at national scales. The final product also addresses the needs of policymakers at national, regional, and global levels in crafting long-term planning for a more secure energy sector, accelerating the energy transition to more sustainable and reliable energies.
1. Introduction
The global energy transition toward renewable energy, in line with the decarbonization targets stipulated in the 2015 Paris Agreement, is critical to reducing emissions toward achieving the net zero emission target. Renewable energy sources and energy efficiency play a key role in providing energy services in a sustainable manner and, in particular, in mitigating against and adapting to climate change [1]. Among renewables, hydropower remains the largest source of electricity, generating more than all other renewable technologies combined [2]. It is an affordable and well-established technology that contributes significantly to climate change mitigation and could play an important role in adapting water resource availability to changing climatic conditions. Hydropower generation is sensitive to long-term weather and environmental variations at different time scales, from days and weeks, up to several months and even years ahead [3]. A global review of the impact of climate change on the hydropower sector is provided in references [4,5], where the crucial need to evaluate the opportunities and risks hydropower poses under different climate scenarios is elaborated.
Extreme events like flooding or long-term droughts pose great hazards for hydropower generation. Temporal variability negatively impacts hydroelectric production by affecting water supply in different periods. However, the impact is less pronounced on reservoir dams compared with run-of-river facilities, because reservoir dams have the capacity to store water, thereby accommodating variations in reservoir volume. Dams can effectively regulate the flood pulse of a river and mitigate downstream impacts. Flooding, by increasing river flow, can potentially increase hydropower generation as long as the excess flow remains within the dam’s reservoir capacity. Droughts may present the most obvious threat to hydroelectricity generation, as they reduce the amount of water available to produce electricity. Many regions have experienced droughts in the last several decades, losing up to half of their electricity production in some cases. Areas exclusively dependent on hydropower for electricity generation would face blackouts under some drought scenarios [6].
Climate change and the changes in rainfall and temperature patterns can affect hydropower output through the following four major factors: (i) surface water evaporation, (ii) reduced runoff due to drought, (iii) increased runoff due to flooding, and (iv) siltation deposits [7]. Research indicates that hydropower generation may increase by 39% when precipitation increases by 43% [8]. Precipitation data can be used as a proxy for the variability and trend of change in runoff and presents a high correlation with surface water evaporation.
In a review study by Shu et al. [9], exploring the impacts of climate change on hydropower development across global, national, and regional scales, the necessity of localized analysis was emphasized due to varying hydrological conditions and geographical features. Opperman et. al. [10] conducted a global-level study, analyzing over six thousand existing and projected dams for climate-related risks using the WWF Water Risk Filter as an online water risk assessment tool. Their findings indicate that approximately a quarter of dams face medium to very high water scarcity risk, with significant projected increases by 2050. Additionally, the majority of these dams are situated in river basins with medium to very high flood risk, expected to escalate substantially by 2050.
In a recent study at the national level, Zhou et al. [11] assessed the impacts of climate and reservoir hydropower model uncertainties on monthly hydropower projections for 132 US federal hydropower plants. Their multi-model approach revealed that, while climate models predominantly contributed to annual and seasonal uncertainties, the choice of hydropower model significantly influenced seasonal variability, especially in regions with extensive reservoir storage. Their analysis emphasized the importance of multi-model assessments in hydropower projections. Naranjo-Silva et al. [12] conducted a similar study for 14 hydropower plants in Ecuador using historical data from 2010 and projection data up to 2050. The results suggested a considerable decrease in hydropower generation in Ecuador through to 2050 due to meteorological changes. In another study in Iran [13], results of downscaled simulations for three different emission scenarios showed that the changes in annual streamflow ranged from a decrease of 35% to an increase of 90% during 2035–2064 compared with the historical period for different climate change scenarios. This would change the hydropower generation between −25 and +2% compared with the historical period.
Wang et al. [14] proposed a model-based approach, coupling hydrological models with climate scenarios, for assessing the impact of climate change on hydropower potential in the Nanliujiang River Basin of China. They combined the variable infiltration capacity (VIC) model with that of five climate models to analyze the spatial and temporal distributions of water resources in the future. Their uncertainty analysis indicated that the multi-model ensemble results could more reliably reflect future climate change. Similarly, Claudio da Silva et al. [15] applied the MGB-IPH hydrological model to assimilate precipitation and other climatic variables from the regional Eta climatic model for scenarios RCP4.5 and RCP8.5 for three analysis periods up to 2100. They conducted that study to assess the climate change impact on hydropower generation for a specific power plant in Brazil. The results revealed considerable reductions in stream flows, leading to reduced energy generation simulations for the hydropower plant, reaching almost 65% in the worst-case scenario.
In light of the findings of the literature and based on the recognized gap at the global and regional scales, the WMO Energy Resilience Atlas developed in this study serves as a useful tool for assessing the impact of climate change on renewable energy systems. In this article, we only focus on the hydropower sector. The tool enables users to make informed decisions, optimize energy efficiency, and accelerate the transition to sustainable and renewable energy sources. Acting as a catalyst for transformative action, the atlas fosters collaboration and alignment between stakeholders to create a more sustainable and resilient future for all. Covering most countries around the world, subject to data availability, the tool aids policymakers in shaping future energy mixes for individual countries through long-term planning, considering risks under probable climate scenarios. The atlas complements information published by other international organizations, such as IRENA (https://globalatlas.irena.org/workspace (accessed on 3 April 2024)), the World Bank (https://globalwindatlas.info/en (accessed on 3 April 2024), https://globalsolaratlas.info/ (accessed on 3 April 2024)), and the International Hydropower Association (https://www.hydropower.org/discover/hydropower-around-the-world (accessed on 3 April 2024)) for estimating climate’s risk to hydropower generation.
This study addresses two key questions: Firstly, how climate change has historically and will continue to affect hydropower generation. Secondly, it shows how the developed methodology and interactive tool can help decision-makers and various stakeholders in shaping a more secure and resilient hydropower sector over the next decades by providing actional information.
The following novelties of the current study will help to tackle the aforementioned challenges. First, this study offers a comprehensive assessment of the impact of climate change on the hydropower sector by integrating historical precipitation data with climate projection scenarios at the global scale, introducing four hydro-climate risk indices. Second, the developed methodology and indices not only provide insights into the vulnerabilities of hydropower generation, but also support policy- and decision-makers at national, regional, and global levels in enhancing the security of the energy sector by considering the impacts of climate change on long-term planning for hydropower generation. Third, the final product is not just a static report, but an interactive and freely accessible online tool that can be used by various stakeholders across the world to make informed decisions, optimize energy efficiency, and accelerate a just energy transition to sustainable and renewable energy sources. The hydropower potential of the whole river basin in the future is analyzed in order to allow for a more realistic picture of future hydropower planning.
2. Materials and Methods
Developing a methodology for assessing climate change’s impacts on hydropower generation systems requires the consideration of various factors, such as the geographical coverage, hydropower system description, and available precipitation data. Usually, basin-level assessment involves downscaling from global climate models (GCMs) through detailed hydrologic modeling and hydropower simulations. However, conducting assessments at the global level would be computationally challenging due to the complexity of simulating at the basin level. Moreover, the lack of sufficient and consistent detailed data for all countries further limits such assessments [16]. In this study, we adopt an approach similar to that of Hamududu and Kilingtveit [16], who aggregated different types of hydropower systems (dams, run-of-the-river, and pumped storage) located in different climates to provide a broader global perspective. This approach is based on the assumption that the current hydropower generation system may primarily be limited by water availability. The main assumption is that, if the water supply decreases, hydropower systems will correspondingly decrease generation, and vice versa [16].
2.1. Climate Risk Index (CRI)
According to the Intergovernmental Panel on Climate Change (IPCC), climate risk results from the interaction between hazard, exposure, and vulnerability. The climate risk index, therefore, is calculated using the following formula [17,18]:
Hazard refers to the potential occurrence of climate-related physical events or trends that may cause damage and loss, which can manifest as either chronic or acute impacts. Chronic hazards are longer-term pattern shifts in precipitation, temperature, ice melt, or sea-level rise. Acute hazards are isolated events, such as floods, landslides, wildfires, storms, etc.
Exposure indicates the presence of assets, services, resources, and infrastructure that could be adversely affected, determined by location and linked to the hazard probability, intensity, and frequency at a certain location. For the energy sector, exposure can range broadly, and include (but not be limited to) supply chains, companies, sectors, buildings, cities, geographic regions, asset classes, etc.
Vulnerability is the degree of susceptibility or predisposition and the lack of capacity to cope with and adapt to the adverse effects of (climate) hazards. It is important to note that two assets can be equally exposed to the same hazard, but have distinct levels of vulnerability [18,19].
2.2. Hydro Climatic Risk Index (HCRI)
The hydro climatic risk index computed for the WMO Global Energy Resilience Atlas is based on precipitation data, as it has a direct influence on river runoff and is readily available for all countries.
2.2.1. Hazard Climate Indicators
Regarding the hazard component for the calculation, the following four hazard climate indicators were selected, each focusing on a particular aspect of the shifts in precipitation patterns.
Trend Indicator: Mean Annual Precipitation
This indicator provides information regarding overall water availability by calculating the average of the total annual precipitation (mm/day) using monthly averaged data. For detailed information on datasets, refer to Section 2.3 below.
Variability Indicator: Precipitation Variability
Climate change influences the temporal variability of precipitation events. Higher variability indicates wider swings between wet and dry extremes, posing significant challenges for hydroelectric generation planning and management. Increasing variability enhances the likelihood of extreme events occurring, potentially leading to more severe and frequent floods or droughts. Additionally, seasonal offsets, such as altering the timing and magnitude of precipitation for traditional rainy and dry seasons and peak snowmelt, could occur [4].
The variability indicator was calculated using Equation (2), where Std stands for standard deviation, is the total precipitation of month_i, and is the targeted 30-year-period monthly mean precipitation of corresponding .
Wet indicator: standardized precipitation index_wet ();
The standardized precipitation index () is the main meteorological drought index recommended by the WMO to monitor and follow drought conditions, which is also useful for identifying wet periods. McKee et al. [20] introduced a classification system to define drought intensities resulting from the , as shown in Table 1. They defined the criteria for a drought event for any of the timescales. A drought event occurs any time the is continuously negative and reaches an intensity of −1.0 or less. The event ends when the becomes positive. Each drought event, therefore, has a duration defined by its beginning and end, and an intensity for each month that the event continues. The positive sum of the for all the months within a drought event can be termed the drought’s magnitude.

Table 1.
Classification of standardized precipitation index () values [20].
While the was originally developed for drought detection, it can also identify wet cycles. Some studies have investigated the correlation between positive values and flooding [21,22]. Applying different time windows (1, 3, 6, 12, and 24 months), these studies have observed a positive correlation between high values of positive and instances of flooding. Constant wet conditions can saturate the soil, increasing the likelihood of flooding in extreme rainfall events. In our analysis, we employed a 12-month time window to detect changes in precipitation impacting water reservoirs and subsurface water sources while assessing soil moisture levels. This 12-month time frame encompasses a full annual cycle, eliminating the need to specify the precise rainy season for each location worldwide.
The values were calculated using the SPEI package version 1.8.1 of the R programming language (https://cran.r-project.org/web/packages/SPEI/SPEI.pdf (accessed on 12 April 2023)). Subsequently, the was divided into its wet and dry components. is taken as a proxy for flooding, representing extreme wet cycles. As shown in Table 1, values of 1.5 and above are classified as very wet. For each 30-year period, we calculated the sum of values exceeding this threshold using Equation (3).
Dry Indicator: Standardized Precipitation Index_Dry ()
Additionally, for the dry indicator, we utilized the Standardized Precipitation Index_dry () as a proxy for drought, with high values signifying prolonged dry cycles. In this scenario, the threshold was established at values equal to or less than −1.5, as indicated in Equation (4).
2.2.2. HCRI Calculation
To calculate the hydro climate risk index (), the location of the hydropower plants was used as a proxy for exposure to the changing precipitation patterns. The cumulative electricity generation from all dams within a country serves as a key factor upon which the entire energy system relies. Consequently, the exposure of each hydropower plant to precipitation variations is weighted by the proportion it represents of the total installed capacity of electricity generation plants in the country, termed the normalized installed capacity (). In other words, the larger the installed capacity of a plant, the higher its exposure to hazards.
The vulnerability proxy is defined as the percentage of the installed hydroelectric capacity compared with the total electricity generation capacity within each country, reflecting the proportion of hydropower capacity in the national electricity mix. Countries primarily dependent on hydropower generation, prevalent in many countries in South America, Africa, and Central Asia, exhibit higher vulnerability to precipitation fluctuations and the adverse effects of climate change, such as droughts. The mathematical formula for the , incorporating these definitions, is presented in Equation (5).
where represents the normalized installed hydropower capacity and signifies the proportion of hydropower generation within the country’s energy mix. This calculation was performed per cell, followed by data aggregation for each country to obtain the mean values for both historical and climate projection data. was calculated for each of the four hazard climate indicators defined in Section 2.2.1.
2.3. Data
In this study, we used three main data resources to calculate : (1) ERA5 (ERA5 is the fifth-generation European Centre for Medium-Range Weather Forecasts (ECMWF) atmospheric reanalysis of the global climate covering the period from January 1940 to present, produced by the Copernicus Climate Change Service (C3S) at ECMWF) reanalysis and CMIP6 climate projections monthly precipitation data were utilized to investigate long-term shifts in historical and future precipitation patterns; (2) the Global Power Plant Database V1.3.0 [23] and Atlas of Hydropower in Africa [24] were used to identify the location and installed capacity of each power plant; and (3) the IRENA Renewable Energy Statistics database [25] provided information on the national installed capacity of the different energy sources, facilitating the calculation of the proportion of the energy mix represented by hydropower. More detailed information about the datasets and the data analysis is provided below.
2.3.1. Precipitation
As mentioned earlier, precipitation serves as the sole parameter for calculating the . Historical data and climate projections are both used to explore the long-term shifts in historical and future precipitation patterns, aiming to identify trends (chronic hazard), as well as providing a proxy for floods and drought.
Monthly precipitation data were extracted from ERA5 reanalysis and CMIP6 climate projections under three Shared Socioeconomic Pathways (SSPs) climate scenarios: SSP126 (sustainability), SSP245 (middle of the road), and SSP585 (fossil-fueled development). Raw projection data were adjusted using the cumulative distribution function transform (CDFt) method [26], taking ERA5 as a reference. These scenarios represent various socio-economic developments and pathways of atmospheric greenhouse gas concentrations [27]. Ten climate projection models were utilized to calculate the mean value of the ensemble result for each scenario. The models included AWI-CM-1-1-MR, CAMS-CSM1-0, CESM2-WACCM, CMCC-CM2-SR5, EC-Earth3-Veg, FGOALS-f3-L, FIO-ESM-2-0, MRI-ESM2-0, NorESM2-MM, and TaiESM1. The importance of using multi-model assessment in hydropower projection has been highlighted in previous studies [11,14].
To evaluate changes over time, we divided the time series into 30-year periods, aligning with the WMO standard for calculating climatological normals [28]. These normals serve as benchmarks or references against which specific conditions can be assessed and are widely used as indicators of the likely conditions to be experienced in a given location [29].
As shown in Figure 1, historical and climate projection precipitation data were aggregated for 30-year periods with a 5-year overlap, beginning from 1971. Monthly historical data (1971 to 2020) were extracted from the ERA5 reanalysis dataset, while projected precipitation data for the period of 2020–2100 represented the monthly averages of ten models for each of the three climate scenarios.
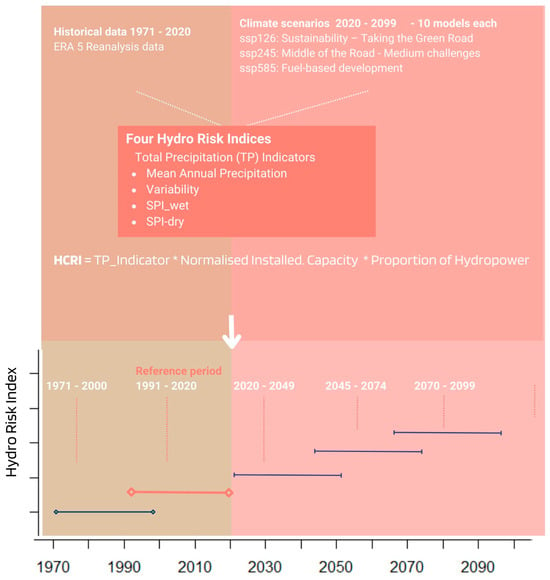
Figure 1.
Summary of the historical and climate projection precipitation data utilized to calculate the hydro climate risk indices (). The data were averaged over 30-year periods in accordance with the WMO climatological normal, incorporating a 5-year overlap. The red line denotes the period from 1991 to 2020, which serves as the reference period for this analysis.
2.3.2. Plant Locations and Installed Capacity
The Global Power Plant Database V1.3.0 [23] was used to identify hydropower plants. Subsequently, this dataset was merged with the Atlas of hydropower in Africa [24], providing information on existing and planned dams up to 2050. The final Global Hydropower Plants database encompasses 125 countries and includes 7166 operating plants, with 111 power plants located at the border of two or more countries. This data facilitated the creation of a hydropower mask (Hydro_mask) to select only cells containing hydropower plants. To streamline the analysis, the installed capacity of all plants was normalized per country by dividing each value by the total installed hydropower capacity of the corresponding country. Figure 2 illustrates the total installed capacity for these 125 countries.
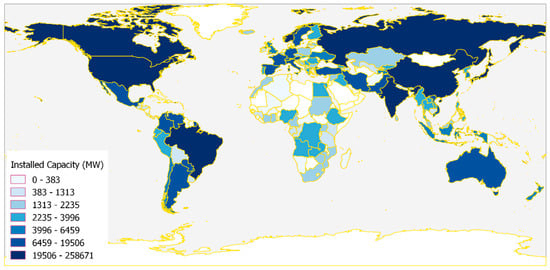
Figure 2.
Total installed hydropower capacity for 125 countries in megawatts (MW). Countries depicted in white either lack available data or do not have hydropower plants.
Hydropower plants located at the border of two or more countries were investigated more closely. Different scenarios emerged as follows: (1) in cases where countries shared generation equally, the installed capacity was divided among the involved countries; (2) in cases of dissimilar shares, where each country installed and managed a specific number of turbines, the corresponding installed capacity was allocated, accordingly; and (3) cases where, despite being located on a shared river, the generation was attributed solely to one country.
2.3.3. Proportion of Installed Hydropower Capacity in the National Energy Mix
The Renewable Energy Statistics database provided by IRENA [25] offers national installed capacities for various energy sources. Leveraging this dataset, we computed the proportion of hydropower installations () within the overall energy mix, ranging between 0 and 1. Figure 3 illustrates the result, with darker shades of green representing countries with a higher proportion of hydropower in their national energy mix.
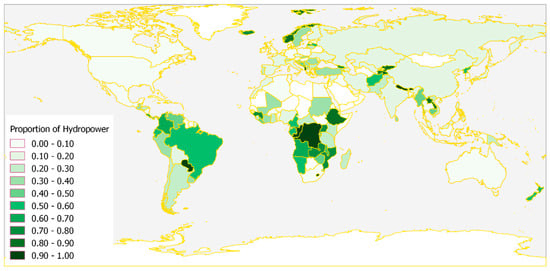
Figure 3.
Proportion of hydropower (Hydro_prop) relative to the total energy mix of each country from 2012 to 2021. These data were extracted from the IRENA Renewable Energy Statistics database [25].
2.3.4. Hydro_Mask
The hydropower mask (Hydro_Mask) was created by the combination of a land–sea mask (LSM) and information on hydropower plant locations. During the process, the original ERA5 LSM mask was regridded to match the horizontal resolution of the other model data used in this study (1 × 1° latitude/longitude). All raster cells lacking hydropower plants were masked and excluded from the analysis. The values within the LSM mask represented the proportion of land within each cell. Cells with values lower than 0.45 (i.e., representing less than 45% land) were also masked to eliminate cells significantly influenced by the ocean. The remaining cells were assigned a value of 1.
Consequently, the final raster files used in this study (including reanalysis data, projection models, and applied masks) adhered to the same grid parameters of 1 × 1° with the same geodetic system and encompassed the same global geographic extent.
2.4. Workflow
After calculating all indicators using the masked data, they were multiplied by the corresponding normalized installed capacity of hydropower () for each plant. Subsequently, the data were aggregated by country and multiplied by the proportion represented by hydropower () to obtain the final for each of the four climate indicators. As both and were normalized to values between 0 and 1, the final values of fell within the same range. However, for two main reasons, the results were rescaled to yield dimensionless indices with values between 0 and 100. (1) To ensure that the values for all indices were more comparable, given that the indicators had different ranges. (2) To address scenarios where some indicators had numerous small values (much less than 1) and/or exhibited a large peak in the original distribution, with scaling enhancing the spread. Several scaling methods were tested, including linear, logarithmic, and power transforms, with a simple linear scaling ultimately employed. This approach guarantees that the final results are comparable across different periods and between countries.
3. Results and Discussion
3.1. Showcasing the Results
To showcase the results, three countries were selected for comparison with the results of the study by Hamududu and Killingtveit [16], as shown in Figure 4.
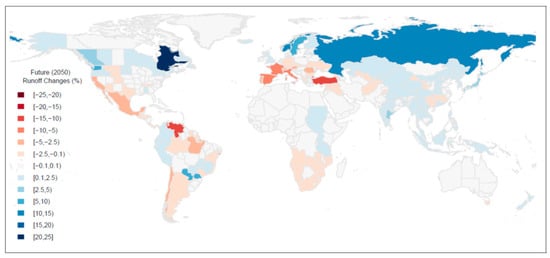
Figure 4.
Future (2050) runoff changes (%) based on 12 GCMs under scenario A1B (Ref. [16]). Red color indicates decreased runoff, and blue indicates increased runoff.
Their assessment of hydropower generation potential was conducted by correlating these anticipated runoff alterations with hydropower production capabilities, based on hydroelectric power generation data spanning 2005 to 2050. Specifically, Sweden, Iran, and Italy were chosen to represent countries experiencing high increases, minimal changes, and significant decreases in runoff by 2050, respectively.
For Sweden, the analysis revealed the following. The annual mean precipitation (Figure 5a) increased under all three scenarios; however, the precipitation variability (Figure 5b) was lower than in the historical period. In terms of the t index (Figure 5c), the values for two scenarios (except for ssp585) were lower than those of the historical period. To facilitate a comparison, the absolute value of was used. The risk of severely dry periods () decreased (Figure 5d), indicating that the anticipated increase in total precipitation would likely be associated with a reduction in prolonged periods without rain, rather than an increase in extremely wet months.
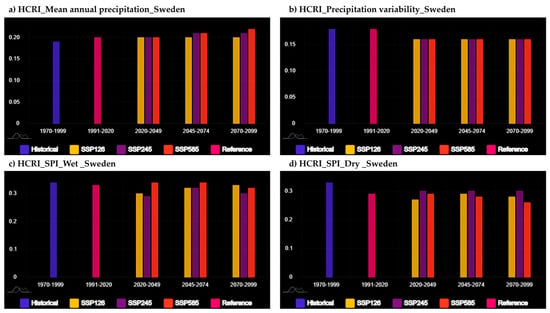
Figure 5.
HCRI results in Sweden from 1971–2100 for historical and climate projection data with climate scenarios ssp126, ssp245, and ssp585. (a) Mean annual precipitation, (b) precipitation variability, (c) SPI_Wet, (d) SPI_Dry. Detailed descriptions of the periods can be found in Figure 3.
For Iran, which exemplifies countries with minimal runoff changes by the end of the century, the analysis unfolds as follows. There was a slight decrease in the annual mean precipitation indicator (Figure 6a), but an increase in the precipitation variability indicator (Figure 6b). However, the wet and dry indicators (Figure 6c,d, respectively) provide a more nuanced perspective, indicating a decrease in the risk of severely wet periods and a certain increase in the risk of dry periods. The trend was not consistently clear across all three scenarios. The insights provided by the and enabled us to identify risks that were not evident in the projections reported by Hamududu and Killingtveit [16], which were solely based on river runoff.
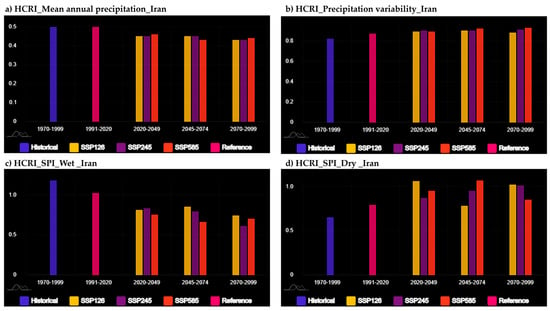
Figure 6.
results in Iran from 1971–2100 for historical and climate projection data with climate scenarios ssp126, ssp245, and ssp585. (a) Mean annual precipitation, (b) precipitation variability, (c) SPI_Wet, (d) SPI_Dry.
Our results for Italy (Figure 7) are consistent with the findings of Hamududu and Killingtveit [16]. Despite the slight decrease in the annual mean precipitation indicator, the information provided by both the wet and dry indicators (Figure 7c,d) showed an increased risk of prolonged severe dry periods and a reduced risk of severe wet periods across all three climate scenarios.
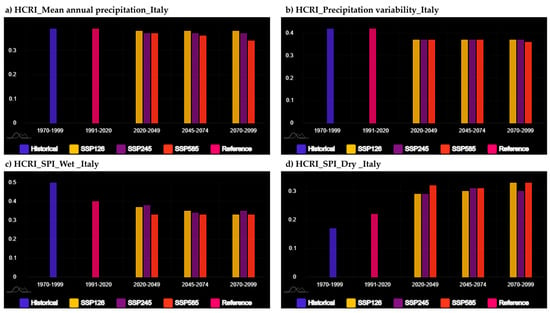
Figure 7.
HCRI results in Italy from 1971–2100 for historical and climate projection data with climate scenarios ssp126, ssp245, and ssp585. (a) Mean annual precipitation, (b) precipitation variability, (c) SPI_Wet, (d) SPI_Dry.
3.2. Graphic Display
The tool for calculating is accessible via the WMO Global Energy Resilience Atlas at https://energymeteorology.info/atlas/ (accessed on 11 April 2024). As shown in Figure 8, each will have its own menu entry. Clicking on the top-left icon will prompt a drop-down menu allowing the selection of one of the four s. Once a country is selected, the graph will be automatically displayed. The map utilizes color codes (a spectrum of blue color) to represent the mean values for the selected . Additionally, the graph displays a histogram with values for each 30-year period, including two historical periods and the three projected scenarios. The period of 1991–2020 serves as the reference, based on the WMO climatological normal.
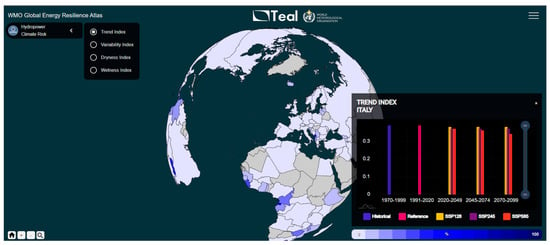
Figure 8.
Screenshot from the WMO Global Energy Resilience Atlas—Climate Risk Indices for Hydropower.
As a general observation, since the results were analyzed per country, a hydropower plant with high hazard values but a low contribution to the total installed capacity () would typically have a smaller impact on the country’s Hydro Climate Risk Index () compared with a plant with lower hazard values (Climate Hazard Indicator) but a larger installed capacity (). This is because the considers both the severity of potential hazards and the scale of their impact, meaning that plants with greater capacity carry more weight in determining the overall risk profile of a country’s energy infrastructure. To elaborate further, the following cases are presented as examples:
- No change in the annual precipitation indicator, but a high precipitation variability indicator could suggest the possibility of receiving the same amount of rain in a shorter period of time or experiencing prolonged dry periods followed by persistent rain;
- A reduction in the annual mean precipitation indicator, coupled with low precipitation variability and extreme wet and dry indicators, could indicate the likelihood of an established drought;
- A reduced annual mean precipitation indicator, combined with a high precipitation variability, extreme , and a larger compared with historical periods, may indicate predominantly dry conditions but with the potential for occasional.
4. Summary and Conclusions
The vulnerability of the hydropower sector to climate change underscores the necessity for comprehensive, long-term planning to enhance the security and resilience of the energy sector under a changing climate. Such planning requires an understanding of both historical and future impacts of climate change on hydropower generation at global, regional, and national levels. To provide a source of information on climate risk’s impacts on hydropower across the world, our study developed four hydro climate risk indices (HCRIs). These indices include a trend index calculated from the mean annual precipitation, a variability index representing precipitation variability, and wet and dry indices based on the standardized precipitation index. The indices were calculated for 125 counties based on monthly precipitation data extracted from both ERA5 reanalysis and CMIP6 climate projections for SSP126, SSP245, and SSP585 climate scenarios. The results provide insights into the historical and potential future climate risks faced by hydropower systems.
The accessibility of the results through the WMO Global Energy Resilience Atlas, accessible at https://energymeteorology.info/atlas/ (accessed on 11 April 2024), provides a useful tool for the sector. It offers policy- and decision-makers at national, regional, and global levels, as well as diverse stakeholders, invaluable insights into the impact of climate risks on hydropower sources. The tool offers a robust framework, addressing the second key question of the study, for countries around the world for assessing climate risks to implement effective measures for enhancing hydropower system resilience and mitigating the potential impacts of climate change. It also facilitates long-term planning for the energy mixes of countries by integrating risk assessments based on the most likely climate scenarios, thus accelerating a just energy transition toward sustainable energy sources.
5. Limitations and Recommendations
The following directions have been identified as limitations and recommendations for the maintenance and further development of the current version of the tool (V1.0).
- Database updates; The HCRI global map database requires constant updating to reflect changes in hydropower infrastructure and energy mix compositions. Periodic reviews of new publications reporting updated regional or global databases of hydropower plants are necessary. This review should encompass both large-scale installations and smaller ones, particularly in non-European countries. Additionally, it is important to keep track of the plants reported in the Atlas of Hydropower in Africa, that are being constructed and include them in calculations as soon as they become functional. Also, as the is calculated based on the proportion of hydropower in the national energy mix, an updated database with the energy mix of each country will enhance the accuracy of the results. Finally, new climate projection scenarios may be generated or upgraded as the information on greenhouse emissions is updated, our knowledge of climate dynamics improves, or achievements in data processing occur. It is imperative to reflect these updates in the calculation of .
- Using watersheds instead of countries for data aggregation; Ideally, the data should be aggregated by watershed or basin to be more adequate for precipitation calculations. This is particularly important for large countries that span several degrees of latitude with numerous watersheds or sharing watersheds with others. Furthermore, organizing data by watershed aligns better with water management practices and avoids issues of aggregation that may occur at the country level.
- Utilizing models with higher skills; Utilizing models with higher predictive accuracy and leveraging each model’s performance based on its ability to simulate past climates should be considered in future work. Additionally, incorporating new models with enhanced skills as they become available is necessary to improve the accuracy and reliability of results.
- Advancing methodology for comprehensive climate assessment; Future development phases could entail the creation of a more sophisticated model that includes other variables, such as temperature, evaporation, snow, and glacier melting for a comprehensive and geographically inclusive climate assessment. This is particularly important in northern latitudes, where water in ice form significantly contributes to hydrological dynamics. Temperature and evaporation, which influence river runoff, should also be included to ensure a comprehensive assessment.
- Snow and Glacier Dynamics; Building on the previous point, it is important to distinguish between different types of precipitation, such as snow and rain, and evaluate their impact on water availability and hydropower generation in order to enhance climate assessment methodologies. Furthermore, the spatial and temporal changes in snow and glacier coverage, particularly in major mountain ranges worldwide, need to be explored to better understand the evolving dynamics of water resources. For instance, recent data indicate a concerning trend, such as about 10% of Swiss glaciers melting in the past two years, underscoring the critical implications for hydropower generation [30].
Author Contributions
Conceptualization, A.T. and R.B.; Methodology development and implementation of the model, A.T., B.C and P.B.; Technical evaluation: H.B. and R.B.; Drafting the article, reviewing, and editing: R.W., H.B., R.B. and B.C. All authors have read and agreed to the published version of the manuscript.
Funding
This article has been published with the financial and technical support of the World Meteorological Organization (WMO). The opinions, findings, interpretations, and conclusions expressed in this article are those of the authors and do not purport to reflect the opinions of the WMO or its Members.
Data Availability Statement
Data sources are mentioned within the article.
Conflicts of Interest
The authors declare no conflicts of interest.
References
- WMO. 2022 State of Climate Services: Energy (WMO-No. 1301). 2022. Available online: https://library.wmo.int/idurl/4/58116 (accessed on 3 April 2024).
- IEA. Tracking Clean Energy Progress 2023; IEA: Paris, France, 2023; Available online: https://www.iea.org/reports/tracking-clean-energy-progress-2023 (accessed on 3 April 2024).
- WMO. Integrated Weather & Climate Services in Support of Net Zero Energy Transition (WMO-No.1312). 2023. Available online: https://library.wmo.int/idurl/4/66273 (accessed on 3 April 2024).
- Wasti, A.; Ray, P.; Wi, S.; Folch, C.; Ubiern, M.; Karki, P. Climate change and the hydropower sector: A global review. WIREs Clim. Chang. 2022, 13, e757. [Google Scholar] [CrossRef]
- Berga, L. The Role of Hydropower in Climate Change Mitigation and Adaptation: A Review. J. Eng. 2016, 2, 313–318. [Google Scholar] [CrossRef]
- Cuartas, L.A.; Cunha, A.P.M.d.A.; Alves, J.A.; Parra, L.M.P.; Deusdará-Leal, K.; Costa, L.C.O.; Molina, R.D.; Amore, D.; Broedel, E.; Seluchi, M.E.; et al. Recent Hydrological Droughts in Brazil and Their Impact on Hydropower Generation. Water 2022, 14, 601. [Google Scholar] [CrossRef]
- Wagner, T.; Themeßl, M.; Schüppel, A.; Gobiet, A.; Stigler, H.; Birk, S. Impacts of climate change on stream flow and hydro power generation in the Alpine region. Environ. Earth Sci. 2017, 76, 4. [Google Scholar] [CrossRef]
- Chilkoti, V.; Bolisetti, T.; Balachandar, R. Climate change impact assessment on hydropower generation using mul-ti-model climate ensemble. Renew. Energy 2017, 109, 510–517. [Google Scholar] [CrossRef]
- Shu, J.; Qu, J.J.; Motha, R.; Xu, J.C.; Dong, D.F. Impacts of climate change on hydropower development and sustainability: A review. IOP Conf. Ser. Earth Environ. Sci. 2018, 163, 012126. [Google Scholar] [CrossRef]
- Opperman, J.J.; Camargo, R.R.; Laporte-Bisquit, A.; Zarfl, C.; Morgan, A.J. Using the WWF Water Risk Filter to Screen Existing and Projected Hydropower Projects for Climate and Biodiversity Risks. Water 2022, 14, 721. [Google Scholar] [CrossRef]
- Zhou, T.; Kao, S.C.; Xu, W.; Gangrade, D.; Voisin, N. Impacts of climate change on subannual hydropower generation: A multi-model assessment of the United States federal hydropower plant. Environ. Res. Lett. 2023, 18, 034009. [Google Scholar] [CrossRef]
- Naranjo-Silva, S.; Punina-Guerrero, D.; Rivera-Gonzalez, L.; Escobar-Segovia, K.; Barros-Enriquez, J.D.; Almeida-Dominguez, J.A.; Alvarez del Castillo, J. Hydropower Scenarios in the Face of Climate Change in Ecuador. Sustainability 2023, 15, 10160. [Google Scholar] [CrossRef]
- Khazaei, M.R.; Heidari, M.; Shahid, S.; Hasirchian, M. Consideration of climate change impacts on a hydropower scheme in Iran. Theor. Appl. Climatol. 2024, 155, 3119–3132. [Google Scholar] [CrossRef]
- Wang, H.; Xiao, W.; Wang, Y.; Zhao, Y.; Lu, F.; Yang, M.; Hou, B.; Yang, H. Assessment of the impact of climate change on hydropower potential in the Nanliujiang River basin of China. Energy 2019, 167, 950–959. [Google Scholar] [CrossRef]
- da Silva, B.C.; Virgílio, R.M.; Nogueira, L.A.H.; Silva, P.d.N.; Passos, F.O.; Welerson, C.C. Assessment of Climate Change Impact on Hydropower Generation: A Case Study for Três Marias Power Plant in Brazil. Climate 2023, 11, 201. [Google Scholar] [CrossRef]
- Fleischmann, A.; Fan, F.; Collischonn, B.; Collischonn, W.; Pontes, P.; Ruhoff, A. Precipitation as a proxy for climate variables: Application for hydrological modelling. Hydrol. Sci. J. 2019, 64, 361–379. [Google Scholar] [CrossRef]
- IEA. Climate Resilience Policy Indicator, Paris. 2022. Available online: https://www.iea.org/reports/climate-resilience-policy-indicator (accessed on 3 April 2024).
- Cardona, O.D.; van Aalst, M.K.; Birkmann, J.; Fordham, M.; McGregor, G.; Perez, R.; Pulwarty, R.S.; Schipper, E.L.F.; Sinh, B.T. Determinants of risk: Exposure and vulnerability. In Managing the Risks of Extreme Events and Disasters to Advance Climate Change Adaptation; Field, C.B., Barros, V., Stocker, T.F., Qin, D., Dokken, D.J., Ebi, K.L., Mastrandrea, M.D., Mach, K.J., Plattner, G.-K., Allen, S.K., et al., Eds.; A Special Report of Working Groups I and II of the Inter-governmental Panel on Climate Change (IPCC); Cambridge University Press: Cambridge, UK, 2012; pp. 65–108. [Google Scholar]
- UNDRR. Sendai framework for disaster risk reduction 2015–2030. In Proceedings of the UN World Conference on Disaster Risk Reduction, Sendai, Japan, 14–18 March 2015; United Nations Office for Disaster Risk Reduction: Geneva, Switzerland, 2015. [Google Scholar]
- McKee, T.B.; Doesken, N.J.; Kleist, J. The Relationship of Drought Frequency and Duration to Time Scales. In Proceedings of the 8th Conference on Applied Climatology, Anaheim, CA, USA, 17–22 January 1993; pp. 179–184. [Google Scholar]
- WMO. Standardized Precipitation Index User Guide (M. Svoboda, M. Hayes and D. Wood). (WMO-No. 1090). 2012. Available online: https://library.wmo.int/idurl/4/39629 (accessed on 3 April 2024).
- Olanrewaju, C.C.; Reddy, M. Assessment and prediction of flood hazards using standardized precipitation index—A case study of eThekwini metropolitan area. J. Flood Risk Manag. 2022, 15, e12788. [Google Scholar] [CrossRef]
- Global Energy Observatory, Google, KTH Royal Institute of Technology in Stockholm, Enipedia, World Resources Institute. 2018. Global Power Plant Database. Published on Resource Watch and Google Earth Engine. Available online: https://earthengine.google.com/ (accessed on 3 April 2024).
- Sterl, S.; Devillers, A.; Chawanda, C.J.; van Griensven, A.; Thiery, W.; Russo, D. A spatiotemporal atlas of hydropower in Africa for energy modelling purposes. Open Res. Eur. 2022, 1, 29. [Google Scholar] [CrossRef]
- IRENA. Renewable Energy Statistics 2022; International Renewable Energy Agency: Abu Dhabi, United Arab Emirates, 2022. [Google Scholar]
- Yoshikane, T.; Yoshimura, K. A downscaling and bias correction method for climate model ensemble simulations of local-scale hourly precipitation. Sci. Rep. 2023, 13, 9412. [Google Scholar] [CrossRef] [PubMed]
- Riahi, K.; Van Vuuren, D.; Kriegler, E.; Edmonds, J.A.; O’Neill, B.; Fujimori, S.; Bauer, N.; Calvin, K.; Dellink, R.; Fricko, O.; et al. The Shared Socioeconomic Pathways and their energy, land use, and greenhouse gas emissions implications: An overview. Glob. Environ. Chang. 2017, 42, 153–168. [Google Scholar] [CrossRef]
- WMO. WMO Guidelines on the Calculation of Climate Normals. (WMO-No. 1203). 2017. Available online: https://library.wmo.int/idurl/4/55797 (accessed on 3 April 2024).
- WMO. The Role of Climatological Normals in a Changing Climate. (WMO/TD-No. 1377). 2007. Available online: https://library.wmo.int/idurl/4/52499 (accessed on 3 April 2024).
- WMO. State of the Global Climate 2023 (WMO-No. 1347). 2024. Available online: https://library.wmo.int/idurl/4/68835 (accessed on 3 April 2024).
Disclaimer/Publisher’s Note: The statements, opinions and data contained in all publications are solely those of the individual author(s) and contributor(s) and not of MDPI and/or the editor(s). MDPI and/or the editor(s) disclaim responsibility for any injury to people or property resulting from any ideas, methods, instructions or products referred to in the content. |
© 2024 by the authors. Licensee MDPI, Basel, Switzerland. This article is an open access article distributed under the terms and conditions of the Creative Commons Attribution (CC BY) license (https://creativecommons.org/licenses/by/4.0/).