Article

Energy Efficiency of Lignocellulosic Biomass Pyrolysis in Two Types of Reactors: Electrical and with Primary Forest Biomass Fuel

by
Juan-Carlos Cobos-Torres
1,2,*,
Juan Izquierdo
1 and
Manuel Alvarez-Vera
1,2
1
Unidad Académica de Posgrado, Universidad Católica de Cuenca, Cuenca 010101, Ecuador
2
Unidad Académica de Ingeniería Industria y Construcción, Universidad Católica de Cuenca, Cuenca 010101, Ecuador
*
Author to whom correspondence should be addressed.
Energies 2024, 17(12), 2943; https://doi.org/10.3390/en17122943
Submission received: 25 March 2024 / Revised: 31 May 2024 / Accepted: 10 June 2024 / Published: 14 June 2024

Abstract

:
In this industrialized world, in which the daily consumption of fossil fuels occurs, companies seek to prioritize energy generation through renewable energy sources with minimal environmental impact to improve their energy efficiency. The research objective was to calculate CO2 emissions for the pyrolysis process (conventional low-temperature pyrolysis) in two types of reactors, electric and traditional, where solar panels power the electric reactor. In addition, the amount of polluting gases and the energy consumption necessary to convert biomass into biochar were compared. Residual lignocellulosic biomass (RLB) from various species present in the southern region of Ecuador (eucalyptus, capuli, and acacia) was used, with three replicates per reactor. The electrical reactor (ER) consumed 82.60% less energy than the primary forest biomass fuel “traditional reactor (TR)” and distributed heat better in each pyrolytic process. The TR generated more pollution than the ER; it generated 40.48% more CO, 50% more NO2, 66.67% more SO2, and 79.63% more CH4. Undoubtedly, the pyrolysis process in an ER reduces environmental pollution and creates new bioproducts that could replace fossil fuels. This study provides relevant information on the residual biomass pyrolysis of plant species. These species are traditionally grown in the southern Ecuadorian region. In addition, an analysis of polluting gases for the TR and ER is presented.

1. Introduction

Population growth demands new environmentally friendly energy sources to meet the population’s needs and reduce pressure on natural resources and the emissions of pollutants into the atmosphere. Residual biomass is a viable option for energy recovery. It is an alternative that can replace fossil fuels, as it can be transformed into biofuels and other bioproducts through thermochemical processes [1,2]. In the last decade, biomass thermal conversion methods such as pyrolysis have proven to be feasible energy conversion processes and produce a low carbon footprint [3]. Pyrolysis is a process that decomposes biomass in the absence of oxygen, resulting in more environmentally friendly fuels compared to fossil fuels [4,5]. It is considered a technology capable of providing renewable energy, making it possible to obtain biochar of high organic content with a high nutrient retention capacity for soil improvement [6,7].
The quality of biochar depends on the type of feedstock, as well as on the pyrolysis conditions [8,9]. Several previous studies detail different methods for producing biochar and its multiple applications, such as improving physical properties like the soil porosity, consequent water infiltration, and texture; therefore, it is an effective soil conditioner in the agricultural field [8,10]. However, not enough is known about its emissions of atmospheric pollutants, considering that the pyrolysis process generates adverse emissions that enter the atmosphere; it can release pollutants such as methane and nitrous and sulfur oxides [11,12], producing dire consequences for the planet, deteriorating human health, and increasing the risk of chronic respiratory diseases [13]. Nevertheless, new renewable energy generation methods, such as distributed photovoltaic or wind electrical generation for powering reactors with electrical resistance, generate more environmentally friendly biochar production, in contrast to pollution by burning biomass as fuel.
Biomass can be used to produce various bioproducts, such as biofuel, bioplastics, and biochar [14]. The treatment of residual biomass by pyrolysis is carried out at different temperatures depending on the feedstock, and the release of pollutants also varies. Therefore, secure energy at an affordable price is required for sustainable development, with reduced environmental impacts and low greenhouse gas emissions [15]. Renewable energy is an alternative to fossil fuel energy supplies [16]. The main problem is the time required to achieve the degradation of residual lignocellulosic biomass (RLB) feedstock [17]. RLB is the most abundant raw material present on the Earth’s surface that can be used for the production of biofuels. It is a natural resource.
Additionally, it can be converted into a condensable liquid called bio-oil, a solid product called char, and a mixture of gaseous products comprising CO2, CO, H2, and CH₄ [18]. These RLB species can be pyrolyzed more efficiently using renewable energy sources, such as photovoltaic energy.
The residues generated from natural vegetation-cutting activities can be exploited by causing the thermochemical degradation of the plant material through the pyrolysis process. In addition, renewable energies are the key to reducing carbon dioxide emissions over time, thereby reducing the carbon footprint [19]. However, it is known that uncontrolled biomass burning generates significant CO2 emissions that enter the atmosphere, contributing to increasing the carbon concentration in the environment [20]. Therefore, pyrolysis is presented as a promising technology to transform biomass into renewable energy [21]. Electrical reactors powered by solar panels contribute to CO2 reduction [22], transforming waste into bioenergy [23] and converting wood and agricultural waste into biochar, positively impacting climate change mitigation.
The transition to new techniques and their use is fundamental to changing the energy vector [24]. Specifically, this research aims to quantify energy consumption and pollutant gases caused by the pyrolysis of three RLBs, using two sources: residual biomass and electrical energy from solar panels. Lower energy consumption [24] and a significant decrease in greenhouse gas emissions [25] are expected during the conversion of RLB from eucalyptus, capuli, and acacia waste into biomass using an electrical reactor (ER) compared to a traditional reactor (TR). In addition, native species are expected to perform better than eucalyptus in the pyrolysis process, as described with native Brazilian species [26]. Finally, better energy efficiency is expected in the ER, and for the same reason, so is a substantial decrease in the carbon footprint [27,28].

2. Materials and Methods

The pyrolysis process of different RLBs was carried out with three replicates per reactor. Energy consumption (photovoltaic ER vs. biomass energy TR) and pollutant gases (air quality station) were measured in each treatment. The research was divided into two parts: (I) the determination of the energy consumption with an ER and a TR; and (II) the measurement of pollutants during the pyrolysis process with three types of RLBs and reactors (Figure 1). The pyrolysis processes were carried out at the postgraduate campus of Universidad Católica de Cuenca. Days with an average temperature of 21 degrees Celsius and a relative humidity of approximately 70% were chosen.

2.1. Energy Consumption

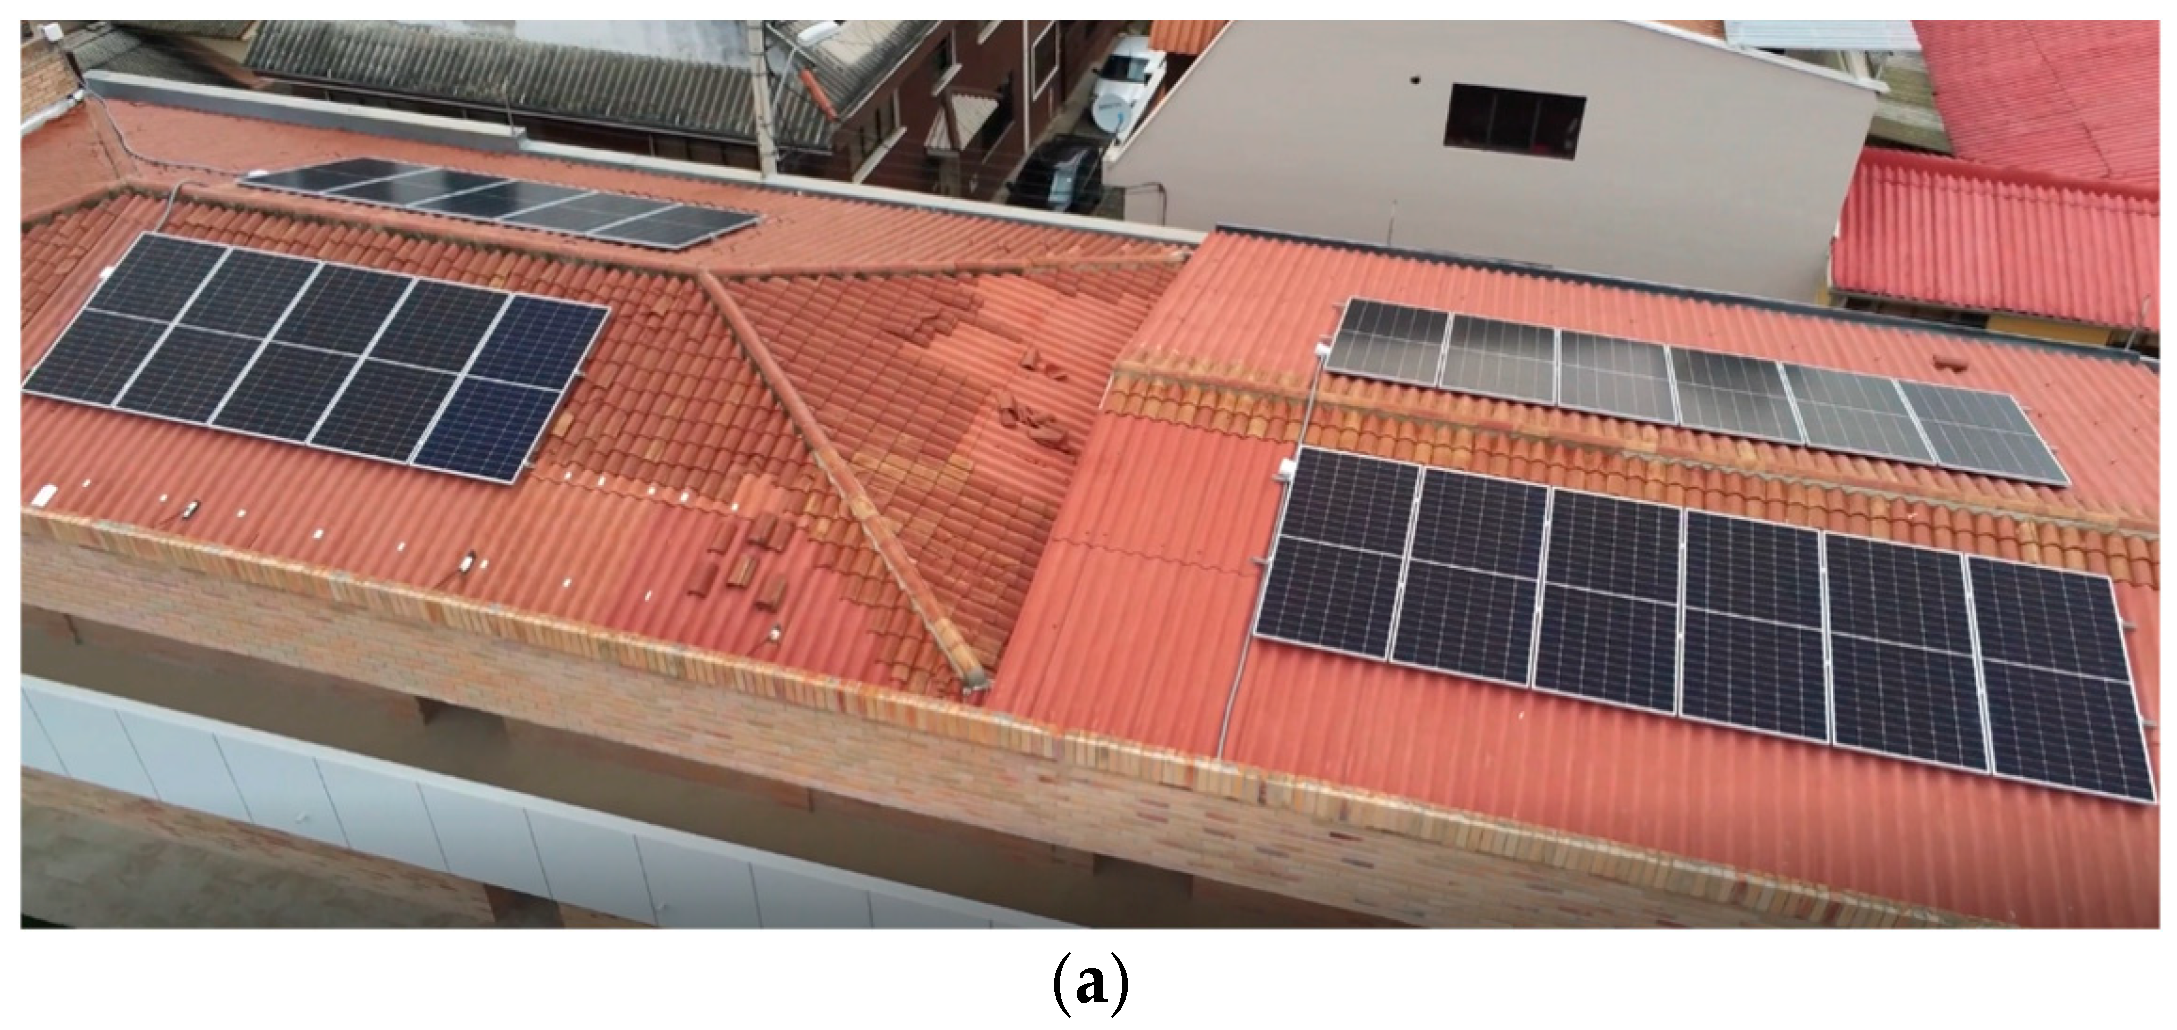
A FLUKE model 434 power quality meter was used to determine the energy consumption of the ER. The ER is built with an internal biomass chamber and three 1800 W electrical resistances, powered by a photovoltaic system of 44 solar panels (approximately 22 kVA) and an electrical control system consisting of a smart relay, pyrometer, thermocouple, electrical contactor, and pilot light (Figure 2a,b) [29]. The energy consumption of the TR was determined by the calorific value of the biomass [30] used as fuel and its weight, thus estimating the energy it produces. A thermographic camera was used to monitor the temperatures reached. The TR consists of an external chamber for storing biomass as fuel, a chimney for exhausting pollutant gases, and an internal compartment for storing biomass to be converted into biochar (Figure 2c). The pyrolysis process energy in the RE was measured with its capacity to contain residual biomass (approximately 7-L).

2.2. Pyrolysis Process

The oven was preheated for 10 min until it reached a temperature of 330 °C. The pyrolysis process lasted 4 h at a temperature of 330 °C; meanwhile, the power quality analyzer equipment was connected to the reactor feed, collecting the consumption data. The energy consumed per caloric content per unit mass was measured to determine the energy consumption in the TR; these data were obtained from the weight of the biomass used for a process that lasts approximately the same time as that of the ER (4 h, average temperature 330 °C; see Figure 3). The energy consumption calculation of the TR was obtained considering the transformation of the RLB subjected to decomposition methods due to its calorific value, with a potential of 4500 kcal/kg [30]. The TR chamber capacity was four times higher than that of the ER, an aspect considered when analyzing the results obtained. This can be seen in Table 1.

2.3. Pollutant Measurement

An air quality station measured the pollutants emitted during the pyrolysis process; it measured several pollutant gases. The air quality station is composed of the following electrochemical sensors: an MQ-7 sensor for measuring carbon monoxide (CO), an MQ-135 sensor for CO2 and NO2, an MQ-4 sensor for methane (CH4), and an MQ-136 sensor for SO2. The concentrations of the gases in parts per million (ppm) were measured. Sampling was performed every 26.96 ± 4.14 s. Data collection and storage were carried out through the ThingSpeak IoT platform [31].

2.4. Treatment Combination

The emissions from the three types of RLB were determined. Combinations were made of the treatments in the ER: biomass to biochar (B1: eucalyptus, B2: capuli, and B3: acacias). In addition, in the TR, residual biomass was used as fuel, using the RLB weights specified in Table 1. The mentioned species-pruning biomass (trunks and branches) was obtained from the Miracielos Campus (Centro de Investigación, Innovación y Transferencia de Tecnología CIITT) of the Universidad Católica de Cuenca in the city of Cuenca in the province of Azuay, Ecuador. This raw material was dried in the sun for approximately three months, and then the biomass was cut into pieces approximately 4 cm long and with a diameter of no more than 5 cm to facilitate its disposal inside the ovens.

2.5. Experiment Setup

For the ER, pyrolysis processes were carried out with the collected biomasses B1, B2, and B3. The air quality station was located at a distance of 3 m, based on the time and space scales for different atmospheric heights (see Figure 3). For this reason, the sensors are located as close as possible to the source, to eliminate contamination from other sources and obtain accurate results. It collected the concentrations of CH₄, CO, CO2, NO2, and SO2, plus the temperature and humidity.
Similarly, the combinations were performed with the TR, following the same process with each of the collected biomasses B1, B2, and B3. This reactor had a round chimney for venting gases, so the station was located at a distance of 3 m (see Figure 3).
Figure 3. Detail of the location of the reactors (left ER or right TR) with respect to the air quality station.
Energies 17 02943 g003

2.6. Quantification of the CO2 Emissions

Based on the energy consumption data obtained, the quantification of the CO2 emissions per the pyrolysis process of each reactor was performed. For this purpose, the emission factor of 0.0002449 Tn CO2 obtained from the report of [32] was used. With this, the issue value per pyrolysis process, represented in Equation (1), was calculated:
T o t a l C O 2 = C O 2 e m i s s i o n f a c t o r 1 k W h × k W h e n e r g y c o n s u p t i o n .

2.7. Data Analysis

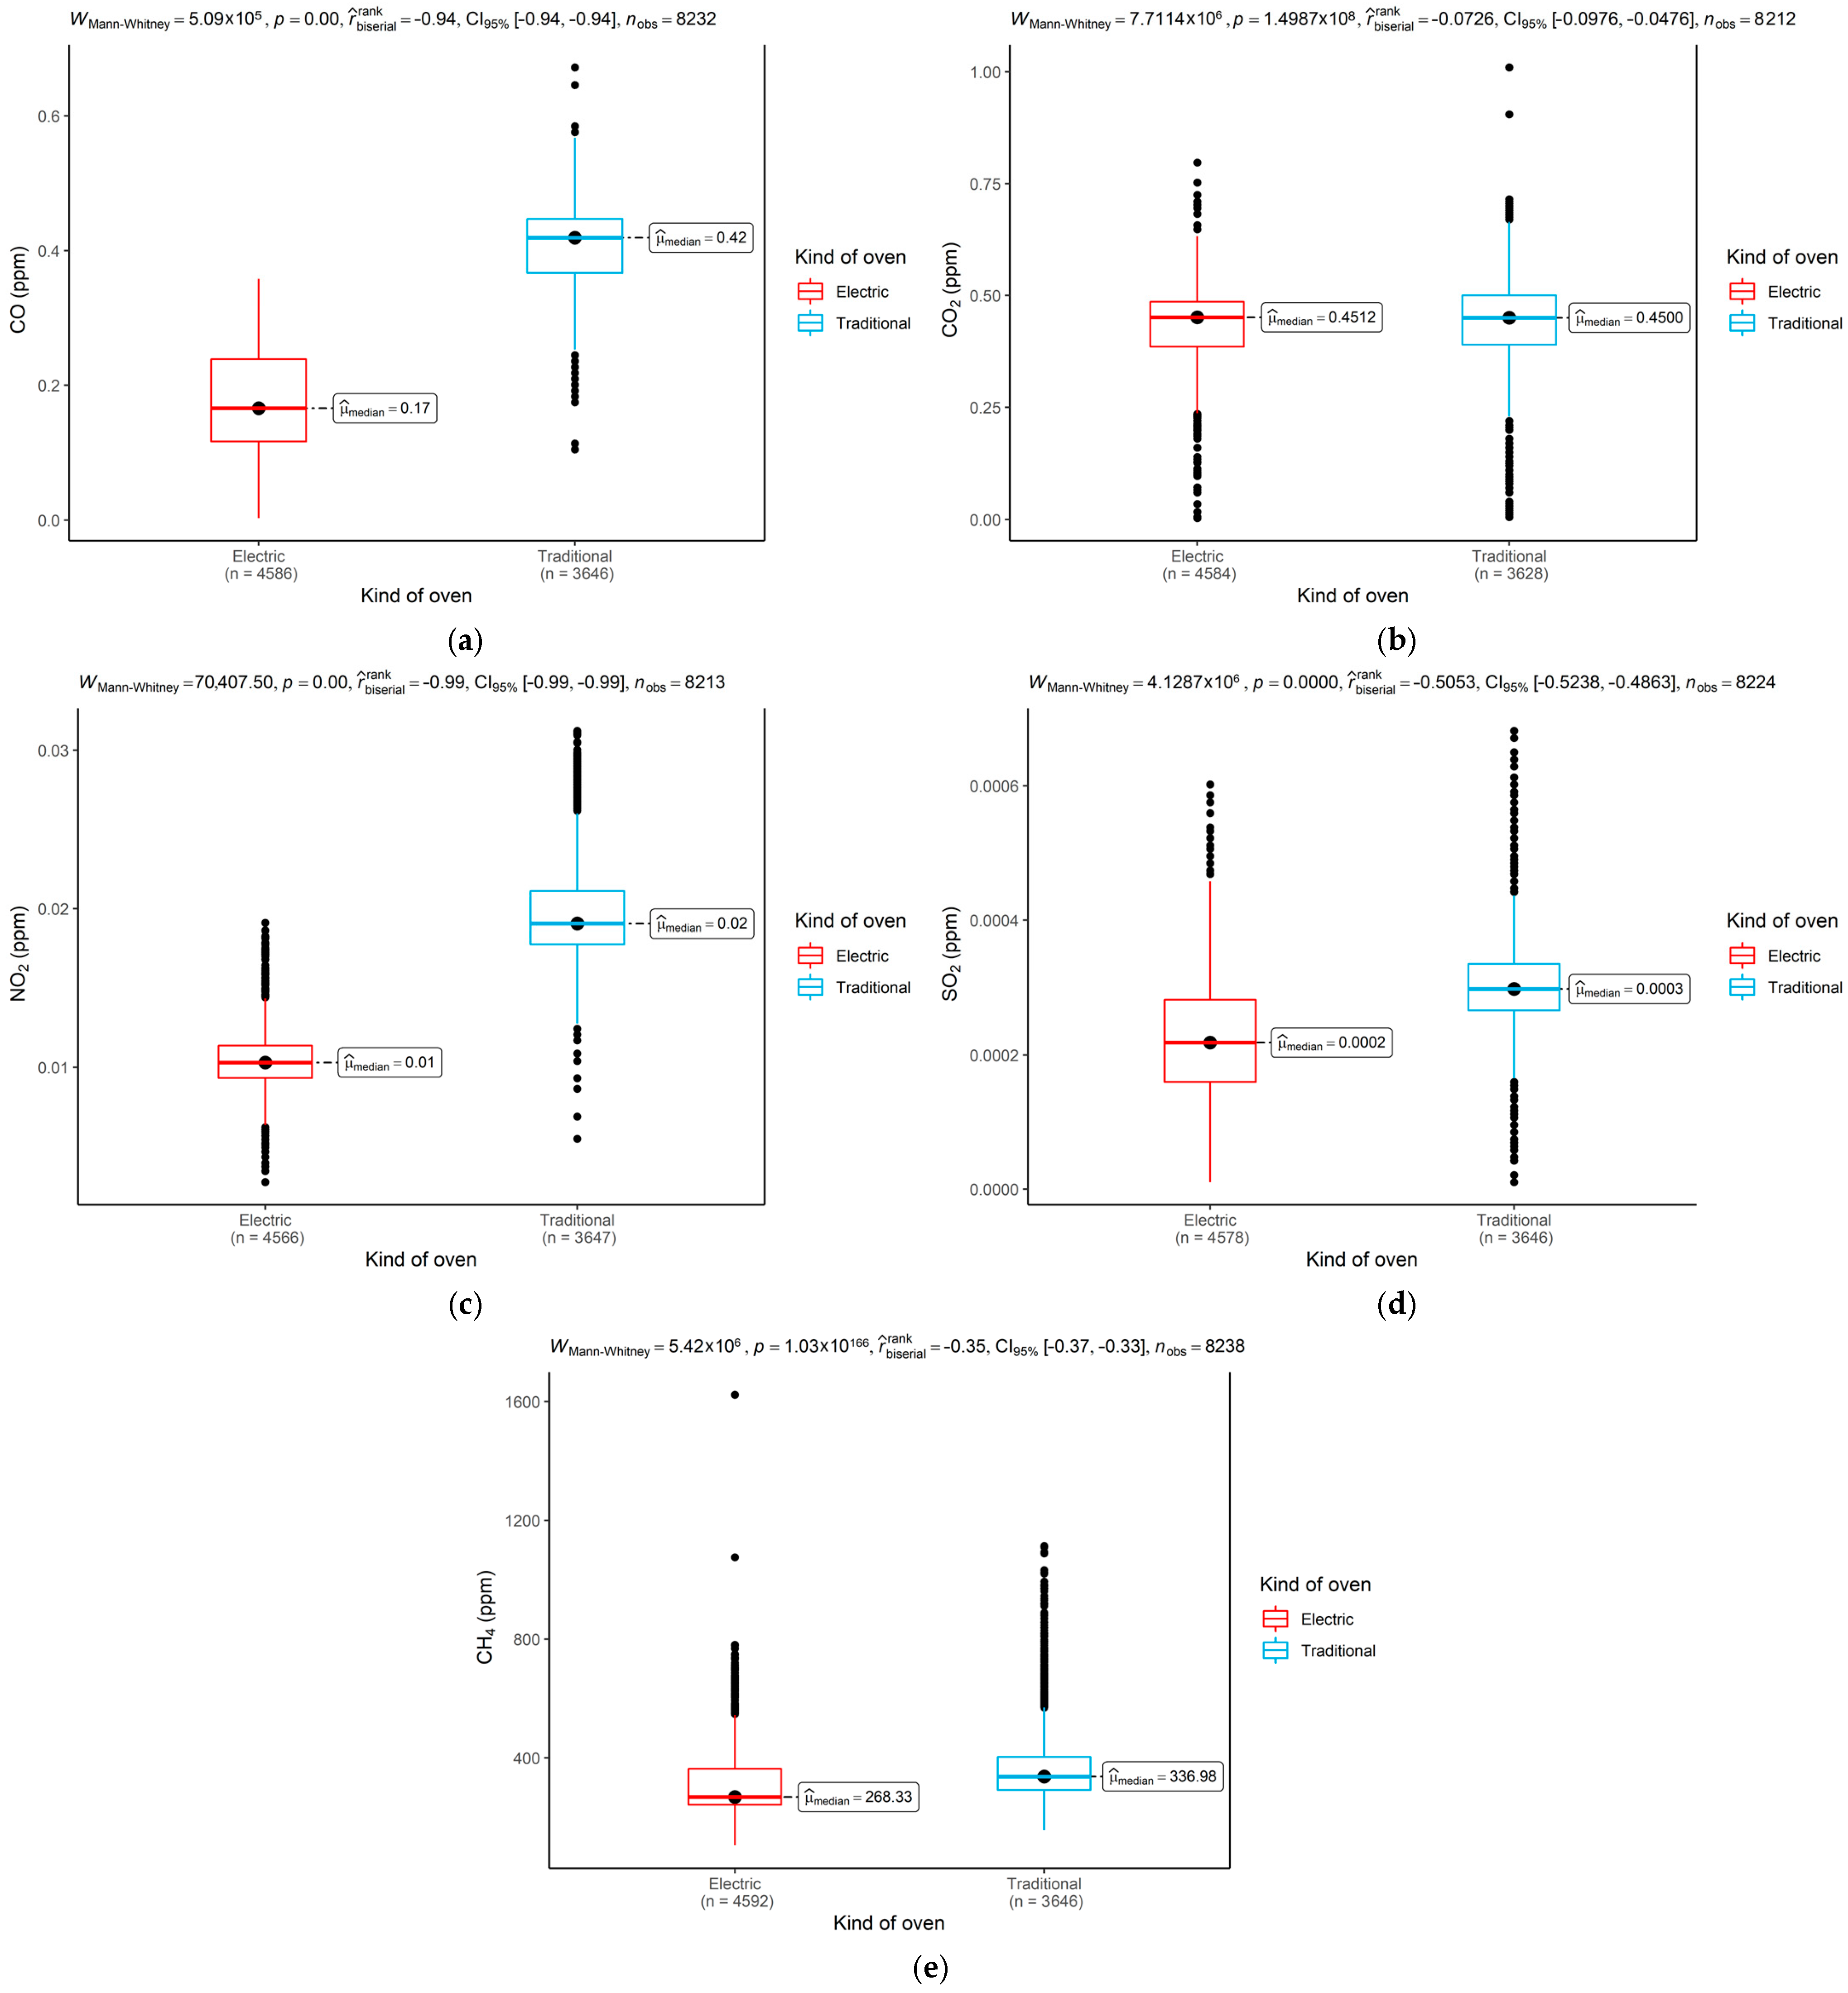
Nonparametric comparison tests (two-tailed Mann–Whitney U-tests) were performed at 95% confidence to identify whether there were significant differences between the reactor-type averages for each pollutant evaluated. The effect size of the comparisons is also reported using the biserial rank correlation value (defined in the graphs) and its 95% confidence interval. The pairwise comparison of the reactor types for each pollutant evaluated showed significant differences between the ER and TR for all assessed physicochemical variables.

3. Results

3.1. ER and TR Energy Consumption

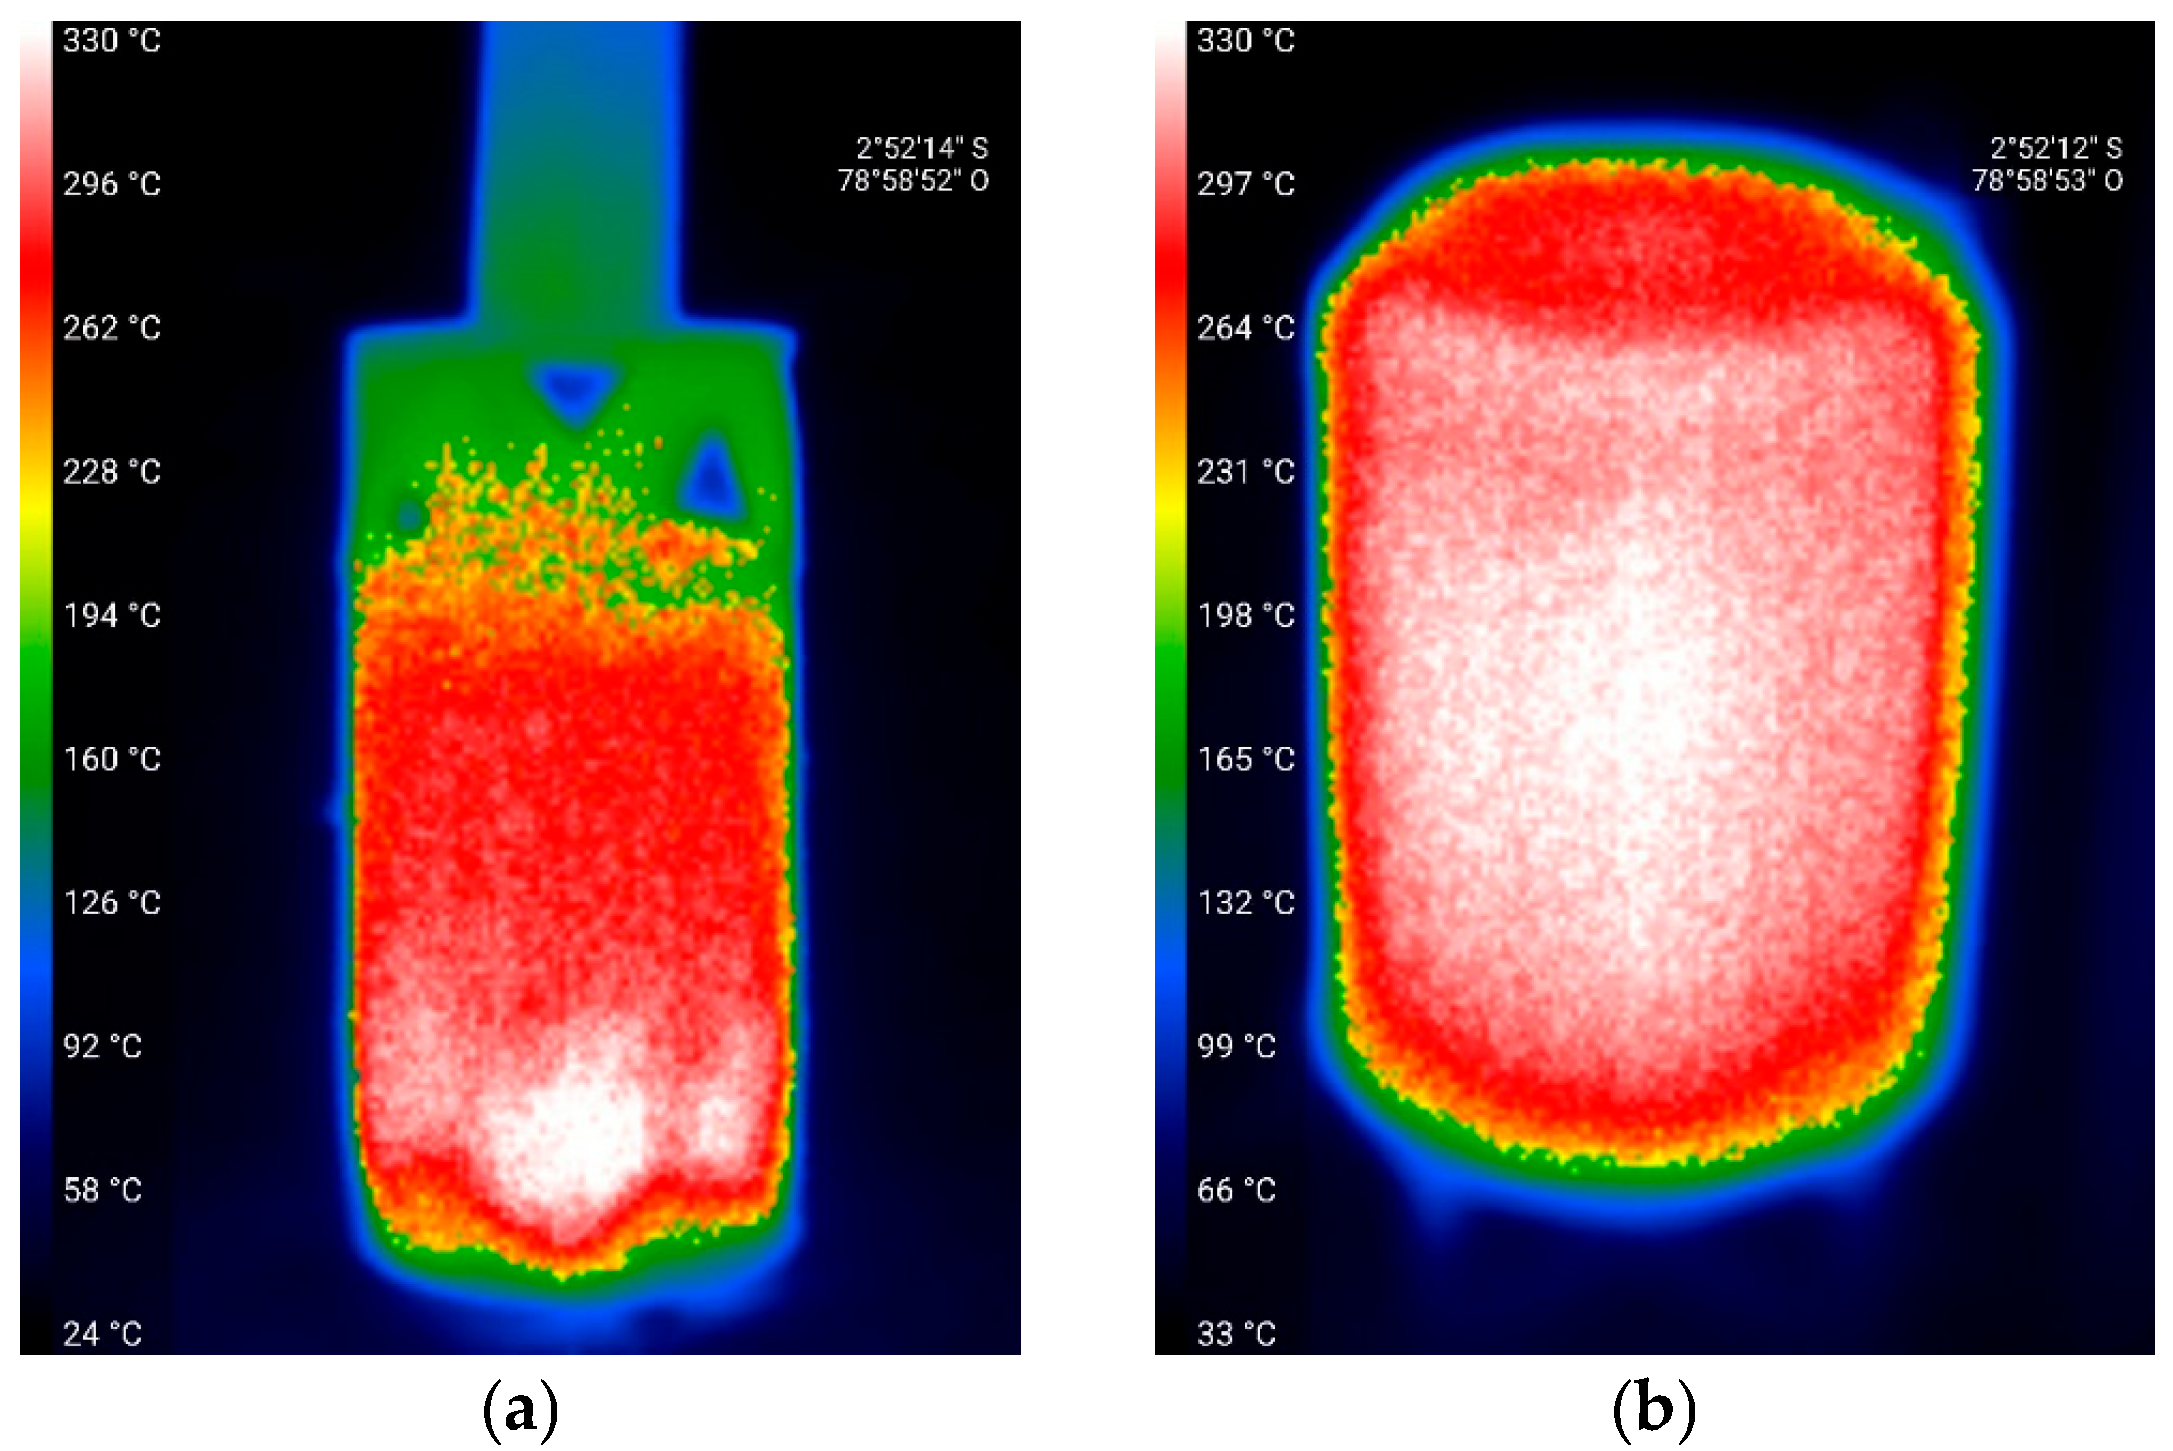
We recorded a more uniform temperature distribution in the ER. At the same time, in the TR, the upper part of the reactor presented a lower temperature because the combustion of the residual biomass takes place at the base of the reactor (Figure 4).
The energy consumption for each pyrolytic process was obtained with the ER, resulting in a total consumption of 9.1 kWh; each of the treatments was carried out over 4 h, so the total energy used was 36.4 kWh (approximate price of $0.08 american dollars per kWh) [31]. In the pyrolysis process, 20 kg of primary forest biomass fuel was used for every 2 h of combustion burning (an approximately 4 kg bundle of eucalyptus is priced at $5 american dollars), obtaining 90,000 kcal; with 1 kcal = 0.0012 kWh, a consumption of 104.6 kWh is calculated.

3.2. Concentration of Pollutants

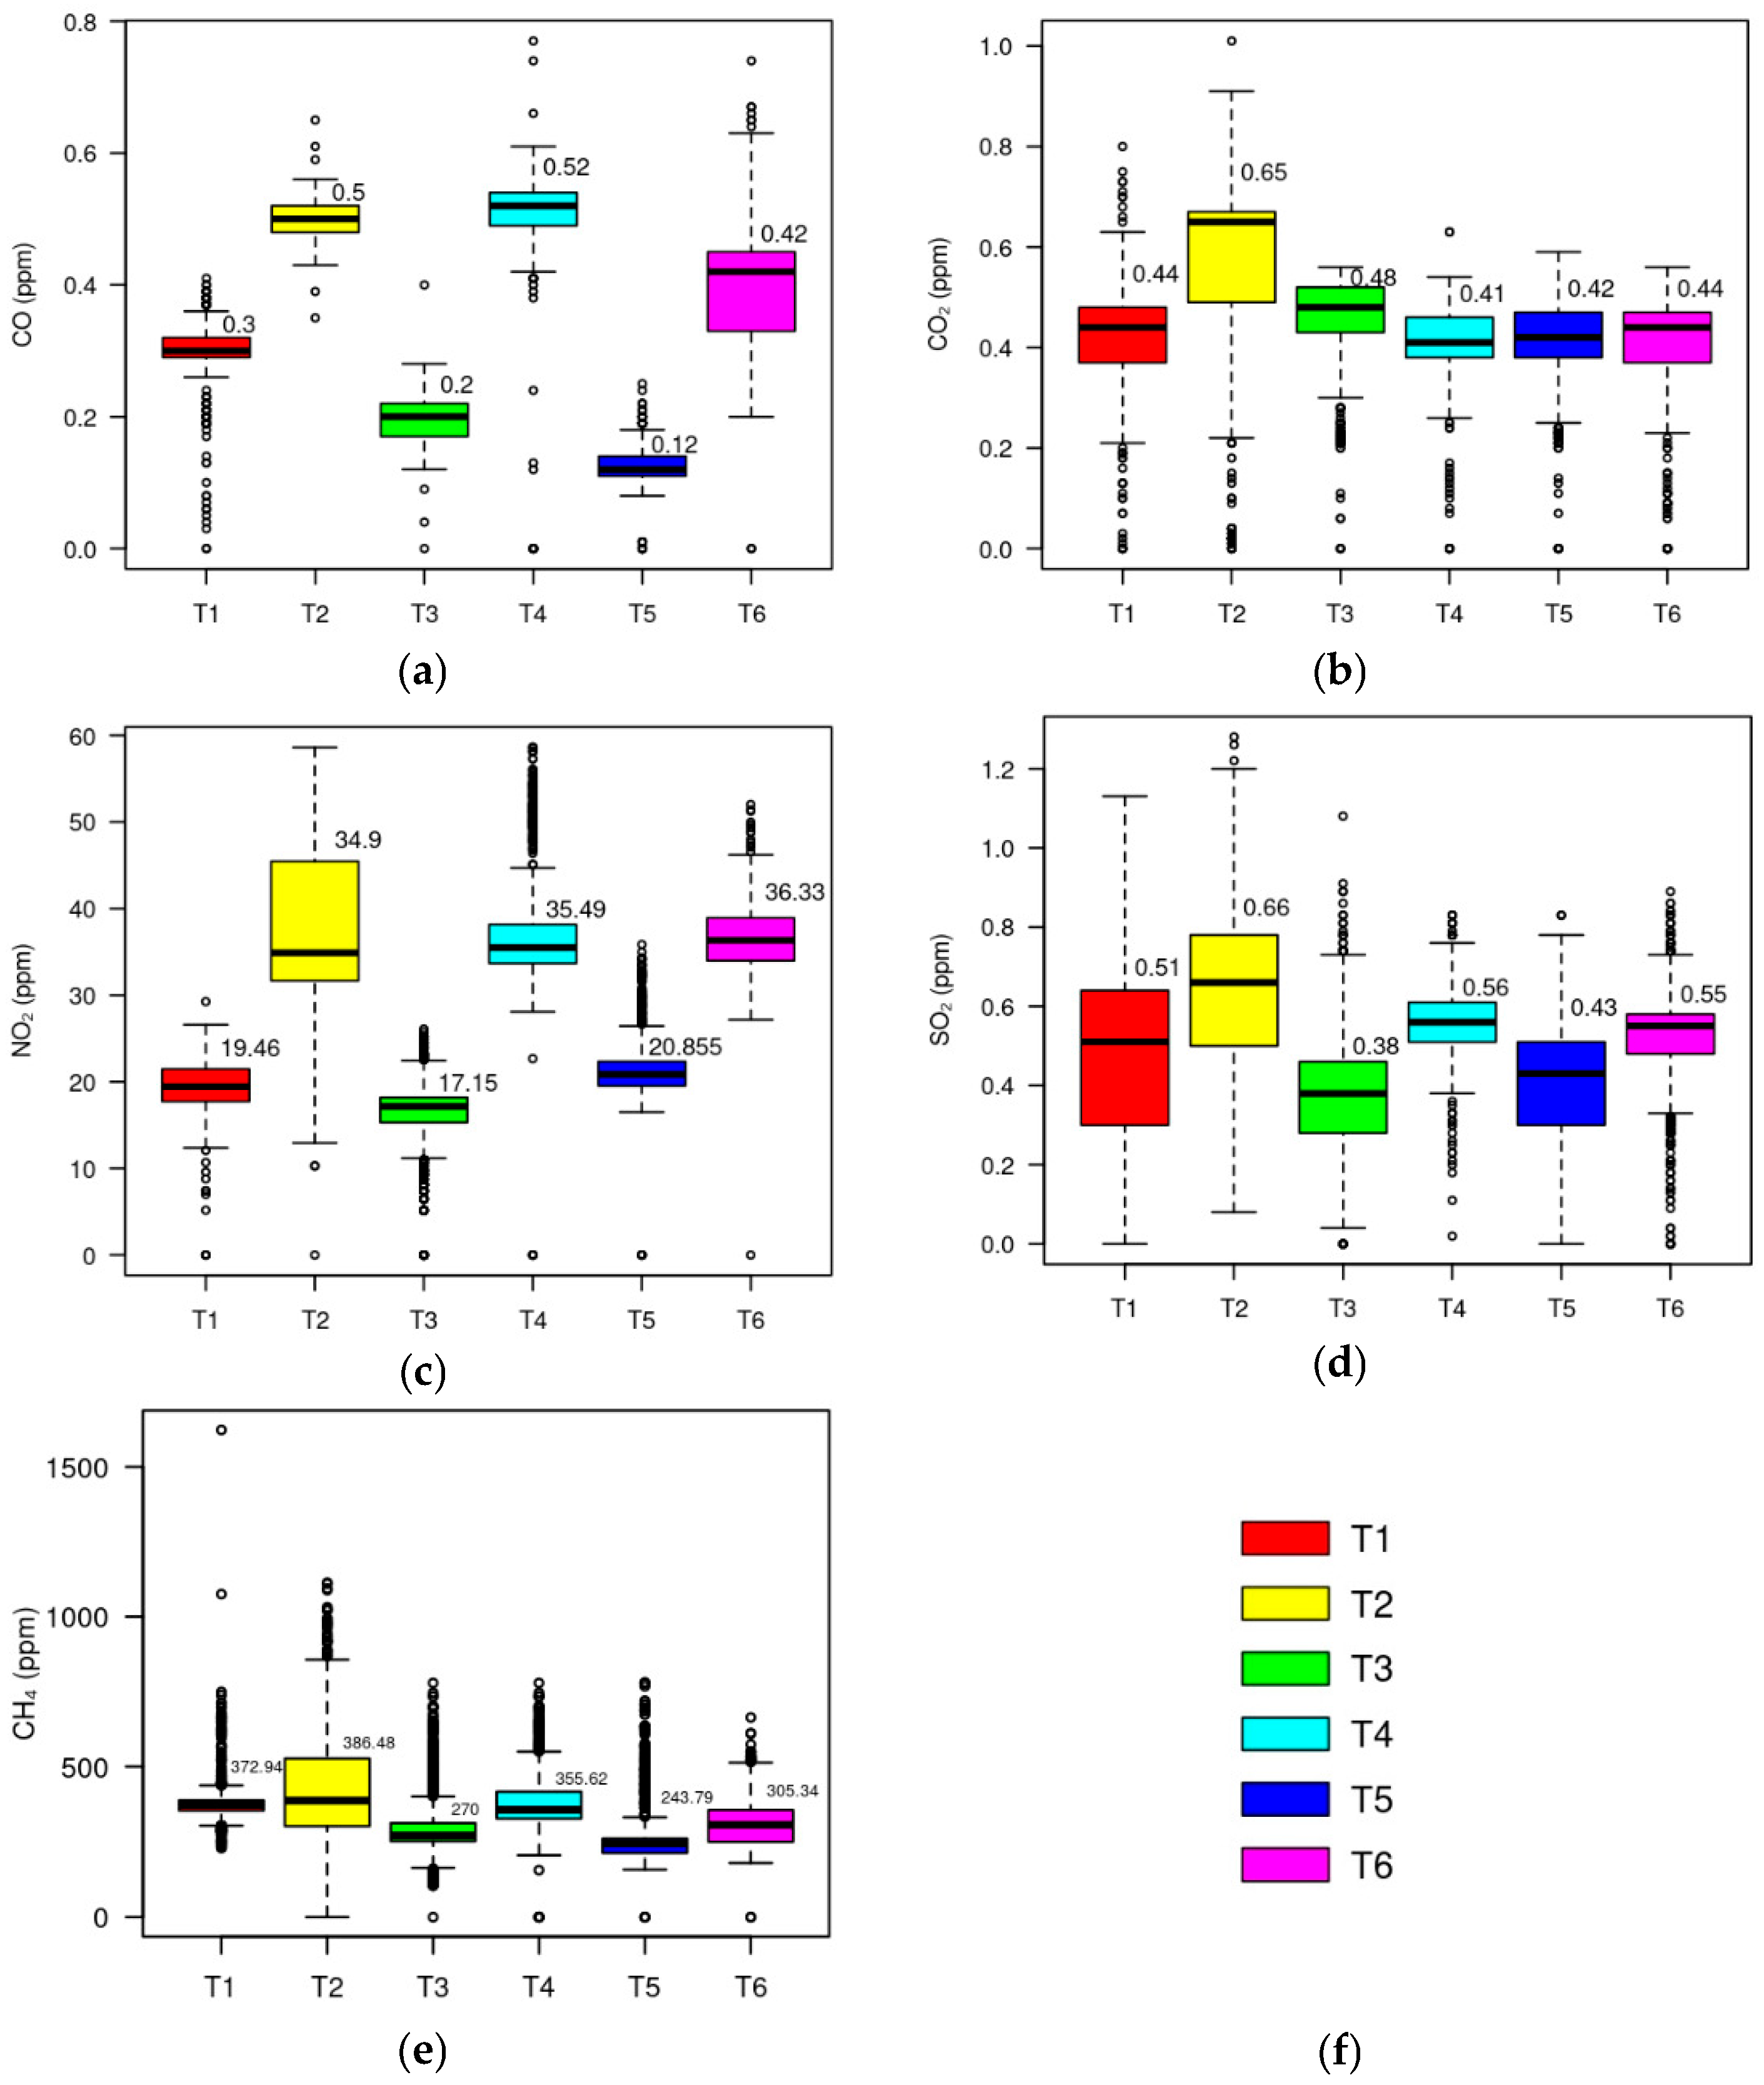
We found a marked decrease in the CO concentration in the ER treatments compared to the TR treatments for all species. Additionally, a significant CO reduction was observed with the ER and the native species compared to the eucalyptus treatments (Figure 5a). The CO2 concentration did not show significant differences in almost all treatments, although a decrease in this pollutant was observed in the electrical reactor with eucalyptus (Figure 5b). The concentration of NO2 showed a similar response to that of CO; however, a lower concentration of this gas was recorded with the capuli (Figure 5c). The same pattern was recorded for the SO2 concentration, although the difference is less marked (Figure 5d). Finally, as with CO2, the concentration of CH4 did not show marked differences, although a significant difference could be recorded between the capuli treatments (Figure 5e).
When analyzing the concentration of pollutants without differentiating by species, a more substantial decrease in CO and NO2 was found in the ER compared to the TR. It was followed by a less marked difference in the SO2 concentration and no difference between both reactors in the CO2 and CH4 concentrations, with a tendency toward a lower concentration of all gases in the ER (Figure 6). This occurs even though the two-tailed Mann–Whitney U-test found no significant difference between gas concentrations for both reactors (p < 0.001, in all cases). However, when analyzing the biserial range used to evaluate the relationship between the different variables, a much more extensive scope is observed for pollutants that show a significant difference between the ER and TR (CO: −0.94, NO2: −0.99). On the other hand, gases showing no differences between reactors obtained much lower biserial range values (CO2: −0.07, SO2: −0.51, CH4: −0.35, Figure 6b,e).
Additionally, Figure 7a, Figure 7b, Figure 7c, Figure 7d, and Figure 7e show concentration–time graphs that present the evolution of the different gases’ contaminants during the pyrolysis process for CO, CO2, NO2, CH4, and SO2, respectively.

3.3. Biomass to Biochar Conversion Rate

The quantification of results by treatment was performed for each type of biomass used in the ER and TR pyrolysis processes. The TR shows an additional parameter, biomass as fuel (Table 1).
The results indicate that for each treatment performed, a quarter of the biochar (25%) is obtained for both the ER and TR.

3.4. Quantification of the CO2 Emissions of Each Reactor (TR and ER)

The data calculated to provide the CO2 emissions avoided, expressed in TCO2, are based on the energy per pyrolysis process of each reactor (ER = 36.4 kWh and TR = 104.6 kWh) (Table 2).

4. Discussion

In the ER, there was less energy consumption than in the TR. Faster and more uniform heating was observed in the ER due to the direct energy supply, while in the TR, slow and non-uniform heating was verified according to biomass combustion. Solar energy can improve biomass energy [24] because the conventional pyrolysis process produces excessive energy consumption, as well as greenhouse gas production [33]. It is always important to consider the energy source used to run the pyrolysis process, seeking energy sources that do not deplete or pollute significantly. As a potential renewable energy option, the solar pyrolysis of biomass has emerged as an efficient and effective method [22,34]. Solar-assisted pyrolysis would be one of the solutions to overcome the pyrolytic reactor heating problem, with lower energy consumption and lower gas production compared to the traditional pyrolysis system [33].
In the ER, there were fewer gas emissions than in the TR. The electric reactor reduces approximately 65% TCO2, with the consequent environmental benefits. The type of reactor, its construction structure, and the heat source for the pyrolysis process affect the emission of gases into the atmosphere. The authors have not been able to find information on energy efficiency and CO2 reduction in the production of biochar from lignocellulose material using ER powered by photovoltaic panels. It is important to highlight that when using solar concentrators, efficiencies close to 40% have been detailed [22,35]. However, this efficiency is limited to concentrator technology and the partial use of solar energy. In one detailed study, conventional electrical energy was needed to reach a stable temperature of 500 °C. However, the other study was conducted in Abu Dhabi, United Arab Emirates. Abu Dhabi enjoys high solar radiation due to its geographical location and desert climate, making it a favorable location for developing solar energy projects and other applications that harness solar energy.
In the ER, there was a significant decrease in CO and NO2 compared to the TR. It is assumed that the higher gas emissions in the TR are due to the amount of primary forest biomass used as fuel, which had the same drying process in all treatments in terms of the drying time and the way it was treated. In general, conventional biomass reactors contribute to air pollution due to the large amounts of carbon monoxide and carbon dioxide released from their combustion [22]. The gases do not have the same behavior in the two types of reactors (Figure 7). It is assumed that the biomass used in the combustion of the traditional reactor emits gases; these, due to the low incidence of wind, remain in the atmosphere and are added to the gases generated by the thermochemical degradation of the biomass inside the reactor. Each gas has a different behavior in the two types of reactors. For example, CO is frequently evident at the beginning of the combustion process (a consequence of the lack of oxygen). However, the pyrolysis process favors the formation of CH4 due to the decomposition of biomass inside the reactor under anoxic conditions; however, it is reduced in combustion processes with the presence of oxygen. It is then inferred that the operating conditions and construction design of the reactors affect the emission of polluting gases.
Basically, the gas emissions are related to the biomass type and moisture content. Thus, a typical fixed-bed biomass pyrolysis plant produces a high intensity of CO2 emissions [36]. Several studies reveal that CO and CO2 formation reactions exhibit similar rates in pyrolytic processes of lignocellulosic biomass [37] as a function of the dehydration rate [38]. Solar energy in the pyrolysis process would contribute to the reduction in both CO2 emissions and fuel costs by 32.4% [22] depending on the waste treated and the system configuration [39].
The pyrolysis of solid waste in an ER has advantages in terms of environmental pollution due to lower carbon emissions with respect to combustion and gasification [40], traditionally used to treat lignified biomass. The remarkable decrease in gases in the process in comparison with the TR would be the main advantage of the use of electrical reactors and solar energy. Several previous studies have widely reported this benefit [26,27,41,42]. Combustion conditions [43], temperature increases [44], and biomass dehydration processes [38] affect gas emissions during pyrolysis.
The biomass transformation rate was similar in both reactors. The thermochemical transformation of biomass produces biochar, along with other components such as bio-oil, methane, carbon, and hydrogen [45,46]; the yield depends on the conditions under which the process is carried out, the type of reactor, and the biomass used. The pyrolysis process in an ER showed a higher biomass conversion efficiency compared to the TR [24,25]; the efficient utilization of solar-derived biomass in the pyrolysis process depends on the type of feedstock and reactor design factors [21,32]. In this study, no significant differences were found in the conversion of biomass to biochar. Probably, once both reactors reach the ideal pyrolysis temperature, the biomass, being the same, follows the same thermochemical degradation process. Pyrolysis in an ER is widely used, given its fast reaction time, small size, emissions reduction, and immobilization of heavy metals; it has recently gained more popularity for biomass treatment compared to other available technologies [47,48].

5. Conclusions

The main objective of this research was to develop an environmentally friendly biomass combustion tool. According to results published by the authors, it is optimal in terms of energy efficiency [29]. The ER is powered by a solar panel system, increasing the energy efficiency of this novel combustion tool. Compared to the TR, the ER effectiveness and efficiency are related to the design, which is strongly linked to better heat distribution [22], in addition to decreasing CO emissions. It can be stated that the TR is undoubtedly a combustion mechanism that generates more pollution than the ER, with eucalyptus being the most polluting, followed by capuli and acacias. Finally, the ER is less polluting than the TR, demonstrating that this innovative biomass combustion tool has favorable characteristics when analyzing energy consumption and gas pollution.
Therefore, for producing biochar from lignocellulosic species, it was found that photovoltaic panel-powered electrical reactors consume less energy and are less polluting than traditional ones. They significantly reduce energy consumption (approximately 80%), since the energy efficiency of firewood is low, and environmental pollution, because during the pyrolysis process, the treatments in the ER had lower emissions of CO (by 59.5%), NO2 (by 50.0%), SO2 (by 33.3%), and CH4 (by 20.4%). The operating costs of the ER are lower, considering that power from the public grid for the ER would have a cost of $2.88 american dollars, but the ER is powered by photovoltaic panels, so costs decrease. The TR, considering the same capacity as the ER, would have a cost in firewood of $12.50 american dollars. Furthermore, the human effort is lower, as the ER needs less preparation and manpower. However, new research is being developed, comparing an ER and TR with chambers of the same size. Similarly, other plant species are being pyrolyzed.

Author Contributions

Conceptualization, J.-C.C.-T., J.I. and M.A.-V.; methodology, J.-C.C.-T., J.I. and M.A.-V.; validation, J.-C.C.-T., J.I. and M.A.-V.; formal analysis, J.-C.C.-T., J.I. and M.A.-V.; investigation, J.-C.C.-T., J.I. and M.A.-V.; resources, J.-C.C.-T. and M.A.-V.; data curation, J.-C.C.-T., J.I. and M.A.-V.; writing—original draft preparation, J.-C.C.-T., J.I. and M.A.-V.; writing—review and editing, J.-C.C.-T., J.I. and M.A.-V.; visualization, J.-C.C.-T. and J.I.; supervision, J.-C.C.-T. and M.A.-V.; project administration, J.-C.C.-T. and M.A.-V.; funding acquisition, J.-C.C.-T. and M.A.-V. All authors have read and agreed to the published version of the manuscript.

Funding

This research received no external funding.

Data Availability Statement

Data are contained within the article.

Acknowledgments

This research was undertaken as part of the work of the research group “Sistemas Embebidos y Visión Artificial en Ciencias Arquitectónicas, Agropuecuarias, Ambientales y Automática (SEVA4CA)” under a project entitled “Mapeo de la Calidad del aire a nivel paranasal mediante IoT”.

Conflicts of Interest

The authors declare no conflict of interest.

References

  1. Foong, S.Y.; Liew, R.K.; Yang, Y.; Cheng, Y.W.; Yek, P.N.Y.; Wan Mahari, W.A.; Lee, X.Y.; Han, C.S.; Vo, D.-V.N.; Van Le, Q.; et al. Valorization of Biomass Waste to Engineered Activated Biochar by Microwave Pyrolysis: Progress, Challenges, and Future Directions. Chem. Eng. J. 2020, 389, 124401. [Google Scholar] [CrossRef]
  2. Nunes, L.J.R.; Casau, M.; Dias, M.F.; Matias, J.C.O.; Teixeira, L.C. Agroforest Woody Residual Biomass-to-Energy Supply Chain Analysis: Feasible and Sustainable Renewable Resource Exploitation for an Alternative to Fossil Fuels. Results Eng. 2023, 17, 101010. [Google Scholar] [CrossRef]
  3. Azeta, O.; Ayeni, A.O.; Agboola, O.; Elehinafe, F.B. A Review on the Sustainable Energy Generation from the Pyrolysis of Coconut Biomass. Sci. Afr. 2021, 13, e00909. [Google Scholar] [CrossRef]
  4. Saletnik, B.; Zagula, G.; Bajcar, M.; Tarapatskyy, M.; Bobula, G.; Puchalski, C. Biochar as a Multifunctional Component of the Environment-a Review. Appl. Sci. 2019, 9, 1139. [Google Scholar] [CrossRef]
  5. Mohan, I.; Panda, A.K.; Volli, V.; Kumar, S. An Insight on Upgrading of Biomass Pyrolysis Products and Utilization: Current Status and Future Prospect of Biomass in India. Biomass Convers. Biorefin. 2022, 14, 6185–6203. [Google Scholar] [CrossRef]
  6. Kung, C.-C.; Mu, J.E. Prospect of China’s Renewable Energy Development from Pyrolysis and Biochar Applications under Climate Change. Renew. Sustain. Energy Rev. 2019, 114, 109343. [Google Scholar] [CrossRef]
  7. Zhao, Y.; Hu, Z.; Lu, Y.; Shan, S.; Zhuang, H.; Gong, C.; Cui, X.; Zhang, F.; Li, P. Facilitating Mitigation of Agricultural Non-Point Source Pollution and Improving Soil Nutrient Conditions: The Role of Low Temperature Co-Pyrolysis Biochar in Nitrogen and Phosphorus Distribution. Bioresour. Technol. 2024, 394, 130179. [Google Scholar] [CrossRef] [PubMed]
  8. Oni, B.A.; Oziegbe, O.; Olawole, O.O. Significance of Biochar Application to the Environment and Economy. Ann. Agric. Sci. 2019, 64, 222–236. [Google Scholar] [CrossRef]
  9. Almutairi, A.A.; Ahmad, M.; Rafique, M.I.; Al-Wabel, M.I. Variations in Composition and Stability of Biochars Derived from Different Feedstock Types at Varying Pyrolysis Temperature. J. Saudi Soc. Agric. Sci. 2023, 22, 25–34. [Google Scholar] [CrossRef]
  10. Hossain, M.Z.; Bahar, M.M.; Sarkar, B.; Donne, S.W.; Ok, Y.S.; Palansooriya, K.N.; Kirkham, M.B.; Chowdhury, S.; Bolan, N. Biochar and Its Importance on Nutrient Dynamics in Soil and Plant. Biochar 2020, 2, 379–420. [Google Scholar] [CrossRef]
  11. Jatav, H.S.; Rajput, V.D.; Minkina, T.; Singh, S.K.; Chejara, S.; Gorovtsov, A.; Barakhov, A.; Bauer, T.; Sushkova, S.; Mandzieva, S.; et al. Sustainable Approach and Safe Use of Biochar and Its Possible Consequences. Sustainability 2021, 13, 10362. [Google Scholar] [CrossRef]
  12. Flatabø, G.Ø.; Cornelissen, G.; Carlsson, P.; Nilsen, P.J.; Tapasvi, D.; Bergland, W.H.; Sørmo, E. Industrially Relevant Pyrolysis of Diverse Contaminated Organic Wastes: Gas Compositions and Emissions to Air. J. Clean. Prod. 2023, 423, 138777. [Google Scholar] [CrossRef]
  13. Mohtasham, J. Review Article-Renewable Energies. Energy Procedia 2015, 74, 1289–1297. [Google Scholar] [CrossRef]
  14. Wijitkosum, S. Biochar Derived from Agricultural Wastes and Wood Residues for Sustainable Agricultural and Environmental Applications. Int. Soil Water Conserv. Res. 2022, 10, 335–341. [Google Scholar] [CrossRef]
  15. Sen, S.; Ganguly, S. Opportunities, Barriers and Issues with Renewable Energy Development—A Discussion. Renew. Sustain. Energy Rev. 2017, 69, 1170–1181. [Google Scholar] [CrossRef]
  16. Kant Bhatia, S.; Palai, A.K.; Kumar, A.; Kant Bhatia, R.; Kumar Patel, A.; Kumar Thakur, V.; Yang, Y.-H. Trends in Renewable Energy Production Employing Biomass-Based Biochar. Bioresour. Technol. 2021, 340, 125644. [Google Scholar] [CrossRef] [PubMed]
  17. Dhyani, V.; Bhaskar, T. A Comprehensive Review on the Pyrolysis of Lignocellulosic Biomass. Renew. Energy 2018, 129, 695–716. [Google Scholar] [CrossRef]
  18. Hu, X.; Gholizadeh, M. Biomass Pyrolysis: A Review of the Process Development and Challenges from Initial Researches up to the Commercialisation Stage. J. Energy Chem. 2019, 39, 109–143. [Google Scholar] [CrossRef]
  19. Chen, Y.; Wang, Z.; Zhong, Z. CO<sub>2</sub> Emissions, Economic Growth, Renewable and Non-Renewable Energy Production and Foreign Trade in China. Renew. Energy 2019, 131, 208–216. [Google Scholar] [CrossRef]
  20. Bekun, F.V.; Alola, A.A.; Sarkodie, S.A. Toward a Sustainable Environment: Nexus between CO2 Emissions, Resource Rent, Renewable and Nonrenewable Energy in 16-EU Countries. Sci. Total Environ. 2019, 657, 1023–1029. [Google Scholar] [CrossRef]
  21. Raza, M.; Inayat, A.; Ahmed, A.; Jamil, F.; Ghenai, C.; Naqvi, S.R.; Shanableh, A.; Ayoub, M.; Waris, A.; Park, Y.K. Progress of the Pyrolyzer Reactors and Advanced Technologies for Biomass Pyrolysis Processing. Sustainability 2021, 13, 11061. [Google Scholar] [CrossRef]
  22. Joardder, M.U.H.; Halder, P.K.; Rahim, A.; Paul, N. Solar Assisted Fast Pyrolysis: A Novel Approach of Renewable Energy Production. J. Eng. 2014, 2014, 252848. [Google Scholar] [CrossRef]
  23. Igliński, B.; Kujawski, W.; Kiełkowska, U. Pyrolysis of Waste Biomass: Technical and Process Achievements, and Future Development—A Review. Energies 2023, 16, 1829. [Google Scholar] [CrossRef]
  24. Fahmy, T.Y.A.; Fahmy, Y.; Mobarak, F.; El-Sakhawy, M.; Abou-Zeid, R.E. Biomass Pyrolysis: Past, Present, and Future. Environ. Dev. Sustain. 2020, 22, 17–32. [Google Scholar] [CrossRef]
  25. Weldekidan, H.; Strezov, V.; Kan, T.; Town, G. Waste to Energy Conversion of Chicken Litter through a Solar-Driven Pyrolysis Process. Energy Fuels 2018, 32, 4341–4349. [Google Scholar] [CrossRef]
  26. Francisco Dias Júnior, A.; Rogério Andrade, C.; de Paula Protásio, T.; Cristina Nogueira Alves de Melo, I.; Otávio Brito, J.; Fernando Trugilho, P. Scientia Forestalis Pyrolysis and Wood By-Products of Species from the Brazilian Semi-Arid Region Pirólise e Subprodutos Da Madeira de Espécies Do Semiárido Brasileiro. Sci. For. 2018, 46, 65–75. [Google Scholar] [CrossRef]
  27. Leal Pérez, B.J.; Medrano Jiménez, J.A.; Bhardwaj, R.; Goetheer, E.; van Sint Annaland, M.; Gallucci, F. Methane Pyrolysis in a Molten Gallium Bubble Column Reactor for Sustainable Hydrogen Production: Proof of Concept & Techno-Economic Assessment. Int. J. Hydrog. Energy 2021, 46, 4917–4935. [Google Scholar] [CrossRef]
  28. Piersa, P.; Unyay, H.; Szufa, S.; Lewandowska, W.; Modrzewski, R.; Ślężak, R.; Ledakowicz, S. Review an Extensive Review and Comparison of Modern Biomass Torrefaction Reactors vs. Biomass Pyrolysis—Part 1. Energies 2022, 15, 2227. [Google Scholar] [CrossRef]
  29. Siguencia-Ortiz, C.A. Diseño y Construcción de Un Reactor Eléctrico de Conversión de Biomasa a Biochar Alimentado a Través de Energías Renovables; Universidad Católica de Cuenca: Cuenca, Ecuador, 2021. [Google Scholar]
  30. Silva, A.-D.; Otomar-Caron, B.; Sanquetta, C.R.; Behling, A.; Scmidt, D.; Bamberg, R.; Eloy, E.; Dalla-Corte, A.P. Ecuaciones Para Estimar El Poder Calorífico de La Madera de Cuatro Especies de Árboles. Rev. Chapingo. Ser. Cienc. For. Ambiente 2014, 20, 177–186. [Google Scholar]
  31. García-Pesántez, P.A.; Londa-Veletanga, K.E. Estación Meteorológica y de Calidad de Aire; Universidad Católica de Cuenca: Cuenca, Ecuador, 2020. [Google Scholar]
  32. Aguilar Ramón, J.A.; Illescas Barreto, W.S.; Espinoza Abad, J.L. Análisis Técnico y Económico para la Implementación de Sistemas de Generación Solar Fotovoltaica para Autoabastecimiento en la Planta Industrial y Granja Porcícola de la Empresa Italimentos CIA. LTDA. Bachelor’s Thesis, Universidad de Cuenca, Cuenca, Spain, 2021. [Google Scholar]
  33. Mastral, F.J.; Esperanza, E.; Garciía, P.; Juste, M. Pyrolysis of High-Density Polyethylene in a Fluidised Bed Reactor. Influence of the Temperature and Residence Time. J. Anal. Appl. Pyrolysis 2002, 63, 1–15. [Google Scholar] [CrossRef]
  34. Brasseur, G.P.; Orlando, J.J.; Tyndall, G.S. Middle Atmospheric Ozone. In Atmospheric Chemistry and Global Change; Oxford University Press: New York, NY, USA, 1999; pp. 487–514. [Google Scholar]
  35. Giwa, A.; Yusuf, A.; Ajumobi, O.; Dzidzienyo, P. Pyrolysis of Date Palm Waste to Biochar Using Concentrated Solar Thermal Energy: Economic and Sustainability Implications. Waste Manag. 2019, 93, 14–22. [Google Scholar] [CrossRef] [PubMed]
  36. Yaashikaa, P.R.; Senthil Kumar, P.; Varjani, S.J.; Saravanan, A. Advances in Production and Application of Biochar from Lignocellulosic Feedstocks for Remediation of Environmental Pollutants. Bioresour. Technol. 2019, 292, 122030. [Google Scholar] [CrossRef]
  37. Yang, T.; Jia, K.; Kai, X.; Sun, Y.; Li, Y.; Li, R. A Study on the Migration Behavior of K, Na, and Cl during Biomass Gasification. Bioresources 2016, 11, 7133. [Google Scholar] [CrossRef]
  38. Ibarrola, R.; Shackley, S.; Hammond, J. Pyrolysis Biochar Systems for Recovering Biodegradable Materials: A Life Cycle Carbon Assessment. Waste Manag. 2012, 32, 859–868. [Google Scholar] [CrossRef] [PubMed]
  39. Yaseen, M.; Abbas, F.; Shakoor, M.B.; Farooque, A.A.; Rizwan, M. Biomass for Renewable Energy Production in Pakistan: Current State and Prospects. Arab. J. Geosci. 2020, 13, 77. [Google Scholar] [CrossRef]
  40. Banyasz, J.L.; Li, S.; Lyons-Hart, J.; Shafer, K.H. Gas Evolution and the Mechanism of Cellulose Pyrolysis. Fuel 2001, 80, 1757–1763. [Google Scholar] [CrossRef]
  41. Kumar, V.; Nanda, M. Biomass Pyrolysis-Current Status and Future Directions. Energy Sources Part A Recovery Util. Environ. Eff. 2016, 38, 2914–2921. [Google Scholar] [CrossRef]
  42. Akram, M.W.; Mondal, T.; Rahman, M.T.; Rahim, A.; Mursalin, R. Towards an Improved Pyrolysis System: Integrating Solar Energy Based Pre-Heating System. In AIP Conference Proceedings; AIP Publishing: Melville, NY, USA, 2019; Volume 2121. [Google Scholar] [CrossRef]
  43. Xiong, X.; Yu, S.; Qin, D.; Tan, H.; Lu, X. Evolution Behaviors of the Nitrogen-Containing Species and SO2 from Coal Fast Pyrolysis. J. Energy Inst. 2022, 105, 133–140. [Google Scholar] [CrossRef]
  44. Rodat, S.; Abanades, S.; Flamant, G. Experimental Evaluation of Indirect Heating Tubular Reactors for Solar Methane Pyrolysis. Int. J. Chem. Reactor Eng. 2010, 8, A25. [Google Scholar] [CrossRef]
  45. Ndukwu, M.C.; Horsfall, I.T.; Ubouh, E.A.; Orji, F.N.; Ekop, I.E.; Ezejiofor, N.R. Review of Solar-Biomass Pyrolysis Systems: Focus on the Configuration of Thermal-Solar Systems and Reactor Orientation. J. King Saud Univ.—Eng. Sci. 2021, 33, 413–423. [Google Scholar] [CrossRef]
  46. Al-Rumaihi, A.; Shahbaz, M.; Mckay, G.; Mackey, H.; Al-Ansari, T. A Review of Pyrolysis Technologies and Feedstock: A Blending Approach for Plastic and Biomass towards Optimum Biochar Yield. Renew. Sustain. Energy Rev. 2022, 167, 112715. [Google Scholar] [CrossRef]
  47. Dai, X.; Wu, C.; Li, H.; Chen, Y. The Fast Pyrolysis of Biomass in CFB Reactor. Energy Fuels 2000, 14, 552–557. [Google Scholar] [CrossRef]
  48. Jing-pei, C.; Jing-pei, C.; Xiao-yan, Z.; Xiao-yan, Z.; Kayoko, M.; Xian-yong, W.; Takayuki, T. Fractionation and Identification of Organic Nitrogen Species from Bio-Oil Produced by Fast Pyrolysis of Sewage Sludge. Bioresour. Technol. 2010, 101, 7648–7652. [Google Scholar]
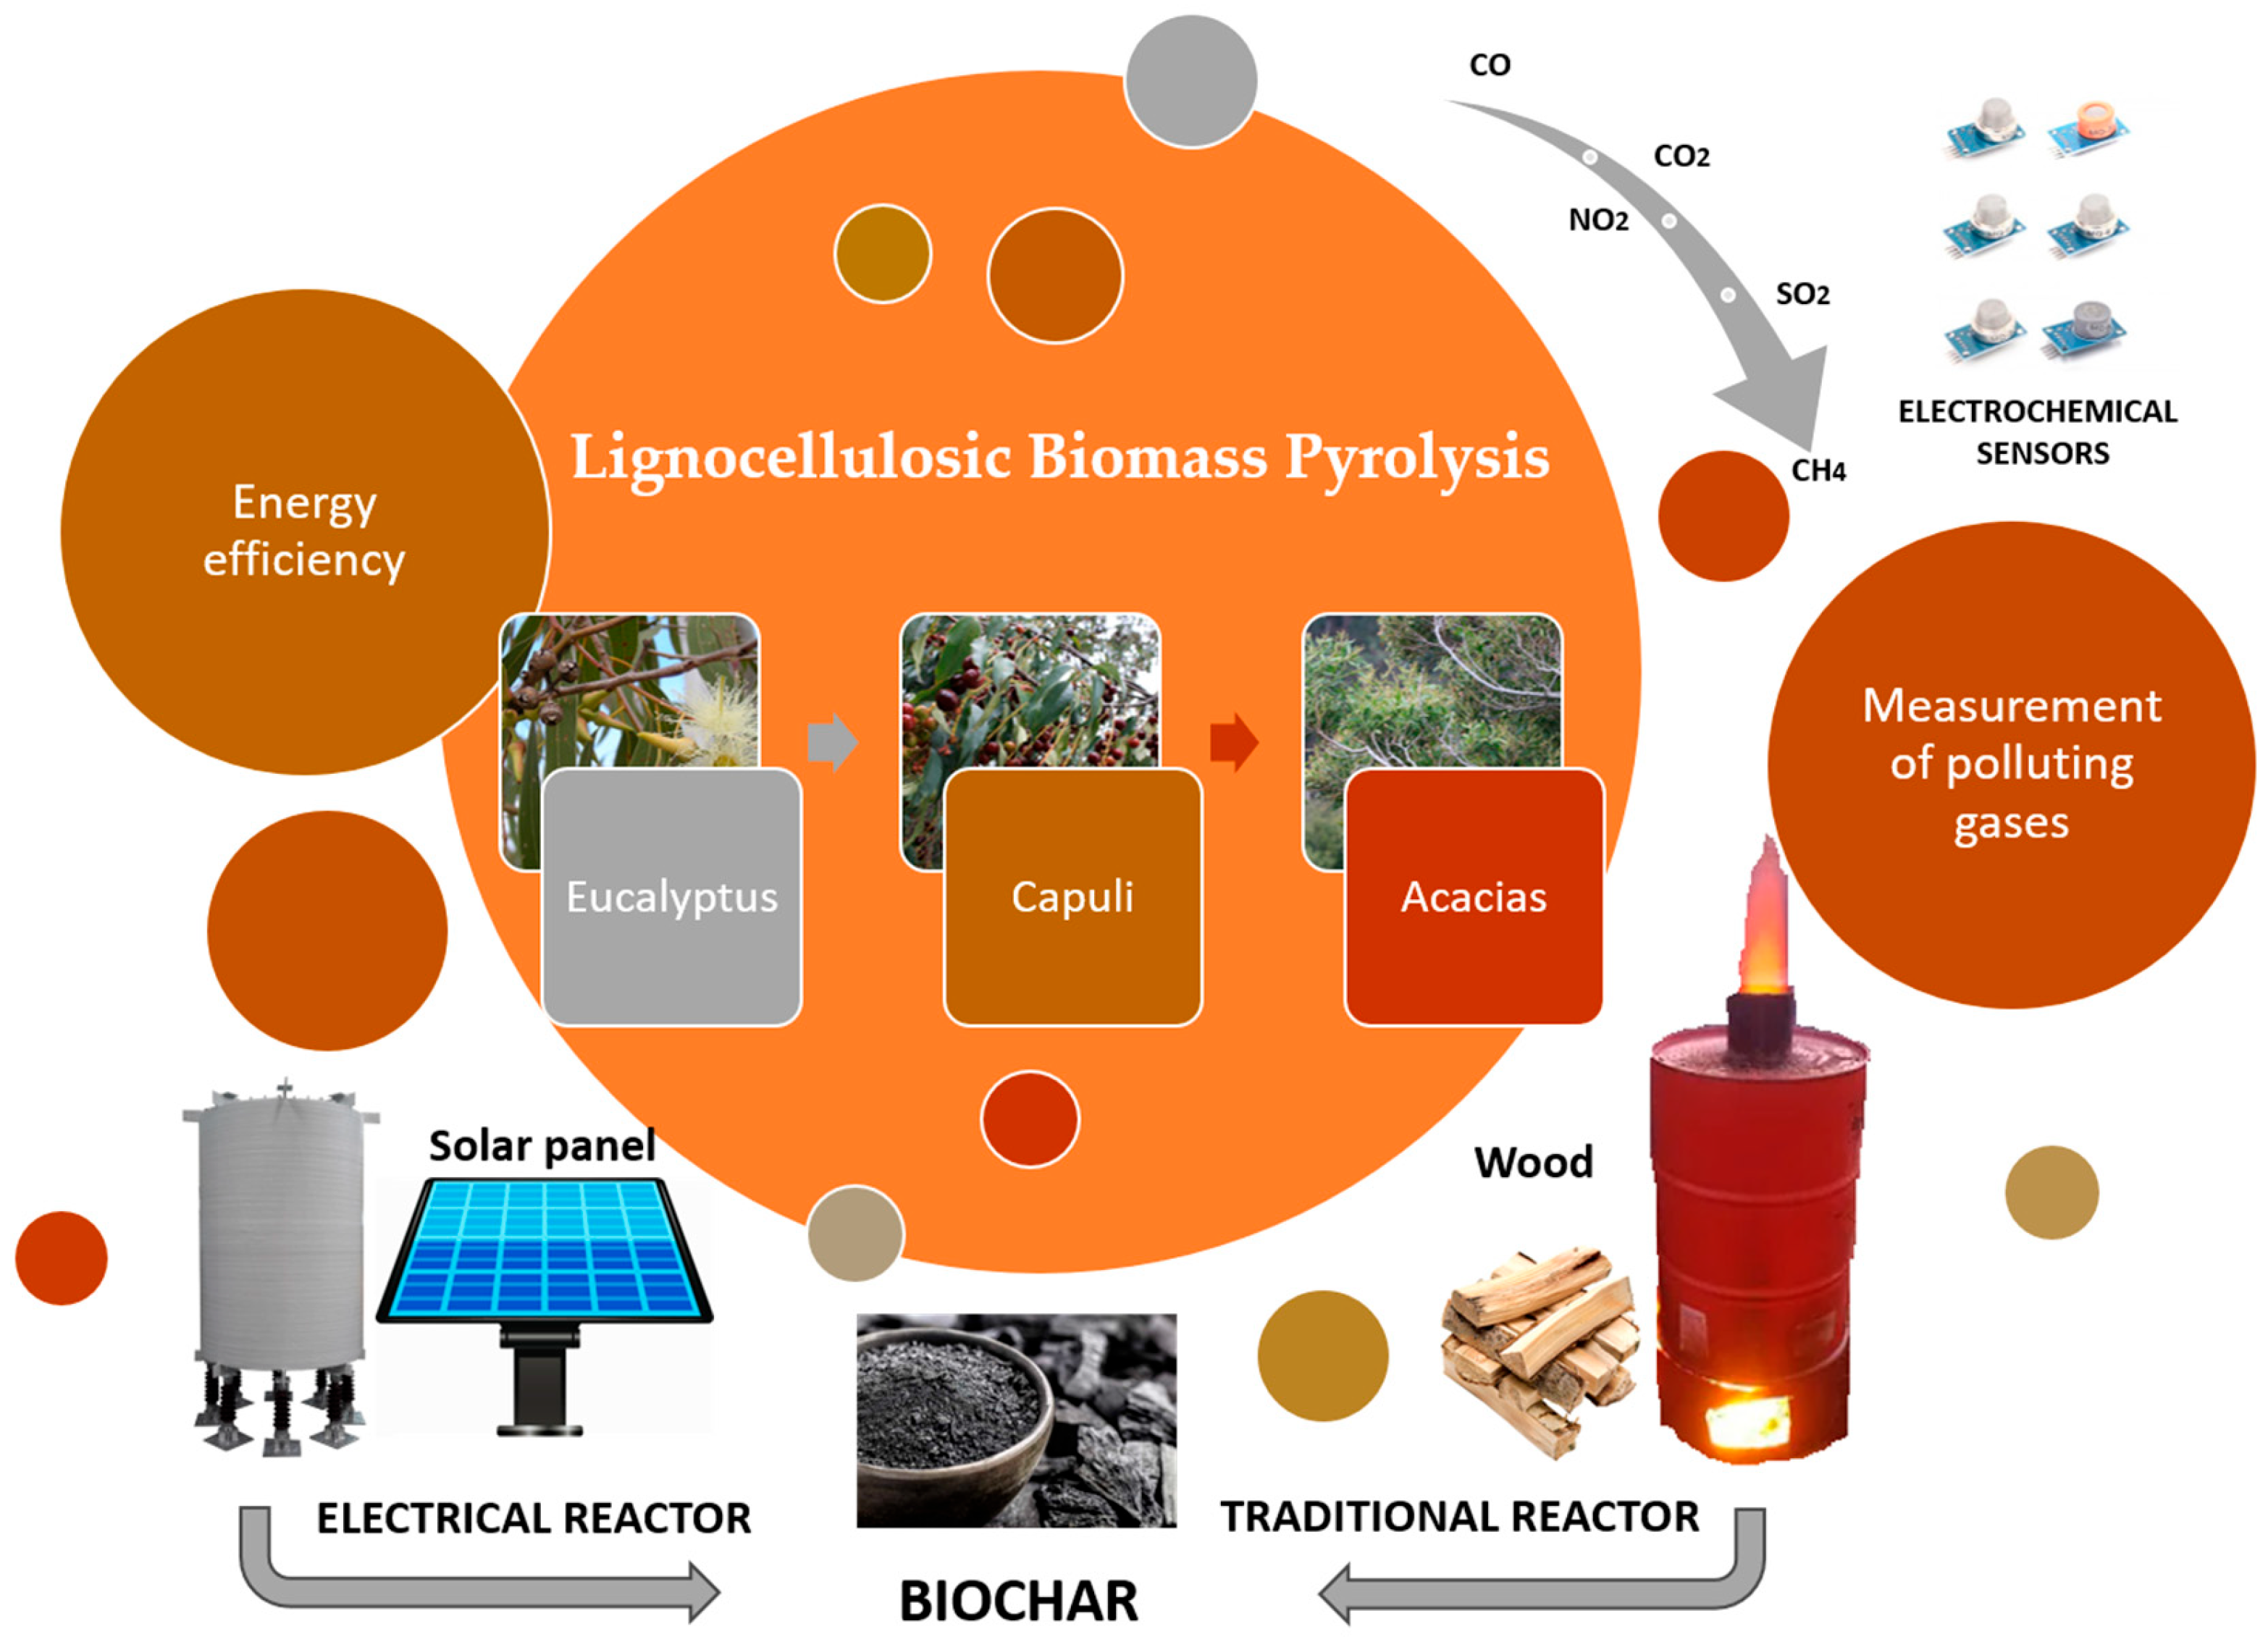
Figure 1. Diagram for obtaining biochar through pyrolysis. The types of reactors (electrical and traditional reactors), type of biomass used (eucalyptus [Eucalyptus globulus], capuli [Prunus serotina], and acacia [Acacia sp.]), and polluting gases measured (CO, CO2, NO2, SO2, and CH4) are detailed.
Energies 17 02943 g001
Figure 2. Detailed images of the reactors used in the experiment: (a) photovoltaic panels installed to supply electrical reactor energy; (b) protection systems, direct current (DC) to alternating current (AC) conversion system, and electrical reactor; (c) traditional reactor.
Energies 17 02943 g002aEnergies 17 02943 g002b
Figure 4. Thermographic images of the two pyrolysis processes with the two types of reactors; the graphs show the distribution of heat in each reactor: (a) traditional reactor temperature; (b) electrical reactor temperature.
Energies 17 02943 g004
Figure 5. Concentration of pollutants emitted in the six treatments of the pyrolysis process: (a) CO; (b) CO2; (c) NO2; (d) SO2; (e) CH4; and (f) legend. Each box represents the median and the 25th and 75th percentiles of the six treatments for pyrolysis in the ER and TR (whiskers indicate normal data range, dots indicate outliers).
Energies 17 02943 g005
Figure 6. Fluctuation of the main factors of the pyrolysis process with the ER and TR: (a) CO; (b) CO2; (c) NO2; (d) SO2; (e) CH4. Each box represents the median and the 25th and 75th percentiles of the four pyrolysis treatments in the ER and TR (whiskers indicate normal data range and dots indicate outliers).
Energies 17 02943 g006
Figure 7. Fluctuation of the main factors of the pyrolysis process for the ER and TR: (a) CO; (b) CO2; (c) NO2; (d) SO2; (e) CH4. The data obtained during the pyrolysis process are represented: red line—electrical reactor, blue line—traditional reactor.
Energies 17 02943 g007
Table 1. Treatments established for each plant species in the ER and TR. The biomass–biochar transformation rate is shown in kg. In addition, the biomass fuel for the TR is included.
Treatment
[Treatment Reactor-Biomass]
Species RLBBiomass (kg)Biochar (kg)%Biomass Fuel (kg)
Electrical
Reactor
T1 ER-B1Eucalyptus1.950.5327n/a
2.040.5527n/a
1.950.5126n/a
Traditional
Reactor
T2 TR-B1Eucalyptus8.11.92320
822520
81.92420
Electrical
Reactor
T3 ER-B2Capuli1.930.5126n/a
1.920.4926n/a
1.910.5227n/a
Traditional
Reactor
T4 TR-B2Capuli8.11.92320
81.92420
7.91.82320
Electrical
Reactor
T5 ER-B3Acacias1.910.5127n/a
1.960.5227n/a
1.990.4925n/a
Traditional
Reactor
T6 TR-B3Acacias7.91.82320
7.91.82320
7.81.82320
Table 2. Determination of CO2 emissions for the ER and TR. In addition, this table shows the energy consumption, emission factor, treatment time, and total CO2 emissions.
ReactorEnergy Power (kWh)Emission Factor CO2 (TCO2)Hours per TreatmentEnergy
Consumption (kWh/4 h)
CO2 Emissions per Pyrolysis Process (TCO2)# of RepetitionsTotal CO2 Emissions (TCO2)
Electrical9.10.0002449436.40.008914490.0802292
Traditional104.60.00024492 (2 firewood loads of 20 kg per treatment)209.20.051233190.4610977
Disclaimer/Publisher’s Note: The statements, opinions and data contained in all publications are solely those of the individual author(s) and contributor(s) and not of MDPI and/or the editor(s). MDPI and/or the editor(s) disclaim responsibility for any injury to people or property resulting from any ideas, methods, instructions or products referred to in the content.