Article

Climate Characterization and Energy Efficiency in Container Housing: Analysis and Implications for Container House Design in European Locations

by
Rafal Damian Figaj
1,
Davide Maria Laudiero
2,* and
Alessandro Mauro
2,3
1
Department of Sustainable Energy Development, AGH University of Science and Technology in Kraków, 30-059 Kraków, Poland
2
Department of Engineering, University of Naples “Parthenope” Centro Direzionale, Isola C4, 80143 Naples, Italy
3
Department of Engineering, University of Campania “Luigi Vanvitelli”, 81031 Aversa, Italy
*
Author to whom correspondence should be addressed.
Energies 2024, 17(12), 2926; https://doi.org/10.3390/en17122926
Submission received: 30 April 2024 / Revised: 10 June 2024 / Accepted: 12 June 2024 / Published: 14 June 2024
(This article belongs to the Special Issue Energy Efficiency of the Buildings: 3rd Edition)

Abstract

:
The present study investigates the energy efficiency of different container house configurations across thirty European locations. By employing Heating Degree Days (HDDs) and Cooling Degree Days (CDDs), the research delves into climatic zone exploration, providing a simplified climatic classification for residential purposes and comparing it with the Köppen–Geiger model. The authors use specific hourly climatic data for each location, obtained through dynamic simulations with TRNSYS v.18 software. Initially, the CDDs are calculated by using different base temperatures (comfort temperatures that minimize energy demand) tailored to the specific conditions of each case. Then, the thermal loads of container houses are evaluated in different climatic scenarios, establishing a direct correlation between climatic conditions and the energy needs of these innovative and modular housing solutions. By comparing stacked and adjacent modular configurations in container housing, particularly in post-disaster scenarios, the study underscores the importance of adaptive design to optimize energy efficiency. The analysis conducted by the authors has allowed them to propose a climate characterization model based on HDDs, CDDs, and solar irradiance, obtaining an effective novel correlation with the Köppen–Geiger classification, especially in extreme climates. The present model emerges as a powerful tool for climate characterization in residential applications, offering a new perspective for urban planning and housing design. Furthermore, the results reveal a significant correlation between climate classification and the specific energy needs of container houses, emphasizing the direct influence of regional climatic characteristics on energy efficiency, particularly in small-sized dwellings such as container houses.

1. Introduction

Container Houses (CHs), leveraging shipping containers as their fundamental structural components, are increasingly popular for various compelling reasons. Initially, they offered a more cost-effective alternative to traditional constructions, especially when employing recycled containers [1]. This innovative architectural solution has been enthusiastically embraced in many parts of the world for its ability to provide quick, affordable, and environmentally friendly housing. It is estimated that sea ports worldwide host over 17 million unused containers, accumulated due to the high costs associated with their storage, transportation, or disposal, and their resistance to degradation [2]. Therefore, it is urgent to develop innovative strategies for the sustainable use of these unused containers. In response to this challenge, the predominant trend is to transform these containers into permanent structures through a conversion process that makes them suitable for use as habitable and functional spaces. The adaptability of containers and their structural resilience [3,4] make them an attractive choice for a variety of residential and commercial applications, as well as for both temporary and permanent projects [5]. Indeed, the modularity of containers allows unprecedented flexibility in the design and layout of living spaces. Units can be easily expanded or reduced based on needs, while stacking containers enables the creation of larger and more intricate structures. Additionally, construction speed is generally faster compared to conventional housing, as much of the structure is prefabricated and only requires on-site adjustments and assembly. For this reason, CHs are widely used today as temporary housing (TH) after disasters thanks to their speedy construction. In a 2017 study [6], the authors assessed the condition of temporary housing following disasters, with a particular focus on container housing. The article highlights how the flexible architecture of CHs offers a range of significant advantages. Firstly, it aims to ensure swift access to temporary housing for individuals affected by emergency situations. This initiative is essential for stabilizing the living conditions of those experiencing emergencies, further facilitating better coordination of operations in disaster-affected areas. Additionally, the use of this type of temporary housing can streamline the provision of assistance and relief in international emergency situations. This implies the development of customized housing solutions that are specifically designed to adapt to the needs of each geographical area.
However, there are several challenges to consider in the reuse of shipping container homes. Ensuring proper thermal and acoustic insulation is crucial, as well as making adaptations to comply with local building regulations. Furthermore, the limited size of a single container may necessitate the use of multiple units to create adequately sized dwellings. This can generate the formation of thermal bridges between the anchoring structures that must be carefully studied and evaluated [7].
Costa Bruno et al. [8] analyzed the building envelope of TH after disasters, highlighting how the need to rapidly construct CHs can sometimes compromise the fundamental principles of energy efficiency. Consequently, the immediate use of container homes after a disaster could backfire on the comfort of residents due to significant risks of overheating and other issues. This situation could add further stress to users already in a position of fragility. For this reason, the building’s insulation [9], the habitability of the environment [10], and the thermal comfort [11] of the individual cannot be overlooked.
A significant analysis on the energy efficiency of the building envelope of CHs was conducted by Tong Y et al. [12]. The authors assessed the energy consumption of container houses for heating under different types of building envelope insulation, using the climatic data in the Yanquing area, China, during the Beijing 2022 Olympic and Paralympic Winter Games. The authors conclude that adhering to NZEB standards for the U-values of the envelope, by carefully selecting the thickness and type of insulation based on the service life of the container house, can lead to an approximate reduction of 21.4–32.8% in heating energy consumption compared to the original configuration of the container house.
Even in the social sphere, CHs are making a significant contribution. As highlighted in [13], while addressing the issue of homelessness has traditionally fallen within the purview of public institutions, non-profit organizations, and volunteer groups, there has been a notable surge of interest among social entrepreneurs in the reuse of modular systems for the homeless. The focus has shifted towards repurposing impractical spaces, such as shipping containers, and creating alternative housing solutions such as ‘upcycled dumpster homes’ that utilize recycled materials. These advancements underscore the growing need for flexible, creative, market-driven housing solutions, emphasizing the fundamental role of CHs in providing accessible and eco-friendly housing options for the homeless.
Even in Europe, the use of containers is experiencing significant growth thanks to their versatility. In ref. [14], Kuzmicz et al. analyzed how, in Europe, the importance of repositioning empty containers is significantly accentuated by the presence of the One Belt One Road, the new Silk Road that facilitates commercial connections between Asia and Europe, and by the significant shifts of containers from maritime to rail routes. For this reason, several European countries are adopting CHs to meet temporary housing needs, such as housing for refugees and displaced individuals, as well as for long-term projects such as student housing and recreational facilities.
As evidenced by numerous studies in the literature, the development of these housing solutions and the analysis of their energy efficiency are spreading in many regions of the world due to their significant energy and social impact. This study will specifically focus on what is happening in Europe, examining the adoption and effectiveness of container homes in the European context.
In the available literature, there are only a few articles concerning the energy analysis of container homes located in Europe. Among these papers, an interesting analysis of the use of this construction type is conducted by Shen et al. in [15], in the locations of Rome, Berlin, and Stockholm. The authors investigated the adaptation of shipping containers into environmentally conscious living modules, considering future climatic challenges. They proposed a conceptual design that emphasizes low energy consumption, integrates passive strategies and renewable technologies, and anticipates extreme weather conditions, highlighting the need to improve thermal resistance and hygrothermal capacity for container repurposing, especially in warmer climates. In this regard, the container houses can also be part of RES (Renewable Energy Source)-based energy communities [16]. In [17], efficient solutions to minimize energy consumption are proposed. The results show how combining insulation, natural ventilation, and types of glazing can significantly reduce energy consumption.
The use of RESs and optimal control strategies [18] are the enabling tools to integrate container houses in the residential building sector.

The Aim of the Paper

The current study aims to evaluate the energy efficiency of shipping container homes in various locations across the European Continent. With a comprehensive analysis involving thirty EU countries, the main objective is to understand the adaptability of these structures in different climatic conditions. The following analysis represents Climatic Zoning for Buildings (CZB) [19], with specific reference to the construction type of CHs.
In the last decade, the importance of Climatic Zoning for Buildings (CZB) has garnered increasing interest. CZB has emerged as a crucial strategy to mitigate the environmental impact of building energy consumption. It must be considered that existing and future buildings are expected to be the most significant source of greenhouse gas emissions by 2040 [20]. CZB refers to the practice of classifying climatic zones to better understand how climatic factors influence building energy consumption. This practice helps design more energy-efficient buildings adapted to the specific environmental conditions of a particular geographic area. In the available literature, there are various methodologies for Climatic Zoning for Buildings (CZB) [19] as there is no single reference standard. Indeed, the correlation between climatic factors and building energy consumption varies based on geographical region.
Initially, in the present work, a detailed climate analysis was conducted to provide a clear picture of the prevailing thermal conditions in various European locations and to identify the main challenges that must be addressed to ensure the proper functioning of CHs in these environments. The approach employed in the present work is similar to the one used by Tsikaloudaki K et al. in ref. [21], who mainly focused on the generic geometry approach defined in EN 15265 [22] and ISO 13790 [23] and not on the specific use of CHs.
Subsequently, in the current study, the analysis focused on six locations within the European community, identified for their vulnerability to seismic risk according to the ESHM20 Euro Mediterranean Seismic Hazard Model [24]. The aim of this study was to carefully assess the behavior of container homes in post-disaster temporary housing situations, taking into account significant variations in climatic conditions, geometry, and exposure to solar radiation.
The analysis was designed to precisely identify the optimal configuration of container homes in these delicate and high-risk contexts, with the goal of providing efficient and robust housing solutions for communities affected by catastrophic events.
The novelty of this study lies in its comprehensive analysis of the energy efficiency of container homes across various European locations, with a particular focus on the adaptability of these structures under different climatic conditions. Moving away from previous research that generally concentrated on CZB or overall building energy efficiency, this work specifically highlights the unique aspects of container homes. It delves into how climatic factors, geometric variations, and solar radiation exposure distinctively affect these homes, especially in the context of temporary housing. A key novelty of this research is the development of empirical correlations to calculate the thermal loads necessary for these innovative housing solutions. These correlations provide a method for assessing the energy efficiency of container homes in various scenarios, thereby making a significant contribution to the design and planning of efficient and effective housing in diverse environmental settings.

2. The Proposed Approach

In this section, the methodology used for the energy analysis performed in the present study is examined. Initially, the climatic macrozone of interest, where the simulations were conducted, is described. Subsequently, the geometry of the container house in the three different configurations of the case studies is defined. The geometry, thermal characteristics of the building envelope components, and usage profiles of the units under study are then examined in detail.

2.1. Areas of Interest

For this analysis, 30 locations across the European continent were examined. As can be seen in Figure 1, the sample selection was made to ensure a consistent coverage of the European continent both geographically and in terms of climate. Consequently, areas with colder climates, as well as temperate and warmer zones, were identified. In Table 1, the locations of interest are listed, along with their Köppen–Geiger climate classification group [25].

2.2. Container Energy Model

2.2.1. Geometry

The dimensions of the container have been carefully evaluated in the case study, considering international and European standards. The selected containers are from Hapag-Lloyd [27], one of the leading German-based global ocean carriers, serving approximately 23,700 customers on 121 routes worldwide [28]. In particular, models with ISO Size Type Codes 42G0, 42G1, 22G0, and 22G1 have been considered. In the case study, three configurations of container module assembly are compared. The specifications are reported in Table 2.
In this work, three geometry scenarios are examined, the first involving a single container (a), the second involving two containers placed side by side in a right-angle configuration (b), and the third involving two stacked containers (c). The geometry of the three scenarios was created using AutoCAD v.2023 and SketchUp v.2017 software [29,30] (Figure 2).

2.2.2. Container Envelope

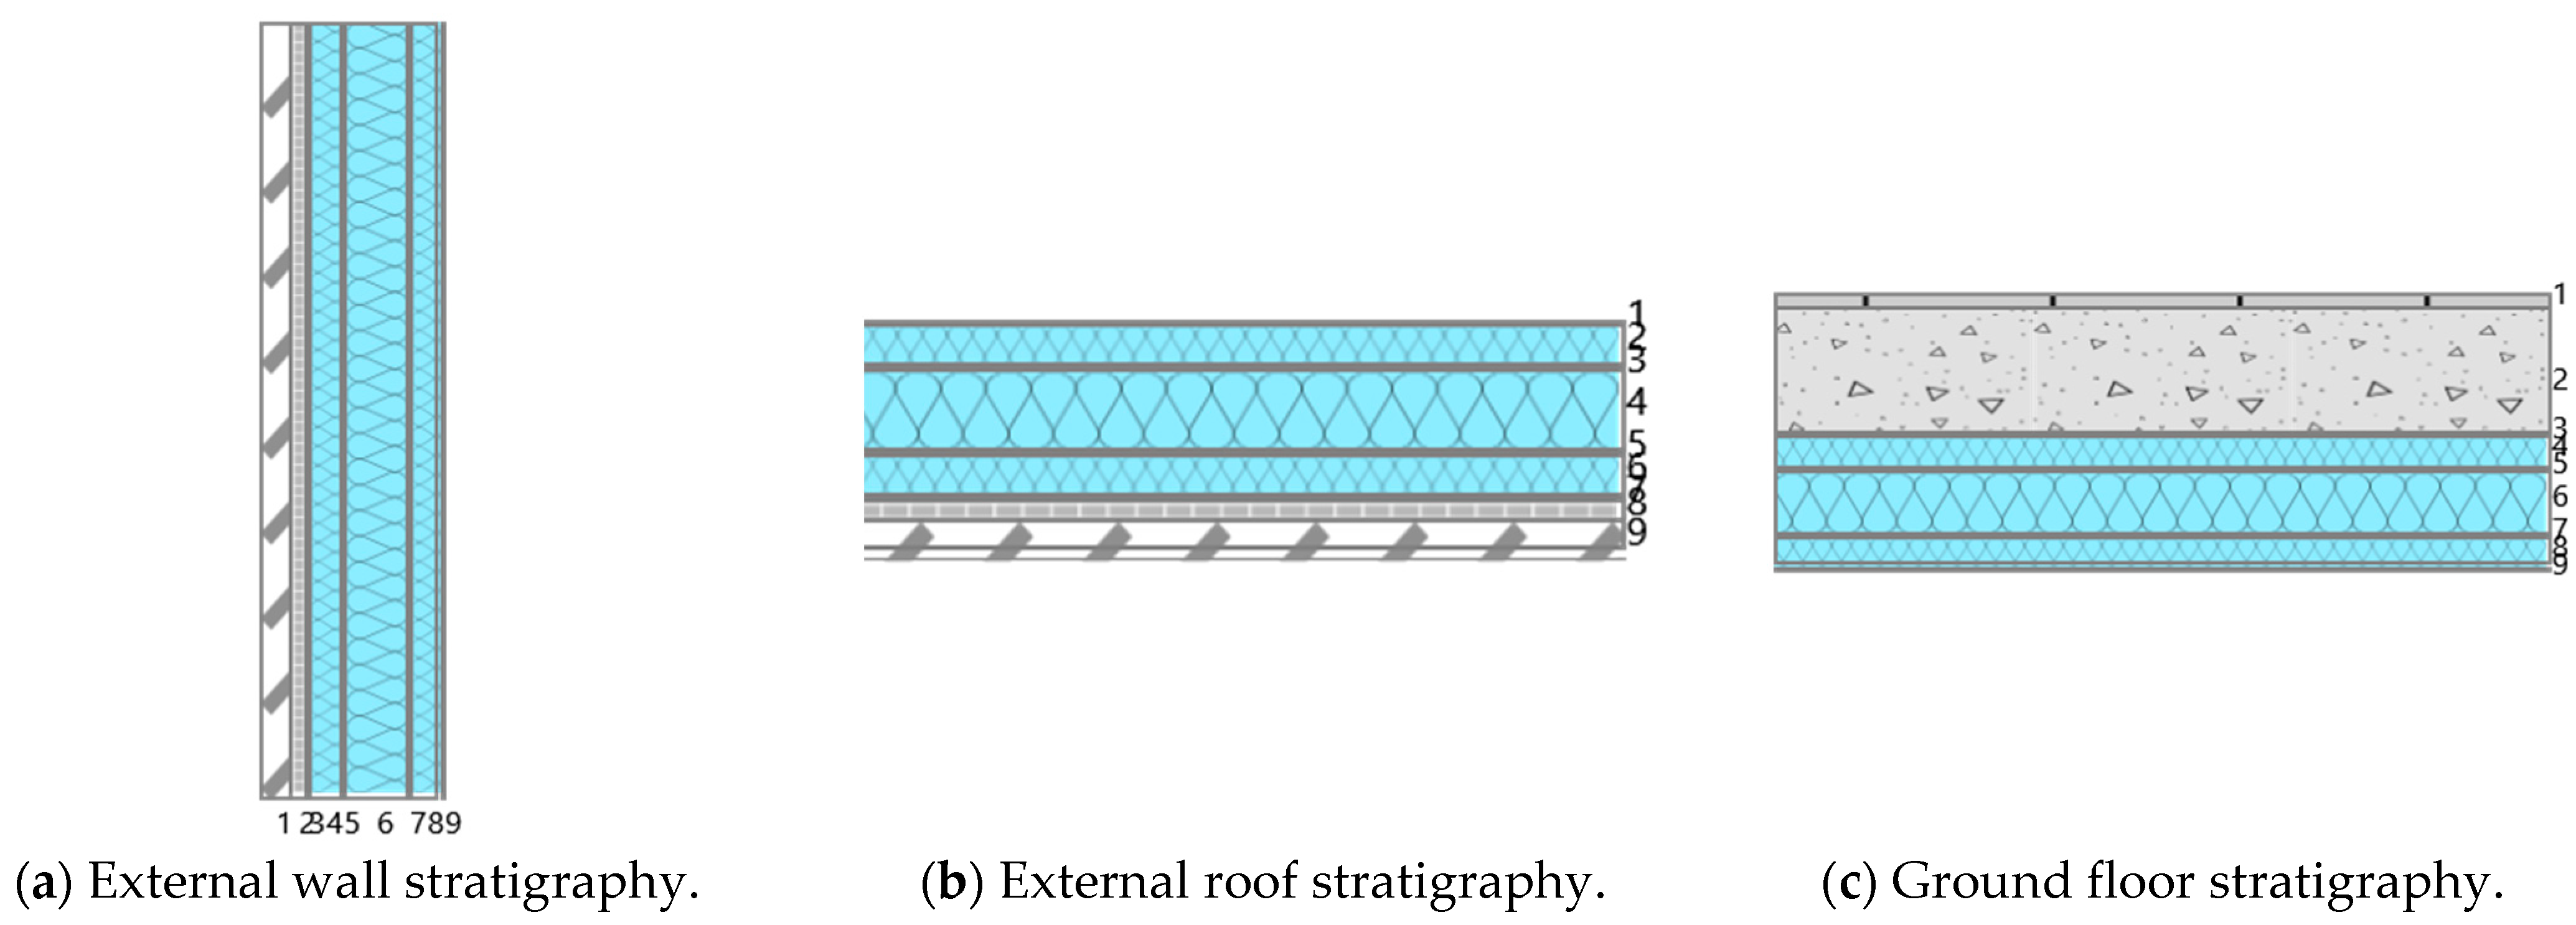
The analysis of the building components constituting the envelope of the CHs is reported below. Two prefabricated sandwich panels of the aluminum/polyurethane type were considered, positioned side by side and connected by an additional layer of thicker polyurethane (Figure 3). This approach aligns with a similar stratigraphy investigated by Dumas et al. in ref. [11], where a mobile container system called ZETHa (Zero Energy Temporary Habitation) is analyzed, utilizing water circulation within the walls. Specifically, in the present study, the same sequence of layers was considered, except for the water circulation layer. The alternating layers of steel and polyurethane are designed to deliver effective thermal insulation while ensuring robust structural resistance (Table 3). The choice of polyurethane was driven by its lightweight nature, contributing to the modularity of the structure and facilitating the assembly and adaptability of the container’s design. The opaque components listed below are common to the three geometry scenarios (a)–(c).
Among the three geometry scenarios considered (Figure 2), the building components remain unchanged. The main variation lies solely in the dimensions of the calculation surfaces among the different models and the variations in exposure. In essence, the fundamental structure remains constant, highlighting how the variations are focused on specific aspects such as the extent of the involved surfaces and the arrangement concerning exposure.
In Table 4, the main characteristics of the building envelope are provided, including thermal transmittance, thickness, and the total solar transmittance factor (g-value) for windows.

2.2.3. User Description

To assess the heating and cooling thermal load of these buildings, thermal zones have been created in the TRNbuild [31] environment using the previously developed floor plans and architectural models. As shown in Figure 4, the “(a) Single Module” configuration consists of three thermal zones, while both the “(b) Adjacent Modules” and “(c) Stacked Modules” configurations each comprise five thermal zones. Below are the distinct thermal zones for the three configurations, along with their respective specifications (Table 5).
For the three identified scenarios, the room usage profiles have been set with a heating set point temperature of 20 °C from 9:00 a.m. to 8:00 p.m. Outside of these hours, heating has not been planned. Similarly, a cooling set point of 26 °C has been established for the same time frame, with no cooling provided for the remaining hours.
The same has been done for the assessment of the internal load due to people. A load of 60 kJ/h for the convective fraction and 6 kJ/h for the radiative fraction has been assigned for each occupant of the building according to the hourly occupancy profile reported in Figure 5.

2.3. Climatic Classification

The optimal management of energy consumption plays a fundamental role in sectors related to construction, especially when it comes to implementing innovative solutions such as container homes. In the European context, where climatic variations can be significant from region to region, a thorough understanding of local climate patterns is essential to ensure energy efficiency and living comfort. In the context of this study, the focus of this work is on climatic classification related to the use of container homes in Europe. Two fundamental metrics, Cooling Degree Days (CDDs) and Heating Degree Days (HDDs), will emerge as key indicators for the efficient design and optimized operation of container structures in response to climatic variations.
The goal is to explore how these metrics can influence the design and utilization of container homes, thereby contributing to the development of sustainable housing solutions adaptable to the specific climatic conditions of each European region.
Cooling Degree Days measure the thermal excess above a base temperature during warm climatic periods. On the other hand, Heating Degree Days assess the heating requirement based on temperatures below the base temperature selected for the heating period. The calculation is expressed as follows:
H D D = I = 1 365 ( T a T i )   +
C D D = I = 1 365 ( T i T b )   +  
where Ti is the daily average air temperature; Ta is the base temperature for calculating HDDs; and Tb is the base temperature for calculating CDDs.
The choice of the base temperature for calculating Heating Degree Days (HDDs) and Cooling Degree Days (CDDs) is influenced by several factors, including the specific human physiology of the region, energy supply, economic development level, and the characteristics of temperature changes (Shi et al., 2018 [32]). This variability is clearly reflected in the base temperatures adopted in different regions of the world. For instance, in the United States, the traditional value is 18.3 °C; in the United Kingdom, it stands at 15.5 °C, while in Germany, it is 15.0 °C [33]. It is interesting to note that, despite these regional differences, the American Society of Heating, Refrigerating, and Air-Conditioning Engineers (ASHRAE) establishes a common neutral base temperature of 18.3 °C, which is applied in both heating and cooling contexts [34,35,36]. This value is a result of empirical observations evaluated over extended periods, which have shown that internal and solar contributions tend to offset thermal loss when the average outdoor daily temperature is around 18 °C. Additionally, the observations have shown that with respect to such temperature values, energy consumption becomes proportional to the difference between the daily mean temperature and the base temperature [37].
As highlighted by numerous studies in the literature, the choice of a base temperature of 18 °C for assessing HDDs is appropriate for locations in the European Union [38]. However, for calculating CDDs, there is no universally accepted reference across Europe. Therefore, in the following section, a specific analysis was conducted to accurately determine the base temperature, ensuring that CDD values can be calculated even for colder locations where cooling demand is low.

2.3.1. Climate Characterization of Thermal Zones

Based on the climatic data from the selected sites, the concept of Heating Degree Days (HDDs) and Cooling Degree Days (CDDs) has been considered to define the climatic zones in the European region under study. Specifically, concerning the calculation of CDDs, various methodologies have been proposed to identify the most suitable method for comparing different locations. The calculation was performed using specific hourly climatic data for each location, obtained through dynamic simulations using the TRNSYS v.18 software. In detail, CDDs were assessed through the following cases:
(1)
CDDs with reference to the mean daytime temperature, considering a Tb of 25 °C;
(2)
CDDs with reference to the maximum daytime temperature, assuming a Tb of 25 °C;
(3)
CDDs with reference to the mean temperature, considering a Tb of 18.3 °C (ASHRAE approach).
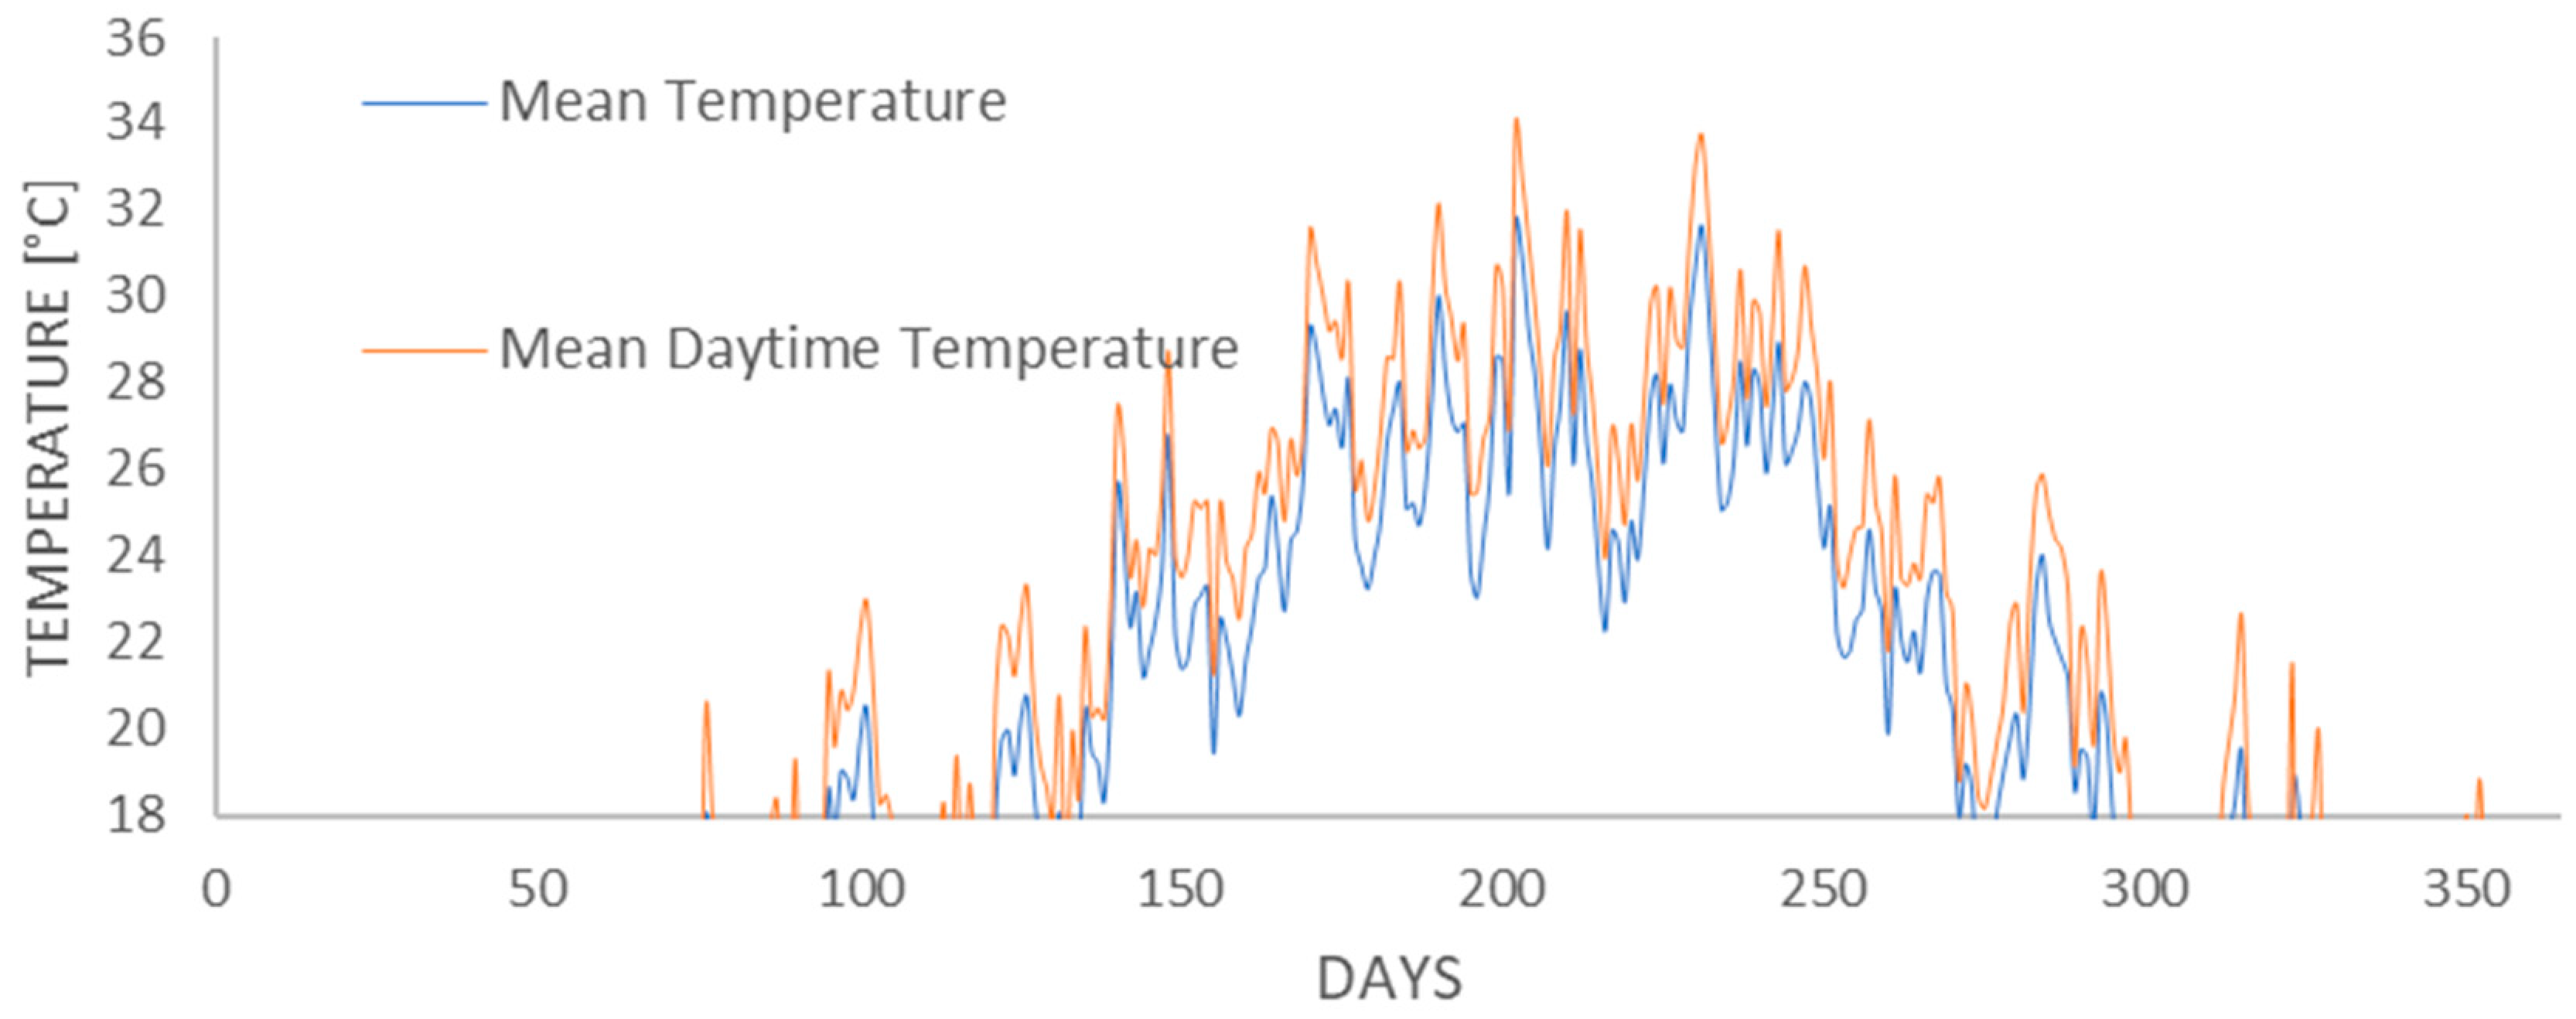
In cases (1) and (2), the average temperature (Ti) in (2) was estimated by calculating the average of the external temperatures recorded during hours when the “total incident solar radiation” exceeded a determined threshold of 800 W/m2. This term refers to the cumulative measurement of solar radiation impacting surfaces oriented north, south, east, west, and horizontally, assessed hourly. This approach was chosen due to the significant influence of incident solar radiation on climate conditions, especially in the summer season.
Using this criterion, the “average diurnal temperature” was calculated.
Figure 6 provides a graphical comparison, where the y-axis starts at 18 °C since temperatures below this threshold do not significantly contribute to the calculation of CDDs.

2.3.2. CDD Calculations in Case (1)

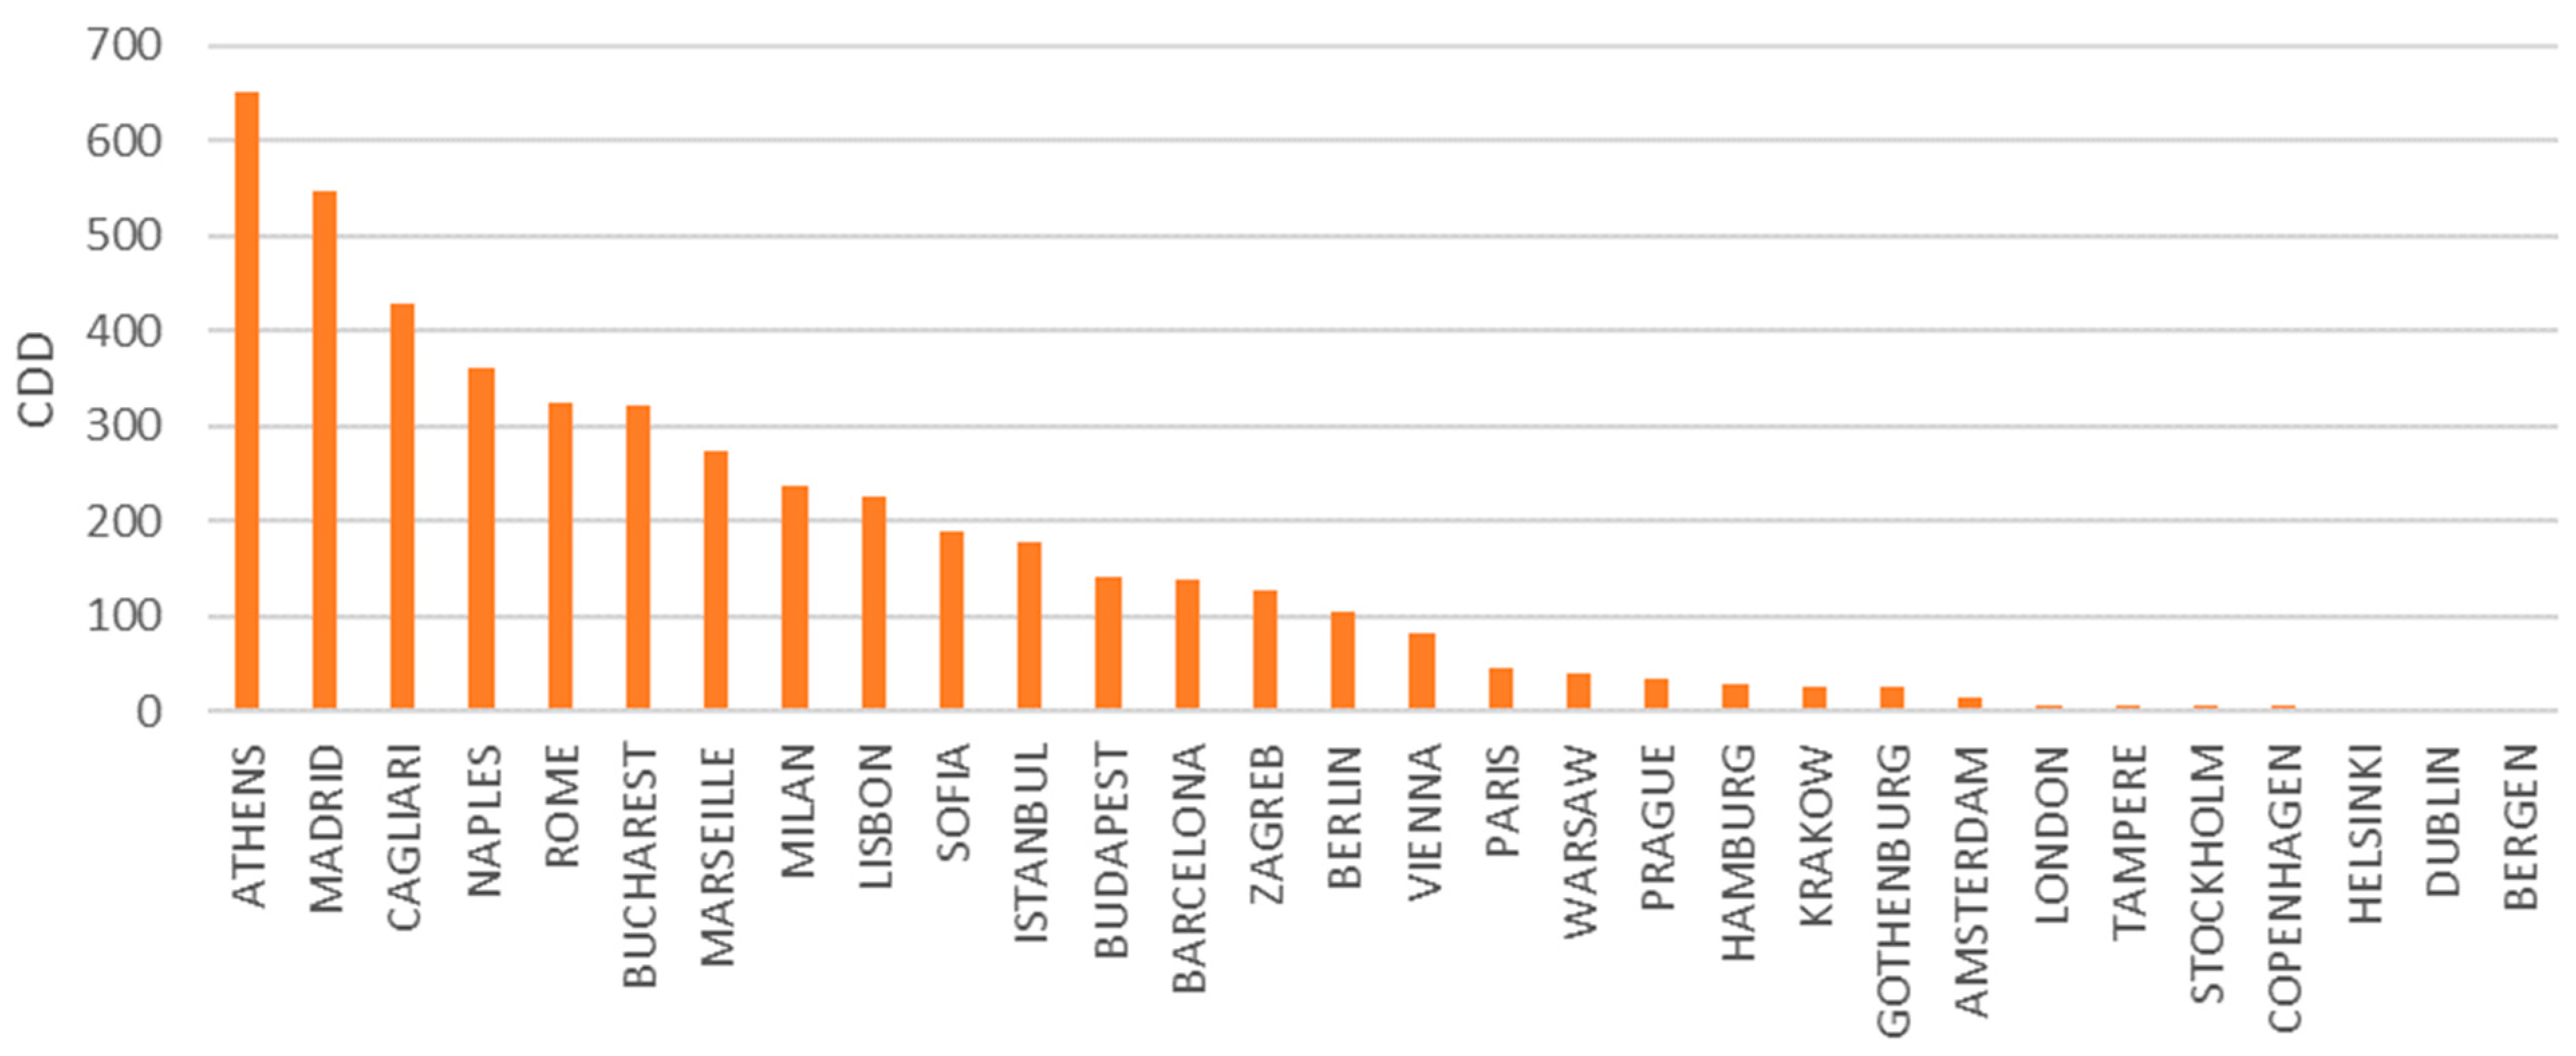
This paragraph presents the CDDs for the specific locations, evaluated by considering a temperature Ti equal to the mean daily daytime temperature, as described in the previous section. The base temperature Tb was set at 25 °C, interpreted as the internal set-point temperature for the comfort conditions of the locations analyzed during the cooling season. The results are reported in Figure 7.
For colder locations such as Tampere, Gothenburg, Helsinki, Dublin, and Bergen, the calculation of CCDs (Continuous Cooling Degree Days) based on the daily average diurnal temperature does not yield values above zero. This limitation is due to the specific climatic conditions in these areas. In particular, the selected zones do not experience any day throughout the year where the daily average diurnal temperature exceeds 25 °C.

2.3.3. CDD Calculations in Case (2)

This paragraph presents the CDDs for the specific locations, evaluated by considering a temperature Ti equal to the max daily daytime temperature. The results are reported in Figure 8.
In this case, CDD values are observed even in the coldest locations, except for Helsinki and Bergen. Tampere, Gothenburg, and Dublin show positive CDD values, indicating periods when temperatures surpass the reference level of 25 °C. The approach based on the maximum daily daytime temperatures for calculating CDDs offers advantages in this regard. This method provides a dynamic and precise view of daily temperature variation, effectively identifying periods of high temperatures. Particularly useful for capturing prolonged heat episodes, it contributes to an accurate assessment of climatic conditions. Compared to other metrics based on daily average or minimum temperatures, this approach provides a detailed representation of significant temperature variations.

2.3.4. CDD and HDD Calculations in Case (3)

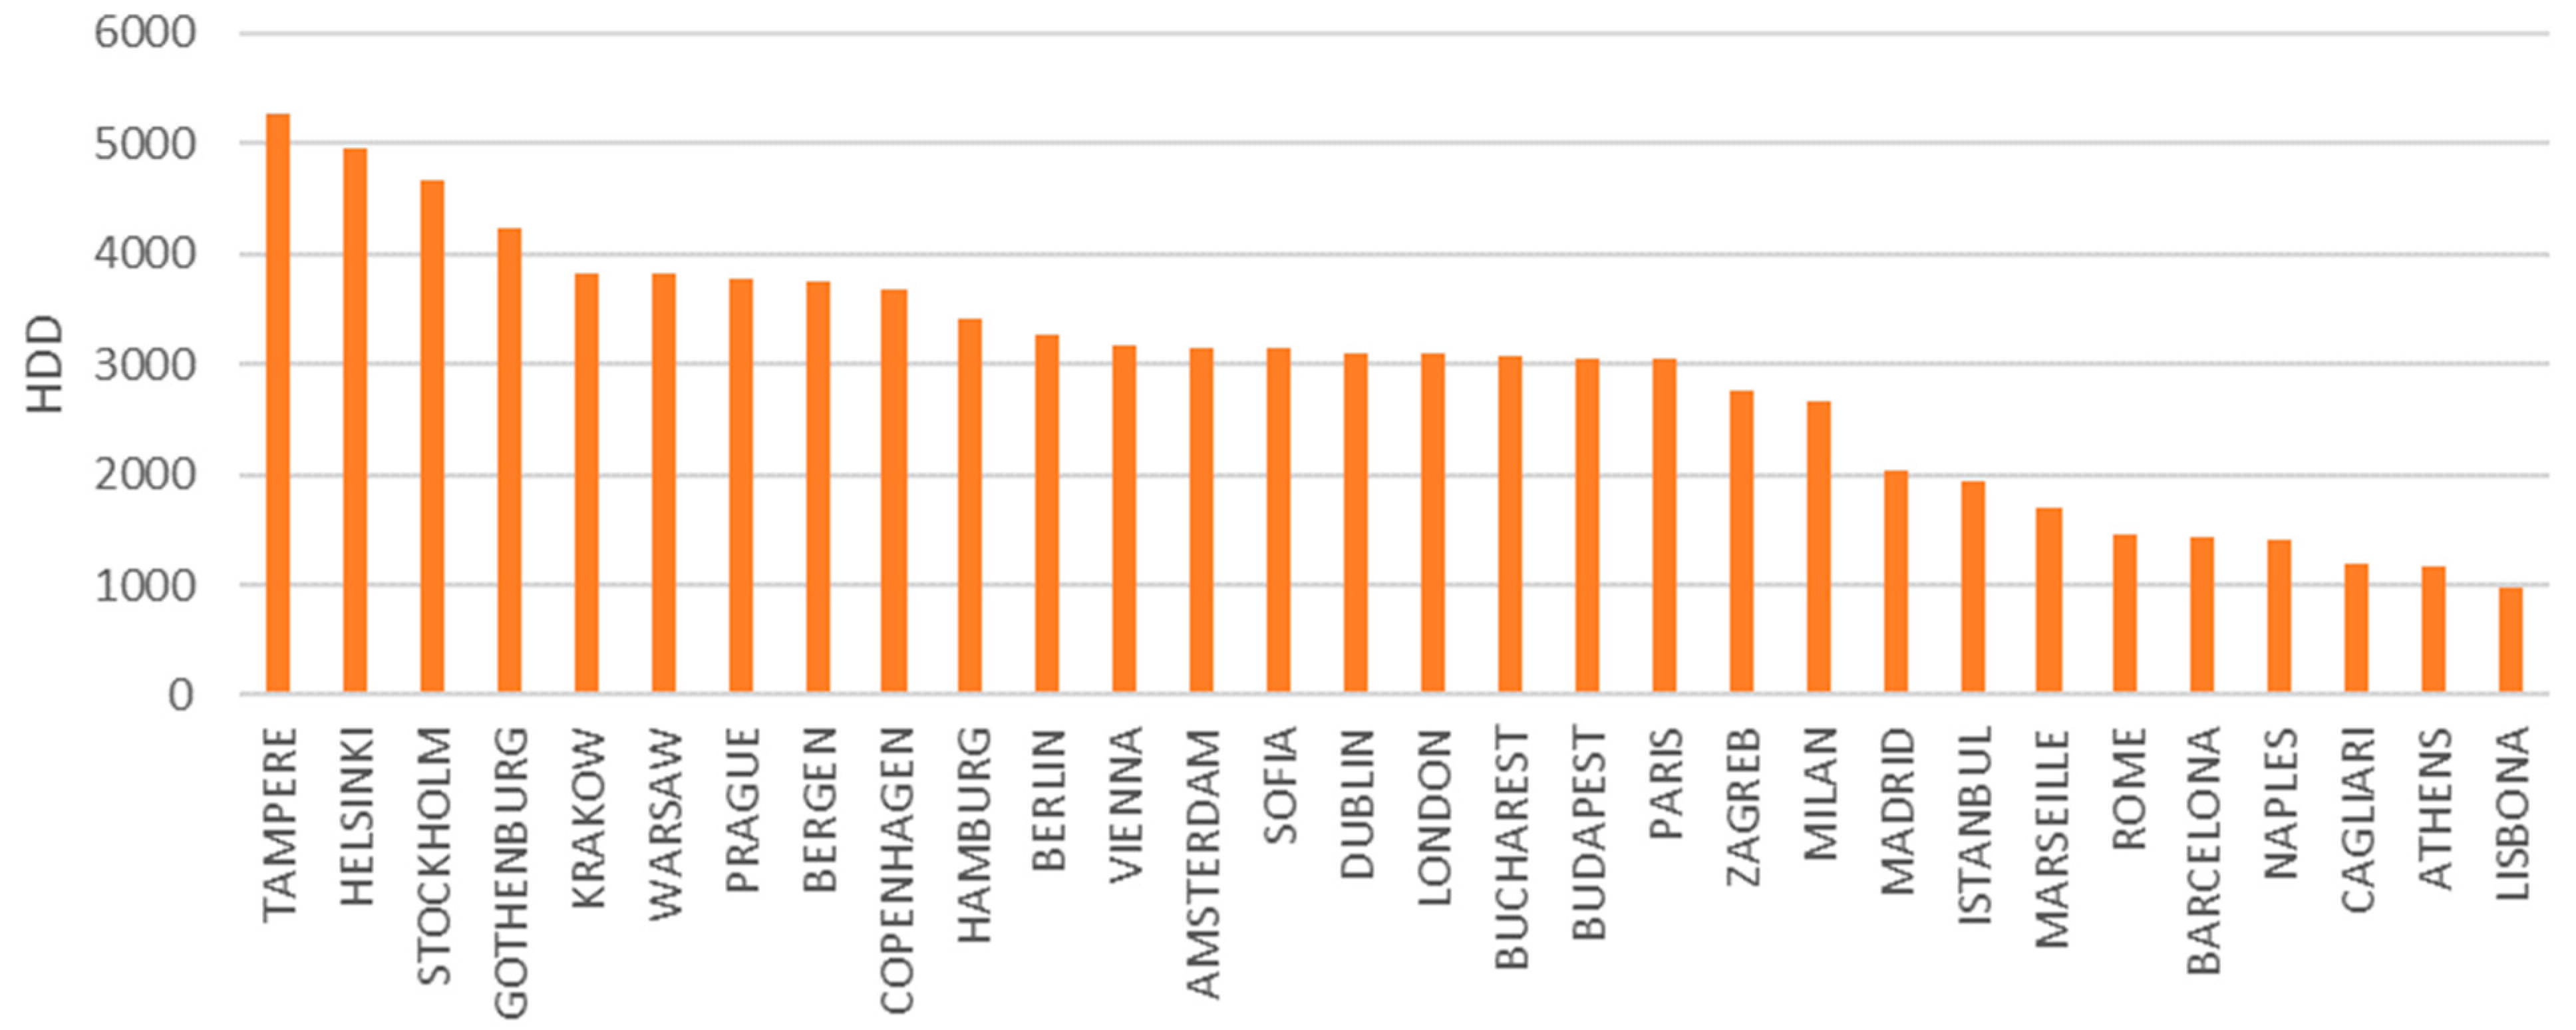
This paragraph presents the analysis of climatic zones in accordance with the European ASHRAE directives. As highlighted in the previous analyses, the selection of a base temperature Tb of 25 °C is the representative choice for Southern European regions, characterized by heightened susceptibility to climatic fluctuations. Conversely, for colder climate areas, it is advisable to adopt a lower Tb value to obtain meaningful Cooling Degree Days (CDDs). Consequently, the analysis proceeds to examine both CDDs (Figure 9) and Heating Degree Days (HDDs) (Figure 10) under the assumption of a Tb of 18.3 °C.
Figure 10, with a baseline temperature (Tb) of 18.3 °C, shows more significant CDD values for all cities, highlighting a greater cooling requirement compared to the other approaches.
As can be seen in Table 6, the disparity among the cases underscores the significant impact that the choice of baseline temperature and calculation methodology has on the evaluation of Cooling Degree Days (CDDs). Specifically:
-
Case 1 generally exhibits the lowest CDD values. This suggests that by focusing solely on diurnal temperatures during the hottest hours, a lower estimation of degree days is obtained, indicating a potentially reduced cooling load.
-
Case 2, on the other hand, displays generally higher CDD values compared to Case 1, yet these are lower or similar to those of Case 3. This implies that the calculation methodology, which is based on the daily maximum temperature with a very low baseline temperature, leads to a mid-range estimation of CDDs. This could reflect a balance between assessing exceptionally hot days and a general average of temperatures.
-
Case 3 demonstrates the highest CDD values in almost all areas. This indicates that using a standard baseline temperature of 18.3 °C and considering the daily average temperature leads to a higher estimation of degree days, suggesting a greater cooling load.
In summary, Case 1, with its focus on daytime temperatures, tends to underestimate CDDs compared to the other two methods. Case 2, utilizing the daily maximum temperature, provides a median estimate, while Case 3 tends to overestimate CDDs. These variations highlight the importance of parameter selection in CDD evaluation, which can significantly differ depending on the chosen method.

2.3.5. Proposed Approach to Climate Characterization

In this section, a simplified approach to characterizing the climate of thermal zones, based on the parameters of CDDs (calculated as the average of CDD values assessed in the previous cases), HDD18 (Heating Degree Days assessed with a base temperature Ta of 18.3 °C), and solar irradiance, is outlined.
The climate characterization presented here is derived from a comprehensive analysis of each of the three key parameters: CDDs (Cooling Degree Days, evaluated as the average of the three cases seen earlier), HDDs (Heating Degree Days), and solar irradiance. For each parameter, different climatic zones have been categorized into six distinct groups, from “A” to “F”, using quantiles. The categorization was performed separately for each parameter, thus providing a detailed and specific overview of the climatic characteristics of each zone. The reference ranges used for this categorization, which are detailed and specific for each parameter, are provided in the subsequent tables: Table 7 for CDDs, Table 8 for solar irradiance, and Table 9 for HDDs. The values obtained for the respective ranges have been rounded to the nearest whole number.
Starting from the initial characterizations based on individual climatic parameters—Cooling Degree Days (CDDs), Solar Irradiance, and Heating Degree Days (HDDs)—a comprehensive and integrated climatic classification has been developed. This classification aims to provide a more holistic understanding of the needs and climatic characteristics of each location.

3. Discussion and Results

In this chapter, the obtained results are examined and their implications and relationships with existing theories are discussed.
In the first section, the collected data and the results of the climate analyses are presented, followed by a comprehensive energy analysis of the container houses based on the assumed scenarios.

3.1. Characterization of Climate Zones

The process for developing the final climate classification, integrating the three parameters analyzed in Section 2.3.5, involved the following steps.
(1)
Initially, each location was categorized based on the three individual parameters. For Cooling Degree Days (CDDs) and Solar Irradiance, higher values indicative of warmer and sunnier conditions were assigned to Category A, descending to Category F for lower values. Conversely, for Heating Degree Days (HDDs), Category A represented lower values indicating milder conditions, ascending to Category F for higher values.
(2)
Next, the alphabetical categories were converted into numerical values. In this scale, A equated to 1, B to 2, and so forth, with a reverse scale applied for HDDs. A combined climate category for each location was determined by calculating the average of these numerical values across the three parameters.
(3)
Finally, the average numerical values were rounded to the nearest whole number and reconverted into alphabetical categories. This resulted in the final combined climate classification for each location.
The resulting combined climate classification for each location is presented in the following Table 10.
In a comparative analysis with the Köppen–Geiger climate classification in Table 1, various observations are made:
-
Warm Climates (Category A): It is observed that locations classified in Category A generally tend to correspond to the Köppen–Geiger categories Csa and Bsk, indicative of Mediterranean and semi-arid climates. This suggests a reasonable alignment for the warmer areas.
-
Moderate Climates (Categories B, C, and D): In these categories, a wide range of correspondences with the Köppen–Geiger classifications are highlighted, reflecting the diversified nature of temperate and transitional climates.
-
Cold Climates (Category F): A more pronounced alignment is noted for cold climates, where Category F aligns well with Köppen–Geiger’s Dfc and Dfb categories, indicating continental and subarctic climates.
The integrated climate classification thus offers a simplified, yet effectively outlined, perspective on climate necessities, proving particularly advantageous in residential contexts for evaluations of heating and cooling. Although this classification aligns commendably with the Köppen–Geiger system for extreme climates, it is important to emphasize that its simplified nature becomes more evident in temperate zones. In these areas, indeed, the Köppen–Geiger classification manages to provide a more meticulous and detailed distinction.

3.2. Energy Analysis: Three Scenarios for Container Homes

The results obtained from the energy analysis are presented, initially focusing on a single container, and then comparing the other two configurations.

3.2.1. Scenario 1: Single Module

For scenario 1, involving a single container, the analysis included the 30 locations identified in the preceding paragraphs. The primary objective of the analysis is to assess the heating and refrigeration load associated with each of the considered locations (Figure 11) in order to provide a detailed insight into the energy performance of the container in various environmental contexts.
The analysis of the climatic classification of different locations, based on parameters such as Cooling Degree Days (CDDs), Heating Degree Days (HDDs), and average solar irradiance, has proven to be consistent with the specific energy requirements of container homes in each location. It is crucial to highlight that there are significant correlations between the calculated thermal loads for container homes and the parameters used in the classification outlined in the previous section. The subsequent figures convincingly demonstrate the validity of these correlations.
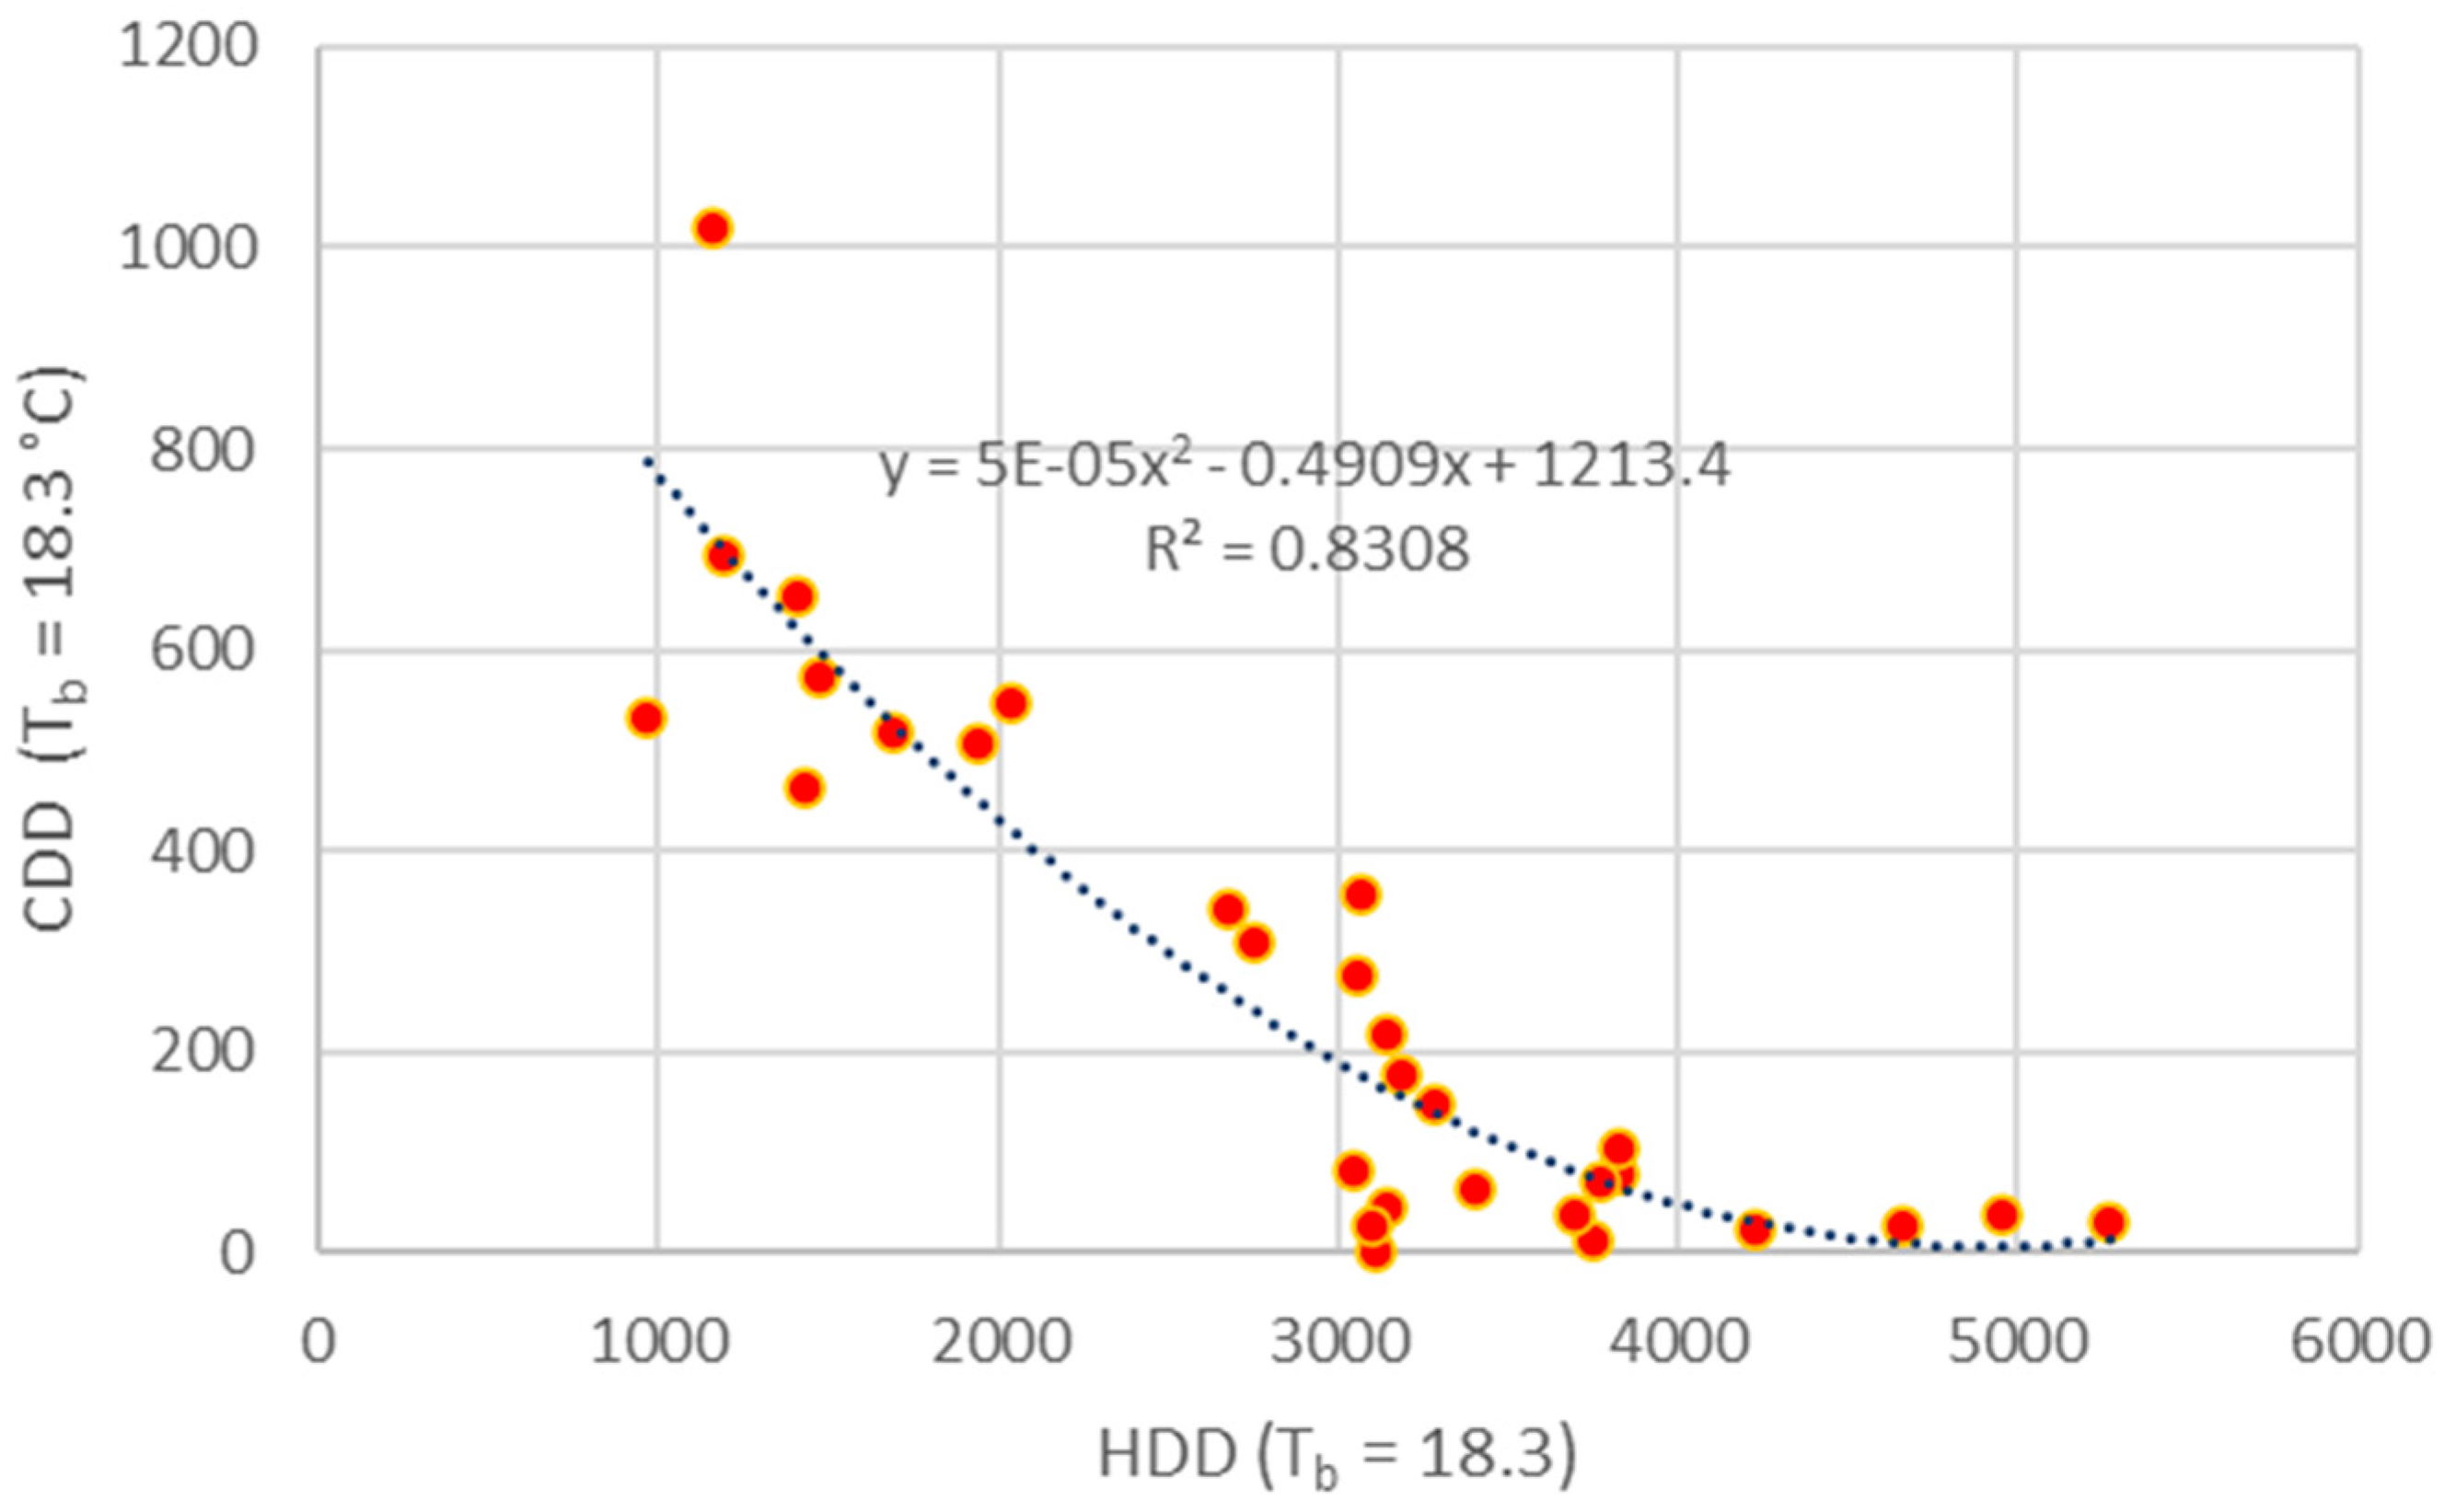
Figure 12 displays a scatter plot correlating Cooling Degree Days (CDDs) with Heating Degree Days (HDDs) at a specific base temperature (Tb = 18.3 °C). The data points, depicted as orange circles, represent pairs of CDD and HDD values for different locations. The curve, fitted by a quadratic equation, aligns with the data points and indicates an inverse relationship between CDDs and HDDs: as the number of heating days (HDDs) increases, the cooling days (CDDs) decrease, and vice versa. The coefficient of determination (R2 = 0.8308) signifies a good fit of the model to the observed data.
Figure 13 shows a scatter plot illustrating the relationship between Cooling Degree Days (CDDs) and the annual average of total solar irradiance. The curve, fitted with a quadratic equation, indicates a direct correlation where increased solar irradiance correlates with increased CDDs, which is consistent with the notion that higher solar irradiance leads to greater cooling requirements. The model’s fit is good, with an R2 value of 0.8162.
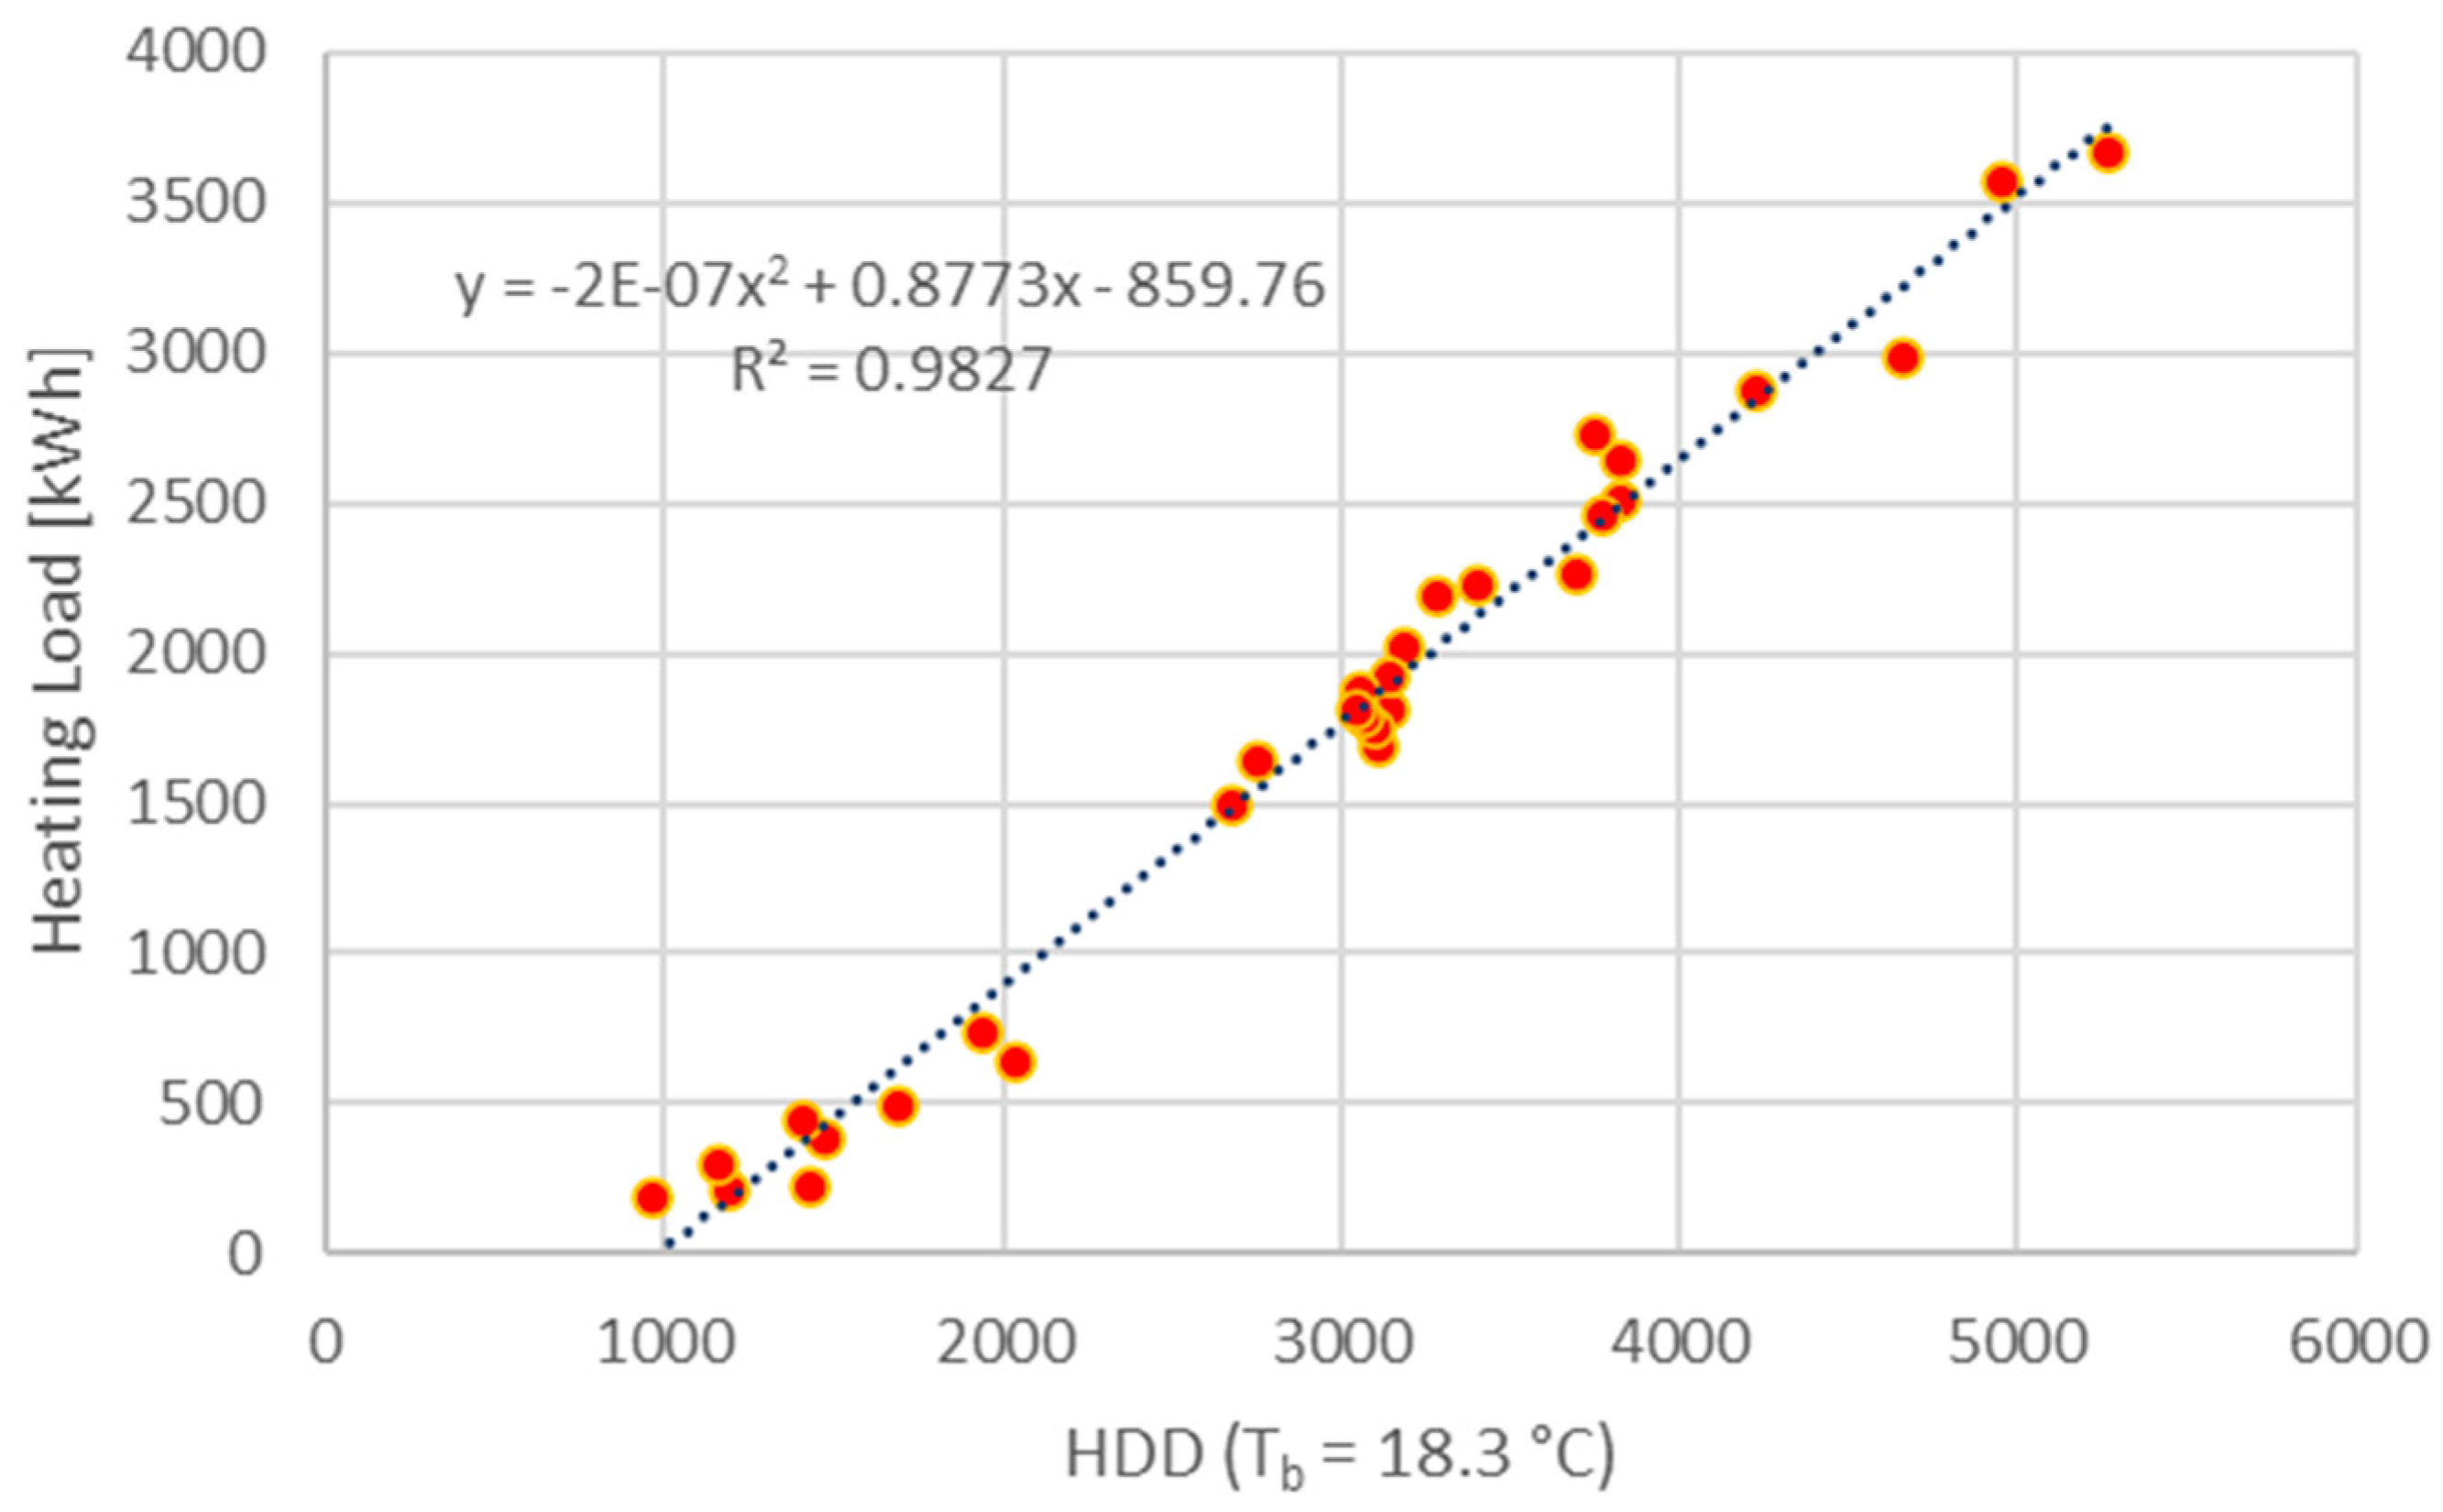
Figure 14 depicts the correlation between Heating Degree Days (HDDs) and the annual heating load. The scatter plot, also modeled by a quadratic equation, demonstrates a strong positive correlation, indicating that higher HDD values are associated with higher heating loads. The fit of the model is very strong, as reflected by the R2 value of 0.9827.
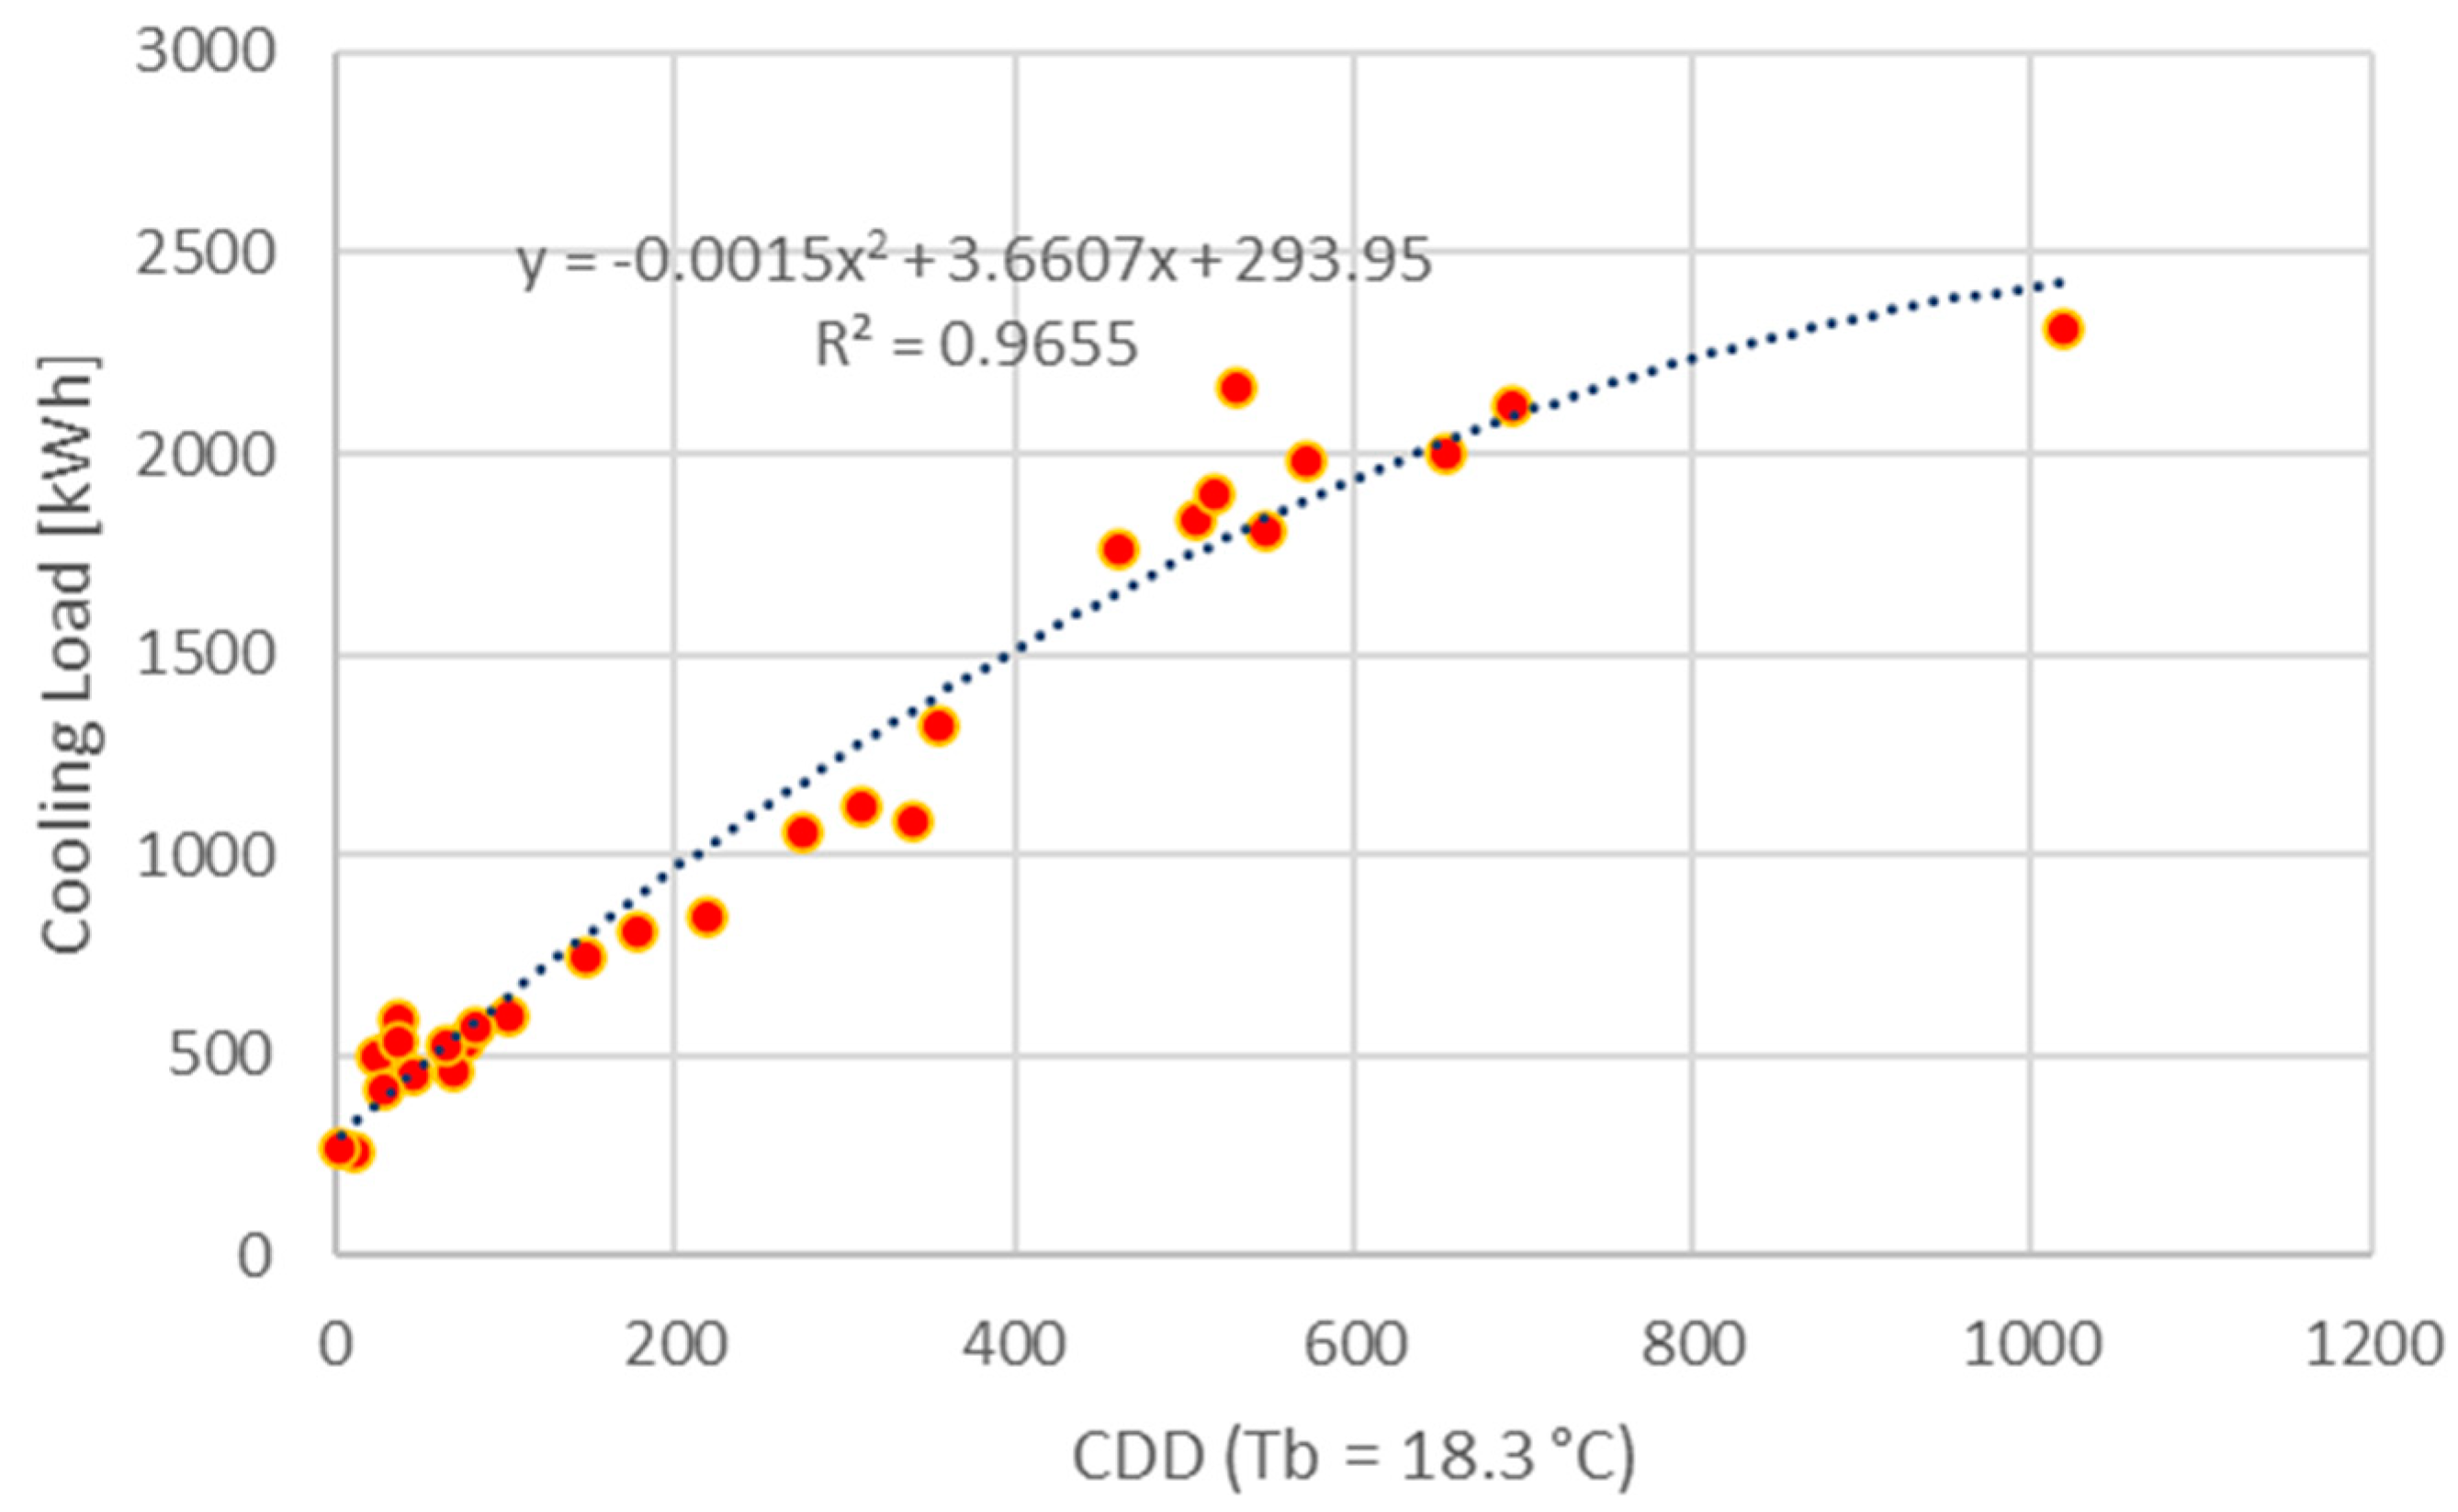
Lastly, Figure 15 presents a scatter plot that relates CDDs to the annual cooling load. This relationship is shown to be positively correlated as well, with higher CDD values leading to increased cooling loads. The quadratic model shows an excellent fit with an R2 value of 0.9655, underscoring the predictive strength of the climatic parameters for cooling energy requirements.
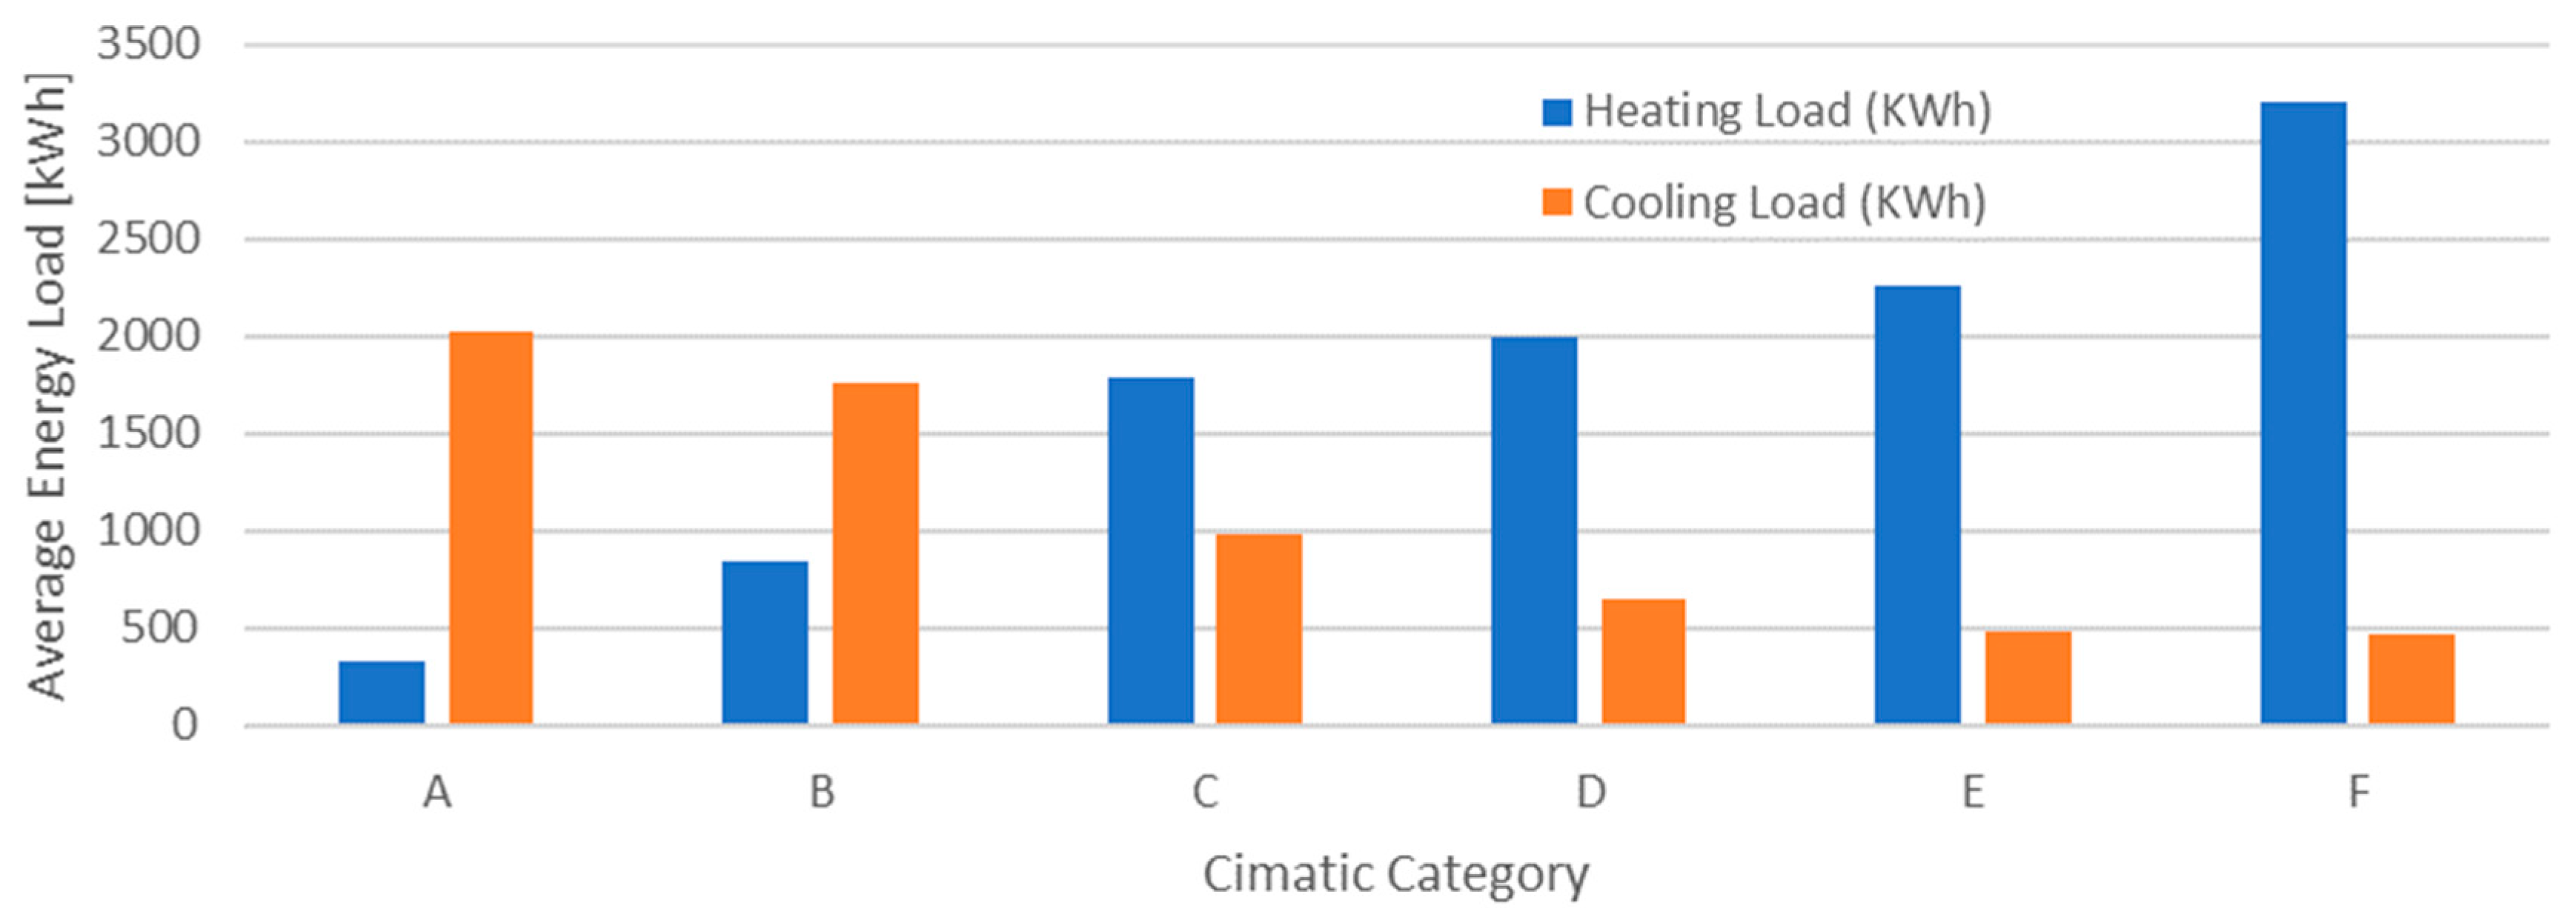
To illustrate the alignment between the observed thermal needs and the employed climatic classification, Figure 16 presents a clear depiction of the thermal requirements for the locations under study, categorized by each climatic zone. This analysis showcases how the findings are systematically and incrementally arranged in line with the chosen classification, revealing a logical and structured correlation between the energy demands and the climatic features of the various regions.

3.2.2. Comparison of the Three Scenarios: Single Module, Adjacent Modules, Stacked Modules

After examining the single-container module, the investigation extends to two additional configurations: an L-shaped container home, composed of two containers placed side by side, and a structure with two containers stacked on top of each other. This part of the analysis provides a broader understanding of variations in thermal and cooling loads in relation to the specific geometries of the dwellings. By comparing the results of these configurations in six carefully selected locations, the impact of different geometries on energy efficiency and living comfort was analyzed across a variety of climatic contexts. The locations were chosen based on their seismic vulnerability, in accordance with the “Euro-Mediterranean Seismic Hazard Model ESHM20”, thus highlighting the importance of container house configurations in post-disaster scenarios, specifically as “temporary housing” solutions.
The selected locations are Athens, Zagreb, Lisbon, Naples, Sofia, and Istanbul.
From the analyses (Figure 17), it appears there is a trend of increasing cooling demand with the rise in Cooling Degree Days (CDDs) when considering cities from Sofia to Athens. In particular, the “Stacked Modules” configurations show the greatest increase in energy demand with the rise in CDDs, indicating that these structures might require more energy for cooling in warmer climates.
Delving into specifics, the following are the obtained results (Table 11, Table 12 and Table 13):
These data points indicate that, generally, the energy requirement for heating significantly increases when transitioning from a single container to an L-shaped and then to a stacked configuration, while the demand for cooling shows a less pronounced but still significant increase. This highlights the importance of the spatial configuration of container houses in terms of energy efficiency, especially when considering the varied climatic needs of the European cities analyzed.
In addition, in this case, changing the module configuration corroborates the findings of the previous analysis: the climatic classification of different locations, based on parameters such as Cooling Degree Days (CDDs), Heating Degree Days (HDDs), and average solar irradiance, aligns consistently with the specific energy requirements of container homes in each location as their geometry and volume vary.

4. Conclusions

The paper presents a comprehensive analysis of the energy efficiency of various container house configurations in thirty European locations. The primary objective is to examine the adaptability of these residences to various climatic conditions, including climatic characterization (CZB), and compare it with the Köppen–Geiger system.
Within the context of the work, a climate characterization model has been developed using Heating Degree Days (HDDs), Cooling Degree Days (CDDs), and solar irradiance. The present analysis has demonstrated a significant correlation with the Köppen–Geiger classification, particularly in extreme climatic zones. This model emerges as a potentially effective tool for climate characterization in residential applications, opening new perspectives for urban planning and housing design.
Furthermore, the study has examined thermal and cooling loads in different locations, revealing a clear correlation between climatic classification and the specific energy requirements of container houses. This underscores how regional climatic characteristics can directly impact energy efficiency, especially in smaller residences such as container houses. A significant contribution of this research has been the development of empirical correlations for calculating the thermal loads required for these innovative housing solutions. These correlations represent practical and usable tools for evaluating the energy efficiency of container houses in various climatic conditions, which is crucial for designing and planning sustainable and adaptable housing, taking into account the variability of environmental conditions.
Moreover, the study analyzes how the arrangement of container modules influences energy efficiency and thermal comfort, particularly in post-disaster scenarios, where the prompt implementation of temporary structures becomes vital.
Future developments could investigate the impact of various materials and technologies for these types of housing solutions, such as the use of smart windows and phase change materials. Additionally, the embodied energy of the materials used to repurpose shipping containers for residential use could be evaluated to effectively assess the efficiency of these solutions, both in terms of energy payback and carbon payback.
The conclusions of this research unequivocally indicate that a holistic approach, considering both energy efficiency and the well-being of inhabitants, is essential for the development of sustainable, adaptable, and comfortable housing solutions. This approach is fundamental in addressing contemporary challenges related to the environment and society.

Author Contributions

Conceptualization, R.D.F. and A.M.; Methodology, R.D.F. and D.M.L.; Software, D.M.L.; Validation, R.D.F. and A.M.; Investigation, D.M.L.; Resources, R.D.F. and A.M.; Data curation, D.M.L.; Writing—original draft, D.M.L.; Writing—review & editing, R.D.F., D.M.L. and A.M.; Supervision, R.D.F. and A.M. All authors have read and agreed to the published version of the manuscript.

Funding

Mauro and Laudiero gratefully acknowledge the financial support of project PRIN 2020 “Optimal refurbishment design and management of small energy micro-grids-OPTIMISM”, Prot. 20204NXSZH, CUP I65F21001850006, Ministero dell’Università e della Ricerca (MUR). The APC was funded by Rafal Damian Figaj.

Data Availability Statement

Data will be available on request.

Conflicts of Interest

The authors declare no conflicts of interest.

Nomenclature

Abbreviations
CHsContainer Houses
THsTemporary Housing
CZBClimatic Zoning for Buildings
Degree Days and Related Temperatures
HDDHeating Degree Days
CDDCooling Degree Days
HDD18Heating Degree Days (Base temperature of 18.3 °C)
CDD18Cooling Degree Days (Base temperature of 18.3 °C)
T Temperature ,   K
TaBase Temperature for calculating HDD (K)
TbBase Temperature for calculating CDD (K)
Thermal Parameters
c Specific heat, J / ( k g K )
k Thermal conductivity, W / ( m K )
ΡDensity, kg/m3
g-valueTotal Solar Transmittance factor
ItotTotal solar irradiance, W/m2
Köppen Climate Classification
CfbTemperate oceanic climate with mild summer
CsaMediterranean climate with hot summer
CfaHumid subtropical climate
DfbHumid continental climate with warm summer
BskCold semi-arid climate
DfcSubarctic climate with cool, short summer
CscMediterranean climate with cool summer

References

  1. Bertolini, M.; Guardigli, L. Upcycling Shipping Containers as Building Components: An Environmental Impact Assessment. Int. J. Life Cycle Assess. 2020, 25, 947–963. [Google Scholar] [CrossRef]
  2. Ma, L.; Shibasaki, R.; Kadono, T.; Ishikura, T.; Ieda, H. An Estimation of the International Container Shipping Transport Volumes Among Asian Counrties by Global Trade Analysis Project Model and Its Applications to FTA and Transport Improvement Scenarios. J. East. Asia Soc. Transp. Stud. 2005, 6, 920–935. [Google Scholar]
  3. Giriunas, K.; Sezen, H.; Dupaix, R.B. Evaluation, Modeling, and Analysis of Shipping Container Building Structures. Eng. Struct. 2012, 43, 48–57. [Google Scholar] [CrossRef]
  4. Bernardo, L.F.A.; Oliveira, L.A.P.; Nepomuceno, M.C.S.; Andrade, J.M.A. Use of Refurbished Shipping Containers for the Construction of Housing Buildings: Details for the Structural Project. J. Civ. Eng. Manag. 2013, 19, 628–646. [Google Scholar] [CrossRef]
  5. Grȩbowski, K.; Kałdunek, D. Using Container Structures in Architecture and Urban Design. In Proceedings of the IOP Conference Series: Materials Science and Engineering; Institute of Physics Publishing: Bristol, UK, 2017; Volume 245. [Google Scholar]
  6. Hong, Y. A Study on the Condition of Temporary Housing Following Disasters: Focus on Container Housing. Front. Arch. Res. 2017, 6, 374–383. [Google Scholar] [CrossRef]
  7. Tanyer, A.M.; Tavukcuoglu, A.; Bekboliev, M. Assessing the Airtightness Performance of Container Houses in Relation to Its Effect on Energy Efficiency. Build. Environ. 2018, 134, 59–73. [Google Scholar] [CrossRef]
  8. da Costa, B.B.F.; Silva, C.F.P.; Maciel, A.C.F.; Cusi, H.D.P.; Maquera, G.; Haddad, A.N. Simulation and Analysis of Thermal Insulators Applied to Post-Disaster Temporary Shelters in Tropical Countries. Designs 2023, 7, 64. [Google Scholar] [CrossRef]
  9. Elrayies, G.M. Thermal Performance Assessment of Shipping Container Architecture in Hot and Humid Climates. Int. J. Adv. Sci. Eng. Inf. Technol. 2017, 7, 1114. [Google Scholar] [CrossRef]
  10. Lin, H.H.; Cheng, J.H. A Study of the Simulation and Analysis of the Flow Field of Natural Convection for a Container House. Sustainability 2020, 12, 9845. [Google Scholar] [CrossRef]
  11. Dumas, A.; Trancossi, M.; Madonia, M.; Coppola, M. Zero Emission Temporary Habitation: A Passive Container House Acclimatized by Geothermal Water. J. Sol. Energy Eng. Trans. ASME 2014, 136, 044505. [Google Scholar] [CrossRef]
  12. Tong, Y.; Yang, H.; Bao, L.; Guo, B.; Shi, Y.; Wang, C. Analysis of Thermal Insulation Thickness for a Container House in the Yanqing Zone of the Beijing 2022 Olympic and Paralympic Winter Games. Int. J. Environ. Res. Public Health 2022, 19, 16417. [Google Scholar] [CrossRef]
  13. Awad, M.H. Everything, All the Time: Engaging the Social Problem of Homelessness in Entrepreneurship Research and Practice. J. Bus. Ventur. Insights 2023, 20, e00400. [Google Scholar] [CrossRef]
  14. Kuzmicz, K.A.; Pesch, E. Approaches to Empty Container Repositioning Problems in the Context of Eurasian Intermodal Transportation. Omega 2019, 85, 194–213. [Google Scholar] [CrossRef]
  15. Shen, J.; Copertaro, B.; Zhang, X.; Koke, J.; Kaufmann, P.; Krause, S. Exploring the Potential of Climate-Adaptive Container Building Design under Future Climates Scenarios in Three Different Climate Zones. Sustainability 2020, 12, 108. [Google Scholar] [CrossRef]
  16. Battaglia, V.; Ceglia, F.; Laudiero, D.M.; Maione, A.; Marrasso, E.; Vanoli, L. Empowering Energy Communities through Geothermal Systems. Energies 2024, 17, 1248. [Google Scholar] [CrossRef]
  17. Noaman, D.S.; El-Ghafour, S.A. Holistic Design of Energy-Efficient Temporary Houses: Meeting Ventilation, Heating, Cooling, and Lighting Demands. J. Build. Eng. 2024, 86, 108534. [Google Scholar] [CrossRef]
  18. Di Meglio, A.; Massarotti, N.; Nithiarasu, P. A Physics-Driven and Machine Learning-Based Digital Twinning Approach to Transient Thermal Systems. Int. J. Numer. Methods Heat Fluid Flow, 2024; ahead of printing. [Google Scholar] [CrossRef]
  19. Remizov, A.; Memon, S.A.; Kim, J.R. Climate Zoning for Buildings: From Basic to Advanced Methods—A Review of the Scientific Literature. Buildings 2023, 13, 694. [Google Scholar] [CrossRef]
  20. Li, L.; Sun, W.; Hu, W.; Sun, Y. Impact of Natural and Social Environmental Factors on Building Energy Consumption: Based on Bibliometrics. J. Build. Eng. 2021, 37, 102136. [Google Scholar] [CrossRef]
  21. Tsikaloudaki, K.; Laskos, K.; Bikas, D. On the Establishment of Climatic Zones in Europe with Regard to the Energy Performance of Buildings. Energies 2012, 5, 32–44. [Google Scholar] [CrossRef]
  22. BS EN 15265; Energy Performance of Buildings—Calculation of Energy Needs for Space Heating and Cooling Using Dynamic Methods—General Criteria and Validation Procedures. CEN: Brussels, Belgium, 2007.
  23. ISO 13790; Energy Performance of Buildings—Calculation of Energy Use for Space Heating and Cooling. ISO: Geneva, Switzerland, 2008.
  24. Danciu, L. European Facilities for Earthquake Hazard and Risk (EFEHR) Earthquake Hazard in Europe. In Proceedings of the ORFEUS Workshop. Open EPOS Seismology Meeting. EMSC General Assembly, Lisbon, Portugal, 25–27 October 2017. [Google Scholar]
  25. Kottek, M.; Grieser, J.; Beck, C.; Rudolf, B.; Rubel, F. World Map of the Köppen-Geiger Climate Classification Updated. Meteorol. Z. 2006, 15, 259–263. [Google Scholar] [CrossRef]
  26. Rubel, F.; Brugger, K.; Haslinger, K.; Auer, I. The climate of the European Alps: Shift of very high resolution Köppen-Geiger climate zones 1800–2100. Meteorologische Zeitschrift 2017, 26, 115–125. [Google Scholar] [CrossRef]
  27. Hapag-Lloyd. Container Specification; Hapag-Lloyd: Hamburg, Germany, 2024. [Google Scholar]
  28. Wang, Z.; Wu, X.; Lo, K.L.; Mi, J.J. Assessing the Management Efficiency of Shipping Company from a Congestion Perspective: A Case Study of Hapag-Lloyd. Ocean. Coast. Manag. 2021, 209, 105617. [Google Scholar] [CrossRef]
  29. Autocad, v.2023 Software. Available online: https://www.autodesk.it/products/autocad/overview?term=1-YEAR&tab=subscription (accessed on 1 June 2024).
  30. Sketchup Software. Available online: https://www.sketchup.com/it/plans-and-pricing/sketchup-free (accessed on 1 June 2024).
  31. TRNbuild Software. Available online: https://trnsys.de/static/deb3060a15c25a7ad170db124507ef37/T3d_Manual.pdf (accessed on 1 June 2024).
  32. Shi, Y.; Zhang, D.F.; Xu, Y.; Zhou, B.T. Changes of Heating and Cooling Degree Days over China in Response to Global Warming of 1.5 °C, 2 °C, 3 °C and 4 °C. Adv. Clim. Chang. Res. 2018, 9, 192–200. [Google Scholar] [CrossRef]
  33. Lee, K.; Baek, H.J.; Cho, C.H. The Estimation of Base Temperature for Heating and Cooling Degree-Days for South Korea. J. Appl. Meteorol. Clim. 2014, 53, 300–309. [Google Scholar] [CrossRef]
  34. Abebe, S.; Assefa, T. Determining and Mapping the Base Temperature for Heating and Cooling Degree Days for Ethiopia. Energy Effic. 2022, 15, 62. [Google Scholar] [CrossRef]
  35. ANSI/ASHRAE Standard 169-2013; Addendum A to ANSI/ASHRAE Standard 169-2013. ANSI/ASHRAE: Atlanta, GA, USA, 2020.
  36. ANSI/ASHRAE Standard 169-2020; Addendum A to ANSI/ASHRAE Standard 169-2020: Climatic Data for Building Design Standards. ANSI/ASHRAE: Atlanta, GA, USA, 2021.
  37. Dombayci, Ö.A. Degree-Days Maps of Turkey for Various Base Temperatures. Energy 2009, 34, 1807–1812. [Google Scholar] [CrossRef]
  38. Harvey, L.D.D. Using Modified Multiple Heating-Degree-Day (HDD) and Cooling-Degree-Day (CDD) Indices to Estimate Building Heating and Cooling Loads. Energy Build. 2020, 229, 110475. [Google Scholar] [CrossRef]
Figure 1. Climatic zones of interest according to the Koppen–Geiger classification [25,26].
Energies 17 02926 g001
Figure 2. Shipping Container scenario.
Energies 17 02926 g002
Figure 3. Stratigraphy of opaque components.
Energies 17 02926 g003
Figure 4. Internal distribution of climatic zones.
Energies 17 02926 g004
Figure 5. Weekly hourly occupancy profile for two residents.
Energies 17 02926 g005
Figure 6. Comparison between Mean Temperature and Mean Daytime Temperature.
Energies 17 02926 g006
Figure 7. CDDs assessed with Ti = Mean daily daytime temperature.
Energies 17 02926 g007
Figure 8. CDDs assessed with Ti = Max daily daytime temperature.
Energies 17 02926 g008
Figure 9. CDDs (Tb = 18.3 °C).
Energies 17 02926 g009
Figure 10. HDDs (Ta = 18.3 °C).
Energies 17 02926 g010
Figure 11. Scenario 1: Single Container Energy Load [kWh].
Energies 17 02926 g011
Figure 12. Correlation Analysis: CDD18 and HDD18.
Energies 17 02926 g012
Figure 13. Correlation Analysis: CDDs and annual average total solar irradiance Itot.
Energies 17 02926 g013
Figure 14. Correlation Analysis: Heating load and HDD18.
Energies 17 02926 g014
Figure 15. Correlation Analysis: Cooling load and CDDs.
Energies 17 02926 g015
Figure 16. Average heating and cooling loads by Climate Category.
Energies 17 02926 g016
Figure 17. Thermal Load: Comparison of three Scenarios.
Energies 17 02926 g017
Table 1. Areas of interest for the case study.
N.AreasCountryKöppen–Geiger Group
1HamburgGermanyCfb
2AmsterdamNetherlandsCfb
3AthensGreeceCsa
4BarcelonaSpainCsa
5BergenNorwayCfb
6BerlinGermanyCfb
7BucharestRomaniaCfa
8BudapestHungaryCfa
9CagliariItalyCsa
10CopenhagenDenmarkCfb
11KrakowPolandCfb
12DublinIrelandCfb
13GothenburgSwedenCfb
14HelsinkiFinlandDfb
15IstanbulTurkeyCsa
16LisbonPortugalCsa
17LondonUnited KingdomCfb
18MadridSPAINBsk
19MarseilleFranceCsa
20MilanItalyCsc
21NaplesItalyCsa
22ParisFranceCfb
23PragueCzech RepublicCfb
24RomeItalyCsa
25SofiaBulgariaCfb
26StockholmSwedenCfb
27TampereFinlandDfc
28WarsawPolandCfb
29ViennaAustriaCfb
30ZagrebCroatiaCsc
Table 2. Shipping Container Dimensions.
Inside Dimensions
Length [m]Width [m]Height [m]
Shipping Container 112.032.352.39
Shipping Container 25.902.352.39
Table 3. Material Properties for Opaque Components.
(a) External Wall Stratigraphy.
N.Layers
(mm)
k (W/mK)ρ (kg/m3)
From the inside to the outside
1Plaster200.7001400
2Plasterboard100.250900
3Steel117.008000
4Polyurethane200.02240
5Steel117.008000
6Polyurethane400.02240
7Steel117.008000
8Polyurethane200.02240
9Steel117.008000
(b) External roof stratigraphy.
N.Layers
(mm)
k (W/mK)ρ
(kg/m3)
From the outside to the inside
1Steel117.008000
2Polyurethane200.02240
3Steel117.008000
4Polyurethane400.02240
5Steel117.008000
6Polyurethane200.02240
7Steel117.008000
8Plasterboard100.250900
9Plaster200.7001400
(c) Ground floor stratigraphy.
N.Layers
(mm)
k (W/mK)ρ
(kg/m3)
From the inside to the outside
1Ceramic tile101.3002300
2Concrete800.7001600
3Steel117.008000
4Polyurethane200.02240
5Steel117.008000
6Polyurethane400.02240
7Steel117.008000
8Polyurethane200.02240
9Steel117.008000
Table 4. Main characteristics of the container envelope.
Building ElementTransmittance
(W/m2K)
Thickness
(cm)
g-Value
(-)
A
m2
External wall0.25811.4-(a) 60.79
(b) 87.28
(c) 98.09
External roof0.25811.4-(a) 28.27
(b) 42.39
(c) 28.27
Ground floor0.25517.4-(a) 28.27
(b) 42.39
(c) 28.27
Adjacent ceiling—scenario (c) only0.25811.4-(a) -⋯⋯
(b) -⋯⋯
(c) 13.86
Windows1.100-0.62(a) 8.23
(b) 10.59
(c) 10.53
Table 5. Interior area of the rooms.
Scenarion.Climatic ZoneS
(m2)
(a)1OpenSpace17.46
2Bathroom3.60
3Bedroom7.17
(b)1OpenSpace20.36
2Kitchen3.64
3Bathroom 14.27
4Bedroom10.48
5Bathroom 23.64
(c)1OpenSpace17.46
2Bathroom3.60
3Bedroom 17.17
4Bedroom 212.75
5Closet1.12
Table 6. Comparative analysis of Cooling Degree Days (CDDs).
ZoneCDD Case 1CDD Case 2CDD Case 3ZoneCDD Case 1CDD Case 2CDD Case 3
Athens326.09650.901019.24Vienna15.6482.25176.96
Madrid187.89546.50548.90Warsaw5.6641.45102.61
Cagliari156.43428.90694.36Paris4.9246.8582.84
Naples130.90362.10653.84Krakow4.2527.8076.58
Rome105.73324.90572.48Prague2.7135.7069.26
Marseille85.72273.30518.23Hamburg2.2629.4564.37
Lisbon76.44225.45531.10Amsterdam0.9213.9545.30
Bucharest73.50322.35355.69Stockholm0.186.5026.89
Istanbul52.64179.25507.27London0.157.9028.24
Milan48.13238.60340.59Copenhagen0.085.8037.26
Zagreb41.38126.95309.77Tampere-7.6529.37
Sofia39.26191.20218.33Helsinki-3.9536.09
Budapest37.83141.55275.58Gothenburg-25.7024.56
Barcelona37.29138.80461.45Bergen--10.83
Berlin15.68104.05147.43Dublin--2.08
Table 7. CDD ranges.
CategoryMinimum CDD RangeMaximum CDD Range
A300-
B211299
C91210
D3590
E1434
F013
Table 8. Irradiance Range (W/m2).
CategoryMinimum Irradiance RangeMaximum Irradiance Range
A161-
B145160
C129144
D114128
E98113
F-97
Table 9. HDD ranges.
CategoryMinimum HDD RangeMaximum HDD Range
A-1464
B14652726
C27273105
D31063320
E33213822
F3823-
Table 10. Climate zones classification.
ZoneCDD CategoryIrradiance CategoryHDD CategoryCombined Category
AthensABAA
CagliariAAAA
LisbonBAAA
MadridAABA
NaplesABAA
BarcelonaBBAB
BucharestBBCB
IstanbulBABB
MarseilleBABB
RomeABBB
BudapestCCCC
MilanCCBC
SofiaCCDC
ViennaCDDC
ZagrebCCCC
AmsterdamEEDD
BerlinDEDD
CopenhagenEDED
LondonFECD
ParisDECD
PragueDFED
WarsawDFED
HelsinkiEDFE
KrakowDEFE
DublinFFDE
HamburgEFEE
StockholmFCFF
BergenFFEF
GothenburgEEFF
TampereFDFF
Table 11. Thermal Load: Single Container.
Single Container
ZoneCooling Load [kWh]Heating Load [kWh]
Sofia848.541919.22
Zagreb1117.071638.70
Istanbul1836.25739.34
Naples2001.09447.68
Lisbon2164.32187.74
Athens2309.65299.99
Table 12. Thermal Load: L-Shaped Container.
L-Shaped Container
ZoneCooling Load [kWh]Heating Load [kWh]
Sofia3169.1911,095.18
Zagreb4355.159661.74
Istanbul7069.255079.55
Naples7686.993366.68
Lisbon7739.571636.05
Athens9144.102680.97
Table 13. Thermal Load: Stacked Containers.
Stacked Containers
ZoneCooling Load [kWh]Heating Load [kWh]
Sofia3207.8710,030.43
Zagreb4286.128698.30
Istanbul9403.194109.95
Naples10,132.302544.71
Lisbon10,623.93985.58
Athens11,506.641885.80
Disclaimer/Publisher’s Note: The statements, opinions and data contained in all publications are solely those of the individual author(s) and contributor(s) and not of MDPI and/or the editor(s). MDPI and/or the editor(s) disclaim responsibility for any injury to people or property resulting from any ideas, methods, instructions or products referred to in the content.