Article

Torque Vectoring Control as an Energy-Efficient Alternative to Vehicle Suspensions Tuning

by
Michele Asperti
*,
Michele Vignati
and
Edoardo Sabbioni
*
Department of Mechanical Engineering, Politecnico di Milano, Via La Masa 1, 20156 Milan, Italy
*
Authors to whom correspondence should be addressed.
Energies 2024, 17(12), 2903; https://doi.org/10.3390/en17122903
Submission received: 16 May 2024 / Revised: 3 June 2024 / Accepted: 11 June 2024 / Published: 13 June 2024
(This article belongs to the Section E: Electric Vehicles)

Abstract

:
With a shift in the automotive industry’s focus towards sustainability and energy efficiency, optimizing vehicle handling dynamics has been put on a secondary level. Moreover, there is a growing trend towards comfort-oriented design, conversely to the vehicle-handling one. Nevertheless, recent advancements such as the integration of multiple independently controlled electric motors on a vehicle is enabling torque vectoring, which offers a promising opportunity for reconciling these conflicting objectives. This paper proposes a novel approach for jointly improving vehicle handling and energy efficiency performance. Indeed, through advanced simulation techniques, the effects of various suspension configurations are explored to strike a balance between cornering performance and energy consumption. Then, a torque vectoring controller is designed in combination with a meticulous tuning of the suspension setup. This innovative approach of considering the active control design together with the suspensions’ setup allows to obtain superior performances. Indeed, the desired vehicle cornering capabilities can be achieved while also guaranteeing a significantly more efficient vehicle in straight-line running, which covers most of the usual road driving time.

1. Introduction

Road vehicle users are always aiming at sporty and high-performance vehicles, even though the automotive industry focus is now put on achieving sustainable and energy-efficient solutions [1]. As a consequence, optimizing vehicle handling dynamics is progressively losing its paramount importance at the design stage. Indeed, for what concerns suspensions, the industry is no longer concentrating on suspension optimization to improve vehicle handling performance [2,3]. Conversely, the focus of suspension design has pivoted to comfort-centered vision, with several approaches aiming at improving the overall ride comfort through suspension optimization [4,5,6]. In some cases, active contributions are added to the suspension system to improve the vehicle passengers’ comfort, where the active part of the system is also optimized [7]. In this context, end users of sports vehicles strive to adopt aftermarket solutions with the objective of improving vehicle handling, which typically worsens the high-efficiency capability of the standard vehicle.
Even though car setup optimization [8] still remains a fundamental aspect, the current advances allowing for the adoption of multiple electric motors in a single vehicle [9] allow for much more advanced improvements. Indeed, thanks to the deployment of In-Wheel Motors (IWMs) [10], it is possible to easily deploy torque vectoringTorque Vectoring (TV) to vehicles for controlling their lateral dynamics through the application of a yaw moment. Indeed, through the years, several TV controllers have been proposed [11,12] with the objective of improving vehicle lateral dynamics by actively following a yaw rate and/or sideslip angle reference. Conversely, there are also contributions that propose the use of TV with the sole objective of improving the overall vehicle efficiency [13,14]. In between these two extremes, the most common approach is designing the TV controller to improve vehicle lateral dynamics and then allocating the actuation torque to the motors by minimizing the power losses [15], while achieving the required yaw moment. Moreover, TV controllers also have the capability to adapt the vehicle behavior to the actual desires of the driver by simply selecting a driving mode [16,17], which results in an on-demand modification of the reference vehicle behavior, with the possibility of privileging vehicle handling or energy efficiency.
This paper explores a novel approach to ensure good vehicle handling capabilities, while also achieving high energy efficiency levels by jointly tuning vehicle suspensions and designing the torque vectoring control system. This allows to handle the compromise between vehicle cornering performance and energy efficiency improvements through additional degrees of freedom. Thus, the research endeavors to address the inherent trade-off between cornering performance and energy consumption through a comprehensive investigation of integrated design solutions. Leveraging advanced simulation methodologies, various configurations of joint suspension tuning and torque vectoring designs are evaluated to understand their impact on cornering dynamics and energy efficiency.

2. Suspensions Angles Effects on Vehicle Performance

Suspension angles such as camber and toe are typically set at rather neutral values in standard road cars to prevent excessive tire consumption due to its scrubbing on the road. Instead, these angles are typically tuned far from the neutral condition in sports vehicles to improve their cornering response. It is thus fundamental to understand the effects of these angles on vehicle performance for properly setting them for the specific vehicle scope. For this purpose, a sweep of vehicle dynamic simulations varying toe and camber angles both at the front and rear suspensions has been conducted. The considered vehicle is an S-segment vehicle equipped with four independently controllable In-Wheel Motors (IWMs), whose main characteristics are reported in Table 1. The vehicle model for simulation purposes is developed using VI-Grade CarRealTime 2022 software, thus accounting for 5 rigid bodies and 14 degrees of freedom. In particular, the vehicle model for the present work is developed starting from the validated VI-CarRealTime SportCar model, which is an internal combustion engine vehicle. The original powertrain is then substituted with four IWMs, updating the inertial properties of both the vehicle chassis and the wheel assemblies accordingly.
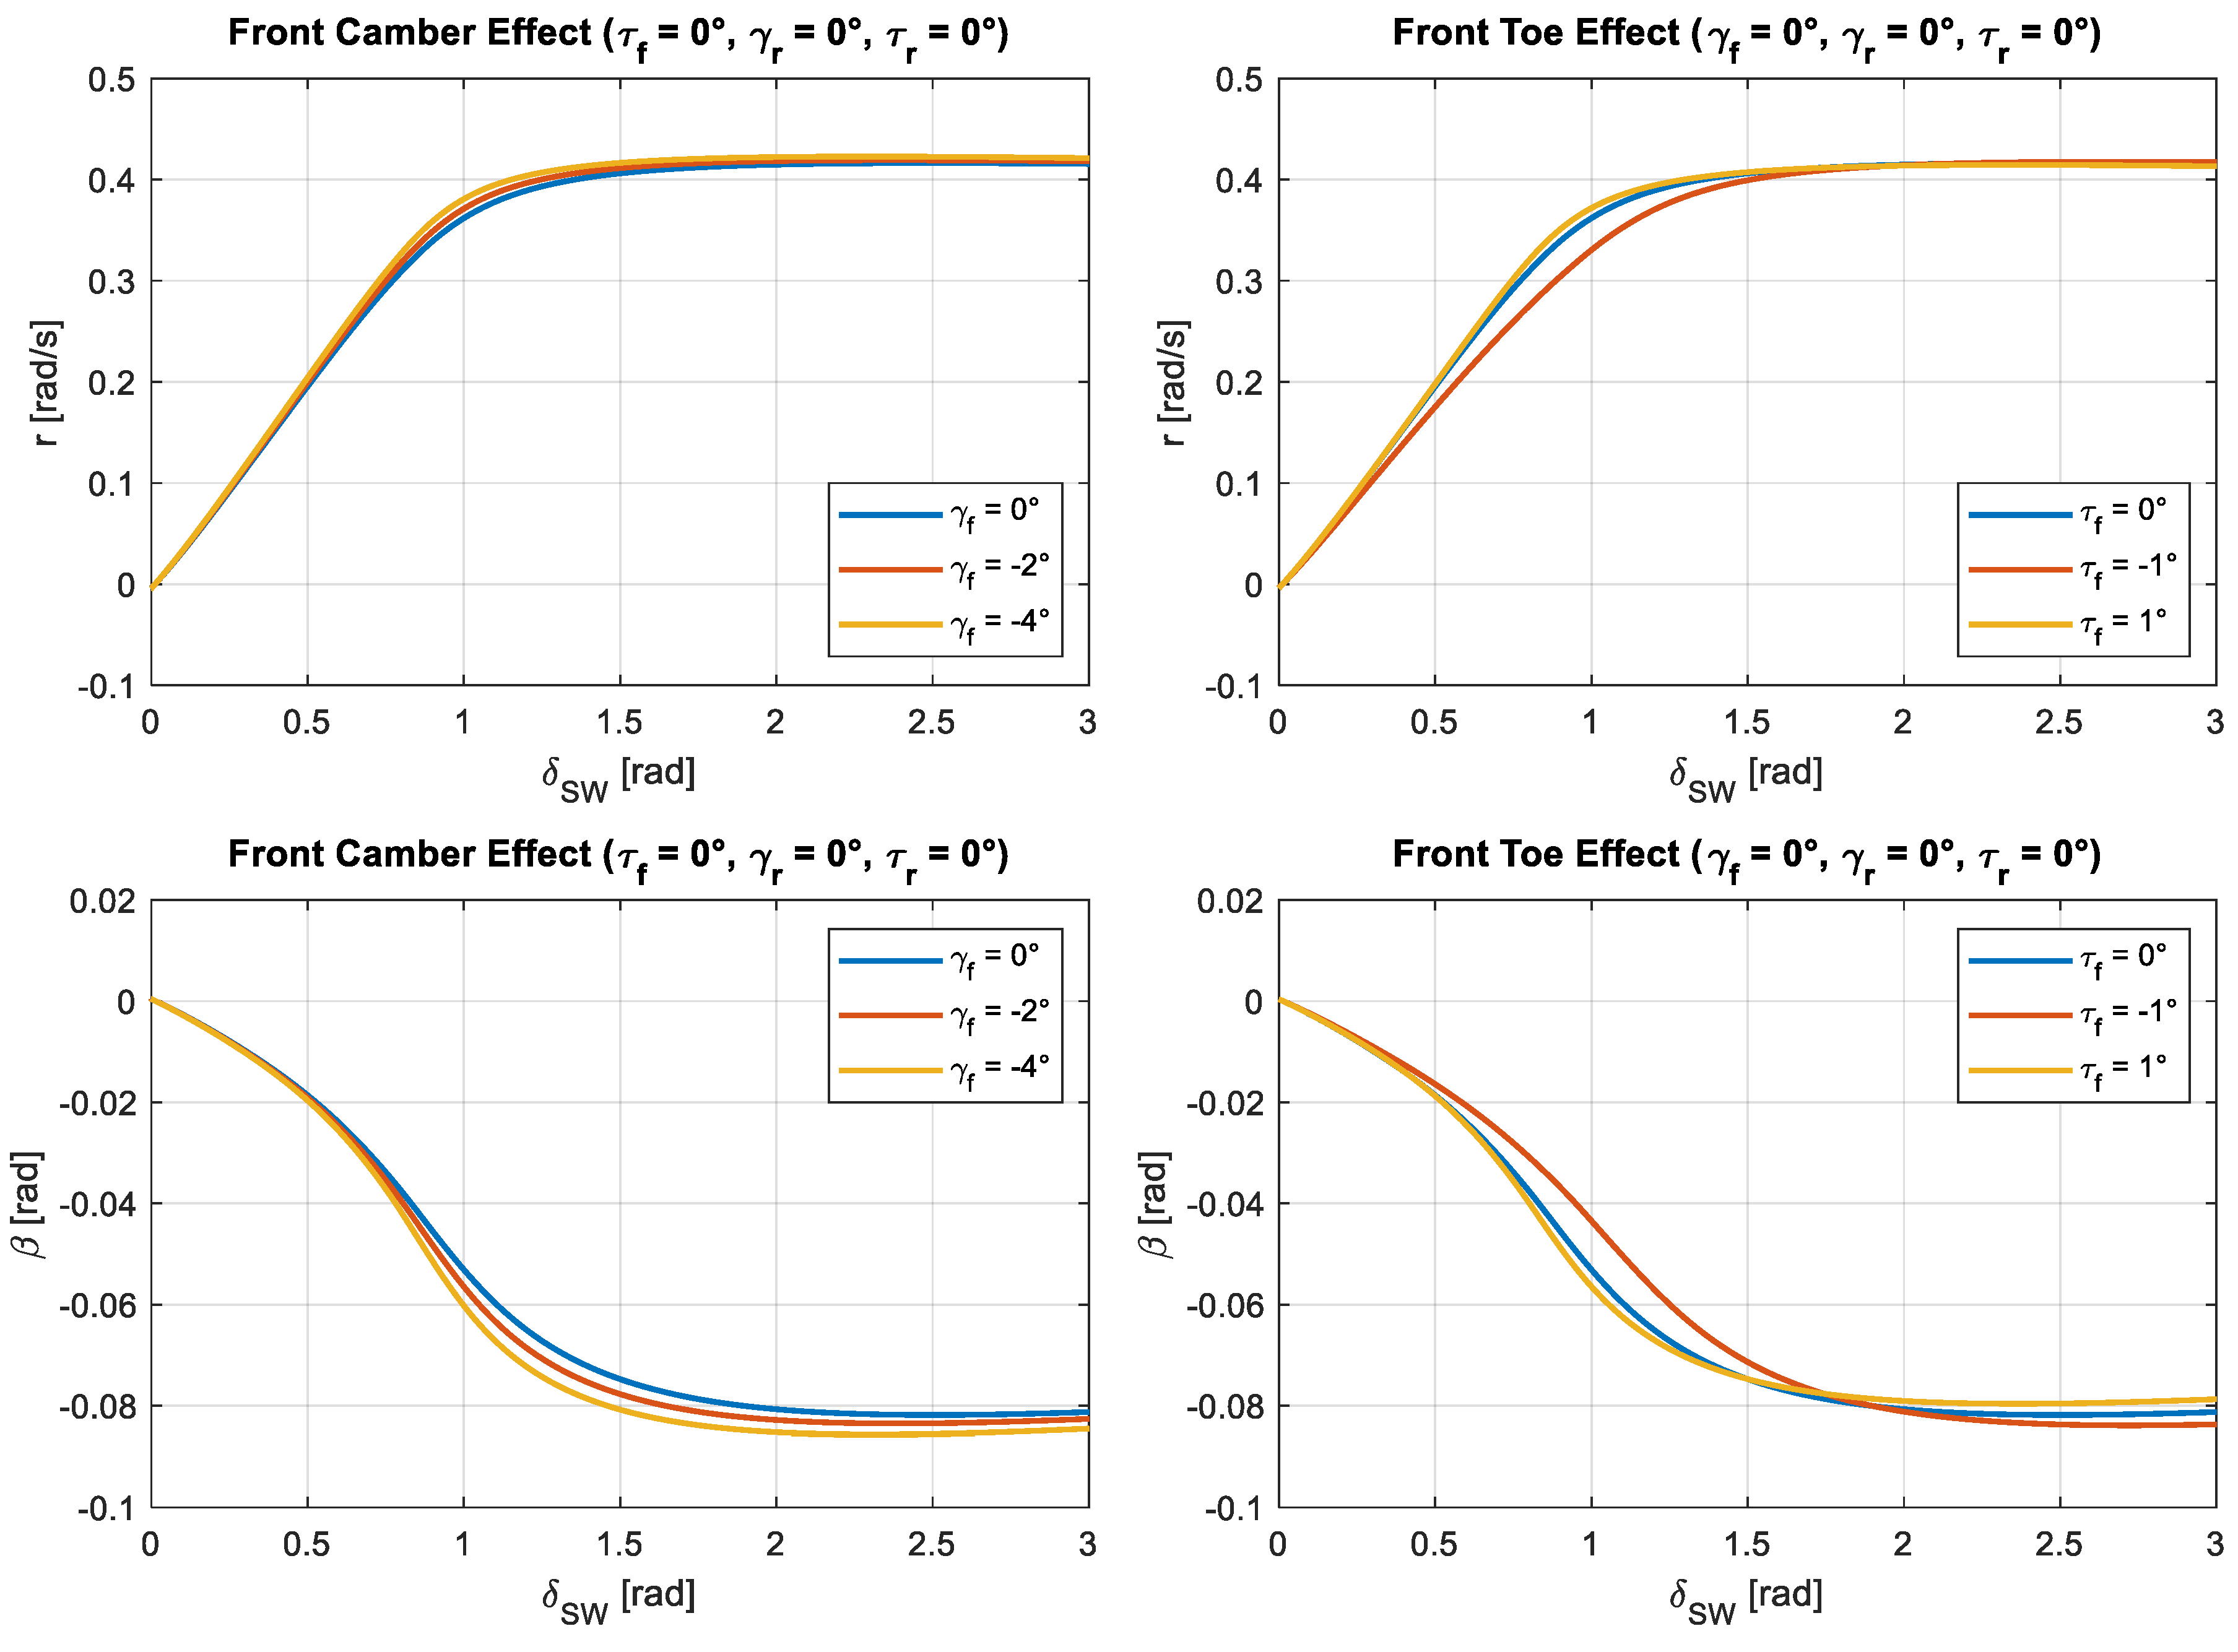
For the present investigation about the effect of suspension angles, only negative camber angles have been considered, meaning that the top part of the tire is more towards the vehicle centerline with respect to the bottom part. This is because this condition is the one improving the vehicle’s dynamic response thanks to a favorable condition of the outer wheel during a turn. Instead, for what concerns the toe angle, both positive and negative values are considered, with positive values meaning that the front part of the tire is more towards the vehicle centerline as compared to its rear part, which is typically known as toe-in condition. A steering pad constant speed maneuver at 90 km/h has been performed by increasing the steering wheel angle at a rate of one degree per second until reaching the vehicle handling limits for each of the available configurations of toe and camber angles at the front and rear suspensions. The effects of front suspension angles on vehicle response are reported in Figure 1 both in terms of yaw rate ( r ) and sideslip angle ( β ) responses to the steering wheel angle ( δ S W ) input.
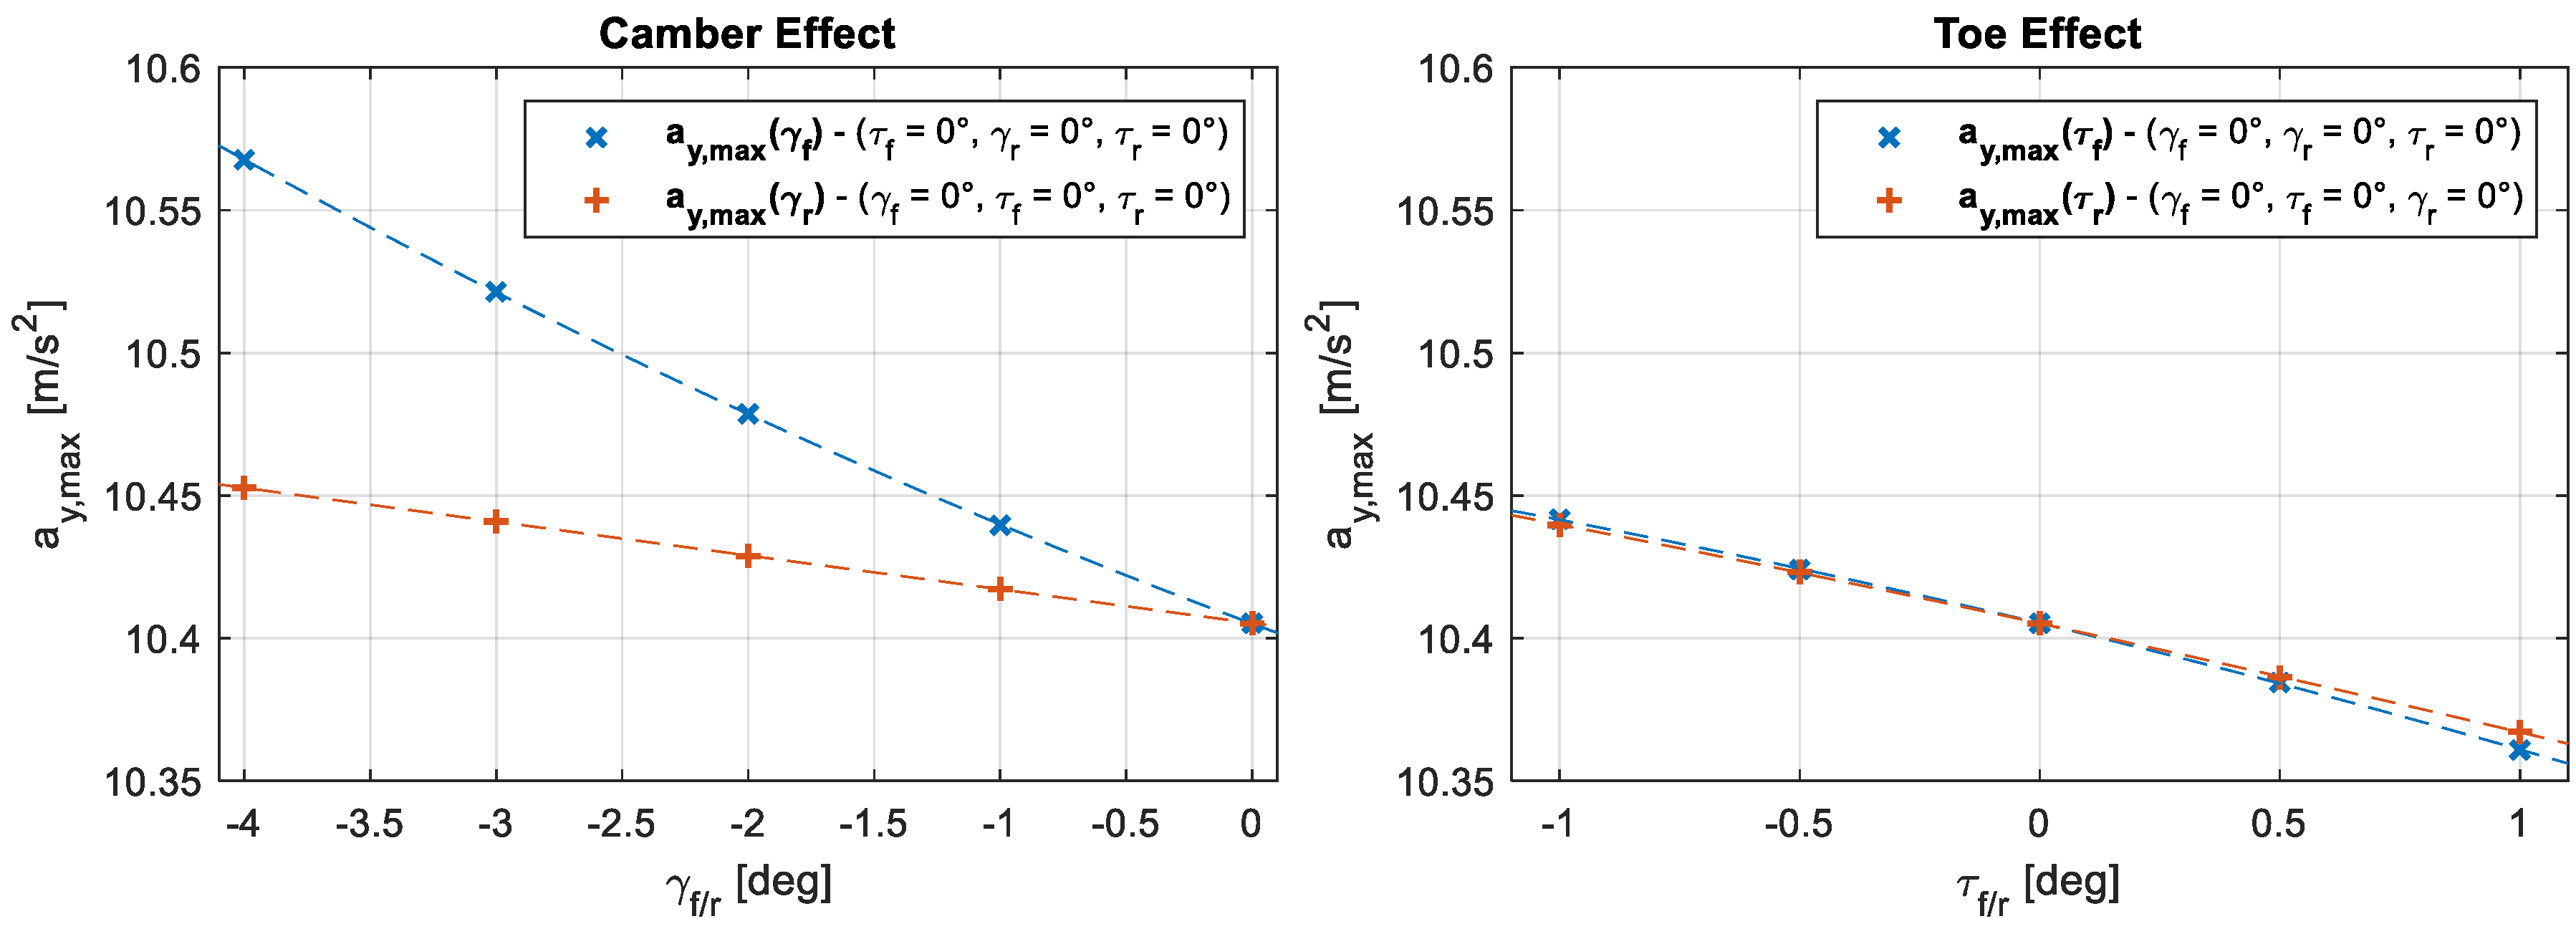
When inspecting the vehicle yaw rate response in Figure 1, it is possible to notice how a more negative camber angle is sharpening the transition between the linear and saturation regions, while also increasing the asymptotic value achieved for high steering wheel angle inputs. Still looking at the yaw rate response, but now as a function of the front toe angle, it is possible to notice how a toe-out ( τ f < 0 ) is deeply changing the slope of the linear region of the response, while also providing a smoother transition between the linear and the saturation regions. Instead, a toe-in ( τ f > 0 ) is generating an opposite trend but with a significantly lower variation with respect to the neutral toe ( τ f = 0 ) setting. For what concerns the vehicle sideslip angle response, which is fundamental for vehicle stability, it is possible to state that a more negative camber angle increases the limit value while also providing a faster transition to that value. A toe-in ( τ f > 0 ) lowers the sideslip angle limit value while providing a faster settling to that value, while a toe-out ( τ f < 0 ) is doing the opposite, thus increasing the limit value by a similar quantity and making the transition towards that value much smoother. The smooth variation of the vehicle sideslip angle is a desirable feature for ensuring vehicle stability and this is the reason why on standard road vehicles the front toe is slightly negative and the rear toe slightly positive. In addition to the pure vehicle cornering response variation as a function of suspension angles presented in Figure 1, it is also possible to inspect the effects these angles have on the maximum achievable lateral acceleration ( a y , m a x ), as reported in Figure 2. It is noteworthy to say that, in steady-state conditions and at a constant traveling speed ( v ), the lateral acceleration is proportional to the yaw rate ( a y = r v ).
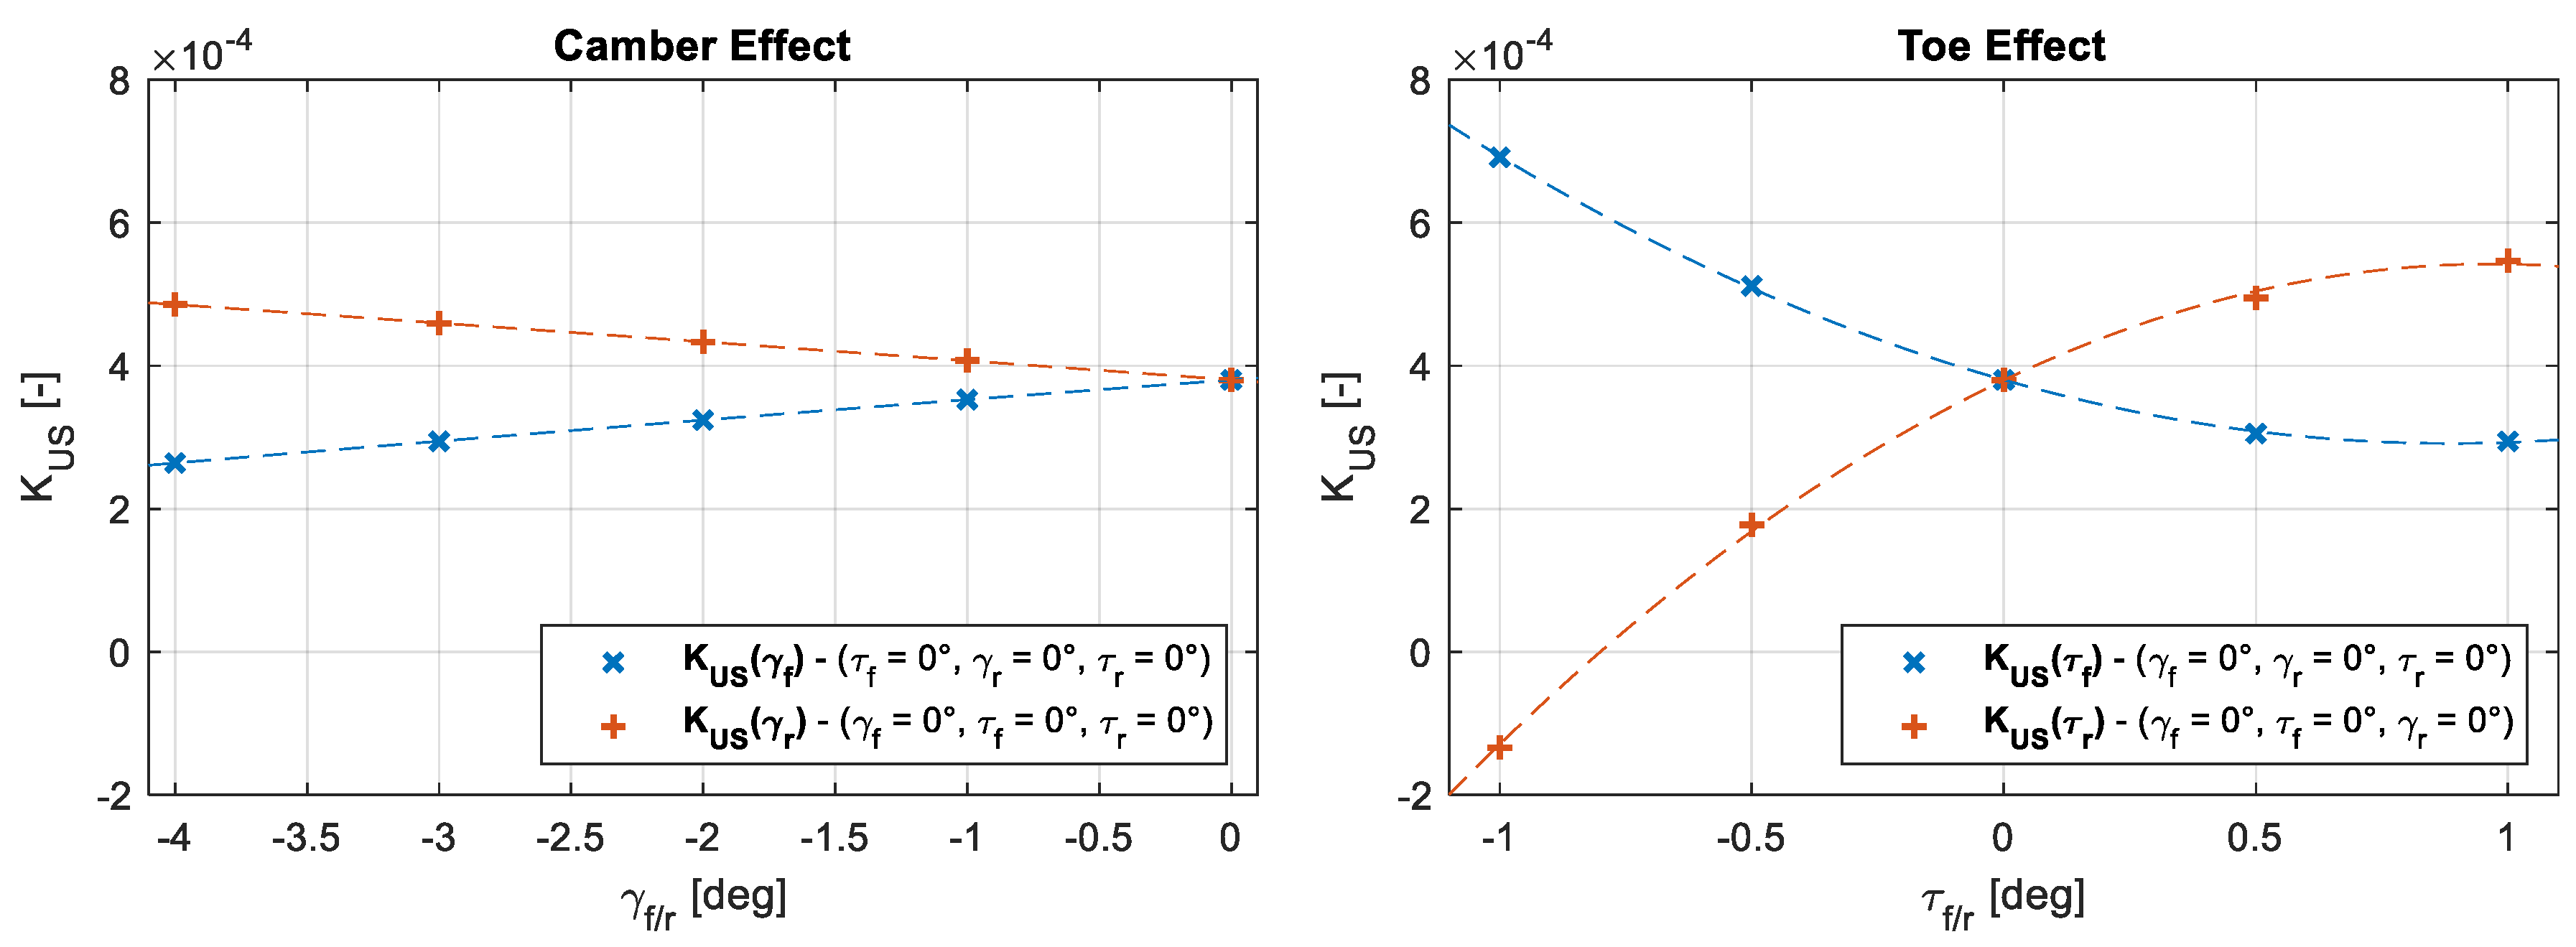
When analyzing Figure 2, it is evident that a more negative camber angle both at the front and at the rear tires is able to improve the maximum achievable lateral acceleration. For this reason, it would be completely out of sense to impose positive camber angles. Moreover, for the specific vehicle considered in this paper, the front camber angle is much more effective than the rear camber angle in increasing the maximum achievable vehicle lateral acceleration. In a similar way, a more negative toe angle also increases the maximum achievable vehicle lateral acceleration with similar effects if considering toe angle variations at the front or rear tires. The capability to increase the maximum lateral acceleration is for sure beneficial for improving vehicle cornering; nevertheless, this is not the only aspect to investigate. Indeed, the vehicle responsiveness to the steering input is also a fundamental aspect for improving vehicle cornering, which is represented by the understeering coefficient ( K U S ). In particular, a smaller understeering coefficient means a prompter vehicle response, which is given by an increased slope of the yaw rate linear response region as a function of the steering wheel angle input. The understeering coefficient variation as a function of both front and rear suspension angles during the steering pad constant speed maneuver is reported in Figure 3.
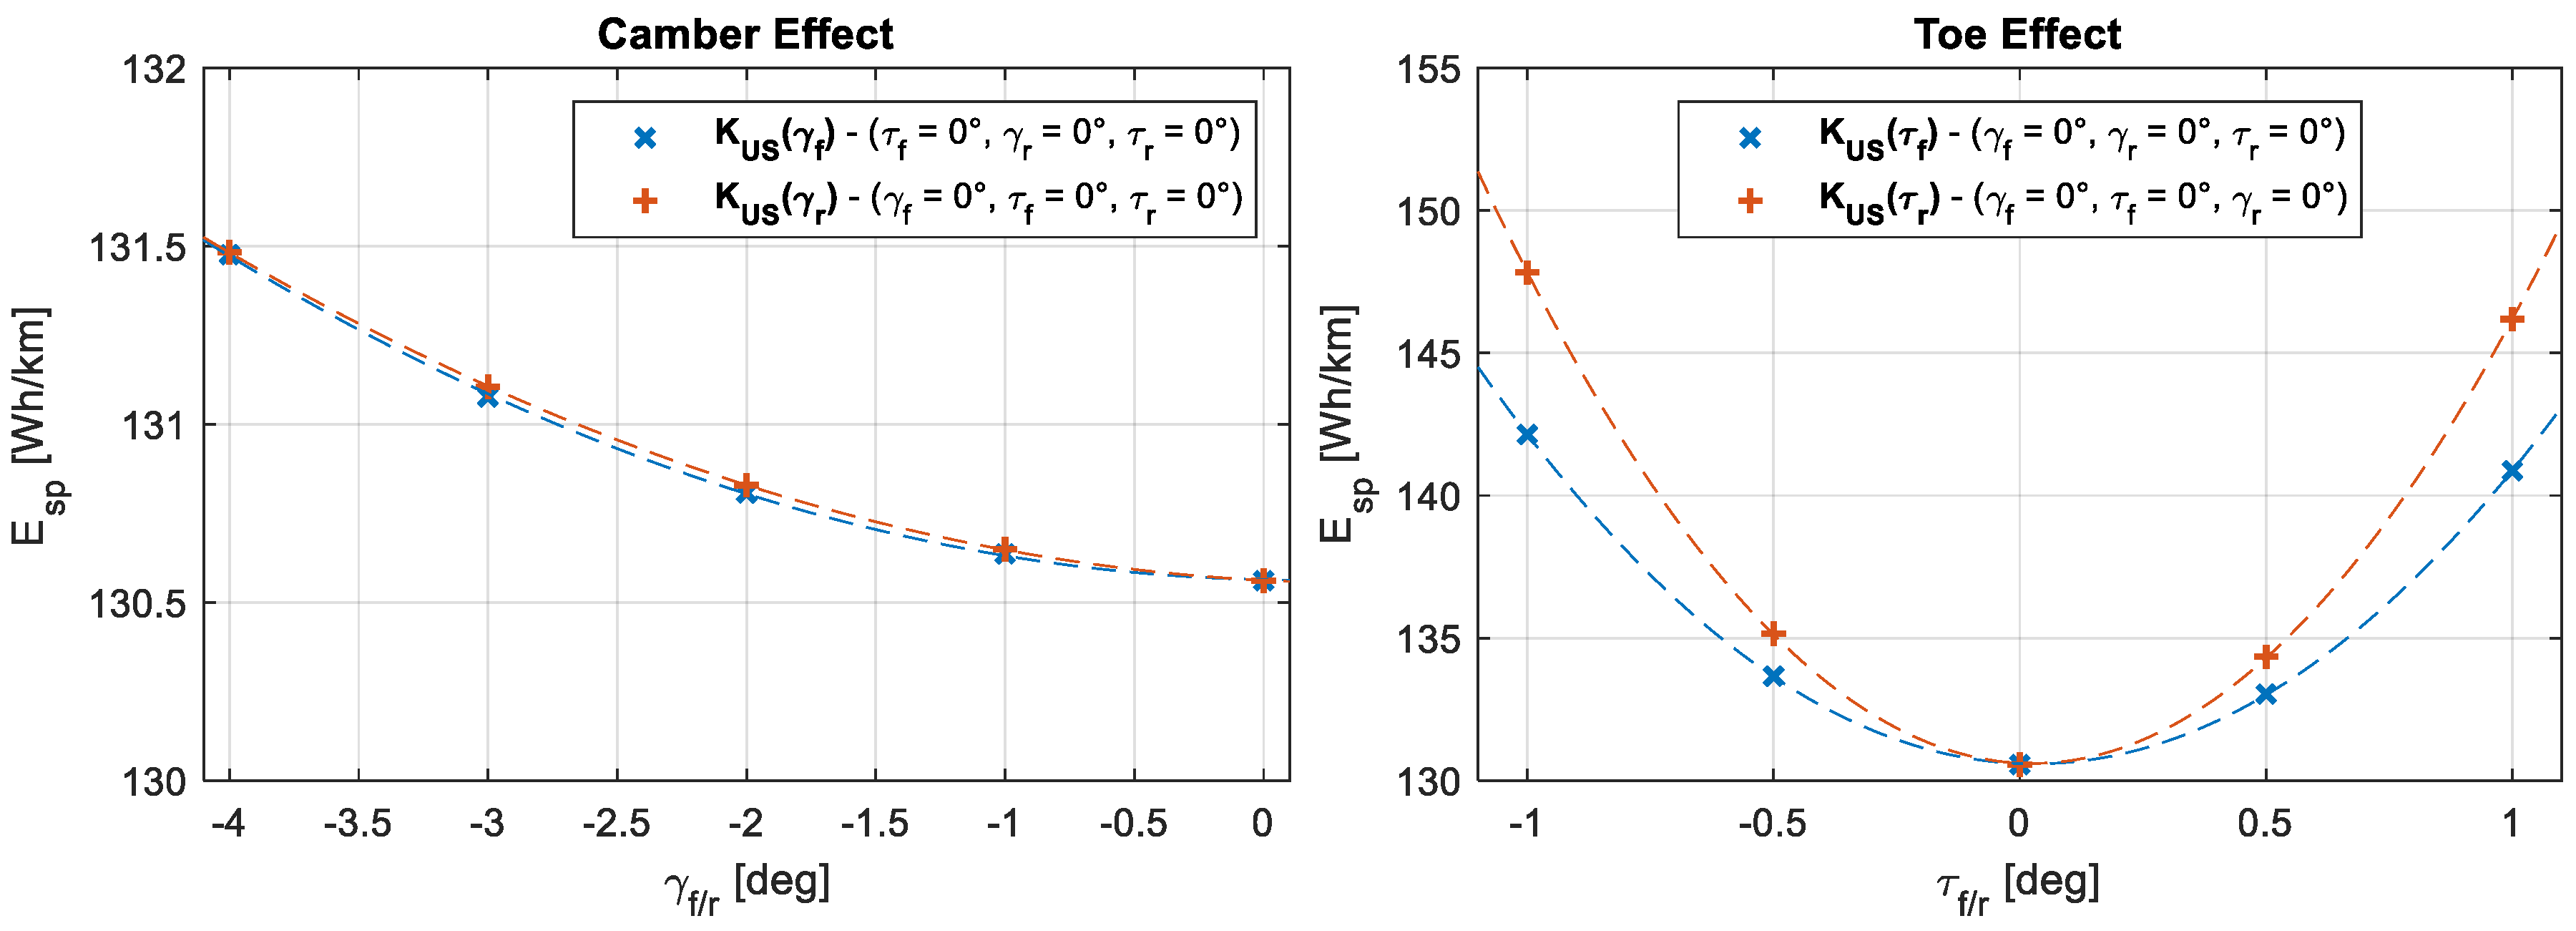
The results in Figure 3 highlight that a more negative camber at the front or rear suspensions generates an opposite variation of the understeering coefficient, which is almost linear for the inspected range of camber angles. In particular, the decrease in the understeering coefficient caused by a negative camber angle at the front tires is slightly bigger than the increase in the understeering coefficient caused by the same negative camber angle at the rear tires. This means that by imposing the same negative camber angle at both front and rear tires, the vehicle becomes slightly less understeering, while also being able to achieve a higher lateral acceleration limit, according to the results in Figure 2. Still analyzing Figure 3, it is possible to notice that the same variation of toe angle at the front or rear suspensions is also generating an opposite variation of the understeering coefficient. In this case, the rear toe variation affects the understeering coefficient more than the front toe variation, up to a point where an excessive toe-out ( τ r > 0 ) at the rear is causing the vehicle to become oversteering ( K U S < 0 ). As a result of this analysis of the effect of suspension angles on vehicle cornering performance, it is evident that a proper suspension setup can deeply modify vehicle handling properties when moving from almost neutral angle setups to aggressive setups. Nevertheless, this comes at the cost of increased tire wear due to the modification of the contact patch and the increased tire scrubbing over the ground. Together with increased tire consumption, energy losses are also expected to increase because of a change in suspension angles from their neutral position. For this reason, a sweep of 90 km/h constant-speed straight-runs varying toe and camber angles both at the front and rear suspensions has been simulated with the same vehicle model used for cornering analysis. The outcome of these simulations in terms of specific energy consumption ( E s p ) is reported in Figure 4.
From the analysis of Figure 4, it is evident how any variation of suspension angles from the neutral position is causing an increased energy consumption, with the toe angle effect that is almost one order of magnitude bigger than the one due to the camber angle. In particular, front and rear camber angle variations are causing similar changes in specific energy consumption, while toe changes at the rear generate a greater variation in specific energy consumption as compared to the same toe changes at the front. As a direct consequence, suspension angle tuning for improving vehicle cornering may cause an undesired increase in energy consumption and thus a reduction in the vehicle range, which is currently a widely discussed topic for battery electric vehicles.
The objective of this paper is to design a torque vectoring controller able to guarantee the same vehicle cornering performances which can be obtained through suspension angle tuning through the independent active control of the four motors driving the vehicle. This configuration allows to maintain a neutral suspension setup, and thus it is expected to reduce the specific energy consumption with respect to the vehicle equipped with a non-neutral suspension setup. In particular, a couple of suspension setups are considered in this paper and presented in Table 2. The baseline setup is characterized by suspension angles typical for road vehicles for ensuring proper drivability in all conditions, while the sporty setup is characterized by more aggressive suspension angles, as well as a stiffened rear anti-roll bar for improving vehicle handling.

3. Torque Vectoring Controller

The torque vectoring controller designed in this paper is to be applied on the vehicle featuring the baseline suspension setup with the objective of reproducing the cornering capabilities of the same vehicle when featuring the sporty suspension setup. For this purpose, the single-track vehicle model represented in Figure 5 is adopted for a proper torque vectoring controller design. In particular, the linearized equations of motion of the single-track vehicle model at constant speed [18] are considered
{ m ( V β ˙ + V r ) = ( k y , f k y , r ) β + ( k y , r l r k y , f l f V ) r + k y , f δ J r r ˙ = ( k y , r l r k y , f l f ) β + ( k y , r l r 2 k y , f l f 2 V ) r + k y , f l f δ + M z
where the vehicle states are the yaw rate ( r ) and the sideslip angle ( β ), with the vehicle speed ( V ) set as constant; the vehicle inputs are the front wheel steering angle ( δ ) and the additional yaw moment due to torque vectoring control ( M z ), while all the other terms are vehicle characteristic parameters. In particular, m is the vehicle mass, J z the vehicle yaw moment of inertia, k y , f and k y , r are, respectively, the front and rear axles’ cornering stiffnesses and l f and l r are the distances of the vehicle center of mass from the front and rear axles, respectively.
The torque vectoring control architecture proposed in this paper is a multilayer cascaded control composed of three main blocks: the reference generator, the high-level controller and the low-level controller, as reported in Figure 6. The reference generator obtains driver inputs and vehicle states ( x ) to generate a reference ( x r e f ) for the vehicle lateral dynamics. Then, the high-level controller takes as input the driver commands, the vehicle states, and the output quantities from the reference generator to define the total driving torque ( T T O T ) and yaw moment ( M z ) to be applied to the vehicle. In the end, the low-level controller takes the total driving torque and yaw moment demand as inputs to define a torque demand for each motor ( T m , i ) and, if necessary, a braking pressure for each brake caliper ( p b , i ). All these three components of the torque vectoring control are designed for the present study and are thus described in detail in the following paragraphs.

3.1. Reference Generator

The reference generator of a torque vectoring controller aims to define the desired vehicle lateral dynamics behavior, thereby generating a target for the controller. When dealing with vehicle lateral dynamics control, the most common approach considers tracking a yaw rate reference. The simplest method for determining the reference value for the yaw rate is based on considering the linearized equations of motion of the single-track vehicle model at steady state. This approach results in the reference yaw rate ( r r e f ) being expressed as a linear function of the input wheel steering angle ( δ ) and thus reads
r r e f = V l ( 1 + K U S V 2 ) δ
where l is the vehicle wheelbase and K U S is the understeering coefficient, which is, in turn, function of vehicle and tire properties, and is defined as follows.
K U S = m l 2 ( l r k y , f l f k y , r )
However, the linear nature of this approach for defining the reference yaw rate is effective within the linear region of tires since it does not account for tire-road friction, which physically restricts the maximum attainable yaw rate. For this reason, the reference yaw rate should be upper-bounded and this is typically performed by introducing an exponential saturation function. The resulting reference yaw rate is thus expressed as follows
r r e f = { V l ( 1 + K U S V 2 ) δ = α   δ IF   δ δ * r m a x + ( r * r m a x ) e ( α ( δ δ * ) ( r m a x r * ) ) IF   δ > δ *
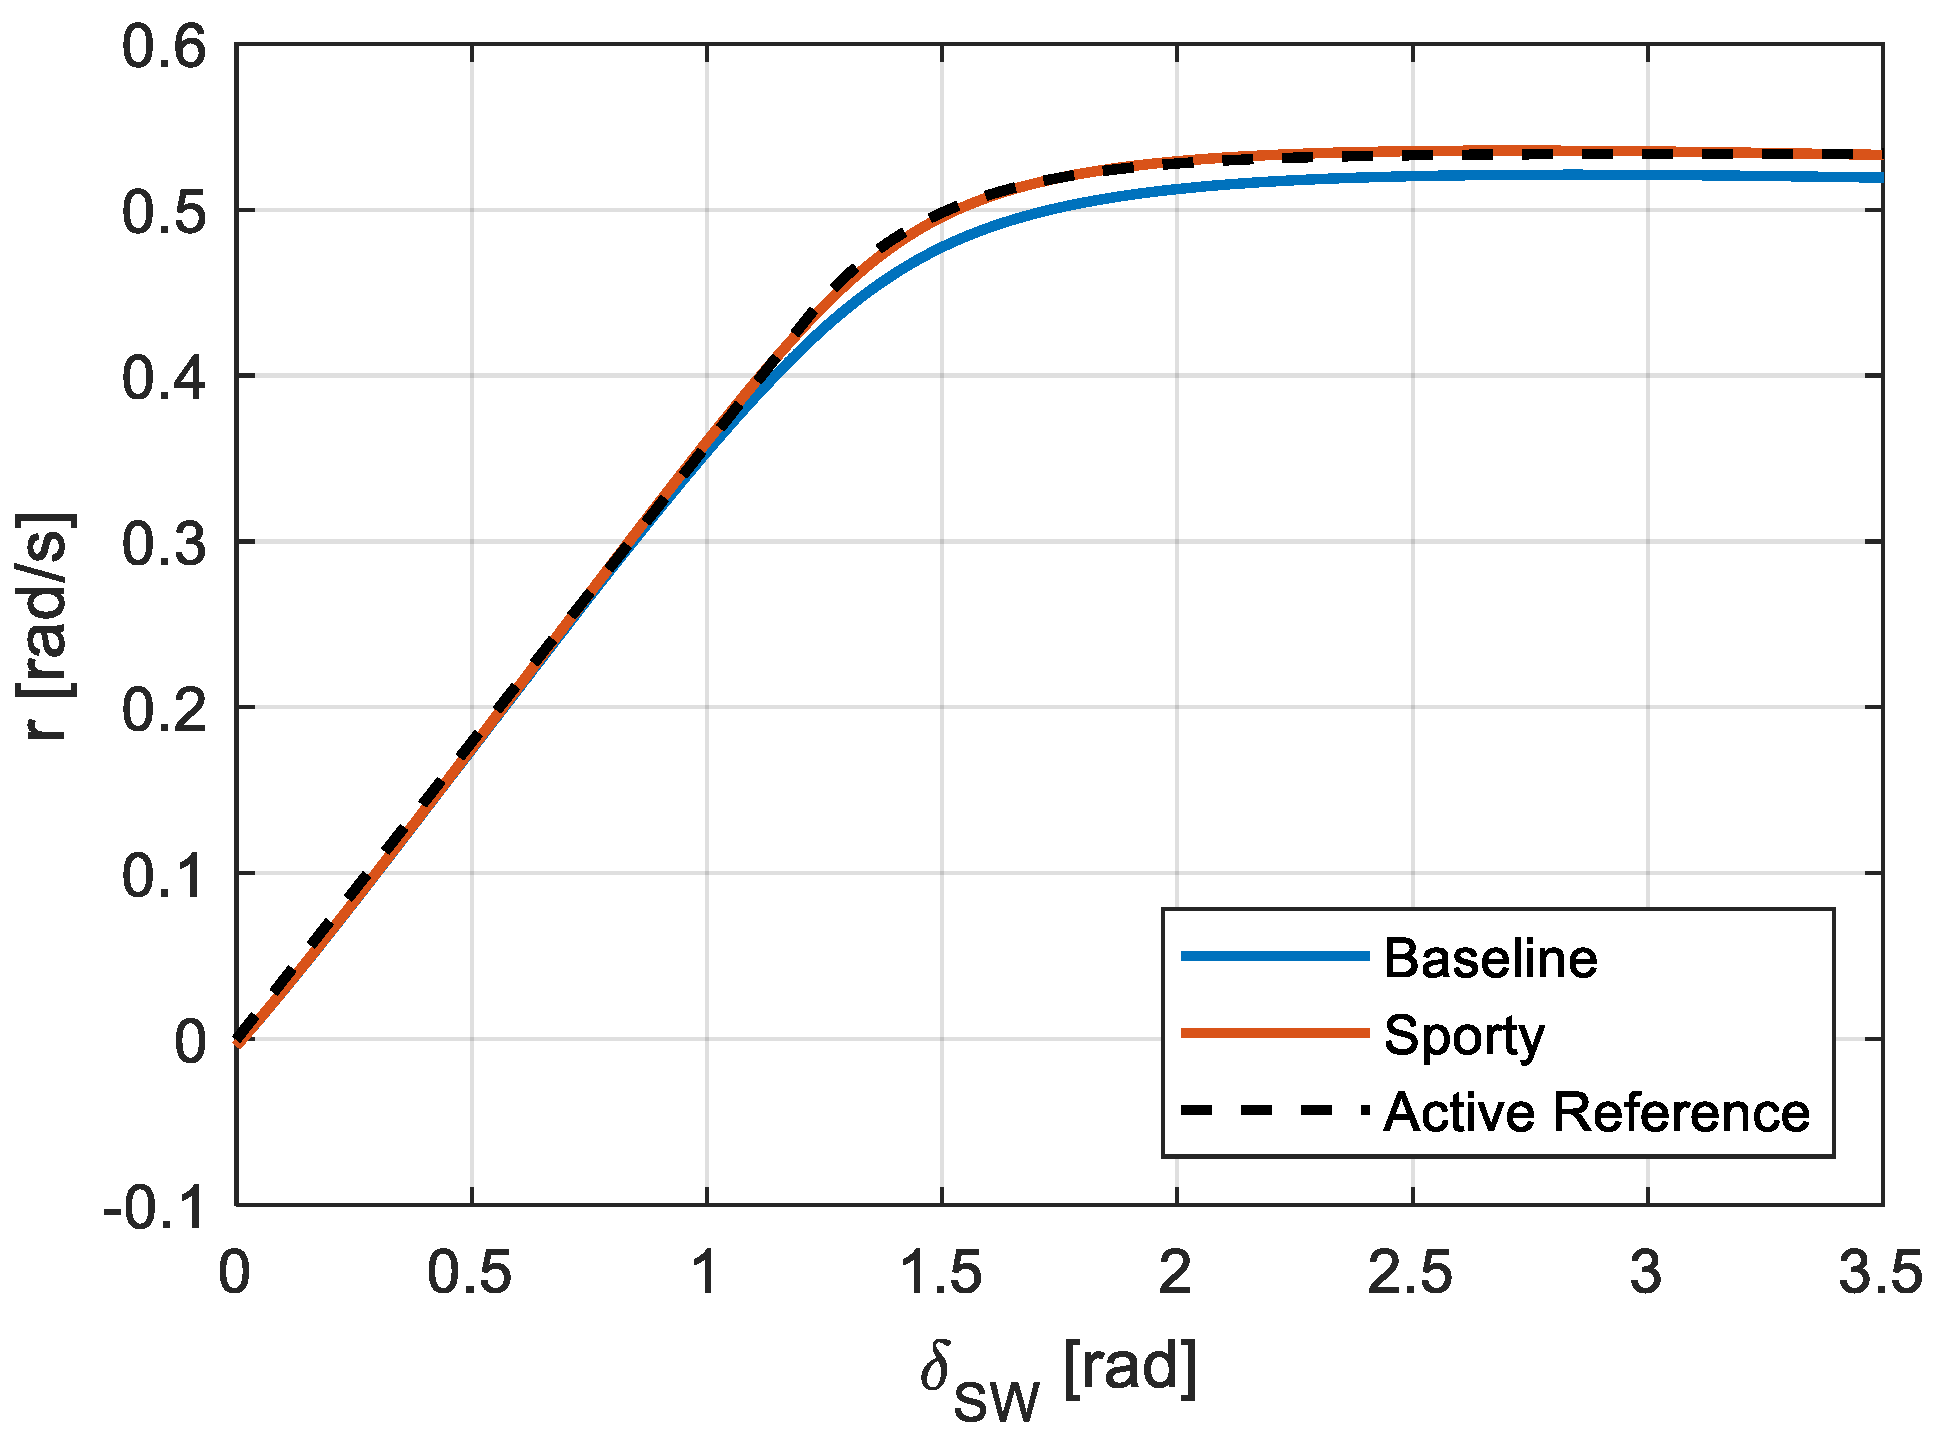
where the maximum attainable yaw rate is the maximum achievable lateral acceleration normalized by the actual vehicle speed ( r m a x = a y , m a x / V ), while r * is the yaw rate value at which the transition between the linear and saturation regions occurs, with δ * = r * / α being the wheel steering angle value at which this transition happens. Given the reference yaw rate function, its three main parameters ( r m a x , α , δ * ) must be defined for properly reproducing the sporty vehicle cornering response. In particular, instead of considering the wheel steering angle, it is possible to use the steering wheel angle ( δ S W = δ / τ S W ) by accounting for a constant transmission ratio ( τ S W ) between the two. For defining the yaw rate reference function coefficients, a steering pad constant speed maneuver at several different constant speeds has been performed by increasing the steering wheel angle at a rate of one degree per second until reaching the vehicle handling limits. Then, the reference yaw rate function coefficients are obtained by fitting the same function to the sporty vehicle response for each available running speed. This is performed because all three parameters ( r m a x , α , δ * ) characterizing the yaw rate reference shape are function of vehicle traveling speed. The results of the steering pad constant speed maneuver for a vehicle speed of 72 km/h for both the baseline and the sporty vehicle setups are reported in Figure 7, where the fitted reference yaw rate function is also reported.
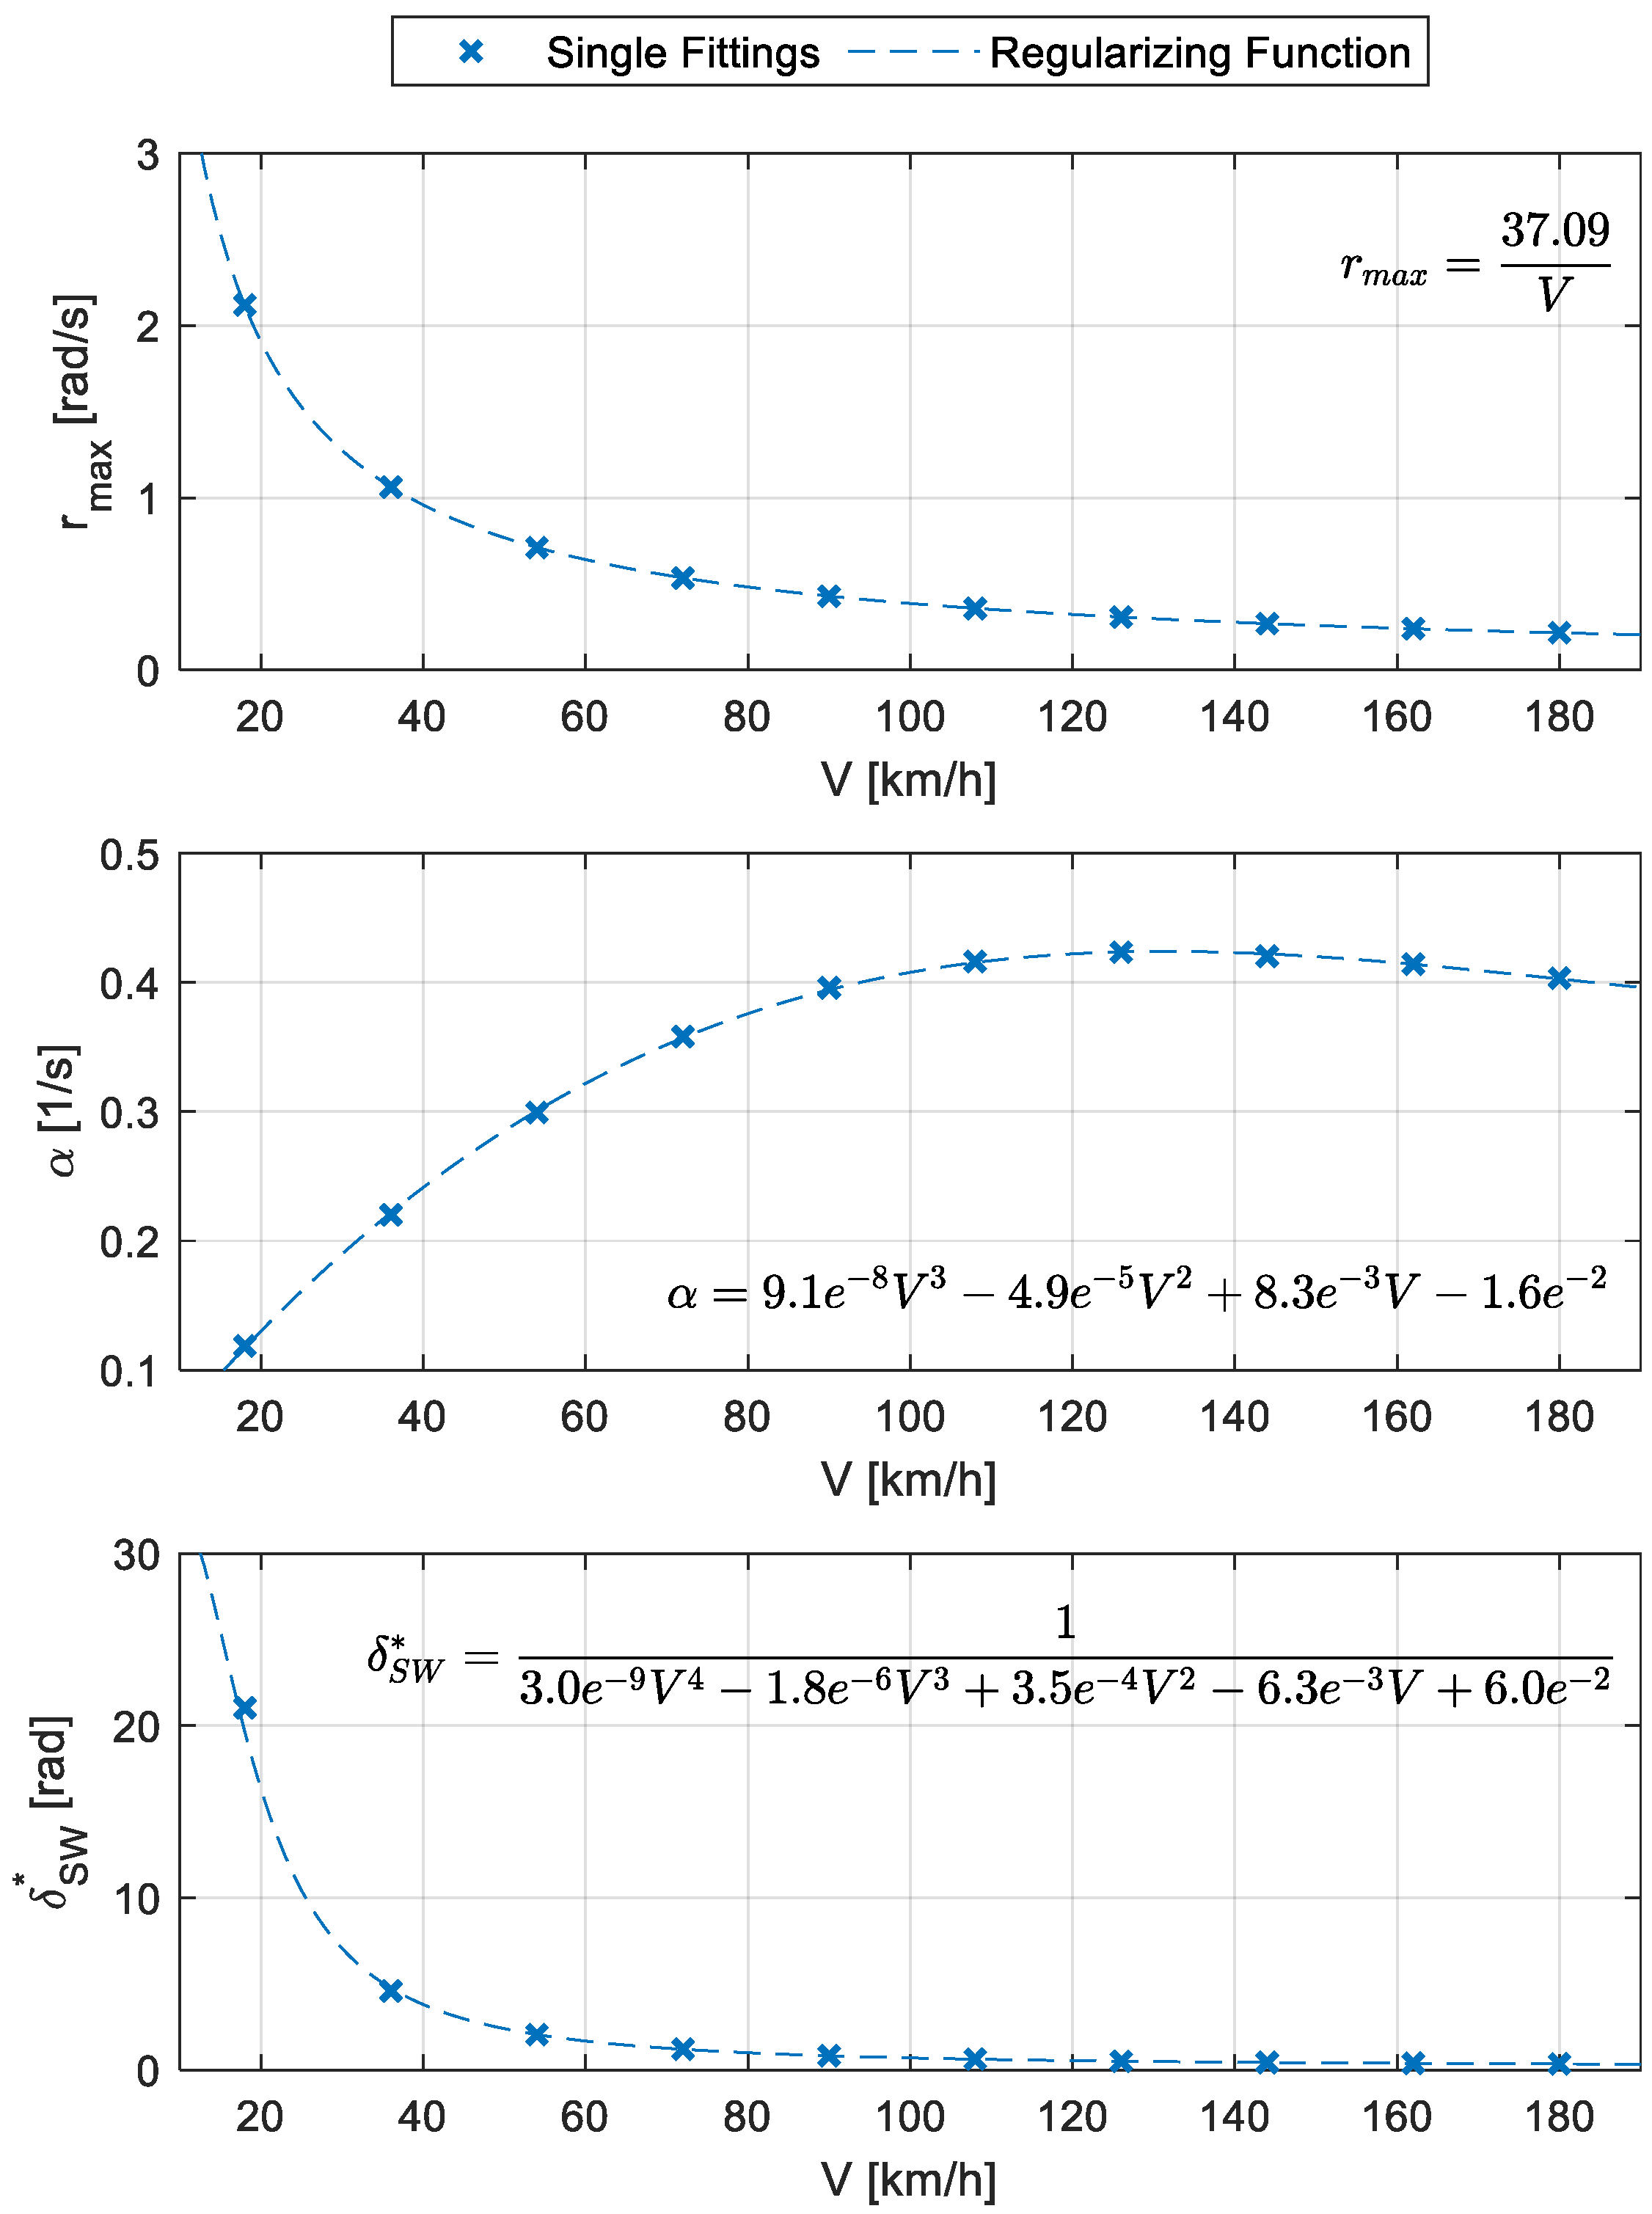
From the results in Figure 7, it is evident how the sporty suspension setup can achieve a higher yaw rate limit value as compared to the baseline suspension setup. Moreover, the sporty vehicle also shows a slightly increased slope of the linear response region, together with a slightly sharper transition towards the yaw rate saturation region, as compared to the baseline vehicle. For what concerns the yaw rate reference for the active vehicle, it is instead possible to appreciate how it closely tracks the response of the vehicle equipped with the sporty suspension setup. Nevertheless, the yaw rate reference should be computed for any vehicle speed, including those in between the currently tested values, of which the results in Figure 7 are just an example. This is the reason why the reference function characteristic coefficients ( r m a x , α , δ * ) are regularized through a proper fitting, as shown in Figure 8. In particular, Figure 8 reports the coefficient values for each single fitting together with the line representation and the mathematical expression of the regularizing function. In there, it can be appreciated how both the maximum attainable yaw rate ( r m a x ) and the steering wheel angle ( δ S W * ) at which there is the transition between linear and saturation regions of the yaw rate response, are decreasing more than linearly with increasing vehicle speed. Conversely, the slope ( α ) of the linear region of the yaw rate response has a non-monotonic trend, with a maximum at approximately 130 km/h.

3.2. High-Level Controller

The high-level controller is designed to define the proper yaw moment ( M z ) to be applied to the vehicle for tracking the yaw rate reference ( r r e f ) and it is composed of the sum of a feedforward ( M z , F F ) and a feedback ( M z , F B ) contribution.
M z = M z , F F + M z , F B
The feedforward contribution is a function of the wheel steering angle commanded by the driver, while the feedback contribution is the output of a PI controller aiming at minimizing the yaw rate deviation from its reference value.
M z , F F = k δ δ
M z , F B = k P ( r r e f r ) + k I 0 t ( r r e f r ) d t
For tuning the gain of the feedforward yaw moment contribution ( k δ ), it is possible to rely again on the single-track vehicle model equations, where the input yaw moment is the feedforward contribution only. By reverting this formulation to the frequency domain through the Laplace transform, it is possible to obtain the yaw rate response as function of the input wheel steering angle.
r δ ( s ) = m V 2 ( k y , f l f + k δ ) s + V [ k y , f k y , r l + k δ ( k y , f + k y , r ) ] m J z V 2 s 2 + V [ m ( k y , r l r 2 + k y , f l f 2 ) + J z ( k y , f + k y , r ) ] s + k y , f k y , r l 2 + m V 2 ( k y , r l r k y , f l f )
From the obtained transfer function, it is then possible to compute the static gain of the yaw rate with respect to the input steering angle.
μ r / δ = V l ( 1 + K U S V 2 ) [ 1 + k δ ( k y , f + k y , r ) k y , f k y , r l ] = α [ 1 + k δ ( k y , f + k y , r ) k y , f k y , r l ]
Remembering that the objective of the present study is to obtain an active vehicle featuring the baseline suspension setup that performs in cornering as the vehicle featuring the sporty suspension setup, it is possible to impose the static gains equality for obtaining the feedforward gain
μ r / δ , A C T I V E = μ r / δ , S P O R T Y             k δ = k y , f k y , r l k y , f + k y , r α S P O R T Y α B A S E α B A S E
where α B A S E and α S P O R T Y are the slope of the linear yaw rate response region for the baseline and the sporty vehicles, respectively. The feedback control gains ( k P , k I ) are instead tuned with a model-based approach based on the Maclaurin series expansion [19], with the objective of obtaining a robust and stable controlled system that performs as closely as possible to the sporty vehicle.

3.3. Low-Level Controller

The low-level controller is also designed to convert the total torque required by the driver ( T m , D ) and the yaw moment required by the high-level controller ( M z ) into driving or braking torque ( T m , i ) to be developed by IWMs. The driving torque required by the driver is split among the two axles according to the static weight distribution with the same torque applied at the left and right wheels of each axle. This guarantees a null yaw moment while driving. The required yaw moment is instead generated by applying additional driving moments of equal magnitude and opposite signs to the left and the right wheel of each axle. The additional driving moment for generating the required is again split between the two axles according to the static weight distribution of the vehicle. The resulting control laws for IWMs torque allocation are reported in the following
T m , F R = 1 2 f W D [ T m , D + M z   R w t ]
T m , F L = 1 2 f W D [ T m , D M z   R w t ]
T m , R R = 1 2 ( 1 f W D ) [ T m , D + M z   R w t ]  
T m , R L = 1 2 ( 1 f W D ) [ T m , D M z   R w t ]
where f W D is the weight distribution factor, R w is the effective wheel radius and t is the vehicle half-track width. The weight distribution factor ( f W D ) is defined as the ratio between the static vertical forces acting at the front axle and the static vertical forces acting at all four wheels.

4. Results

The effectiveness of the proposed control strategy applied on the vehicle with the baseline suspension setup for tracking the lateral dynamics performance of the vehicle featuring the sporty suspension setup is assessed through numerical simulations. The validated vehicle model for simulation purposes is again implemented using VI-Grade CarRealTime 2022 software and is the same S-segment vehicle previously presented, whose main data are reported in Table 1. The proposed results encompass both transient and steady-state maneuvers, spanning from open-loop to closed-loop modalities and considering a high friction (μ = 1.0) condition. The results obtained with the proposed actively controlled vehicle are compared in terms of cornering performance and energy consumption with the passive vehicles featuring the baseline and the sporty suspension setups, which are considered as the conventional reference.

4.1. Straight-Line Constant Speed Maneuver

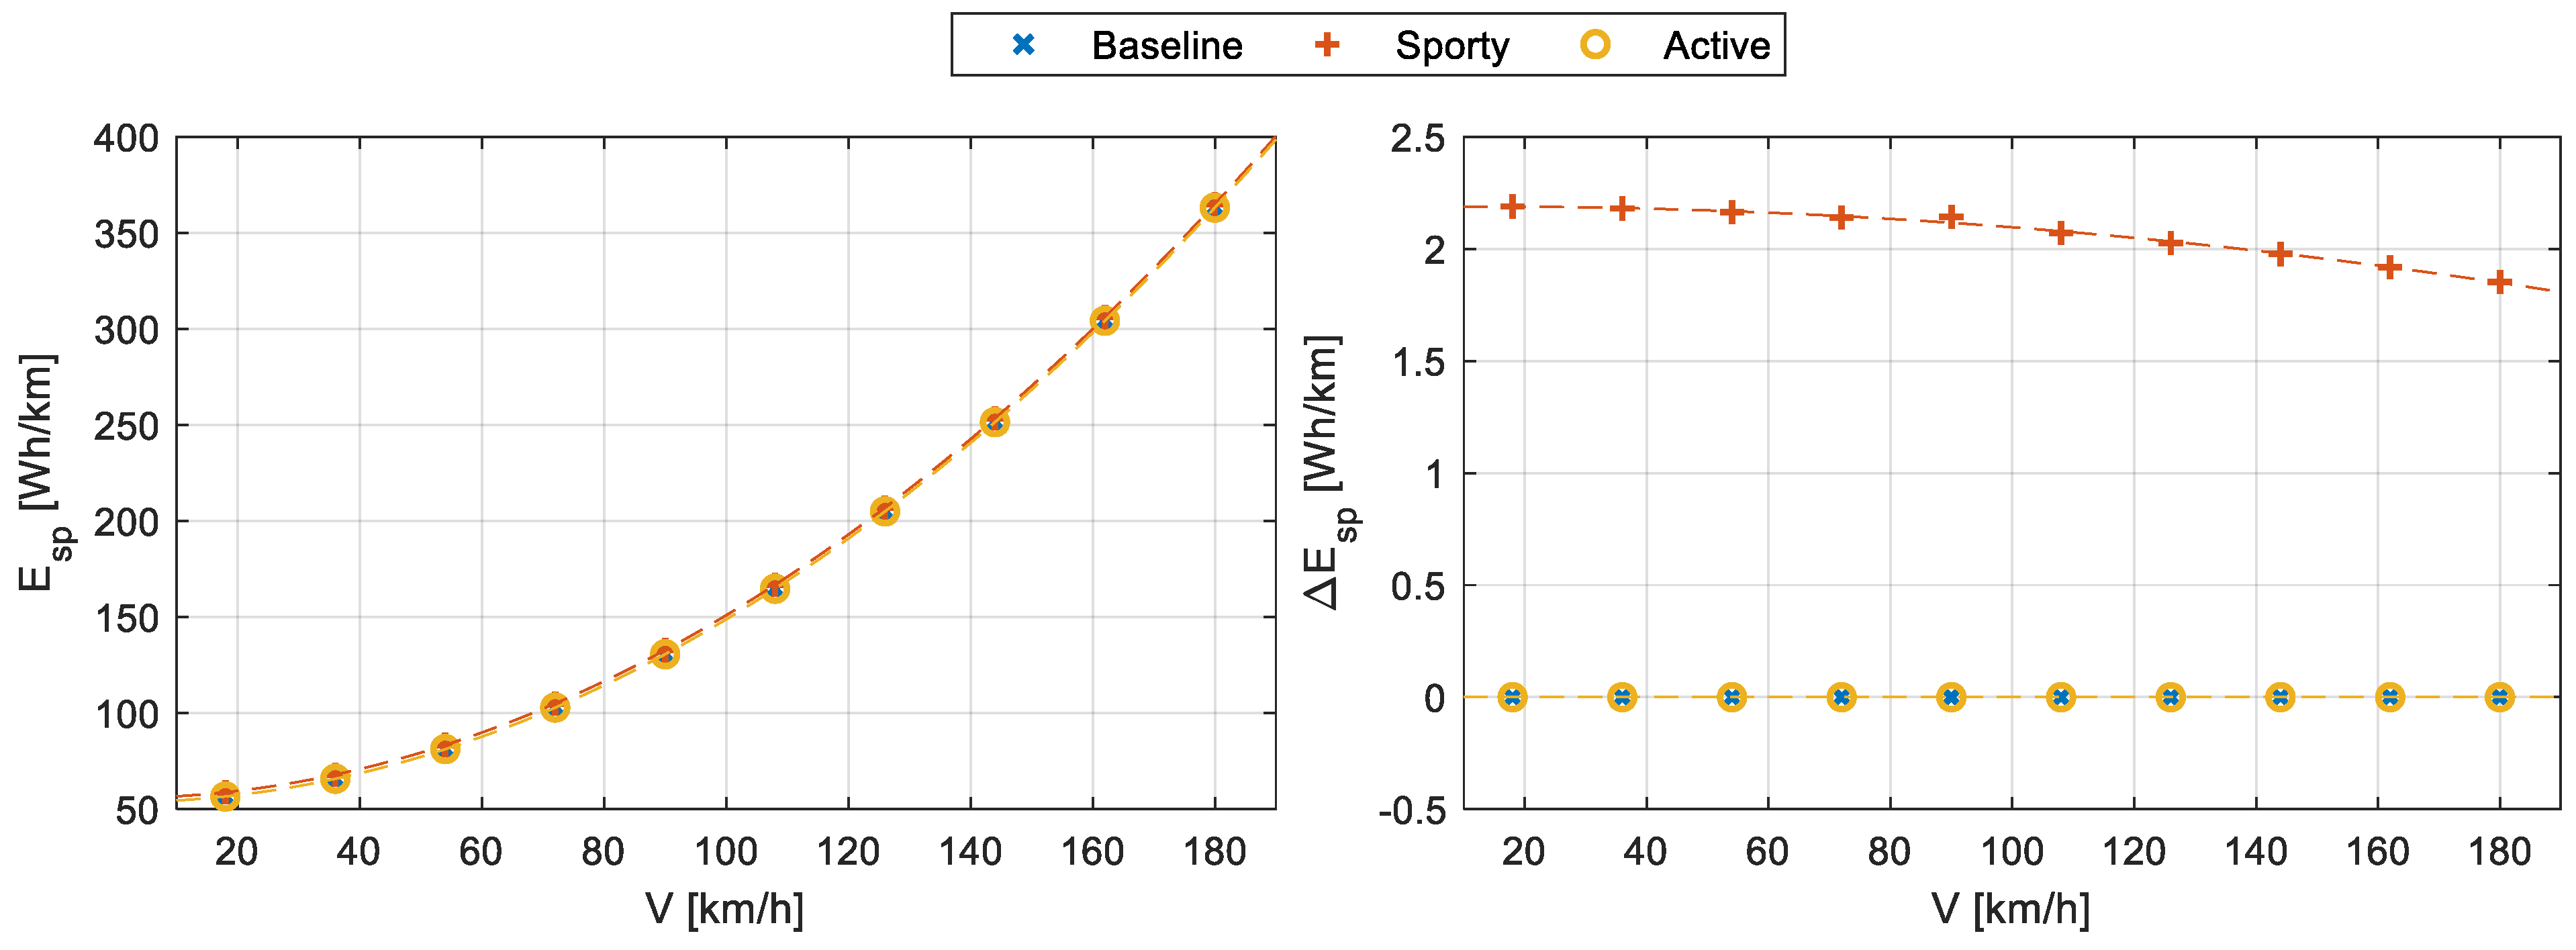
A straight-line constant speed maneuver has been simulated to evaluate the effects of the three different vehicle configurations on energy consumption. This maneuver is performed at several speeds ranging from 5 m/s to 50 m/s with a discretization of 5 m/s. The results in terms of specific energy consumption for the straight-line constant speed maneuver are reported in Figure 9 for the different available running speeds.
From Figure 9, it is possible to appreciate how the specific energy consumption ( E s p ) increases more than linearly with vehicle speed because of the aerodynamic resistance, while apparently not showing significant differences for the three inspected vehicle configurations. Nevertheless, by looking at the variation of the specific energy consumption ( E s p ) with respect to the baseline vehicle, it can be noticed how the sporty vehicle requires more energy than the baseline vehicle to maintain a constant speed in a straight line, with this variation reducing going towards high speeds. This phenomenon could be explained by considering that, for an increasing vehicle speed, the lateral slip velocity generating power losses at the tire-ground contact tends to decrease. Instead, the active vehicle shows the same energy consumption as the baseline vehicle when in a straight line because its torque vectoring capabilities are not used in straight running.

4.2. Steering Pad Constant Speed Maneuver

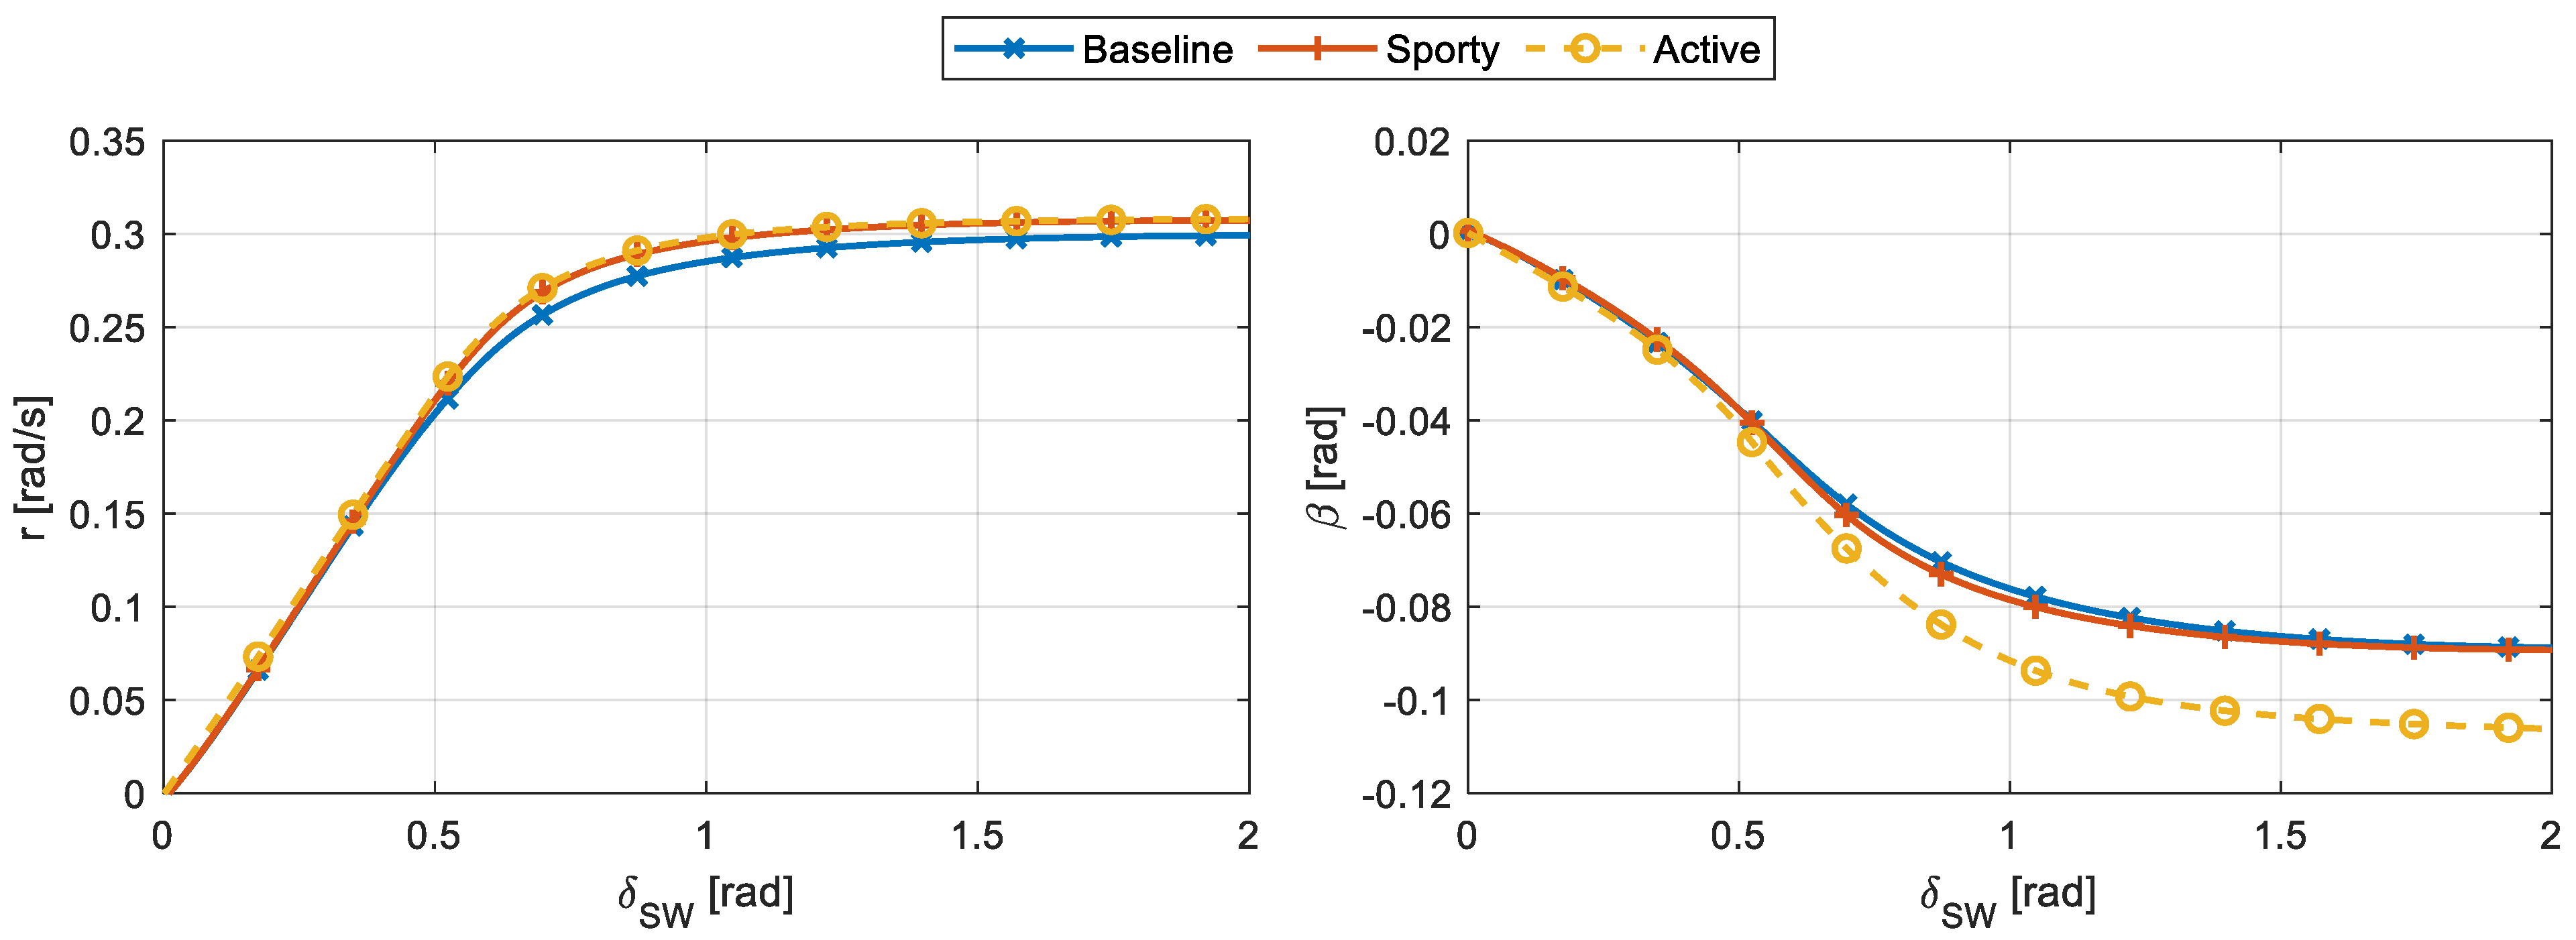
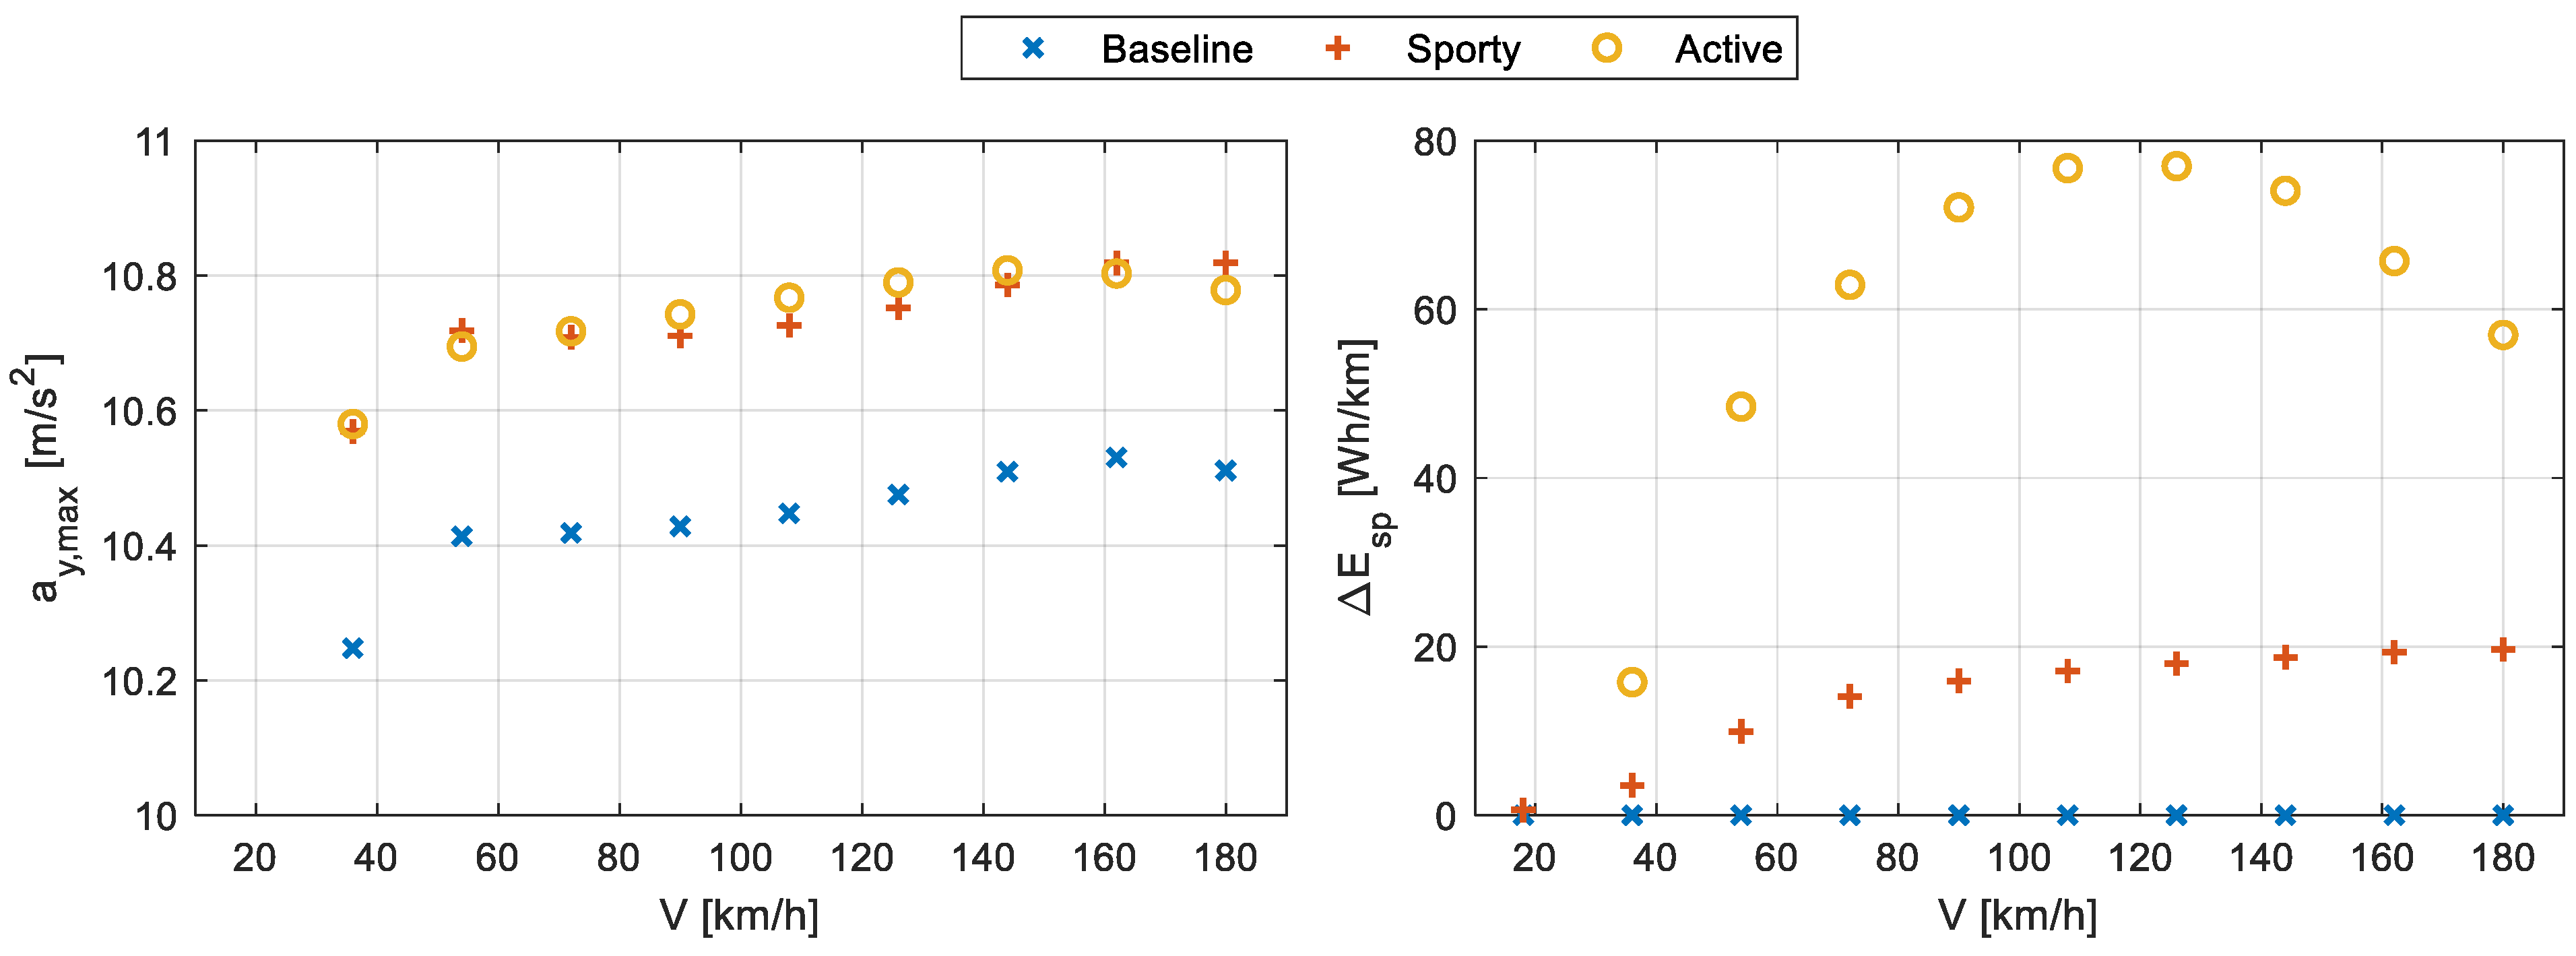
The steady-state handling performance of the proposed vehicle configurations under high friction conditions is evaluated through an ISO 4138 [20] steering pad constant speed maneuver, where the speed is kept constant and the steering wheel angle is progressively increased at a constant rate. The selected constant speeds for the maneuver range from 5 m/s to 50 m/s with a discretization of 5 m/s. The maximum steering wheel angle is selected through incremental adjustments in 5-degree steps until the baseline vehicle response achieves a minimum of 99% of the maximum achievable lateral acceleration. The duration for increasing the steering wheel angle from straight-ahead to the maximum value is selected based on the authors’ prior knowledge to comply with the steady-state maneuver limits outlined in the ISO 4138 standard [20]. The handling response results for the specific maneuver at 126 km/h are reported in Figure 10 as an example, while the results summarizing the handling and energy consumption performance at all the inspected speeds are reported in Figure 11.
Analyzing the results in Figure 10, it is evident how the active vehicle featuring torque vectoring capabilities is able to track the yaw rate reference aiming at reproducing the sporty vehicle configuration. Indeed, the active and the sporty vehicle yaw rate responses match, and they both show an improvement in vehicle cornering response. The yaw rate response improvement of the active vehicle with respect to the baseline vehicle is obtained thanks to the torque vectoring capabilities of the active vehicle, but this improvement comes at the expense of having a higher sideslip angle. Indeed, the sideslip angle is pretty similar for the baseline and the sporty vehicle configurations, while it shows a steeper variation with the input steering wheel angle and settles at a higher value for the active vehicle configuration.
The results in Figure 11 about the maximum achieved lateral acceleration during the steering pad constant speed maneuver suggest that both the sporty and the active vehicle configurations can achieve superior performance with respect to the baseline vehicle configuration. Moreover, between the sporty and the active vehicle configurations, there is not one prevailing over the other for improvement in cornering response. Indeed, at low and high speeds, the sporty vehicle is attaining the higher maximum lateral acceleration, while in the intermediate speed range, the active vehicle is achieving the best performance. Figure 11 also reports the variation of specific energy consumption for the sporty and active vehicle configurations with respect to the baseline one. Both the sporty and the active vehicle configurations appear to require more energy for performing a turn, with the specific energy increase for the active vehicle being almost four times the one for the sporty vehicle. Nevertheless, it is to point out that this increase in specific energy consumption is taking place for the same steering wheel angle time histories but for different trajectories because of a different vehicle cornering response. For this reason, the energy consumption comparison in a turn could be better analyzed from the results of a constant radius cornering maneuver, where all vehicle configurations are forced to follow the same trajectory.

4.3. Constant Radius Cornering Maneuver

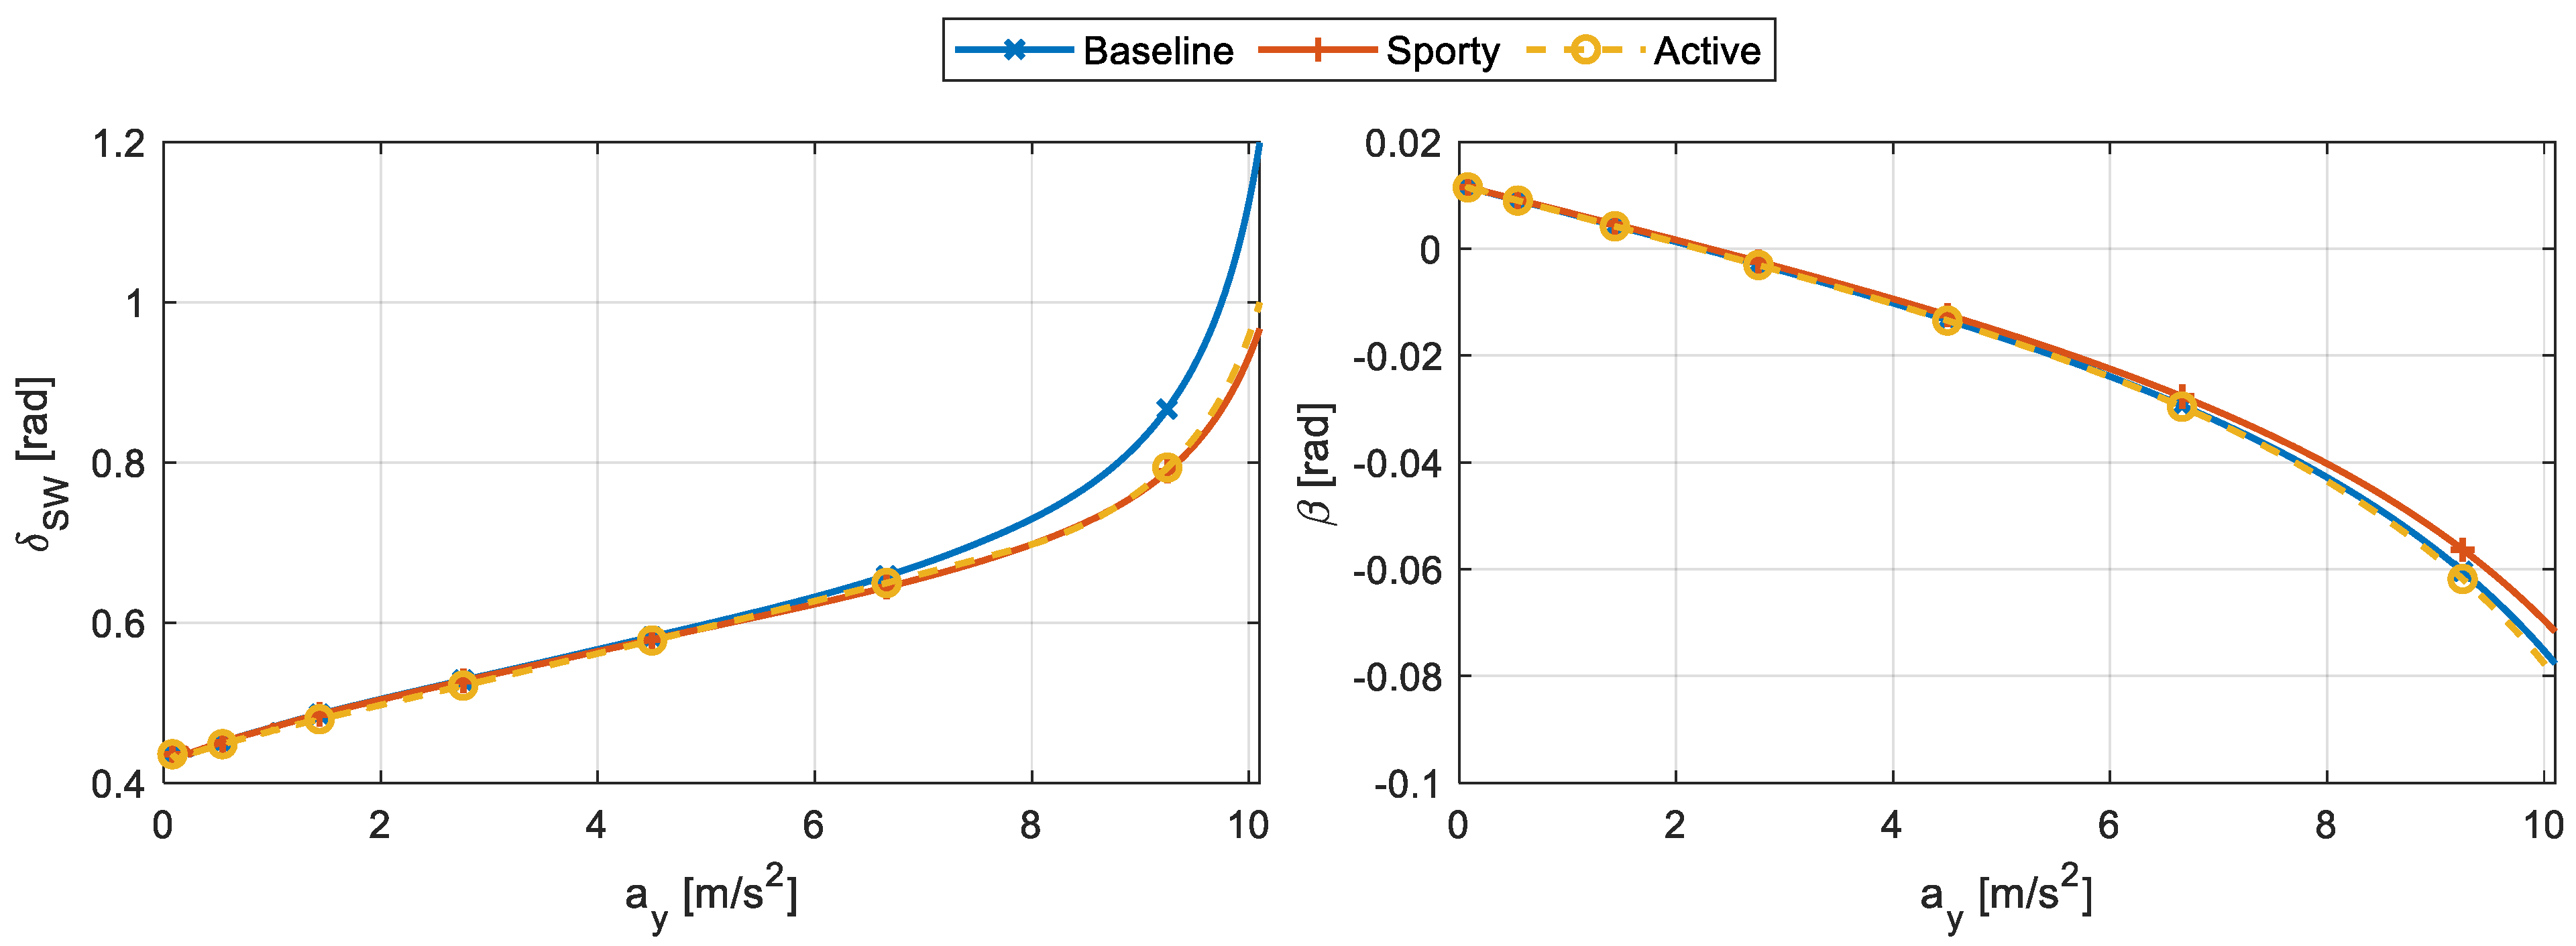
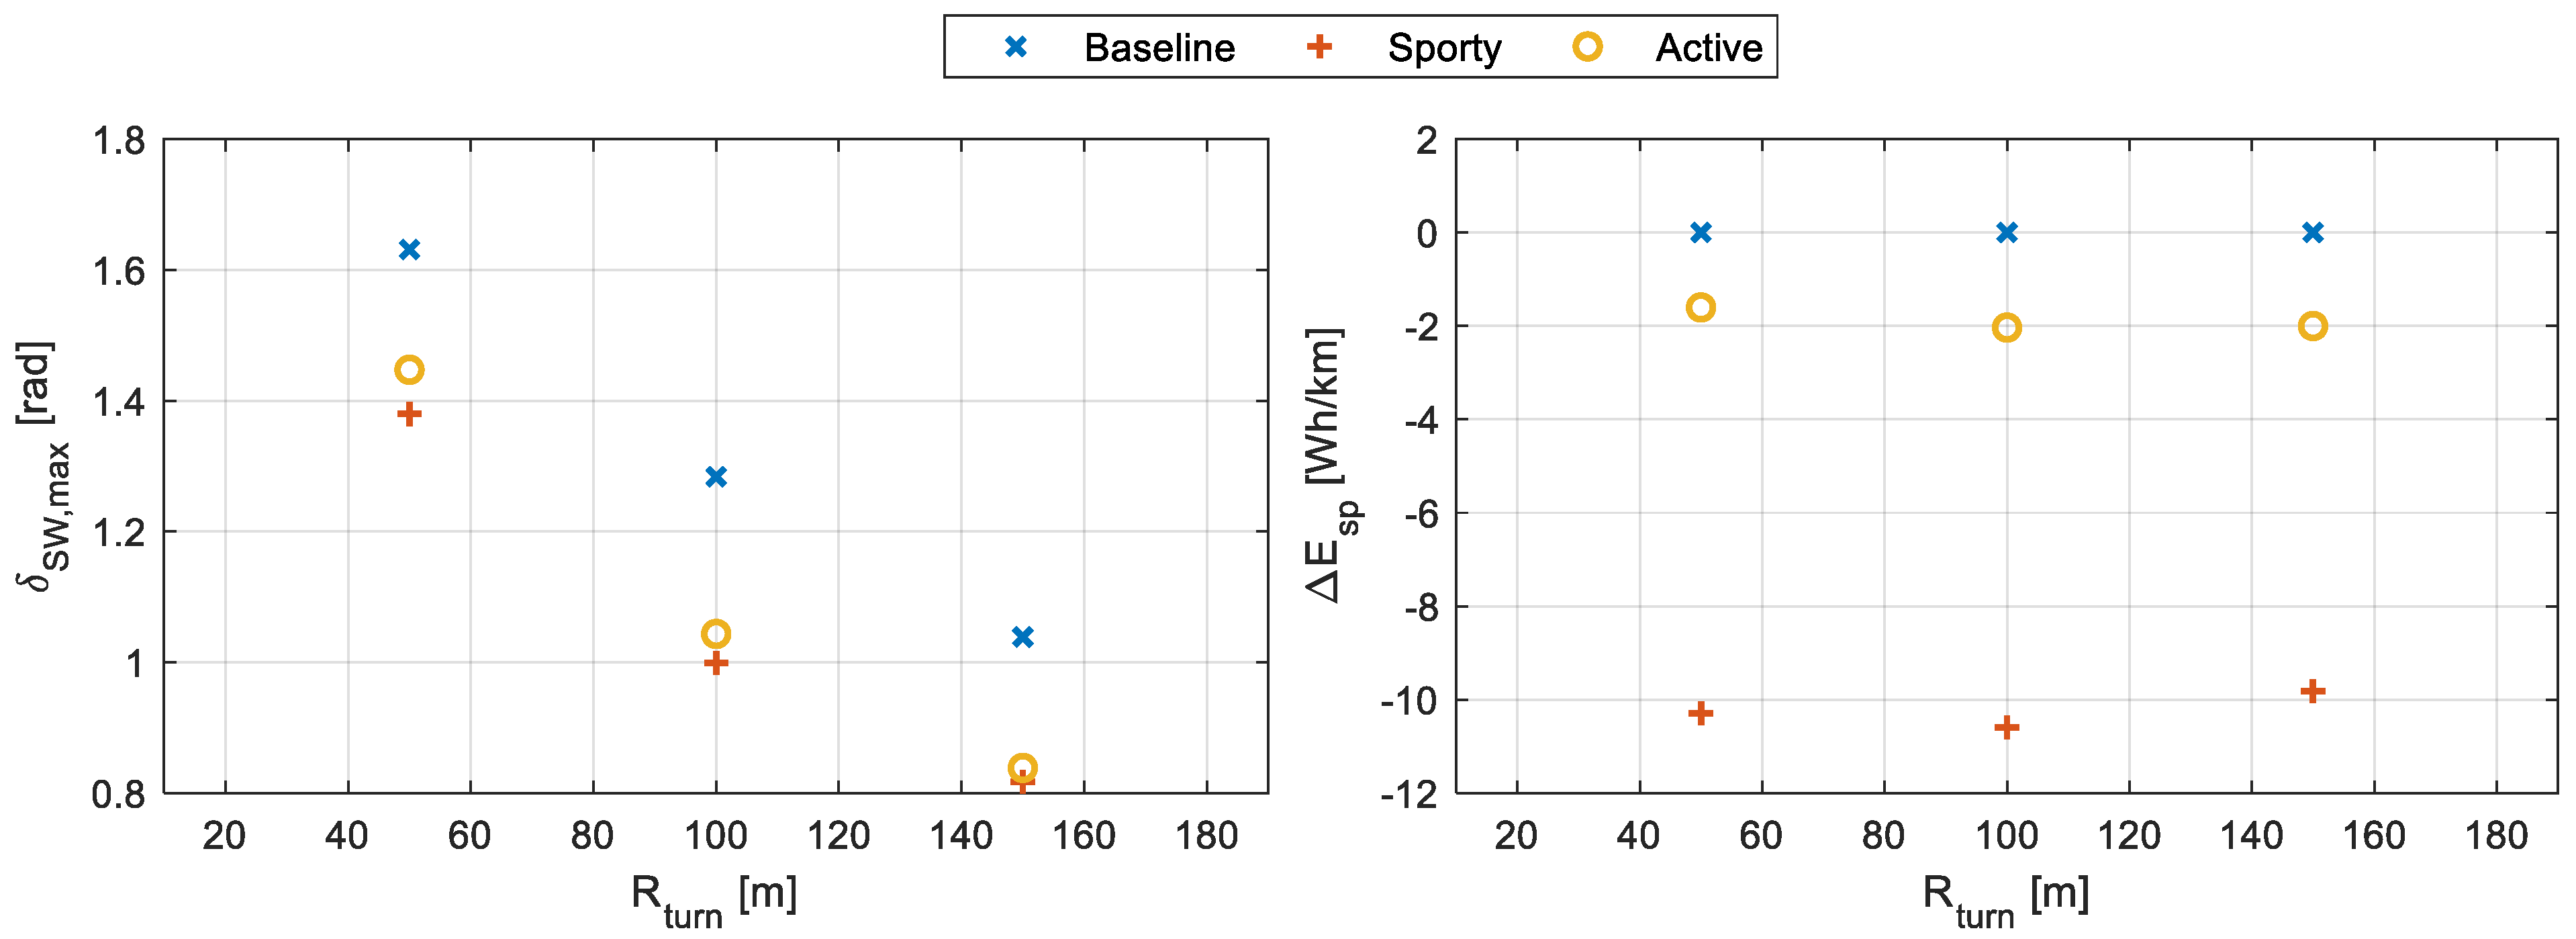
The steady-state handling performance of the proposed vehicle configurations under high friction conditions is also evaluated through an ISO 4138 [20] constant radius cornering maneuver, where the speed is progressively increased at a constant rate and the steering wheel angle is adjusted in close-loop to follow a circular trajectory. The speed is increased starting from 10 km/h up to the value leading the baseline vehicle to achieve a minimum of 99% of the maximum achievable lateral acceleration for the selected turn radius. The increase rate of the speed is selected so as to guarantee that the acceleration rate is lower than 0.1 m/s2/s, as required by the ISO 4138 standard [20]. Three turn radii are selected for the present study, starting from the recommended one of 100 m and moving 50 m from it, both in the increasing and decreasing direction. The handling response results for the specific maneuver with a 100 m turn radius are reported in Figure 12 as an example, while the results summarizing the handling and energy consumption performance for all the inspected turn radii are reported in Figure 13.
The results in Figure 12, representing the trend of the steering wheel angle as a function of the vehicle lateral acceleration, are again showing an almost equivalent cornering performance of the sporty and active vehicle configurations, which are superior to the baseline one. Indeed, the baseline vehicle requires a higher steering wheel angle input to perform a turn having the same radius of curvature. Moreover, if analyzing the sideslip angle, it is possible to notice how the baseline and the active vehicle configurations exhibit the same response, while the sporty vehicle is also capable of reducing the sideslip angle. This phenomenon can be attributed to the suspension angle configurations, especially regarding the toe angle.
The results in Figure 13 about the maximum steering wheel angle commanded for successfully completing the maneuver suggest that the active vehicle is slightly more demanding than the sporty one, while the baseline vehicle is significantly more demanding than both the other configurations in terms of steering input requirements. Instead, for what concerns the variation of specific energy consumption for the sporty and active vehicle configurations with respect to the baseline one in Figure 13, it is possible to notice how both the sporty and the active vehicle configurations require lower energy than the baseline one for running a constant radius turn. In particular, the energy savings of the sporty vehicle are almost five times those achieved with the active vehicle. This is mainly due to a lower longitudinal slip of the outer tires of the sporty vehicle as compared to those obtained with the active vehicle, which increases the longitudinal forces at the outer wheels of the turn to improve the vehicle cornering response. Moreover, the lower input steering angle required by the sporty vehicle as compared to the active one reduces the tire slip angles and thus the power losses due to the lateral slip speed at the tire-ground contact.

4.4. Double-Lane-Change Maneuver

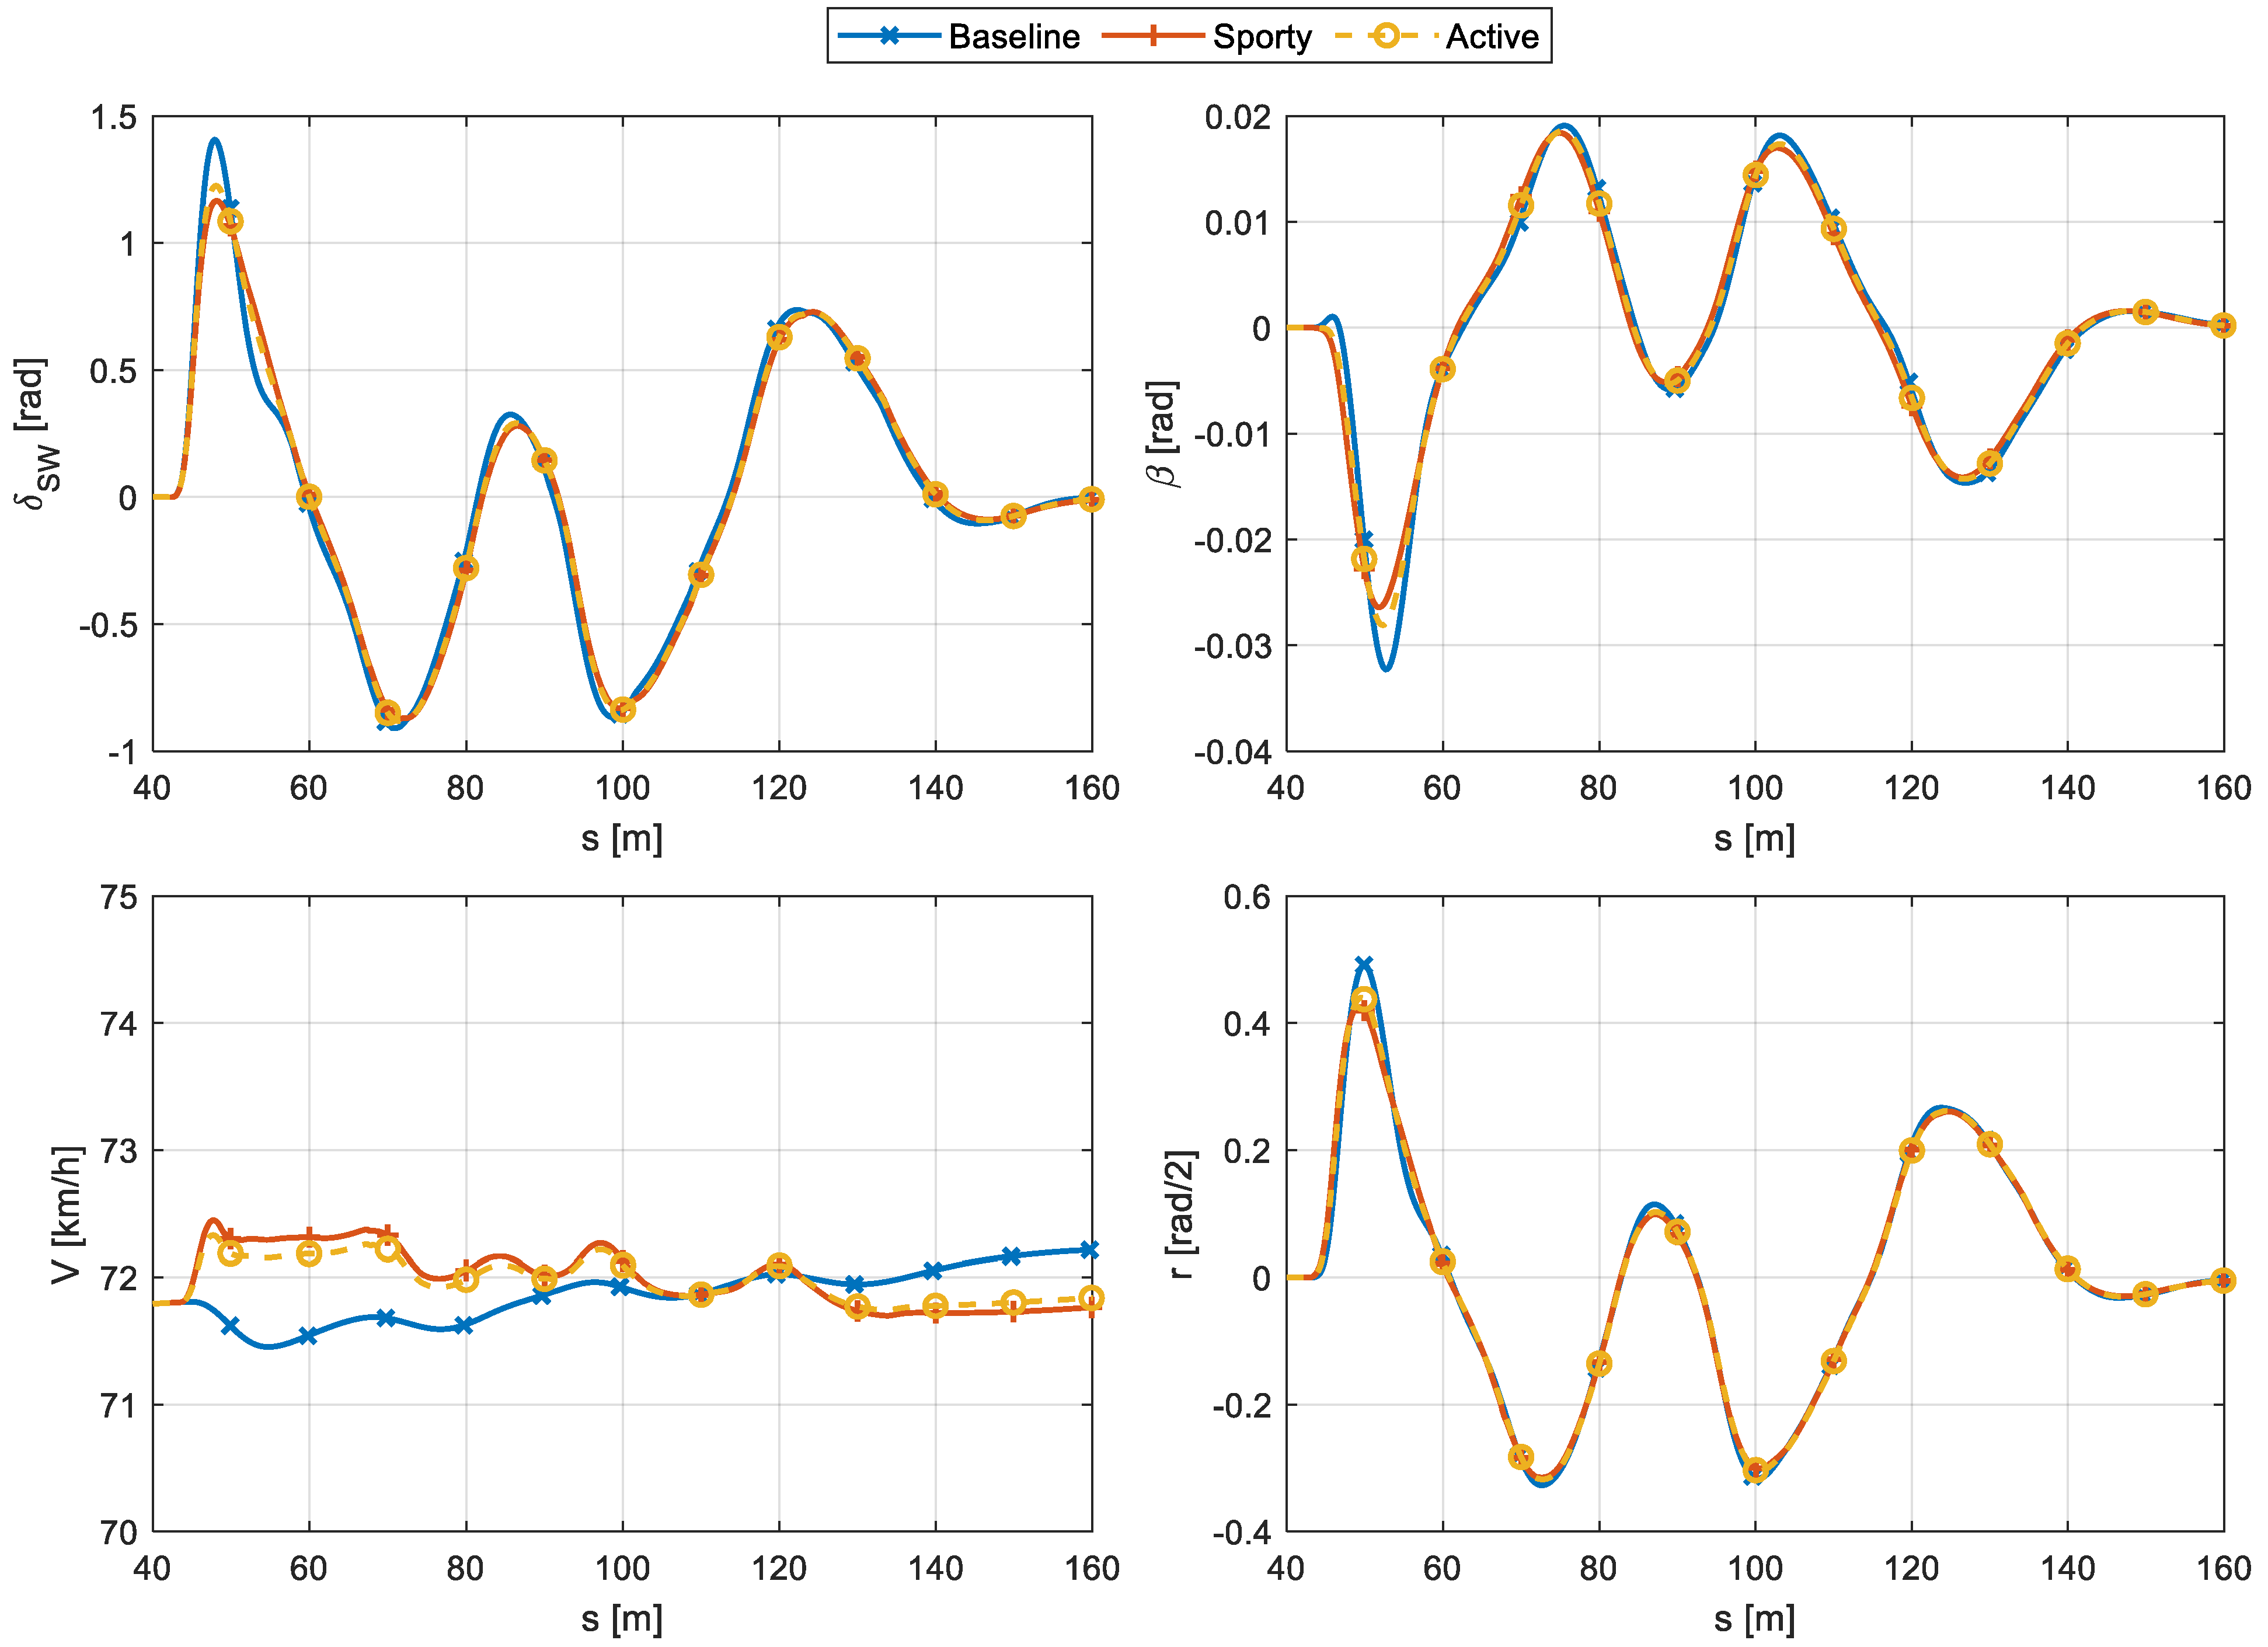
The transient performances of the proposed vehicle configurations are assessed through steering wheel close-loop simulations involving an ISO 3888 [21] double-lane-change maneuver under high friction conditions. The maneuver starting speed is determined iteratively by incrementing it until the baseline vehicle strikes at least one cone of the ISO 3888 [21] test course. The results for the double-lane-change maneuver are reported in Figure 14, where the performances of the three available vehicle configurations are compared.
Upon examining the results in Figure 14, it is evident that the sporty and the active vehicle configurations are closely performing even in transient conditions, meaning a proper design and tuning of the torque vectoring controller. Moreover, the trends identified with the steady-state tests are confirmed. Indeed, the sporty and active vehicles are in general able to enhance the vehicle cornering performance, with the active vehicle requiring a slightly larger steering wheel angle input and showing a slightly higher sideslip angle as compared to the sporty vehicle. For what concerns power consumption, the baseline vehicle is the most requiring ( E s p , B A S E = 137.9 Wh/km), with then the active vehicle ( E s p , A C T I V E = 132.4 Wh/km), which, in this case, is just slightly more energy-consuming than the sporty one ( E s p , S P O R T Y = 130.8 Wh/km).

5. Conclusions

The application of torque vectoring for improving vehicle lateral dynamics has been a widely discussed topic for several years. Nevertheless, the design of a torque vectoring controller, jointly with suspension parameters tuning for improving vehicle cornering capabilities while retaining good energy efficiency, is still missing. In this paper, the effects of suspension setup parameters on both vehicle handling properties and vehicle specific energy consumption have been analyzed. On this basis, a baseline and a sporty suspension setup have been defined and a torque vectoring controller has been designed for having an active vehicle equipped with the baseline suspension setup but reproducing the handling properties of the sporty vehicle. Several steady-state and transient maneuvers have been simulated to demonstrate the effectiveness of the proposed method. In particular, the results of steady-state maneuvers confirm the fact that the actively controlled vehicle is able to closely track the performance of the sporty vehicle by leveraging its torque vectoring capabilities to enhance the baseline vehicle handling properties. In terms of energy savings, the active vehicle performs better than the sporty one for straight-line conditions, while slightly worse in turns. The results of transient maneuvers confirm the results of steady-state maneuvers for what concerns handling but with an energy saving of the active vehicle, which is significantly approaching the one attained by the sporty vehicle. As expected, a trade-off is always required between the cornering performance improvement and the energy consumption savings from the active vehicle as compared to the sporty one. Consequently, a wide database of common road driving cycles could be used in future applications of the proposed methodology to optimize vehicle energy consumption under its typical usage.
Author Contributions

M.A.: methodology, software, formal analysis, writing—original draft preparation and writing—review and editing; M.V.: conceptualization and resources; E.S.: conceptualization and supervision. All authors have read and agreed to the published version of the manuscript.

Funding

This research received no external funding.

Data Availability Statement

The original contributions presented in the study are included in the article, further inquiries can be directed to the corresponding author.

Conflicts of Interest

The authors declare no conflicts of interest.

References

  1. Requia, W.J.; Mohamed, M.; Higgins, C.D.; Arain, A.; Ferguson, M. How Clean Are Electric Vehicles? Evidence-Based Review of the Effects of Electric Mobility on Air Pollutants, Greenhouse Gas Emissions and Human Health. Atmos. Environ. 2018, 185, 64–77. [Google Scholar] [CrossRef]
  2. Afkar, A.; Mahmoodi-Kaleibar, M.; Paykani, A. Geometry Optimization of Double Wishbone Suspension System via Genetic Algorithm for Handling Improvement. J. Vibroeng. 2012, 14, 827–837. [Google Scholar]
  3. Kwon, S.-J.; Kim, T.-L.; Kim, C.-J. Optimal Selection of Suspension and Tires for Vehicles’ Cornering Performance. Machines 2022, 10, 1032. [Google Scholar] [CrossRef]
  4. Uys, P.E.; Els, P.S.; Thoresson, M. Suspension Settings for Optimal Ride Comfort of Off-Road Vehicles Travelling on Roads with Different Roughness and Speeds. J. Terramech. 2007, 44, 163–175. [Google Scholar] [CrossRef]
  5. Mitra, A.C.; Patil, M.V.; Banerjee, N. Optimization of Vehicle Suspension Parameters for Ride Comfort Based on RSM. J. Inst. Eng. India Ser. C 2015, 96, 165–173. [Google Scholar] [CrossRef]
  6. Mitra, A.C.; Soni, T.; Kiranchand, G.R. Optimization of Automotive Suspension System by Design of Experiments: A Nonderivative Method. Adv. Acoust. Vib. 2016, 2016, e3259026. [Google Scholar] [CrossRef]
  7. He, H.; Li, Y.; Clare, L.; Jiang, J.Z.; Al Sakka, M.; Dhaens, M.; Burrow, S.; Neild, S.; Conn, A. A Configuration-Optimisation Method for Passive-Active-Combined Suspension Design. Int. J. Mech. Sci. 2023, 258, 108560. [Google Scholar] [CrossRef]
  8. Wloch, K.; Bentley, P.J. Optimising the Performance of a Formula One Car Using a Genetic Algorithm. In Proceedings of the Parallel Problem Solving from Nature—PPSN VIII, Birmingham, UK, 18–22 September 2004; Yao, X., Burke, E.K., Lozano, J.A., Smith, J., Merelo-Guervós, J.J., Bullinaria, J.A., Rowe, J.E., Tiňo, P., Kabán, A., Schwefel, H.-P., Eds.; Springer: Berlin/Heidelberg, Germany, 2004; pp. 702–711. [Google Scholar]
  9. Rinderknecht, S.; Meier, T. Electric Power Train Configurations and Their Transmission Systems. In Proceedings of the SPEEDAM 2010, Pisa, Italy, 14–16 June 2010; pp. 1564–1568. [Google Scholar]
  10. Murata, S. Innovation by In-Wheel-Motor Drive Unit. Veh. Syst. Dyn. 2012, 50, 807–830. [Google Scholar] [CrossRef]
  11. Katsuyama, E.; Yamakado, M.; Abe, M. A State-of-the-Art Review: Toward a Novel Vehicle Dynamics Control Concept Taking the Driveline of Electric Vehicles into Account as Promising Control Actuators. Veh. Syst. Dyn. 2021, 59, 976–1025. [Google Scholar] [CrossRef]
  12. Asperti, M.; Vignati, M.; Sabbioni, E. On Torque Vectoring Control: Review and Comparison of State-of-the-Art Approaches. Machines 2024, 12, 160. [Google Scholar] [CrossRef]
  13. Dizqah, A.M.; Lenzo, B.; Sorniotti, A.; Gruber, P.; Fallah, S.; De Smet, J. A Fast and Parametric Torque Distribution Strategy for Four-Wheel-Drive Energy-Efficient Electric Vehicles. IEEE Trans. Ind. Electron. 2016, 63, 4367–4376. [Google Scholar] [CrossRef]
  14. De Filippis, G.; Lenzo, B.; Sorniotti, A.; Gruber, P.; De Nijs, W. Energy-Efficient Torque-Vectoring Control of Electric Vehicles With Multiple Drivetrains. IEEE Trans. Veh. Technol. 2018, 67, 4702–4715. [Google Scholar] [CrossRef]
  15. Pennycott, A.; Novellis, L.D.; Gruber, P.; Sorniotti, A.; Goggia, T. Enhancing the Energy Efficiency of Fully Electric Vehicles via the Minimization of Motor Power Losses. In Proceedings of the 2013 IEEE International Conference on Systems, Man, and Cybernetics, Manchester, UK, 13–16 October 2013; pp. 4167–4172. [Google Scholar]
  16. De Novellis, L.; Sorniotti, A.; Gruber, P. Driving Modes for Designing the Cornering Response of Fully Electric Vehicles with Multiple Motors. Mech. Syst. Signal Process. 2015, 64–65, 1–15. [Google Scholar] [CrossRef]
  17. Mangia, A.; Lenzo, B.; Sabbioni, E. An Integrated Torque-Vectoring Control Framework for Electric Vehicles Featuring Multiple Handling and Energy-Efficiency Modes Selectable by the Driver. Meccanica 2021, 56, 991–1010. [Google Scholar] [CrossRef]
  18. Asperti, M.; Dhingra, D.; Vignati, M.; Sabbioni, E. Multi Input Multi Output Lateral Dynamics Control of an Electric Vehicle. Proc. Inst. Mech. Eng. Part D J. Automob. Eng. 2024. [Google Scholar] [CrossRef]
  19. Visioli, A. Model-Based PID Tuning for High-Order Processes: When to Approximate. In Proceedings of the 44th IEEE Conference on Decision and Control, Seville, Spain, 12–15 December 2005; pp. 7127–7132. [Google Scholar]
  20. ISO 4138:2012; Passenger Cars—Steady-State Circular Driving Behaviour—Open-Loop Test Methods. International Organization for Standardization: Geneva, Switzerland, 2012.
  21. ISO 3888-1:2018; Passenger Cars—Test Track for a Severe Lane-Change Manoeuvre. International Organization for Standardization: Geneva, Switzerland, 2018.
Figure 1. Front suspension angles (Camber γ – Toe τ ) effects on vehicle yaw rate ( r ) and sideslip angle ( β ) responses during a steering pad constant speed maneuver.
Energies 17 02903 g001
Figure 2. Front suspension angles (Camber γ – Toe τ ) effects on vehicle maximum achievable steady-state lateral acceleration ( a y , m a x ).
Energies 17 02903 g002
Figure 3. Front suspension angles (Camber γ – Toe τ ) effects on vehicle understeering coefficient ( K U S ).
Energies 17 02903 g003
Figure 4. Front suspension angles (Camber γ – Toe τ ) effects on vehicle-specific energy consumption ( E s p ) in constant speed straight-line running.
Energies 17 02903 g004
Figure 5. Single-Track Model (STM) of a vehicle in turn with torque vectoring capabilities.
Energies 17 02903 g005
Figure 6. Torque vectoring control architecture.
Energies 17 02903 g006
Figure 7. Steering pad constant speed maneuver vehicle handling response at a traveling speed of 72 km/h with both baseline and sporty suspension setup, together with the reference yaw rate fitted to the sporty vehicle response.
Energies 17 02903 g007
Figure 8. Regularization of reference yaw rate function coefficients as function of vehicle speed.
Energies 17 02903 g008
Figure 9. Straight-line constant speed maneuver vehicle-specific energy consumption ( E s p ) with the three available vehicle configurations and specific energy consumption variation ( E s p ) with respect to the baseline vehicle configuration.
Energies 17 02903 g009
Figure 10. Steering pad constant speed maneuver vehicle handling response (yaw rate r and sideslip angle β ) at a traveling speed of 126 km/h with the three available vehicle configurations.
Energies 17 02903 g010
Figure 11. Steering pad constant speed maneuver vehicle maximum achieved lateral acceleration ( a y , m a x ) with the three available vehicle configurations and specific energy consumption variation ( E s p ) with respect to the baseline vehicle configuration.
Energies 17 02903 g011
Figure 12. Constant radius cornering maneuver vehicle handling response (steering wheel angle δ S W and sideslip angle β ) over a turn having a radius of 100 m with the three available vehicle configurations.
Energies 17 02903 g012
Figure 13. Constant radius cornering maneuver maximum commanded steering wheel angle ( δ S W , m a x ) with the three available vehicle configurations and specific energy consumption variation ( E s p ) with respect to the baseline vehicle configuration.
Energies 17 02903 g013
Figure 14. Double-lane-change maneuver vehicle handling response on high friction conditions with the three available vehicle configurations.
Energies 17 02903 g014
Table 1. Main S-segment vehicle data.
DescriptionSymbolUnitValue
Vehicle mass m kg1660
Vehicle yaw inertia moment J z kg m21790
Wheelbase l mm2740
Vehicle c.o.m to front axle distance l f mm1520
Vehicle c.o.m to rear axle distance l r mm1220
Front track half-width t F mm839
Rear track half-width t R mm846
Vehicle c.o.m height from ground h G mm416
Maximum in-wheel motor power P m , m a x kW90
Maximum in-wheel motor torque T m , m a x Nm1250
Table 2. Baseline and sporty vehicle suspension setup details.
ParameterSymbolBaseline SetupSporty Setup
Front camber angle γ f −0.5 deg−4.5 deg
Front toe angle τ f −0.05 deg−0.15 deg
Rear camber angle γ r −0.5 deg−3.0 deg
Rear toe angle τ r 0.05 deg0.15 deg
Front roll-bar stiffness k θ , f 7040 Nm/rad7040 Nm/rad
Rear roll-bar stiffness k θ , r 21,450 Nm/rad42,900 Nm/rad
Disclaimer/Publisher’s Note: The statements, opinions and data contained in all publications are solely those of the individual author(s) and contributor(s) and not of MDPI and/or the editor(s). MDPI and/or the editor(s) disclaim responsibility for any injury to people or property resulting from any ideas, methods, instructions or products referred to in the content.