Abstract
Achieving measurable and unmeasurable parameter prediction is the key process in model-based control, for which an accurate onboard model is the most important part. However, neither nonlinear models like component level models or LPV models, nor linear models like state–space models can fully meet the requirements. Hence, an original ENN-LPV linearization strategy is proposed to achieve the online modelling of the state–space model. A special network structure that has the same format as the state–space model’s calculation was applied to establish the state–space model. Importantly, the network’s modelling ability was improved through applying multiple activation functions in the single hidden layer and an experience pool that records data of past sampling instants, which strengthens the ability to capture the engine’s strongly nonlinear dynamics. Furthermore, an adaptive model, consisting of a component-level model with adaptive factors, a linear Kalman filter, a predictive model, an experience pool, and two ENN-LPV networks, was developed using the proposed linearization strategy as the core process to continuously update the Kalman filter and the predictive model. Simulations showed that the state space model built using the ENN-LPV linearization strategy had a better model identification ability in comparison with the model built using the OSELM-LPV linearization strategy, and the maximum output error between the ENN-LPV model and the simulated engine was 0.1774%. In addition, based on the ENN-LPV linearization strategy, the adaptive model was able to make accurate predictions of unmeasurable performance parameters such as thrust and high-pressure turbine inlet temperature, with a maximum prediction error within 0.5%. Thus, the effectiveness and the advantages of the proposed method are demonstrated.
1. Introduction
With the advancement of the aviation industry, the complexity of engine structures has increasingly intensified since many adjustable mechanisms have been introduced and designed for achieving high engine performance within a wider operational envelope. Furthermore, a well-designed control system is required to control several, or even more than a dozen, adjustable mechanisms to obtain the desired performance and safety [1]. Traditional control methods, which rely on feedback signals from sensors, are incapable of directly controlling unmeasurable parameters such as thrust. Instead, the control is achieved indirectly through controlling parameters such as rotational speed to manage unmeasurable parameters like thrust [2,3]. This inevitably leads to a conservative design in traditional control systems, which diminishes the full potential of engine performance. Consequently, the concept of model-based control has been proposed and has garnered widespread attention.
Compared with traditional control methods that directly utilize sensor measurements as feedback, an onboard model is introduced into the control structure in the model-based control system. Then, the unmeasurable parameters estimated with the onboard model are used as feedback in engine control [4,5,6].
In more advanced model-based control algorithms such as model predictive control, it is also required that the onboard model is capable of predicting engine parameters; these predictions are utilized to achieve engine optimal control and performance optimization [7,8,9,10,11]. This endows model-based control with advantages so that direct control and constraint of key unmeasurable parameters such as thrust and turbine inlet temperature, as well as optimization of engine performance, can be achieved. Thus, the advantages of model-based control depend highly on the accuracy of the onboard model. This is because model error can lead to control errors, and it is difficult to overcome these errors through means such as optimizing the control loop design or controller design. If the control errors become significant due to inaccuracies of the onboard model, the advantages of model-based control cannot be realized.
Therefore, the modelling approach for onboard models has increasingly become an attractive method of research in the field of aircraft engine control. Considering the limited computational capabilities of aircraft engine control systems and the iterative computational requirements of model-based control with onboard models, the nonlinear model constituting scheduling based on linear models, known as the LPV model, is favored. Its characteristic lies in establishing multiple state-space models of different engine operating states in the different ground operating states offline, and then converting the parameters based on the engine’s inlet conditions, states, and similarity principles to obtain the corresponding state–space model under the current flight conditions [12,13,14,15,16,17]. However, the accuracy of the converted model inevitably decreases because certain assumptions are applied to derive the similarity principles. In addition, in modelling for traditional control research, various assumptions are often made, including neglecting the effects of the Reynolds number and other second-order effects. For example, under high-altitude and low Mach number conditions, the Reynolds number may be lower than the critical Reynolds number of the engine rotor components, thereby affecting the performance of the engine components and subsequently impacting the operating point of the engine. This means that models established offline using this approach cannot consider the influence of the Reynolds number during the conversion process, leading to a potential further increase in errors. This does not cause problems in the traditional control structure because the controller always has good robustness and its work relies on the sensor feedback rather than the model’s estimations and predictions.
Therefore, increased attention has been paid to the technique of online modelling of the state–space model, which has the advantage of capturing the engine’s nonlinear and varying dynamics online without the need to consider complex modelling processes for effects such as the Reynolds number. One typical way is to use online identification techniques, which achieves online modelling through the identification of sensor measurement data with the least-square principle. In particular, with the rise of intelligent algorithms, model identification can be performed using methods such as support vector machines and neural networks [18,19,20,21,22]. For example, in the literature [17,22], an LPV model identification method based on the OS-ELM algorithm has been proposed, which utilizes a specially designed ELM network structure to identify the parameters required for the LPV model. However, this network is used only to identify the model based on the data of the single time instant, ignoring the nonlinear dynamics of the engine shown in the response of past time instants. Although this network is further deepened to strengthen the ability to capture the engine’s nonlinear dynamics, a significant computation burden increase cannot be avoided. In the literature [23], a GA algorithm was adopted to optimize the structure of neural networks, verifying that using composite activation functions can improve identification accuracy. This provides a new idea for further simplifying the number of neural network layers and reducing computational burden.
Furthermore, unmeasurable parameters cannot be modelled as the identification is conducted based on the sensor data, which may not fully meet the requirements of model-based control. Another interesting approach focuses on the use of online linearization techniques. Through online linearizing of the onboard component-level model, online modelling of unmeasurable parameters can be achieved. Although this method enables the possibility of estimation and prediction of unmeasurable parameters, the complexity of the entire computational process is significantly increased, as the linearization process often requires a large quantity of aerodynamic and thermodynamic calculations.
Therefore, a novel approach is proposed in this study, which combines data-driven model identification methods and online modelling methods based on onboard component-level models. This proposed approach introduces a data-driven onboard adaptive model, which integrates the onboard component-level model with online identification methods, enabling high-precision prediction of both measurable and unmeasurable parameters under the wide flight envelope.
The main contributions of this paper are as follows: (1) A data-driven linearization strategy, called ENN-LPV linearization strategy, is proposed. During the linearization process, the nonlinear state information inherited from previous engine dynamics is used, which leads to a better capture of the engine’s nonlinear dynamics within the vicinity of the current operating point. Through introducing multiple activation functions, the network exhibits superior nonlinear representation capabilities, enabling the acquisition of more accurate state–space models. (2) The online modelling for unmeasurable parameters is achieved through linearization and is conducted based on a component-level model’s outputs, which provides model-based control with the technological foundation for direct control of unmeasurable parameters.
This paper is structured as follows. Section 1 gives the introduction, Section 2 describes the proposed ENN-LPV linearization strategy, then Section 3 presents the onboard adaptive model that applies the ENN-LPV linearization strategy as the core process. Section 4 describes the simulations and discusses the results. Section 5 concludes this paper.
2. ENN-LPV Linearization Strategy
2.1. ENN-LPV Structure
For building a state–space model, the key task is to obtain the system matrices and output matrices. Thus, an experience pool to record data and a neural network-based LPV (ENN-LPV) linearization strategy are proposed to achieve model identification. An experience pool that records the data of past time instants is employed to receive engine response data online, and the backpropagation algorithm in conjunction with a composite activation module is utilized to train the neural network. Compared with the existing OSELM-LPV neural network, the network structure of the ENN-LPV is simplified as much as possible, and the depth of the network is reduced, aiming at reducing the computation burden but maintaining the potential to identify models under complex operating conditions.
2.1.1. Experience Pool Structure
The experience pool is essentially a data-recording module, capable of storing responses of multiple sampling instants, as shown in Figure 1. A parameter named batch size nb is applied to describe how many past sampling instants of responses are recorded.
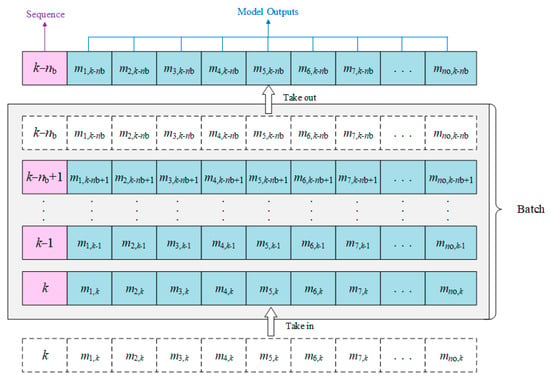
Figure 1.
Basic structure of experience pool.
For the experience pool shown in Figure 1, each layer of the pool can store no outputs of the engine at a specific sampling instant, which are used to train the neural network and identify the LPV model. A rolling update strategy is adopted in this experience pool to ensure that the recorded data can describe the dynamic response near the current operating point. Assuming the current sampling instant is k, the output sequence of engine is:
where the stored output sequence includes nu LPV inputs u, nx state variables x, and ny LPV outputs y. It can be seen that .
For the sampling instant k, the earliest sequence in terms of time is removed from the experience pool, while ok is received and placed at the bottom of the module. Then, the experience pool Bk contains the output sequence ok−nb+1 to ok, which is used to identify the engine LPV model at time k. All the data recorded in the experience pool are normalized and used to train the neural network.
2.1.2. ENN-LPV Neural Network
The structure diagram of the ENN-LPV’s neural network is shown in Figure 2, with the network consisting of an input layer, two specially designed layers, namely, the hidden layer and the multiplication layer, and an output layer.
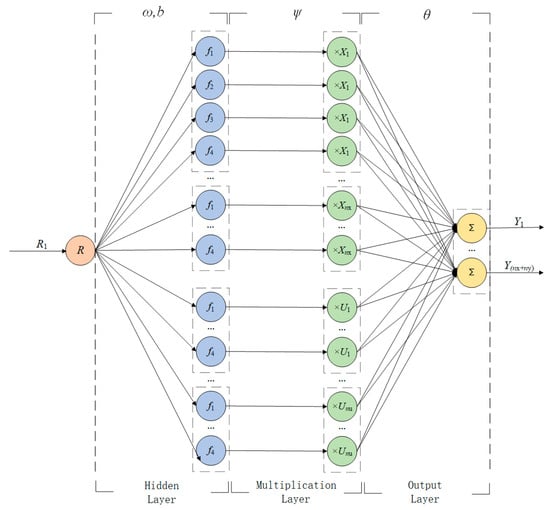
Figure 2.
Structure of the neural network for ENN-LPV modelling.
A hybrid activation strategy has been introduced into the hidden layer, denoted by the blue color. Four different nonlinear activation functions are applied together to enhance the hidden layer’s ability to express the nonlinear relations. Thus, the hidden layer is divided into several parts according to the dimensions of the state vector and the engine input vector. For example, the dimensions of the state vector and the engine input vector are nx and nu, so the hidden layer is divided into nx + nu composite activation modules.
The sequence of training parameters for the constructed neural network is shown in Equation (3):
where m represents the corresponding column vector of experience pool Bk, R is the input of the neural network and , the subscript k−nb + 1 to k represents the corresponding model sampling instants, Y is the target output matrix, X is the state variable matrix, and U is the time sequence of engine input, and X and U together form the weight matrix of the multiplication layer. The subscripts of R, X, U, Y in Figure 2 represent the corresponding row vectors of these matrices.
The hidden layer’s calculation can be given as follows:
where is the hidden layer weight and is the bias.
Then, the hidden layer’s nodes are further activated with nx + nu activation modules as follows:
where f1, f2, f3, and f4 represent four different activation functions, respectively. f1 is the LeakyReLU function, f2 is the sigmoid function, f3 is the tanh function, and f4 is the ELU function.
Then, the output of the hidden layer A(h) can be obtained as follows.
In order to obtain the same calculation format as a state–space model, the second hidden layer, here called the multiplication layer, has also been specially designed. The weights in the multiplication layer are directly determined according to the state variables and control variables, and no activation functions are implemented. In terms of calculation, let the weight matrix of the multiplication layer be ; then, the output of the multiplication layer A(m) can be calculated through multiplying the output of the hidden layer element-wise according to the multiplication weight matrix:
where symbol represents multiplying elements at corresponding positions in a matrix.
Finally, the output of the output layer A(Y) can be calculated as Equation (8). In particular, no biases are added in order to ensure the network’s calculation structure is consistent with the state–space model’s.
where is the weight of the output layer.
Thus, the neural network output A(Y) can be expanded in the form of Equation (9). Note that in Equation (9) represents the corresponding row vector of A(h):
The state–space model at k−nb + 1 to k sampling instants can be written in a computational form as shown in Equation (10):
where the overline denotes the coefficient matrices of the state–space model.
Through comparing Equations (9) and (10), the system matrices and output matrices of the state–space model can be obtained as follows:
Through training the neural network parameters and extracting them according to Equation (12), the LPV model of the aircraft engine at the sampling instant k can be identified and obtained. As a result, the problem of modelling is transformed into the problem of training the network weights.
2.2. Online Training Process
Considering the demand for high modelling accuracy based on the model prediction and taking into account the adaptability to a wide range of operating conditions within the envelope, it is necessary to employ a training algorithm with higher accuracy and stability. Recently, many mature training algorithms have been developed and are currently applied to neural network training, such as the backpropagation (BP) method in cooperation with the Adam optimization algorithm, RMSprop optimization algorithm, and so on [24,25,26]. In this study, the training method of backpropagation (BP) together with the LM optimization algorithm was adopted [27]. Based on this, the training process for the ENN-LPV network can be summarized as follows.
Inferred from the previous text, the output of the neural network is A(Y), the target output is Y, and the loss function Etotal is defined as:
According to the principle of reverse recursion of errors, the gradient of the neural network is calculated layer by layer:
In this paper, the LM algorithm is used to update the weight , b, and . Taking the updating process of weight as an example, Equations (17) and (18) reflect the updating process of the LM algorithm on the output layer weights, where is the corresponding Jacobian matrix and is the learning rate:
where represents a new column vector that is rearranged from .
The output layer weight matrix is updated:
According to Equations (9)–(11), there is a direct mapping relationship between the target output, weight matrices, and SSM coefficient matrices of the neural network. This means that the corresponding SSM coefficient matrices can be selected through changing the target output and updating the weight. Among them, the updated weight matrices include the weight of the hidden layer , bias b, and output layer , all of which are updated using the LM algorithm mentioned above.
3. Onboard Adaptive Model
Based on the proposed ENN-LPV linearization strategy, an onboard adaptive model for aero-engine parameter prediction has been developed. The ENN-LPV linearization strategy is implemented as the core process in this adaptive model, aiming at obtaining the state–space models needed for the update of the Kalman filter and the predictive model.
3.1. Model Framework
The developed adaptive model is shown in Figure 3, consisting of a component level model (CLM), an experience pool for data recording, a linear Kalman filter (LKF), and two state–space models for prediction and LKF. In particular, the experience pool is applied to restore the CLM outputs rather than the engine sensor data over the past sampling time instants. Thus, measurable and unmeasurable parameters can be recorded in the experience pool for identification. The state–space models needed in the LKF and prediction process are updated every sampling time instant according to the proposed ENN-LPV linearization strategy, using the data from the experience pool. In addition, the model adaptive factor vector η has been introduced to adjust the CLM to ensure the CLM’s outputs can track the engine outputs.
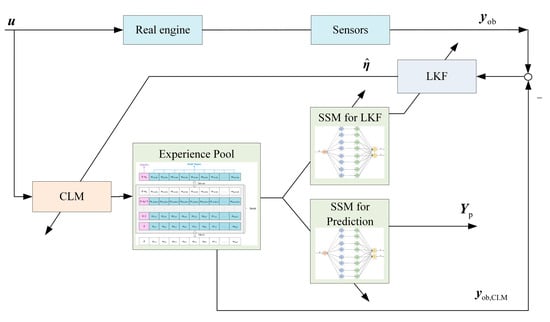
Figure 3.
Illustration of adaptive model’s structure.
Based on this, the CLM can be updated every sampling instant and an accurate state–space model obtained for parameter prediction applications. It is worthwhile to mention that the onboard model’s adaptive ability is guaranteed by the adaptive factor update, which further leads to the accuracy of the state–space model for the predictions.
3.2. Adaptive Component Level Model
For a turbofan engine, its operation represented by the CLM can be written as:
where x is the state vector, u is the input vector, w and v are uncorrelated white noise sequences, y is the model output, and subscript k denotes values at time instant k.
In a CLM, component performance maps are among the most important parts to describe an engine’s performance. For example, for the Reynolds effect, the rotating components including the fan and the compressor are the main components that are influenced most. In addition, engine degradations and individual deviations inevitably lead to deviations of the real performance maps from the nominal performance maps. Thus, the adaptive factors can be determined through modification of different rotating component performances. For example, the adaptive factor can be introduced to modify the corrected mass flow and efficiency, respectively:
where is the nominal corrected mass flow, mcor is the corrected mass flow adjusted according to the flow adaptive factor ηm, is the nominal efficiency, and eff is the efficiency adjusted by the efficiency adaptive factor ηe.
As a result, an adaptive factor vector η can be defined and introduced into the CLM to drive the CLM to track the engine state; Equation (20) can be rewritten as:
For the sampling instant k, with the updated adaptive factor, the parameter estimations can be given based on the CLM, namely:
where and are the state vector and the adaptive factor vector corrected by the Kalman filter, respectively, and are the estimations given by the CLM, and uk is the engine input vector of the sampling instant k.
Thus, at the sampling instant k, the estimations of shaft speeds of the next sampling instant, namely , the estimations of measurable and unmeasurable parameters , the corrected state vector and the adaptive factor vector and , and the input uk can be inserted into the experience pool for identification.
3.3. ENN-LPV Linearization Strategy-Based Linear Kalman Filter
Precise state–space models play a key role in updating the LKF and conducting the parameter predictions. Based on the output data restored in the experience pool, the state space model can be identified for the LKF.
As shown in Figure 3, an ENN-LPV network was constructed for identifying the system matrices and output matrices for updating the LKF. For a given experience pool Bk at the sampling instant k, the data record of sampling instant k is selected as the base point. Then, the Bk can be transformed into .
Thus, the network constructed based on can be seen as corresponding to an incremental form of the state–space model, and Equation (9) can be written in an incremental form as follows:
where , , , are all row vectors that consist of nb corresponding elements at instant k.
Then, an incremental state space model as shown in Equation (26) was built, where the system matrices and output matrices were applied to update the LKF.
where , subscript “CLM” denotes that parameter values are calculated with the CLM, and “ob” denotes that the parameters can be measured.
Based on this state–space model identified at sampling instant k, a state vector estimation can be conducted at the sampling instant k + 1.
Firstly, the covariance matrix P and filter gain K can be updated:
Then, the state vector can be estimated using the measured parameters:
where Δyk+1,ob = yk+1,ob − yk,CLM,ob, and yk+1,ob is the measured engine output at time instant k.
Finally, the covariance matrix P can be corrected:
3.4. ENN-LPV Linearization Strategy-Based State-Space Model for Predictions
Similarly, for every sampling instant k, the experience pool Bk can be transformed to . In addition, the subset of is selected to build the state–space model according to parameter prediction demands. Thus, an incremental state–space model can be identified:
where A, B, C, and D are the corresponding system matrices and output matrices. Note that the state–space model shown in Equation (33) has been built based on the CLM output, and no sensor data were used to establish this model. When provided with a set of future engine inputs, future outputs based on this model can be quickly obtained.
3.5. Model Calculation Loop
For every sampling instant k, a model calculation loop is conducted to update the CLM, the LKF, and the state–space model for predictions. Figure 4 shows the calculation loop of the onboard adaptive model.
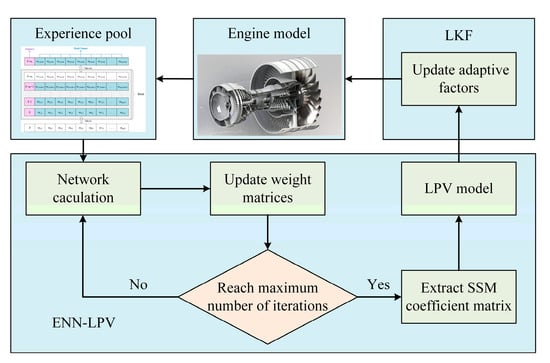
Figure 4.
Illustration of direct ENN-LPV linearization strategy-based adaptive model.
Firstly, the adaptive factors are updated based on the LKF that has been updated at sampling instant k − 1. Then, the updated adaptive factors and the engine inputs of sampling instant k are applied in the CLM, and the CLM’s outputs of sampling instant k are obtained. After that, the CLM’s outputs of sampling instant k are recorded in the experience pool and the oldest record of the experience pool is deleted. Based on the updated experience pool, two state–space models are identified via the proposed ENN-LPV linearization strategy. One model is used to update the LKF’s system matrices and output matrices, and another one is applied to achieve parameter predictions.
4. Numerical Examples and Discussion
4.1. Simulation Condition
Modelling and parameter prediction simulations were conducted to demonstrate the parameter estimation and prediction ability of the proposed onboard model with ENN-LPV linearization strategy. For comparison, the OS-ELM network-based linearization strategy proposed by ref. [22] was also applied in the onboard adaptive model in place of the proposed ENN-LPV linearization strategy. This means that the two adaptive models were almost the same, except that two different linearization strategies were adopted.
The simulations were conducted based on a simulated two-shaft turbofan engine that was able to represent degradations and the Reynolds effects on the engine performance. This meant that the performance deviation could be simulated and this deviation captured by the adaptive factors in the onboard adaptive model. In particular, a health parameter was used to introduce the degradations, as discussed previously [28,29,30], and the RNI method was used to simulate the Reynolds effects on the engine performance, as detailed in the literature [31,32,33]. In this section’s simulations, the degradations and Reynolds effects on compression components were simulated as examples. Four adaptive factors that can adjust the compression components’ performance were defined and introduced into the CLM in these simulation cases:
For the LKF modelling, the input of the ENN-LPV network was low-pressure shaft speed, the outputs were the low-pressure shaft speed nf, the high-pressure shaft speed nc, the compressor output pressure P3, the compressor output temperature T3, the low-pressure turbine output pressure P46, and the low-pressure turbine output temperature T46. For parameter prediction modelling, the input of the ENN-LPV network was the low-pressure shaft speed, the outputs were the low-pressure shaft speed nf, the high-pressure shaft speed nc, the thrust F, and the high-pressure turbine inlet temperature T4.
Figure 5 shows the flight conditions used in the simulation.
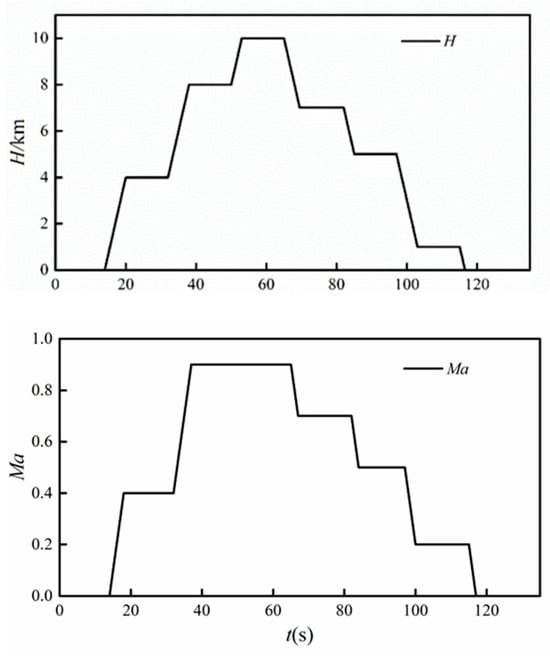
Figure 5.
Simulated flight conditions.
The relative error was used to evaluate the modelling and prediction accuracy at a certain point, and the maximum error and mean error were calculated from the absolute relative error to evaluate the simulation results. The root mean square error (RMSE) was used to evaluate the modelling and prediction accuracy during the whole flight trajectory:
where and are calculated values and reference values, respectively, N is the number of samples, and j represents the sample j.
The simulation was carried out in an environment of Win10, AMD 3970X CPU, and 128G RAM.
4.2. Simulation of Modelling Capability
For the proposed onboard adaptive model, modelling the state–space model through the linearization strategy was the key operation because the updating of the LKF and the predictive model highly depend on this linearization strategy. Thus, simulations were conducted to demonstrate the modelling capability of the proposed ENN-LPV linearization strategy. For the simulation presented in this subsection, the ENN-LPV linearization strategy was applied to identify the simulated engine outputs directly rather than being applied in the onboard adaptive model.
Figure 6 shows the parameter output with the continuously updated state–space models built according to the ENN-LPV and OSELM-LPV linearization strategy along the flight trajectory. Figure 7 compares the relative output errors of the two linearization strategies. Table 1 lists the errors of modelling, and “Running time” represents the simulation time for each step.
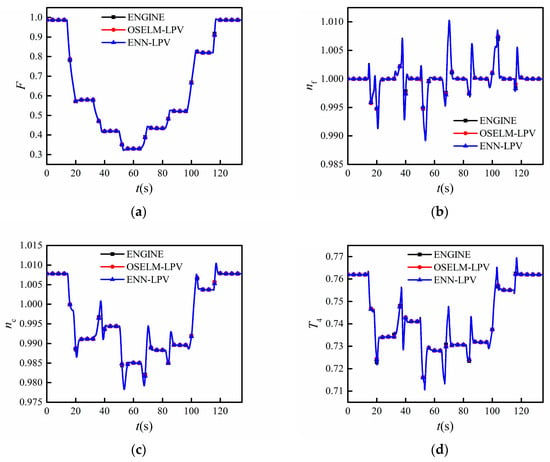
Figure 6.
Results comparison between simulated engine output and identified state–space model output. (a) Thrust F; (b) low-pressure shaft speed nf; (c) high-pressure shaft speed nc; (d) high-pressure turbine inlet temperature T4.
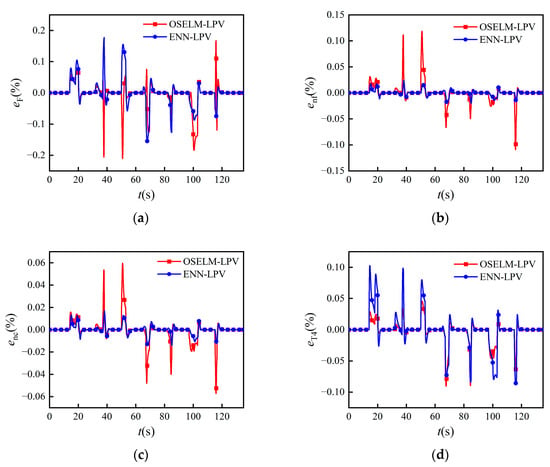
Figure 7.
Relative error between simulated engine output and identified state–space model output. (a) Thrust F; (b) low-pressure shaft speed nf; (c) high-pressure shaft speed nc; (d) high-pressure turbine inlet temperature T4.

Table 1.
Output errors (k) of modelling.
It can be seen from Figure 6 and Figure 7 and Table 1 that the parameter outputs of the continuously updated state–space model built according to the ENN-LPV linearization strategy were able to match those of the simulated engine during the whole flight trajectory. The absolute values of relative errors of F, T4 fluctuated within 0.2% while the absolute values of relative errors of nf, nc fluctuated within 0.05%, as shown in Figure 7. Compared with the OSELM-LPV linearization strategy, the proposed strategy possessed better modelling accuracy. The steady-state errors of both models built under the two strategies were zero, which means they each had good steady-state modelling performance. Regarding the dynamic state, for the ENN-LPV linearization strategy, the largest absolute values of relative errors of F, nf, and nc were 0.1774%, 0.0239%, and 0.0167% for the ENN-LPV linearization strategy, while those for the OSELM-LPV linearization strategy were 1.19 times, 4.96 times, and 3.57 times the errors obtained by the former, respectively. It is worthwhile to mention that although the ENN-LPV linearization strategy obtained a little larger error for T4 (0.1026%) than the OSELM did (0.0903%), the difference in errors obtained with the two strategies was very small. Similarly, the RMSEs of F, nf, and nc for ENN-LPV were also smaller compared with OSELM-LPV. All of these results reflect the superiority of the proposed ENN-LPV linearization strategy. Also, more time may have been required for the neural network update iteration in the proposed strategy, but its computational speed was still acceptable.
The simulation results demonstrated that the proposed ENN-LPV linearization strategy was able to capture the engine’s strongly nonlinear dynamics effectively, leading to a state–space model that could output parameter changes accurately, which suggests the effectiveness of the proposed ENN-LPV linearization strategy.
4.3. Simulation of Parameter Predictions under Reynolds Effects
In Section 4.2, the advantages of the ENN-LPV linearization strategy have been demonstrated. Based on the ENN-LPV linearization strategy, a predictive state–space model at each sampling instant k can be obtained. As the proposed ENN-LPV linearization strategy based onboard adaptive model aims at providing a more efficient way to predict parameter changes, parameter prediction simulation was therefore conducted to demonstrate the parameter prediction ability of the proposed method. The prediction results from sampling instant k to sampling instant k + m − 1 were obtained by using Equation (33). The SSM predicted output at sampling instant k + 4 was compared with the simulated engine’s outputs.
Figure 8 shows the four estimated adaptive factors during the flight. Figure 9 shows the measured output of the two models at each sampling instant k during the whole flight simulation, with its error recorded in Figure 10. In these results, the “Engine model” represents the simulated engine outputs and the “Adaptive model” is the output of the predictive model built using the onboard adaptive model with the ENN-LPV linearization strategy.
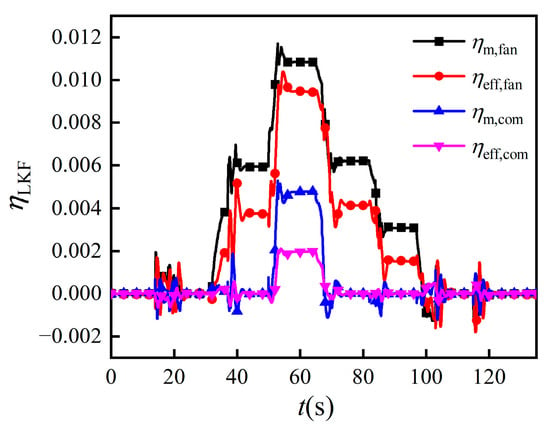
Figure 8.
Estimated results of four adaptive factors.
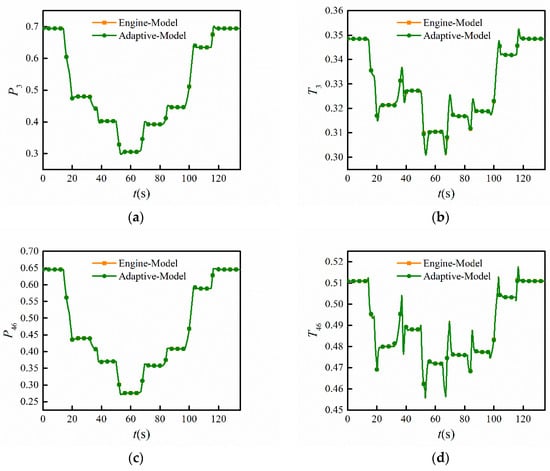
Figure 9.
Measured output comparison between the adaptive model and Reynolds model. (a) Total pressure of compressor outlet P3; (b) total temperature of compressor outlet T3; (c) total pressure of low-pressure turbine outlet P46; (d) total temperature of low-pressure turbine outlet T46.
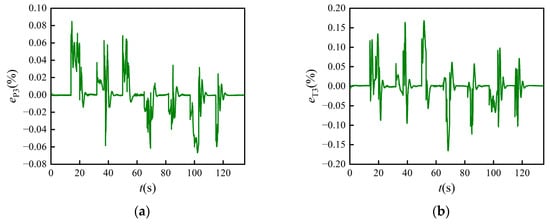

Figure 10.
Measured output error between the adaptive model and Reynolds model at the sampling instant k. (a) Total pressure of compressor outlet P3; (b) total temperature of compressor outlet T3; (c) total pressure of low-pressure turbine outlet P46; (d) total temperature of low-pressure turbine outlet T46.
From Figure 8, it can be seen that the adaptive factors were not zero under some flight conditions, such as 38 s to 100 s. This is because the Reynolds effects made sense during these flight conditions, leading to model errors between the simulated engine and the CLM of the onboard adaptive model. Thus, the adaptive factors were adjusted via the LKF to ensure the CLM of the onboard adaptive model was able to track the simulated engine. It can be seen from Figure 9 and Figure 10 that the maximum absolute errors of P3, T3, P46, and T46 were 0.0848%, 0.1678%, 0.1442%, and 0.1188%, respectively. All of the absolute errors were within 0.5%, which means that the CLM of the onboard adaptive model was able to track the engine’s measurable outputs well. This also indicates that the proposed linearization strategy can provide effective LKF, supporting the adaptive ability.
Figure 11 shows the parameter prediction results for the adaptive model and the output of the simulated engine at the sampling instant k + 4. Figure 12 shows the relative errors during the whole prediction time and Table 2 lists detailed errors; “Running time” represents the simulation time for each step. For comparison, the parameter prediction results of the adaptive model dismissing the adaptive process (denoted as the non-adaptive model) are given to show the necessity of adaptive ability. The “Engine model” represents the simulated engine outputs, the “Adaptive model” refers to the prediction result of the adaptive model, and the “Non-adaptive model” indicates the prediction results of the adaptive model dismissing the adaptive process.
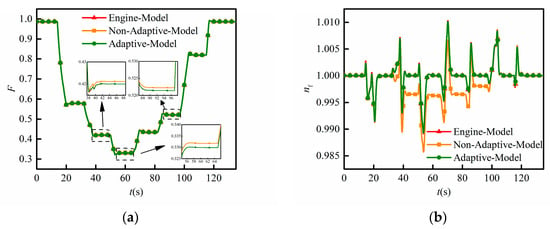
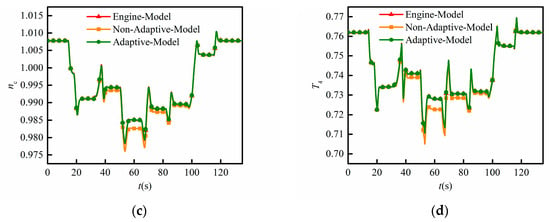
Figure 11.
Prediction results of the adaptive model and the output of the Reynolds engine at the sampling instant k + 4. (a) Thrust F; (b) low-pressure shaft speed nf; (c) high-pressure shaft speed nc; (d) high-pressure turbine inlet temperature T4.
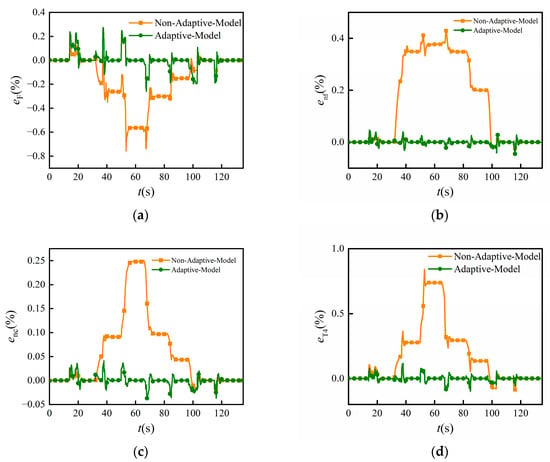
Figure 12.
Errors between adaptive model prediction results and Reynolds model output at the sampling instant k + 4. (a) Thrust F; (b) low-pressure shaft speed nf; (c) high-pressure shaft speed nc; (d) high-pressure turbine inlet temperature T4.

Table 2.
Parameter prediction error (k + 4).
It can be seen from Figure 11 and Figure 12 and Table 2 that although Reynolds effects influenced the engine output to some extent when the engine was operated in flight conditions of high altitude and low Mach number, the onboard model with the proposed ENN-LPV linearization strategy had good prediction performance for the thrust F, high-pressure turbine inlet temperature T4, and the shaft speeds nf and nc, at both the steady state and during the dynamic operations. All the predictions reached zero errors at the steady state. For the dynamic operations, the absolute value of the prediction error of thrust F was maintained within 0.3% range, with the maximum absolute value of error being 0.2733%. Also, the absolute value of the prediction error of T4 was within 0.4% range, with the maximum absolute value of error being 0.1152%. Similarly, the absolute values of prediction errors for the two shaft speeds fluctuated within 0.1%. However, the absolute values of relative error of the non-adaptive model reached up to 0.7568%, 0.4292%, 0.2506%, and 0.8399% for the thrust F, low-pressure shaft speed nf, high-pressure shaft speed nc, and high-pressure turbine inlet temperature T4, respectively. Moreover, according to Table 2, the RMSE (×10−3) of the four prediction parameters decreased from 0.9 to 0.4046, 2.2 to 0.0873, 0.9 to 0.0957, and 2.1 to 0.1529 for F, nf, nc, and T4, respectively, when the adaptive process was applied. In addition, the computational speed of the model was reduced after adding the adaptive module. This is because the operation of the adaptive module involved iteration of another neural network used for LKF estimation and the process of solving LKF. Note that the number of network nodes was selected manually according to the work experience rather than optimized using optimization algorithms such as GA, so the current selection of node numbers may not have been optimally few. In the process of subsequent research, real-time optimization can be carried out, such as using a genetic algorithm to optimize fewer nodes to further reduce the complexity of the network.
On the one hand, these results demonstrate that the proposed onboard adaptive model with the ENN-LPV linearization strategy can achieve a highly accurate parameter prediction. On the other hand, they also indicate the necessity of the adaptive process for an onboard model to improve the prediction accuracy.
4.4. Simulation of Parameter Predictions under Degradation and Reynolds Effects
In the real flight process, the performance of aircraft engines may not only be influenced by the Reynolds effects but can also undergo a certain extent of degradation. Thus, a predictive simulation under the combined influence of degradation and Reynolds effects was conducted. Figure 13 shows the simulated degradations affecting compression components; note that this quick change of degradation was for testing the prediction ability of the adaptive model when degradations happen rather than simulating a real degradation process. Dfan represents the degradation of the fan and Dcom represents the degradation of the compressor.
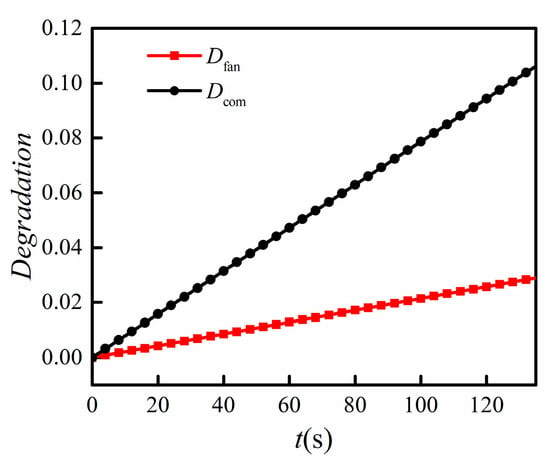
Figure 13.
Degradations of the simulated engine.
Figure 14 shows the four estimated adaptive factors under the influence of combined degradation and Reynolds effects. Figure 15 shows the measured output of two models at each sampling instant k during the whole flight simulation, with its error recorded in Figure 16.
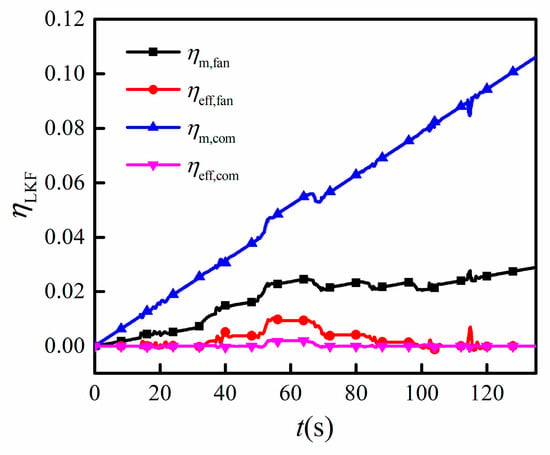
Figure 14.
Estimated results of four adaptive factors under the influence of combined degradations and Reynolds effects.
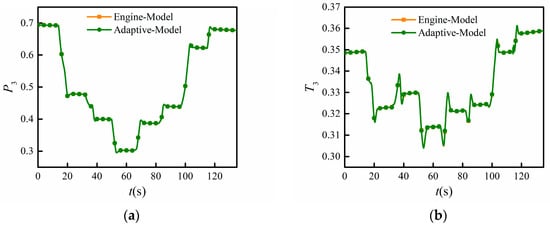
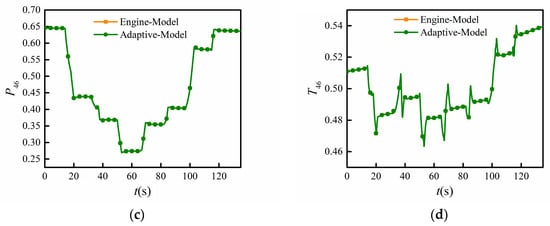
Figure 15.
Measured output comparison between the adaptive model with the proposed method and simulated engine. (a) Total pressure of compressor outlet P3; (b) total temperature of compressor outlet T3; (c) total pressure of low-pressure turbine outlet P46; (d) total temperature of low-pressure turbine outlet T46.
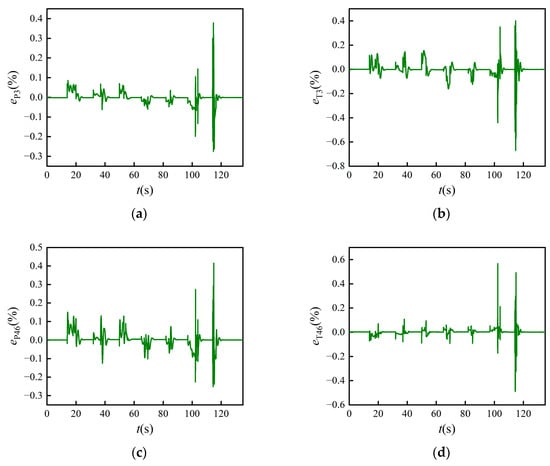
Figure 16.
Measured output error between the adaptive model and simulated engine at the sampling instant k. (a) Total pressure of compressor outlet P3; (b) total temperature of compressor outlet T3; (c) total pressure of low-pressure turbine outlet P46; (d) total temperature of low-pressure turbine outlet T46.
Comparing Figure 14 with Figure 13, the adaptive factors and both increased gradually due to the degradation of inlet mass flow for the fan and compressor. It can be seen from Figure 15 and Figure 16 that the maximum absolute errors of measured P3, T3, P46, and T46 were 0.3781%, 0.6695%, 0.4147%, and 0.5660%, respectively. All of the absolute errors were within 1%. This demonstrates that, under changes caused by degradation and Reynolds effects, the adaptive model has a high robustness and can still track the engine conditions precisely.
Figure 17 shows the parameter prediction results of the adaptive model and the output of the simulated engine at the sampling instant k + 4. Figure 18 shows the relative errors during the whole prediction time and Table 3 lists detailed errors; “Running time” represents the simulation time for each step. For comparison, the parameter prediction results of the adaptive model dismissing the adaptive process (denoted as “Non-adaptive model”) are also given. The “Engine model” represents the simulated engine outputs, the“Adaptive model” gives the prediction result of the adaptive model, and “Non-adaptive model” shows the prediction results of the adaptive model dismissing the adaptive process.
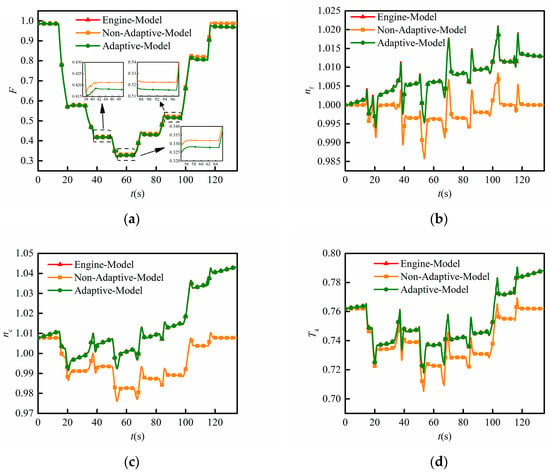
Figure 17.
Prediction result of the adaptive model and the output of simulated engine at the sampling instant k + 4. (a) Thrust F; (b) low-pressure shaft speed nf; (c) high-pressure shaft speed nc; (d) high-pressure turbine inlet temperature T4.
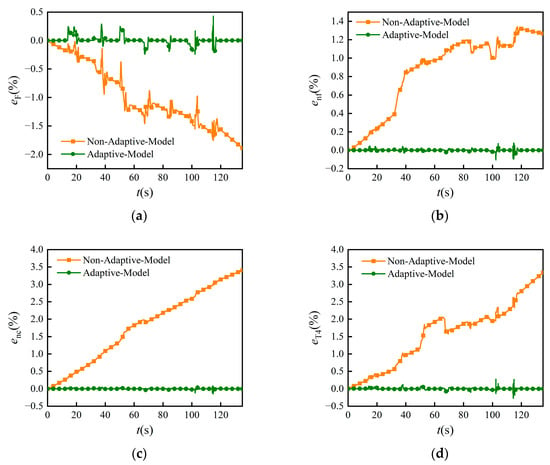
Figure 18.
Error between adaptive model prediction results and simulated engine output at the sampling instant k + 4. (a) Thrust F; (b) low-pressure shaft speed nf; (c) high-pressure shaft speed nc; (d) high-pressure turbine inlet temperature T4.

Table 3.
Parameter prediction RMSE (k + 4) between adaptive model prediction results and simulated engine output.
From Figure 17 and Figure 18, it can be seen that the onboard model based on the proposed strategy can still realize highly accurate predictions under the influence of degradation and Reynolds effects. The absolute errors of the four predicted parameters fluctuated within 0.5%, with the largest error coming from thrust, which was 0.428%. Compared with the prediction results of the non-adaptive model shown, both the maximum relative error and RMSE of the proposed adaptive model are smaller, which demonstrates the effectiveness of the adaptive model for parameter predictions. According to Table 2 and Table 3, it can be seen that for this adaptive model, the RMSEs that considered the influence of degradation were similar to the results before degradation. The RMSE difference of each parameter did not exceed 0.03 × 10⁻³. This further suggests that the adaptive model has strong robustness, and degradations will not affect the predictive performance of the adaptive model. Also, the running times were consistent with those in Table 2 as there was no difference between the models tested in Section 4.4 and the models discussed in this section.
In addition, it can be seen from Figure 17 and Figure 18 and Table 3 that the absolute relative errors of the prediction results of the non-adaptive model showed a sustained increasing trend as the engine deteriorated, reaching 1.9878%, 1.3418%, 3.4964%, and 3.5097% for F, nf, nc, and T4 respectively. Furthermore, it can be seen that the RMSEs decreased greatly when the adaptive process was considered. Again, this suggests the importance of the adaptive process for measurable and unmeasurable parameter predictions.
5. Conclusions
This paper innovatively proposes an ENN-LPV linearization strategy for the online modelling of a state–space model. This strategy can accurately identify online the state–space models that reflect the characteristics of the engine and further be applied to construct an adaptive model. The core is the specially designed ENN-LPV network, which adopts experience pools and multiple activation functions to boost the ability to capture the engine’s nonlinear dynamics, so the potential to improve identification accuracy under complex operating conditions without significantly increasing network complexity is obtained.
Firstly, a special forward neural network was designed, in which multiple activation functions are applied in a single hidden layer to strengthen the ability to capture the nonlinear dynamics while maintaining as few network nodes as possible. Based on the network, the linearization calculation process that considers the engine nonlinear dynamics of past time was then presented. Through comparison with the engine output when the flight conditions and engine inputs are changed, modelling simulations were conducted and the results showed that the state–space model built using the proposed linearization strategy can output parameter changes accurately. Thereby, the modelling ability of the proposed linearization strategy was verified.
Based on the proposed ENN-LPV linearization strategy, an onboard adaptive model was developed, using this linearization strategy as a core process to update the LKF and the predictive model. Parameter prediction simulations showed that the developed adaptive model was able to capture the model errors effectively and update the adaptive factors to ensure the onboard adaptive model matched the engine, and the predictive model built based on the CLM’s outputs were able to predict thrust, high-pressure turbine inlet temperature, and shaft speeds accurately. Thus, not only the effectiveness of the developed adaptive model for prediction but also the modelling ability of the proposed ENN-LPV linearization strategy was further demonstrated.
In summary, the ENN-LPV linearization strategy can be used to update LKF for estimation and the predictive model for unmeasurable parameter prediction. Through combining the ENN-LPV linearization strategy with the LKF, a high-precision adaptive linear model for tracking the actual engine can be established. All the simulation results demonstrate that the proposed method has sufficient potential to model and predict measurable and unmeasurable parameters online. The adaptive model established with the proposed method can not only be used for parameter prediction as shown in this paper but can also be applied in many applications such as engine prognostics health management (PHM), in which the adaptive model can assist in fault diagnosis, state monitoring, and analysis as a reference model. Future work should focus on improving the computing time of the proposed ENN-LPV linearization strategy via adopting faster algorithms, optimizing the network structure, and simplifying engine models.
Author Contributions
Conceptualization, Q.L.; methodology, S.P. and H.L.; software, H.L.; validation, H.L.; formal analysis, S.P.; investigation, S.P.; resources, H.L. and Z.G.; data curation, S.P. and H.L.; writing—original draft preparation, H.L.; writing—review and editing, S.P., H.L. and Z.G.; visualization, H.L.; supervision, Q.L.; project administration, S.P.; funding acquisition, S.P. All authors have read and agreed to the published version of the manuscript.
Funding
This research was funded by the Project funded by China Postdoctoral Science Foundation (2021M701692), Jiangsu Funding Program for Excellent Postdoctoral Talent (2022ZB202), National Natural Science Foundation of China (52306015).
Data Availability Statement
The original contributions presented in the study are included in the article, further inquiries can be directed to the corresponding author.
Conflicts of Interest
The authors declare no conflicts of interest.
Correction Statement
This article has been republished with a minor correction to the Funding statement. This change does not affect the scientific content of the article.
References
- Walker, G.P.; Fuller, J.W.; Wurth, S.P. F-35B integrated flight-propulsion control development. In Proceedings of 2013 International Powered Lift Conference, Los Angeles, CA, USA, 12–14 August 2013. [Google Scholar]
- Garg, S. Introduction to Advanced Engine Control Concepts; NASA-20070010763; NASA Glenn Research Center: Cleveland, ON, USA, 2007. [Google Scholar]
- Garg, S. Aircraft Engine Advanced Controls Research under NASA Aeronautics Research Mission Programs; AIAA-2016-4655; NASA Glenn Research Center: Cleveland, ON, USA, 2016. [Google Scholar]
- Adibhatla, S.; Ding, J.; Garg, S. Propulsion Control Technology Development Needs to Address NASA Aeronautics Research Mission Goals for Thrusts 3a and 4; GRC-E-DAA-TN57637; NASA Glenn Research Center: Cleveland, ON, USA, 2018. [Google Scholar]
- Connolly, J.W.; Csanky, J.T.; Chicatelliz, A. Advanced Control Considerations for Turbofan Engine Design; AIAA-2016-4653; NASA Glenn Research Center: Cleveland, ON, USA, 2016. [Google Scholar]
- Connolly, J.W.; Csank, J.T.; Chicatelli, A. Model-based control of a nonlinear aircraft engine simulation using an optimal tuner Kalman filter approach. In Proceedings of the 49th AIAA/ASME/SAE/ASEE Joint PropulsionConference, San Jose, CA, USA, 14–17 July 2013. AIAA-2013-4002. [Google Scholar]
- Shan, R.; Li, Q.; Pang, S. Acceleration Performance Recovery Control for Degradation Aero-Engine. J. Propuls. Technol. 2020, 41, 1152–1158. [Google Scholar]
- Richter, H. Advanced Control of Turbofan Engines; Springer: New York, NY, USA, 2011. [Google Scholar]
- Pang, S.; Li, Q.; Ni, B. Improved nonlinear MPC for aircraft gas turbine engine based on semi-alternative optimization strategy. Aerosp. Sci. Technol. 2021, 118, 106983. [Google Scholar] [CrossRef]
- Zheng, Q.; Xu, Z.; Zhang, H. A turboshaft engine NMPC scheme for helicopter autorotation recovery maneuver. Aerosp. Sci. Technol. 2018, 78, 421–432. [Google Scholar] [CrossRef]
- Seok, J.; Kolmanovsky, I.; Girard, A. Coordinated model predictive control of aircraft gas turbine engine and power system. J. Guid. Control. Dyn. 2017, 40, 2538–2555. [Google Scholar] [CrossRef]
- Liu, J.; Ma, Y.; Zhu, L.; Zhao, H.; Liu, H.; Yu, D. Improved. Gain Scheduling Control and Its Application to Aero—Engine LPV Synthesis. Energies 2020, 3, 5967. [Google Scholar] [CrossRef]
- Sun, H.; Pan, M.; Huang, J. Switching control for turbofan engine based on Double-Layer LPV Model. Propuls. Technol. 2018, 39, 2828–2838. [Google Scholar]
- Lv, C.; Chang, J.; Yu, D. Feedback Linearized Sliding Mode Control of Turbofan Engine Based on Multiple Input Multiple Output Equilibrium Manifold Expansion Model. Propuls. Technol 2021, 42, 1681–1689. [Google Scholar]
- Liu, Z.; Zheng, Q.; Liu, M.; Hu, C.; Zhang, H. Research on the Improved Method of Full-Enveloped Acceleration Control Plan for Turbofan Engine. Propuls. Technol. 2022, 43, 346–353. [Google Scholar]
- Xia, C.; Wang, D. Improved correction methods of aircraft engine fan speed based on similarity theory. Aerosp. Power 2016, 31, 941–947. [Google Scholar]
- Gu, Z.; Pang, S.; Zhou, W.; Li, Y.; Li, Q. An Online Data-Driven LPV Modelling Method for Turbo-Shaft Engines. Energies 2022, 15, 1255. [Google Scholar] [CrossRef]
- Tóth, R.; Laurain, V.; Zheng, W.X.; Poolla, K. Model structure learning: A support vector machine approach for LPV linear-regression models. In Proceedings of the IEEE Conference on Decision and Control, Orlando, FL, USA, 12–15 December 2011. [Google Scholar]
- Feng, K.; Lu, J.G.; Chen, J.S. Identification and model predictive control of LPV models based on LS-SVM for MIMO system. CIESC J. 2015, 66, 197–205. [Google Scholar]
- Cavanini, L.; Ferracuti, F.; Longhi, S.; Monteriù, A. LS-SVM for LPV-ARX Identification: Efficient Online Update by Low-Rank Matrix Approximation. In Proceedings of the 2020 International Conference on Unmanned Aircraft Systems (ICUAS), Athens, Greece, 1–4 September 2020. [Google Scholar]
- Fényes, D.; Németh, B.; Gáspár, P. A Novel Data-Driven Modelling and Control Design Method for Autonomous Vehicles. Enegies 2021, 14, 517. [Google Scholar]
- Gu, Z.; Pang, S.; Li, Y.; Li, Q.; Zhang, Y. Turbo-fan engine acceleration control schedule optimization based on DNN-LPV model. Aerosp. Sci. Technol. 2022, 128, 107797. [Google Scholar] [CrossRef]
- Rezaeian, N.; Gurina, R.; Saltykova, O.A.; Hezla, L.; Nohurov, M.; Reza Kashyzadeh, K. Novel GA-Based DNN Architecture for Identifying the Failure Mode with High Accuracy and Analyzing Its Effects on the System. Appl. Sci. 2024, 14, 3354. [Google Scholar] [CrossRef]
- Shahade, A.K.; Walse, K.H.; Thakare, V.M. Deep learning approach-based hybrid fine-tuned Smith algorithm with Adam optimiser for multilingual opinion mining. Int. J. Comput. Appl. Technol. 2023, 73, 50–65. [Google Scholar] [CrossRef]
- Xu, D.; Zhang, S.; Zhang, H.; Mandic, D.P. Convergence of the RMSProp deep learning method with penalty for nonconvex optimization. Neural Netw. 2021, 139, 17–23. [Google Scholar] [CrossRef] [PubMed]
- Chen, H.; Li, Q.; Pang, S.; Zhou, W. A State Space Modelling Method for Aero-Engine Based on AFOS-ELM. Energies 2022, 15, 3903. [Google Scholar] [CrossRef]
- Li, Z.; Ma, Y.; Wei, Z.; Ruan, S. Structured neural-network-based modelling of a hybrid-electric turboshaft engine’s startup process. Aerosp. Sci. Technol. 2022, 128, 107740. [Google Scholar] [CrossRef]
- Li, Y.; Li, Q. Performance deterioration mitigation control of aero-engine. J. Aerosp. Power 2012, 27, 930–936. [Google Scholar]
- Csank, J.; Connolly, J.W. Enhanced engine performance during emergency operation using a model-based engine control architecture. In Proceedings of the 51st AIAA/SAE/ASEE Joint Propulsion Conference, Orlando, FL, USA, 27–29 July 2015. [Google Scholar]
- May, R.D.; Garg, S. Reducing conservatism in aircraft engine response using conditionally active min-max limit regulators. Am. Soc. Mech. Eng. 2012, 44670, 959–968. [Google Scholar]
- Wang, G.; Qi, X.; Li, C. Reynolds number effects on performance of turbofan based on whole engine test data identification. J. Aerosp. Power 2022, 37, 2681–2690. [Google Scholar]
- Ni, M.; Wei, Z.; Zhao, C. Analysis and application of relationship between Reynolds number index and Reynolds number ratio. J. Aerosp. Power 2024, 39, 20220397. [Google Scholar]
- Littelov, O.A.; Borovik, B.O. Characteristics and Performance of Aviation Turbojet Engines; National Defense Industry Press: Beijing, China, 1986; Volume 3, pp. 43–70. [Google Scholar]
Disclaimer/Publisher’s Note: The statements, opinions and data contained in all publications are solely those of the individual author(s) and contributor(s) and not of MDPI and/or the editor(s). MDPI and/or the editor(s) disclaim responsibility for any injury to people or property resulting from any ideas, methods, instructions or products referred to in the content. |
© 2024 by the authors. Licensee MDPI, Basel, Switzerland. This article is an open access article distributed under the terms and conditions of the Creative Commons Attribution (CC BY) license (https://creativecommons.org/licenses/by/4.0/).