Article

Geochemical Characteristics of Mature to High-Maturity Shale Resources, Occurrence State of Shale Oil, and Sweet Spot Evaluation in the Qingshankou Formation, Gulong Sag, Songliao Basin

1
State Key Laboratory of Continental Shale Oil, Daqing 163002, China
2
Exploration and Development Research Institute of Daqing Oilfield, Daqing 163712, China
3
State Key Laboratory of Continental Dynamics, Department of Geology, Northwest University, Xi’an 710069, China
4
School of Earth Sciences and Engineering, Xi’an Shiyou University, Xi’an 710065, China
5
Shanxi Key Laboratory of Petroleum Accumulation Geology, Xi’an Shiyou University, Xi’an 710065, China
*
Author to whom correspondence should be addressed.
Energies 2024, 17(12), 2877; https://doi.org/10.3390/en17122877
Submission received: 29 March 2024 / Revised: 3 June 2024 / Accepted: 5 June 2024 / Published: 12 June 2024
(This article belongs to the Section H: Geo-Energy)

Abstract

:
The exploration of continental shale oil in China has made a breakthrough in many basins, but the pure shale type has only been found in the Qingshankou Formation, Gulong Sag, Songliao Basin, and the evaluation of shale oil occurrence and sweet spot faces great challenges. Using information about the total organic carbon (TOC), Rock-Eval pyrolysis, vitrinite reflectance (Ro), kerogen elemental composition, carbon isotopes, gas chromatography (GC), bitumen extraction, and component separation, this paper systematically studies the organic geochemical characteristics and shale oil occurrence at the Qingshankou Formation. The G1 well, which was cored through the entire section of the Qingshankou Formation in the Gulong Sag, was the object of this study. On this basis, the favorable sweet spots for shale oil exploration are predicted. It is concluded that the shale of the Qingshankou Formation has high organic heterogeneity in terms of organic matter features. The TOC content of the source rocks in the Qingshankou Formation is enhanced with the increase in the burial depth, and the corresponding organic matter types gradually changed from Ⅱ2 and Ⅱ1 types to the Ⅰ type. The distribution of Ro ranges from 1.09% to 1.67%, and it is the mature to high-mature evolution stage that generates a large amount of normal crude oil and gas condensate. The high-quality source rocks of good to excellent grade are mainly distributed in the Qing 1 member and the lower part of the Qing 2 member. After the recovery of light hydrocarbons and the correction of pyrolytic heavy soluble hydrocarbons, it is concluded that the occurrence state of shale oil in the Qingshankou Formation is mainly the free-state form, with an average value of 6.9 mg/g, and there is four times as much free oil as adsorbed oil. The oil saturation index (OSI), mobile hydrocarbon content, Ro, and TOC were selected to establish the geochemical evaluation criteria for shale oil sweet spots in the Qingshankou Formation. The evaluation results show that interval 3 and interval 5 of the Qingshankou Formation in the G1 well are the most favorable sections for shale oil exploration.

1. Introduction

Shale is not only one of the most important rock types in fine-grained sedimentary rocks but also the most widely distributed source rock type, as well as the main carrier of unconventional shale oil retention and occurrence [1,2,3]. Although there are still many differences among the definitions of shale, it is generally believed that shale develops a laminated and foliated structure, whose thickness is generally less than 1 cm [1,4,5]. In terms of particle size, Chinese scholars generally define shale as smaller than 3.9 μm [6,7,8], while European and American scholars generally refer to shale as the general term for fine-grained sedimentary rock [9,10,11] with a particle size of less than 62.5 μm, which includes siltstone in the usual sense (62.5~3.9 μm). Shale oil is one of the important types of unconventional oil and gas, which refers to the oil occurring in shale formations rich in organic matter and dominated by a nanoscale pore size [12,13,14,15,16]. Shale oil is obviously different from conventional reservoirs, which are distributed far away from source rocks, and tight oil, which is distributed proximal or adjacent to the source rocks. The particularity of shale oil is mainly reflected in the following aspects [17,18,19,20]: the source layer that stores shale oil is also the reservoir and cap layer, and the combination of the source reservoir and cap is integrated. The matrix porosity of shale oil reservoirs is primarily less than 10%, the matrix permeability is mainly less than 1 millidarcy, and the pore size is mainly less than 1 micron. Shale oil is a reservoir formed by in-source retention and accumulation or micro-migration. The free state and adsorbed state coexist, and the recovery rate is lower.
Organic-rich shales are widely developed in large continental oil-bearing basins in China. The types of organic matter are mainly type I and type Ⅱ1, which are in the mature evolution stage of a large amount of oil generation, and the shale oil resources are very rich. It is estimated that the shale oil geological resources of the Qingshankou Formation in the Songliao Basin alone can reach 90 × 108 t [21], showing huge exploration potential. In recent years, a major breakthrough has been made in the exploitation of pure shale oil in mature to high-maturity areas of the Gulong Sag, Songliao Basin. The GYP1 well has reached a high-production industrial oil flow rate, with a daily output of 30.5 t and 130.32 m3 of gas per day [22], showing broad exploration prospects for continental shale oil. However, due to the strong heterogeneity of the shale of the Qingshankou Formation in the Gulong Sag, the selection and control factors of the shale oil sweet spots are unknown [22,23,24], resulting in low-producing oil flow wells in the same area, which increase the risk of exploration. Therefore, to further clarify the organic geochemical features and shale oil occurrence characteristics of the Qingshankou Formation, it is important to improve the selection of sweet spots to improve the success rate of exploration.
There have been many achievements related to the organic geochemistry of source rocks of the Qingshankou Formation in the Songliao Basin [7,8,18,21]. It is generally believed that a set of source rocks with a high abundance of organic matter has developed, and the maceral components are mainly oil-generating algae, which are generally in the mature to high-mature evolution stage and have significant zoning in the plane. The high-maturity area is mainly distributed in the Gulong Sag [8,18]. Previous studies mainly focused on the description of macro-geochemical characteristics and the overall evaluation of source rocks in a large area, but there has been a lack of systematic research on the variation of vertical organic geochemical characteristics of the Qingshankou Formation. Because of the strong heterogeneity of shale in continental lacustrine basins [1], more refined organic earth studies can also provide a geological basis for the selection of shale oil sweet spots.
Previous studies have mainly focused on the pore structure and porosity controlling factors of shale oil in the Gulong Sag, Songliao Basin [25,26,27,28,29,30,31], shale oil formation conditions, exploration potential, and resource evaluation [19,32,33]. There is a lack of systematic research on shale oil occurrence and sweet spot evaluation. In some studies, the occurrence characteristics of free and adsorbent hydrocarbons have been determined semi-quantitatively using two-dimensional nuclear magnetic resonance T1–T2 spectra [20]. However, due to the control of the coring section and the sample, the experimental process is complicated, and the period is long. This method is primarily used at the research level or to calibrate other methods, which makes its wide application difficult. Based on the closed coring pyrolysis test, Wang Min et al. (2022) [33] established a relationship chart between the light-hydrocarbon recovery coefficient and the reflectance of vitrinite (Ro). For the optimization of shale oil sweet spots, previous studies have mainly focused on reservoir physical properties, the total organic carbon (TOC), chloroform asphalt (“A”), pyrolysis (S1), vitrinite reflectance (Ro), and the brittleness index [34]. However, for shale oil in the mature to the high-maturity stage, light oil is more prevalent, and conventional coring will cause more loss of light hydrocarbons. Residual hydrocarbon S1 cannot be used to objectively evaluate the amount of hydrocarbons trapped in situ under stratigraphic conditions, and the total oil value after light-hydrocarbon recovery should be used for sweet spot evaluation, which will be closer to the underground conditions. In addition, recoverable crude oil is light oil with good physical properties, while free oil does not include all mobile oil, so it is necessary to include mobile oil in the evaluation of the desert segment.
Shale oil sweet spots are controlled by many factors. From the geological point of view, the shale layer structure and type, oil content, reservoir property, and mobility are the main factors affecting the sweet spot, and the relevant parameters include TOC, Ro, S1, porosity, the oil saturation index (OSI), etc. [23,34,35,36,37,38,39]. Due to the strong heterogeneity, evolutionary history, and different shale oil types in continental lacustrine basins, the criteria for desert evaluation are not unified. The TOC threshold ranges from 1% to 6%, the Ro threshold ranges from 0.5% to 0.8%, the S1 lower limit ranges from 1.0 to 4.0 mg/g, and the OSI lower limit ranges from 100 to 400 mg/g [34]. TOC and S1 are greater than 2~3% and 4 mg/g respectively for the sweet spots of shale oil at the Qingshankou Formation in Gulong Sag, Songliao Basin [35]. However, because the value of the oil-bearing parameter S1 is limited by sampling conditions, processing methods, and analysis methods [33], how to obtain a value that reflects the amount of hydrocarbons in situ is still a challenge.
On the basis of previous studies, the pure shale-type oil of the Qingshankou Formation in the Gulong Sag is taken as the research object, and the representative G1 well of the Qingshankou Formation is taken as an example. Initially, the geochemical characteristics of mature to high-maturity source rocks in the Qingshankou Formation are defined. Secondly, after correcting for the light-hydrocarbon loss and heavy hydrocarbons of the shale oil, the evaluation of in situ-retained hydrocarbon is studied. Thirdly, the quantitative evaluation of the occurrence state of shale oil is carried out, and the mobility of the shale oil is determined. Finally, based on the above results, the evaluation criteria of the shale oil desert were established by selecting characteristic parameters, and the sweet spot of the Qingshankou Formation was optimized.

2. Geological Setting

The Songliao Basin, located in northeast China, is a large meso-Cenozoic continental oil-bearing basin developed on the Paleozoic basement [36] with an area of about 26 × 104 km2. The development of the Songliao Basin has undergone three stages of tectonic evolution: fault depression, depression, and inversion [8,18]. It is specifically divided into 6 first-order tectonic units and 32 second-order tectonic units, including the Western Slope Zone, the Northern Dip Zone, the Central Depression Zone, the Northeast Pitching Zone, the Southeast Uplift Zone, and the Southwest Uplift Zone (Figure 1). The Qingshankou Formation was formed during the largest lakeflood period in the Songliao Basin. In the Central Depression Zone, the Lower Cretaceous Qingshankou Formation (subdivided into the Qing 1 member, Qing 2 member, and Qing 3 member) is widely developed, with thick black mud and shale (Figure 2). During the deposition of the main source rock of the Qing 1 member (K2qn1), the semi-deep to deep lake area covered about 8.7 × 10⁴ km2, and the maximum thickness of the dark mudstone reached 130 m, with an average thickness of 62 m [37]. During the second (K2qn2) and third (K2qn3) stages of the Qingshankou Formation, the lake area was approximately 6 × 10⁴ km2, and the cumulative thickness of the dark mudstone was up to 560 m, with an average thickness of 250 m [36]. The terrigenous input gradually increased from K2qn1 to K2qn2+3, and the delta sand body continuously deposited into the lake basin. The semi-deep to deep lacustrine shale deposits in the Nen 1 (K2n1) and Nen 2 (K2n2) members are from another lacustrous flood period in the Songliao Basin (Figure 2). Because thermal evolution has not reached the stage where a large amount of oil is generated, it may be a favorable horizon for in situ heating to transform shale oil. The area with a greater than 2.0% organic carbon content in the Qijia–Gulong and Sanzhao Sags is more than 8500 km2 [37], which has great exploration potential. The average TOC content of the source rocks of the first member of the Qingshankou Formation is about 2%, and the average potential hydrocarbon generation is about 8.0 mg/g. The organic matter types are mainly type I and type Ⅱ1. The Ro value is mainly 1.0–1.6% [40,41]. Therefore, the source rocks of the Qingshankou Formation have the material basis and conditions for the formation of shale oil.

3. Samples and Experiments

3.1. Sample Collection

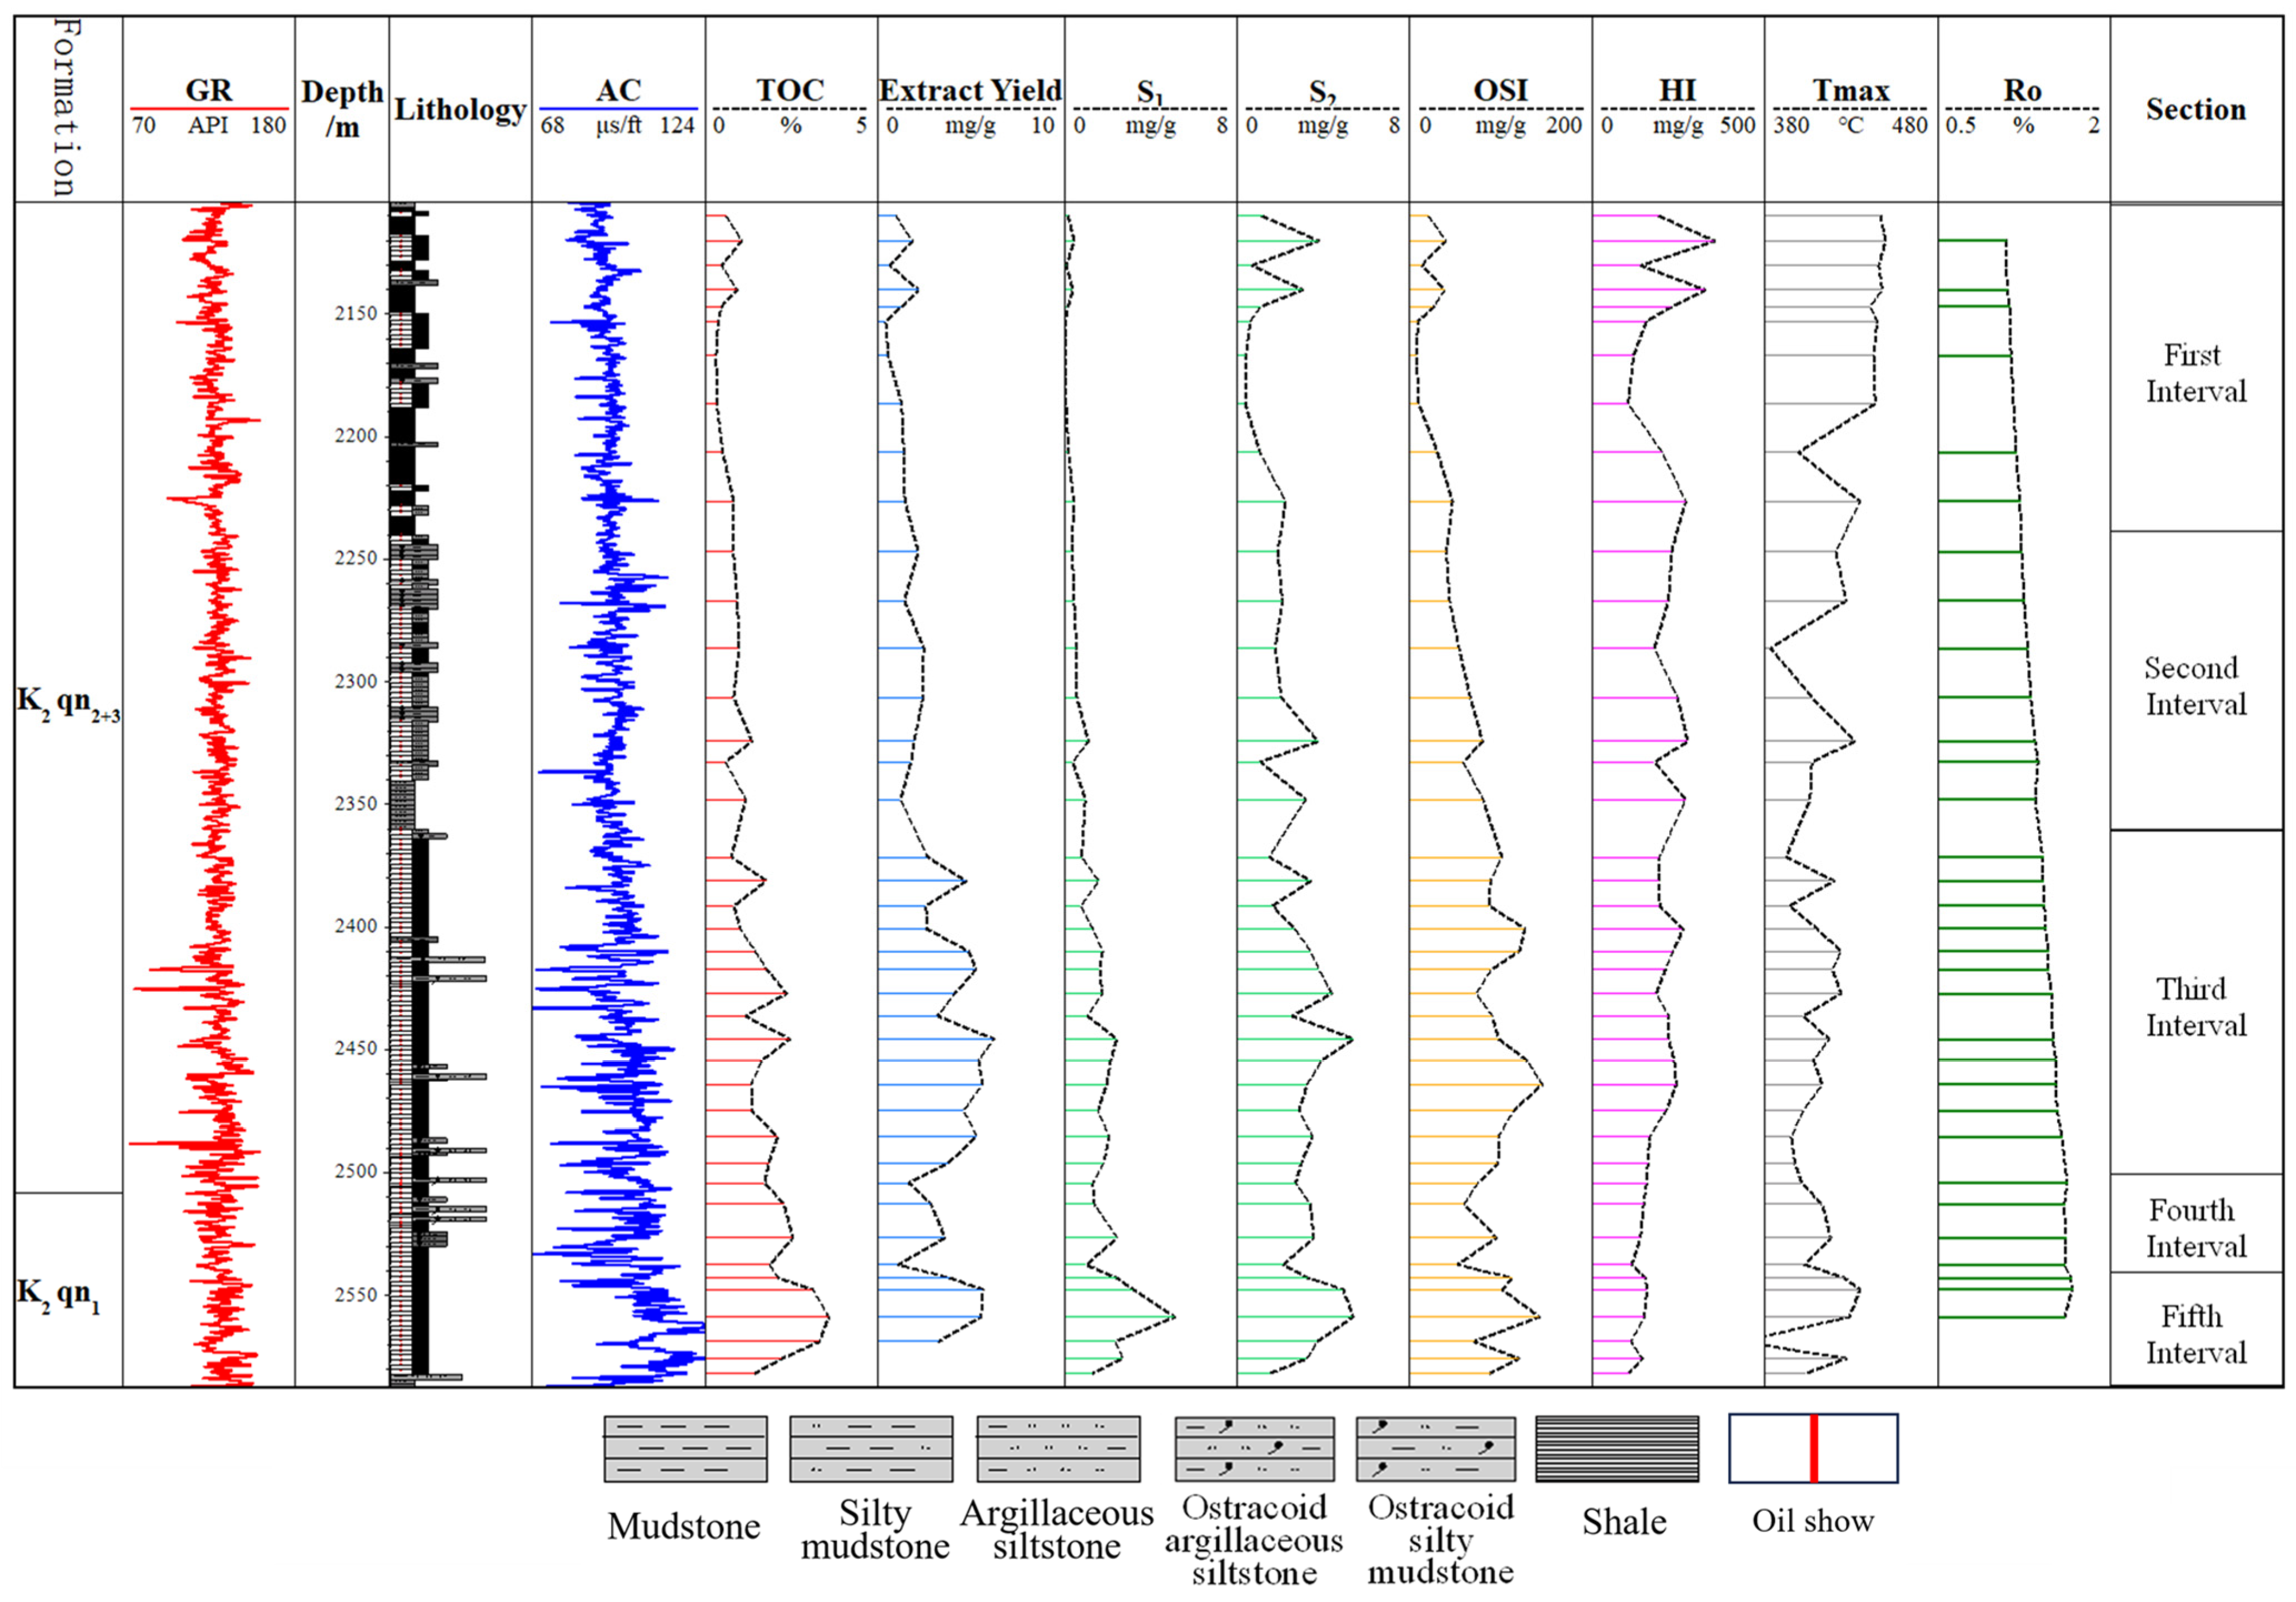
The G1 well is located in the middle of the Gulong Sag (Figure 1B). The Qingshankou Formation has been continuously cored (2104.5~2508.0 m), with a core length of 403.5 m. The lithology is mainly black shale with a thin layer of shell limestone and silty mudstone (Figure 3). According to the characteristics of lithology, sedimentary structure, log, and lithological association, the Qingshankou Formation is divided into five sections.
The fifth interval is black shale with a lamellar foliation structure; the GR value is 116~135 API, and the AC is 102~128 μs/ft. The fourth interval is mainly interbedded with shale, silty sandstone, argillaceous siltstone, and ostracoid silty mudstone of varying thickness, with laminae and stratified structures. The GR value is 115~125 API, and the AC is 96~112 μs/ft. The third interval is composed of black shale with siltstone, argillaceous siltstone, silty mudstone, ostracoid argillaceous siltstone, and ostracoid silty mudstone, with stratified and massive structures. The GR value is 106~117 API, and the AC is 93~101 μs/ft. The fourth second interval is a gray-black mudstone mixed with silty mudstone, with stratified and massive structures. The GR value is 103~110 API, and the AC is 88~96 μs/ft. The first interval is composed of dark gray mudstone with siltstone and silty mudstone and has developed stratified and massive structures. The GR value is 95~104 API, and the AC is 85~92 μs/ft.
A total of forty-one representative drilling core samples from the G1 well were collected for relevant testing and analysis. The main analytical methods included determining the TOC, Rock-Eval pyrolysis, vitrinite reflectance (Ro), kerogen elemental composition, chloroform asphalt “A” and component separation, kerogen carbon isotope, and saturated hydrocarbon chromatography.

3.2. Organic Geochemical Analysis

A Rock-Eval 6 pyrolysis analyzer produced by Vinci Technologies in France was used for the analysis of shale pyrolysis. Forty-one samples from well G1 were analyzed using the bulk-rock method [42,43,44]. The core sample was pulverized to a particle size of 80 mesh, and 100 mg was subjected to pyrolysis. The samples were analyzed under nitrogen at 90 °C for 2 min to remove gaseous hydrocarbons and then heated at 25 °C/min to 300 °C for 3 min to obtain free hydrocarbons (S1). Then, the temperature was raised from 300 °C to 600 °C at a temperature rate of 25 °C/min, and the pyrolysis of kerogen and macromolecular chain alkanes was measured to obtain the pyrolysis hydrocarbons (S2). The temperature corresponding to the maximum yield of S2 was denoted as the maximum pyrolysis peak temperature (Tmax) for evaluating the maturity.
The TOC was determined by the LECO CS-230 carbon (C) sulfur analyzer (LECO, Saint Joseph, America). The sample was crushed to a particle size of less than 100 mesh and heated with 5% dilute hydrochloric acid to remove the inorganic carbon prior to the analyses.
The vitrinite reflectance (Ro) was measured by the CRAIC 508PV automatic microphotometer and the Leica DM4P semi-automatic forward polarizing microscope. The reflectance of vitrinite was determined by measuring the intensity of the reflected light and the vertical incident light on the polishing surface under a green light of 546 nm under oil immersion conditions. In the experiment, no less than 20 determinations were made for each sample. The vitrinite reflectance was recorded for each test sample under reflective white light and oil immersion (% Ro) conditions. Because the shale of the Qingshankou Formation in well G1 is dominated by sapropelic organic matter and has low vitrinite content, the actual number of measured points is between 7 and 34. The test was carried out according to the industry standard of the People’s Republic of China [45].
Powdered samples (about 50 g each) were extracted with Soxhlet chloroform for 72 h at 80 °C and then the extraction solvent was determined by tertiary fluorescence to obtain the source rock extract (asphalt). The solvent-free extract was diluted with about 1 mL of CH2Cl2, and then the asphaltene in the rock extract was precipitated with about 50 mL of hexane. The soluble fractions were separated on a silica gel/alumina column, using hexane, benzene, and methanol as eluents to obtain the saturated hydrocarbon, aromatic hydrocarbon, resin, and asphaltene fractions, respectively.
The conventional hydrochloric acid/hydrofluoric acid method was used to separate and enrich kerogen from powdered rock samples after chloroform extraction [45]. Elemental analysis (C, H, O, S, and N) of enriched kerogen was performed by a Vario-MICRO instrument (elementar Analysensysteme, Frankfurt, Germany). The kerogen was oxidized in a chemically reducing environment at the high temperature of 1150 °C. Each element was oxidized to its corresponding oxide; these were then processed through the separation and measurement system and adsorbed onto different adsorption columns. During the heating process, the content of different elements in the organic matter was determined by an infrared detector.
The Agilent 7890A gas chromatograph was used for the determination of saturated hydrocarbons. The shale was kept at a constant temperature of 300 °C for 3 min. The evaporated hydrocarbons were removed, and then the sample was placed into a crucible for pyrolysis and heated to 600 °C at 30 °C/min. The carrier gas was helium, and the chromatograph peak retention index, time, and reference material were used after the experiment was completed. The proportion of biomarkers was calculated according to the peak areas of each compound [46].
The carbon isotope of kerogen was determined in a Delta V stable-isotope mass spectrometer (Thermo Fisher, MA, USA). After the sample was crushed, it was soaked in distilled water for 2 h. Then, 6 M of hydrochloric acid was placed in the sample and stirred at 70 °C for 2 h, washed with distilled water, centrifuged, and removed. Another 6 M of hydrochloric acid and 40% hydrofluoric acid were added. The sample was stirred at 70 °C for 2 h, and the above steps were repeated once. The obtained kerogen was treated in an ultrasonic cleaner for 20 min and then centrifuged at 3000 rpm for 20 min. Then, the upper kerogen was removed and washed with 1% acetic acid solution, followed by washing with distilled water until the halogen-free ions were frozen at −5 °C for 6 h. After drying in a vacuum box at 60 °C, the sample was washed in chloroform for 20 min and dried for later use. A 1 mg kerogen sample was heated in a decomposition furnace at 800 °C for 3 min. H2O was removed at −45 °C and CO2 was collected at −196 °C and then analyzed by mass spectrometer.

4. Results

4.1. Abundance of Organic Matter in Source Rocks

4.1.1. TOC

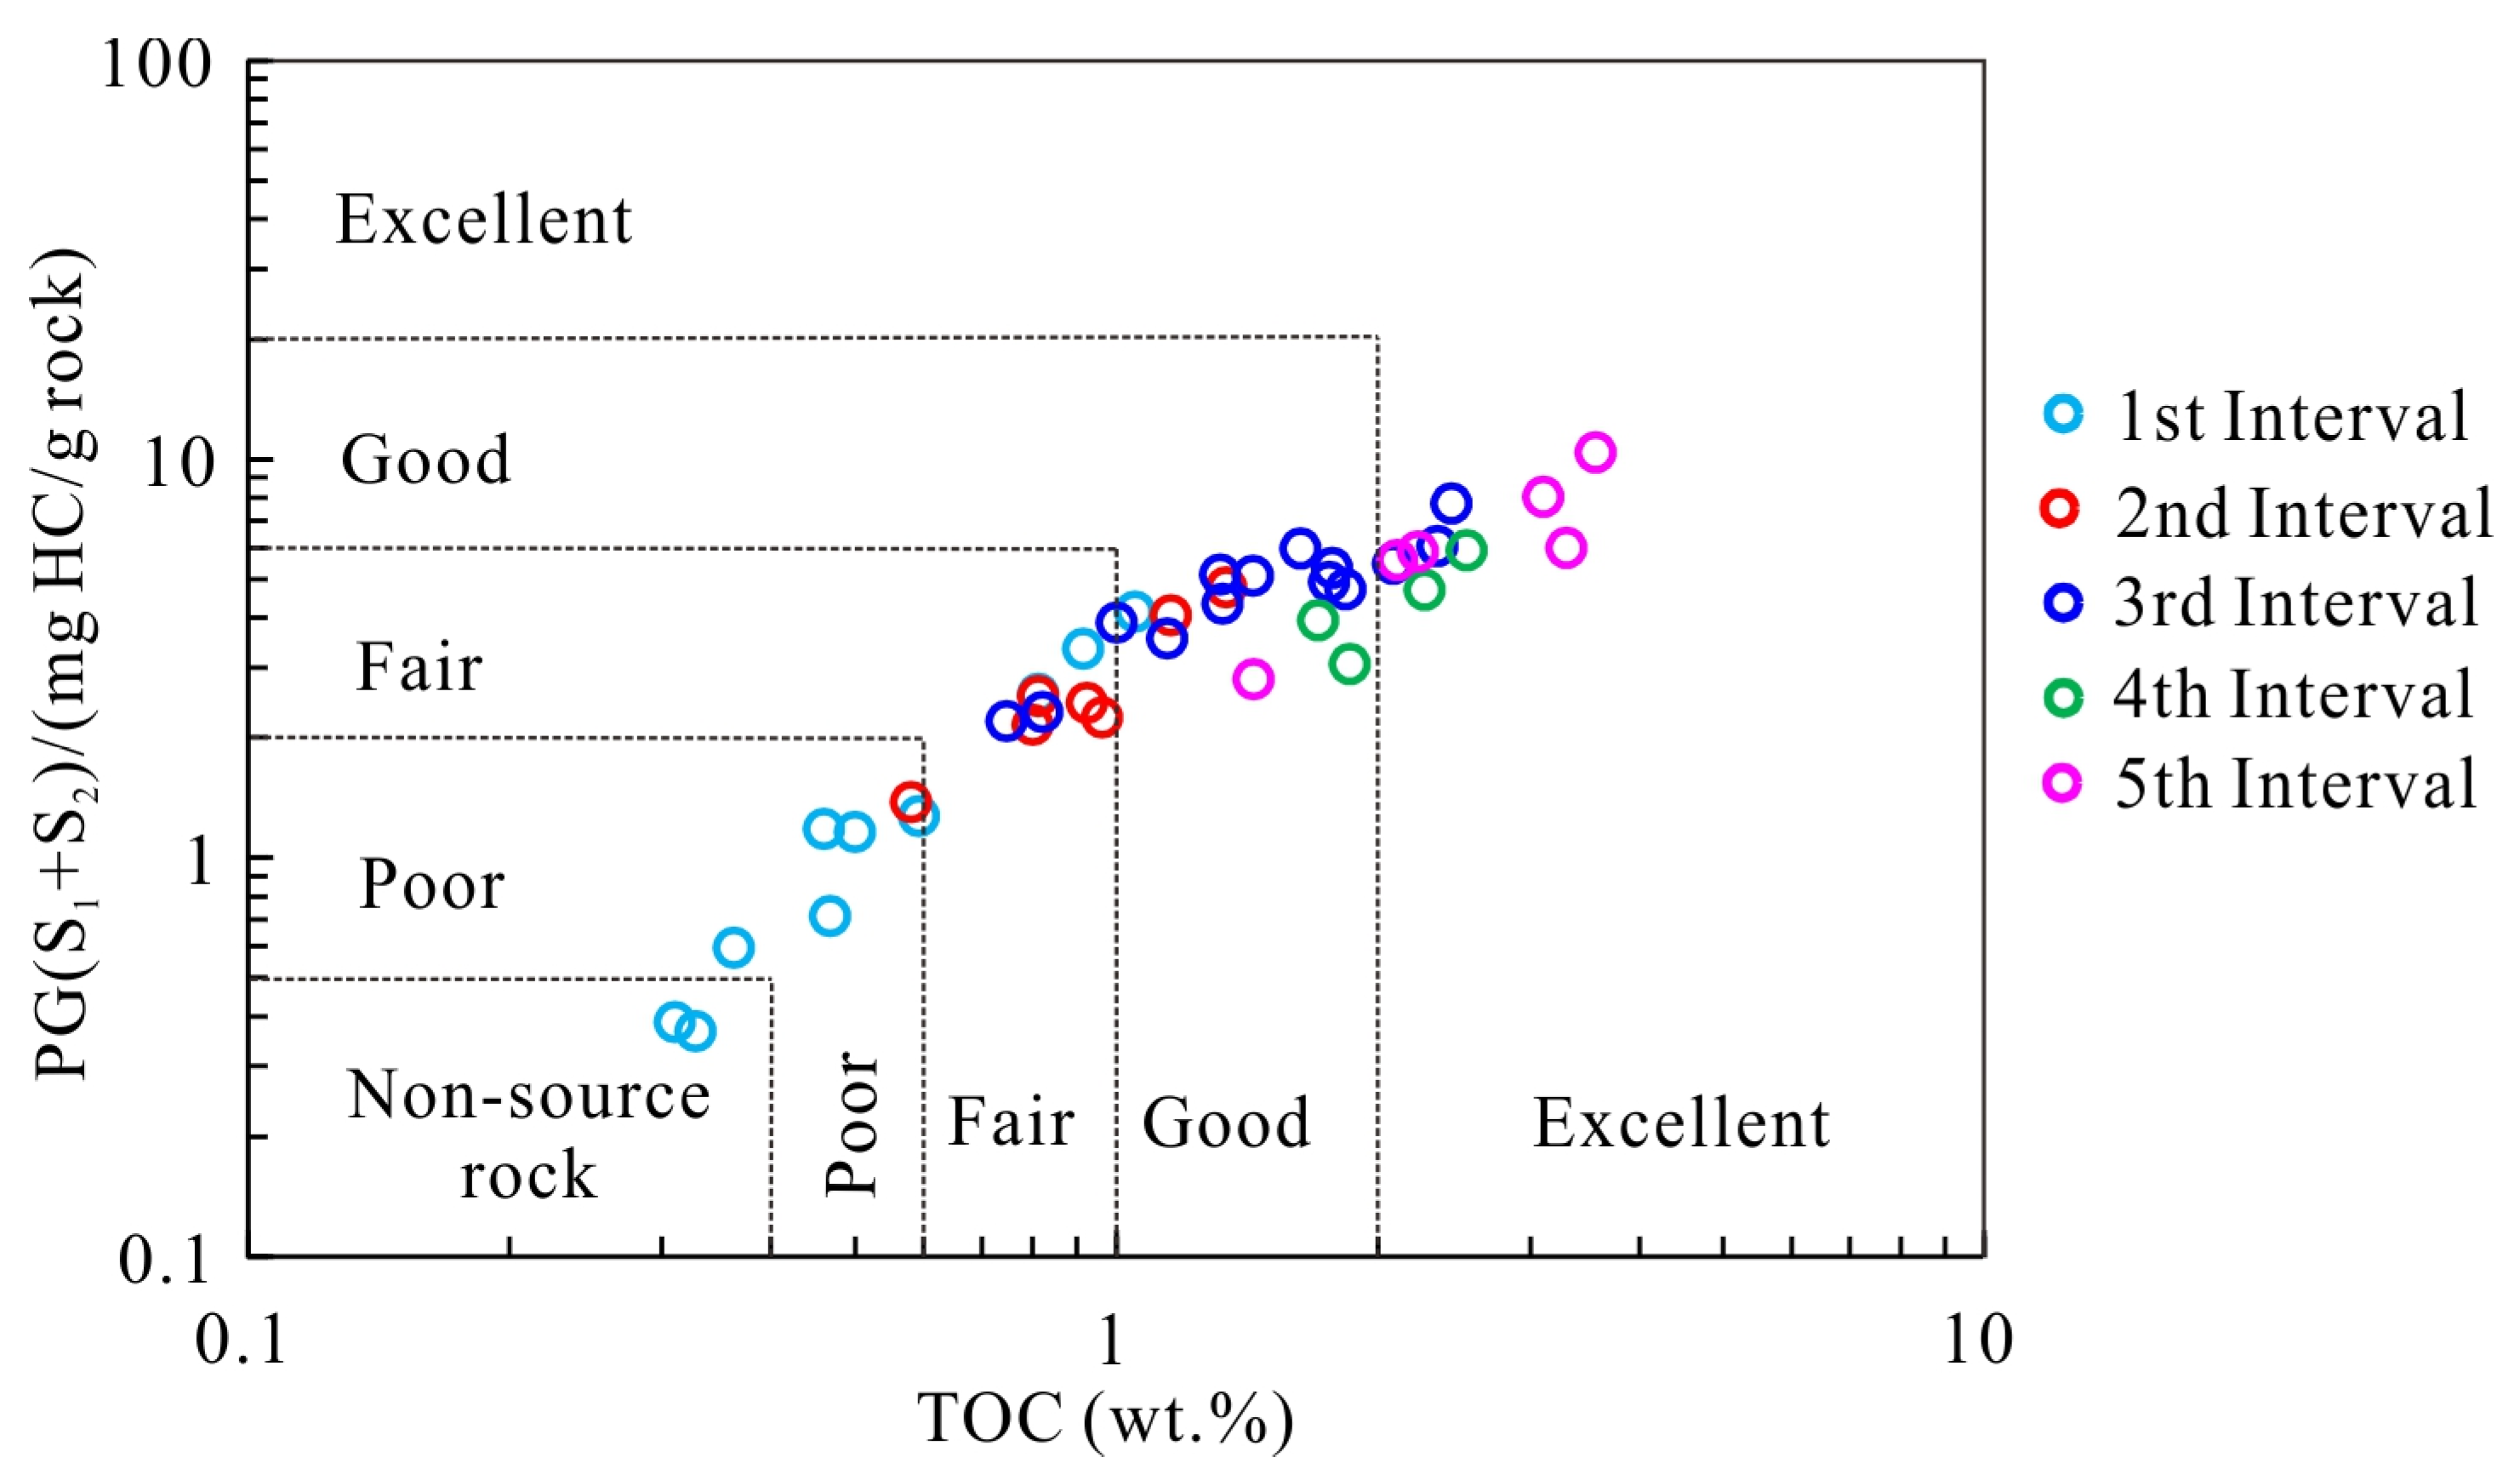
The TOC of the source rocks in the G1 well ranges from 0.31% to 3.59%, with an average of 1.43%. According to the evaluation criteria of the organic matter abundance of argillaceous source rocks in continental basins [47], well G1 has developed non-source rocks to very good source rocks, but it is dominated by good- and excellent-level rocks, accounting for 60.98% of the total samples (Figure 4). In the five subdivisions of the Qingshankou Formation, the TOC content shows a gradual increase from interval 1 to interval 5 with an increase in the burial depth, and the good–excellent source rocks mainly develop in the third to fifth segment.

4.1.2. Potential of Generating Hydrocarbon (PG)

The PG content of source rocks in the Qingshankou Formation ranges from 0.37 to 10.46 mg/g, with an average of 3.89 mg/g. In general, the source rocks in the Qingshankou Formation are mainly of medium to good grade (Figure 4). At the same time, from interval 1 to interval 5, the PG content shows a gradual increase, which correlates with the TOC (Figure 3). However, the abundance level of organic matter shown by the PG is not completely consistent with that shown by the TOC, with good to very good source rock quality, primarily because the Qingshankou Formation has reached a mature to a high-maturity stage. A large amount of kerogen is converted into oil and discharged from the source rock, and the residual hydrocarbon generation potential is low. Therefore, the average kerogen pyrolytic hydrocarbon content (S2) is only 2.65 (0.34~5.4 mg/g).

4.1.3. Chloroform Asphalt “A”

The content of chloroform asphalt “A” in the Qingshankou Formation ranges from 0.040% to 0.621% (Appendix A, Table A1), with an average of 0.291%. The average content of chloroform asphalt “A” in interval 1 to interval 5 is 0.119%, 0.191%, 0.435%, 0.229%, and 0.456%, respectively. The content in interval 3 and interval 5 is significantly higher than that in interval 4, while the content in interval 1 and interval 2 is the lowest.

4.2. Types of Organic Matter in Source Rocks

4.2.1. Van Krevelen Diagram

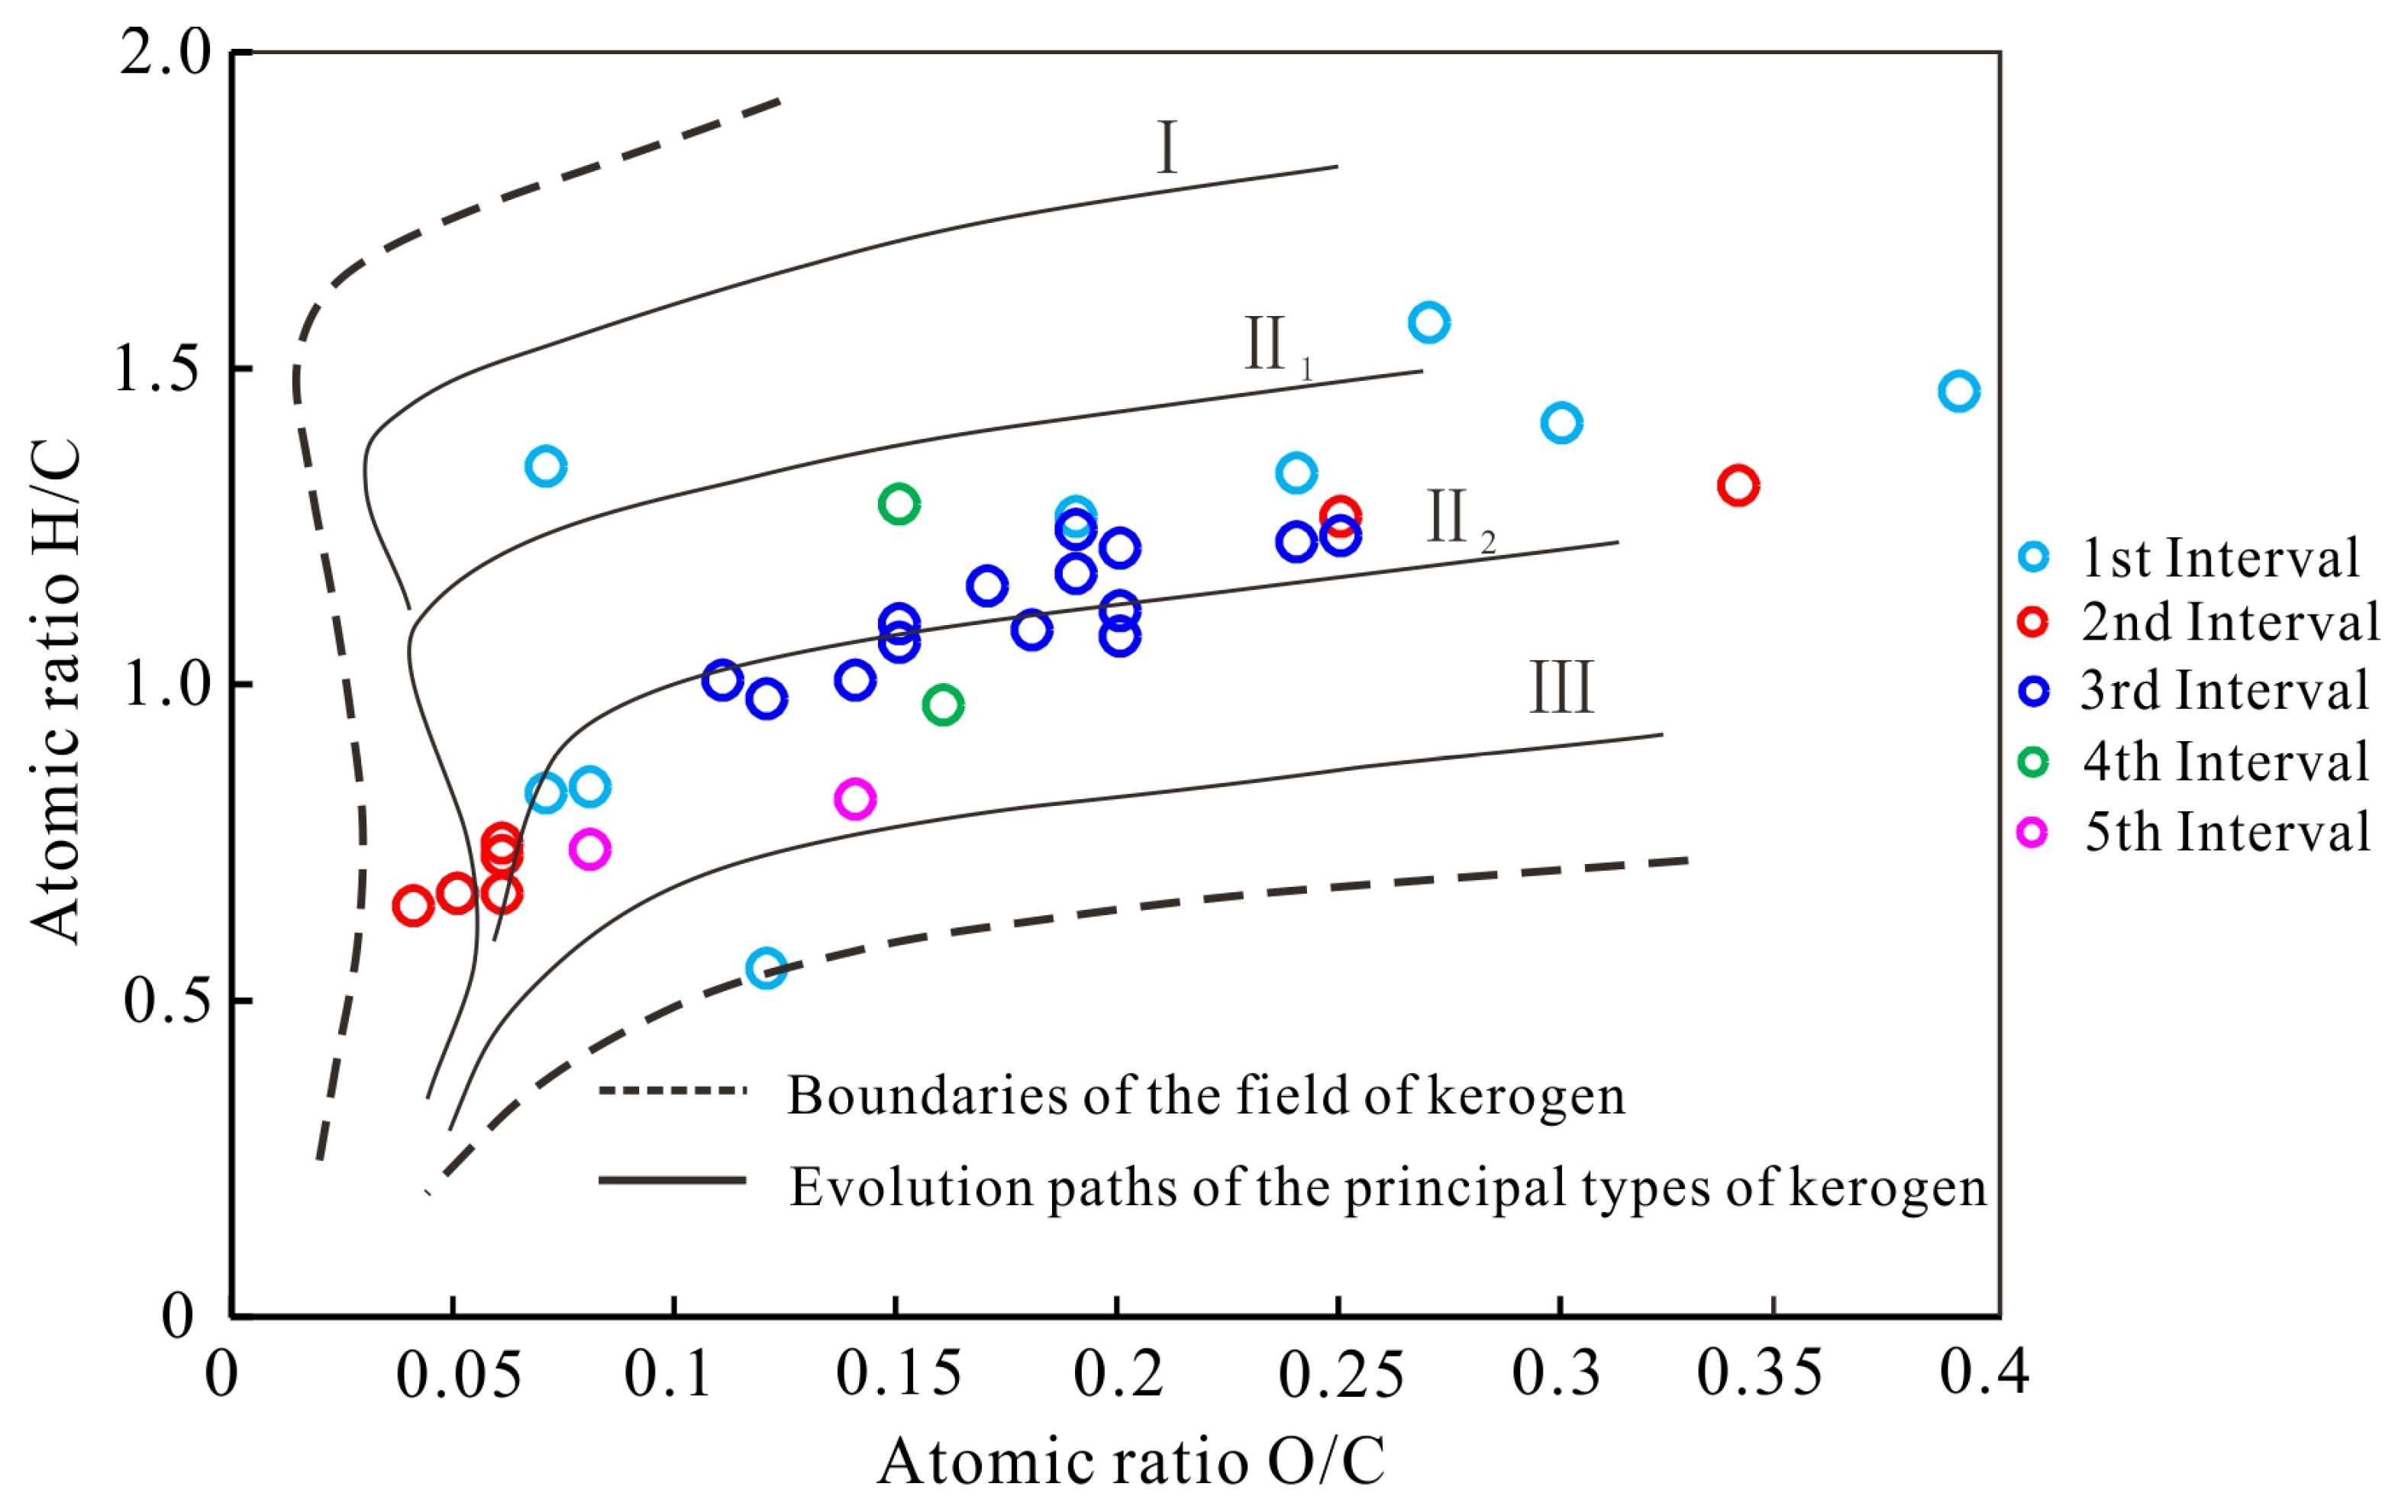
The H/C atomic ratio and the O/C atomic ratio of source rocks of the Qingshankou Formation are 0.55~1.58 and 0.04~0.39, respectively. According to the kerogen-type discrimination chart (Figure 5), the source rock samples of the Qingshankou Formation mainly fall on the evolution trend line of type II kerogen, which indicates that generation of oil in the Qingshankou Formation is predominantly from mixed kerogen. However, because the H/C atomic ratio decreases with the increase in the thermal evolution degree, the Ro of the samples analyzed in the G1 well is between 1.09% and 1.67% (Appendix A, Table A1), the oil generation peak has passed, and the residual kerogen type has declined in quality.

4.2.2. Comparison of TOC and S2

The comparison of rock pyrolysis hydrocarbon (S2)–TOC cross plots to classify organic matter types can avoid the adsorption effect of minerals on hydrocarbons or the influence of “dead carbon” during rock pyrolysis. This overcomes the deficiency of judging organic matter types based on HI [49,50,51,52] to evaluate the type of effective oil source material. According to the relationship between the TOC and S2 (Figure 6), the source rocks of the Qingshankou Formation mainly comprise type Ⅰ organic matter, followed by type Ⅱ, and is chiefly prone to oil generation. Compared to intervals 1 to interval 5, the organic matter types in interval 1 to interval 3 are type I, while interval 4 and interval 5 are distributed in the kerogen region of type II, but close to the area of type Ⅰ. The organic matter type of the Qingshankou Formation determined by Huo et al. (2020) [48] using immature and low-mature samples is mainly type I, which is consistent with the conclusion of the organic matter type of the Qingshankou Formation in the G1 well determined by this method.

4.2.3. Kerogen Carbon Isotope

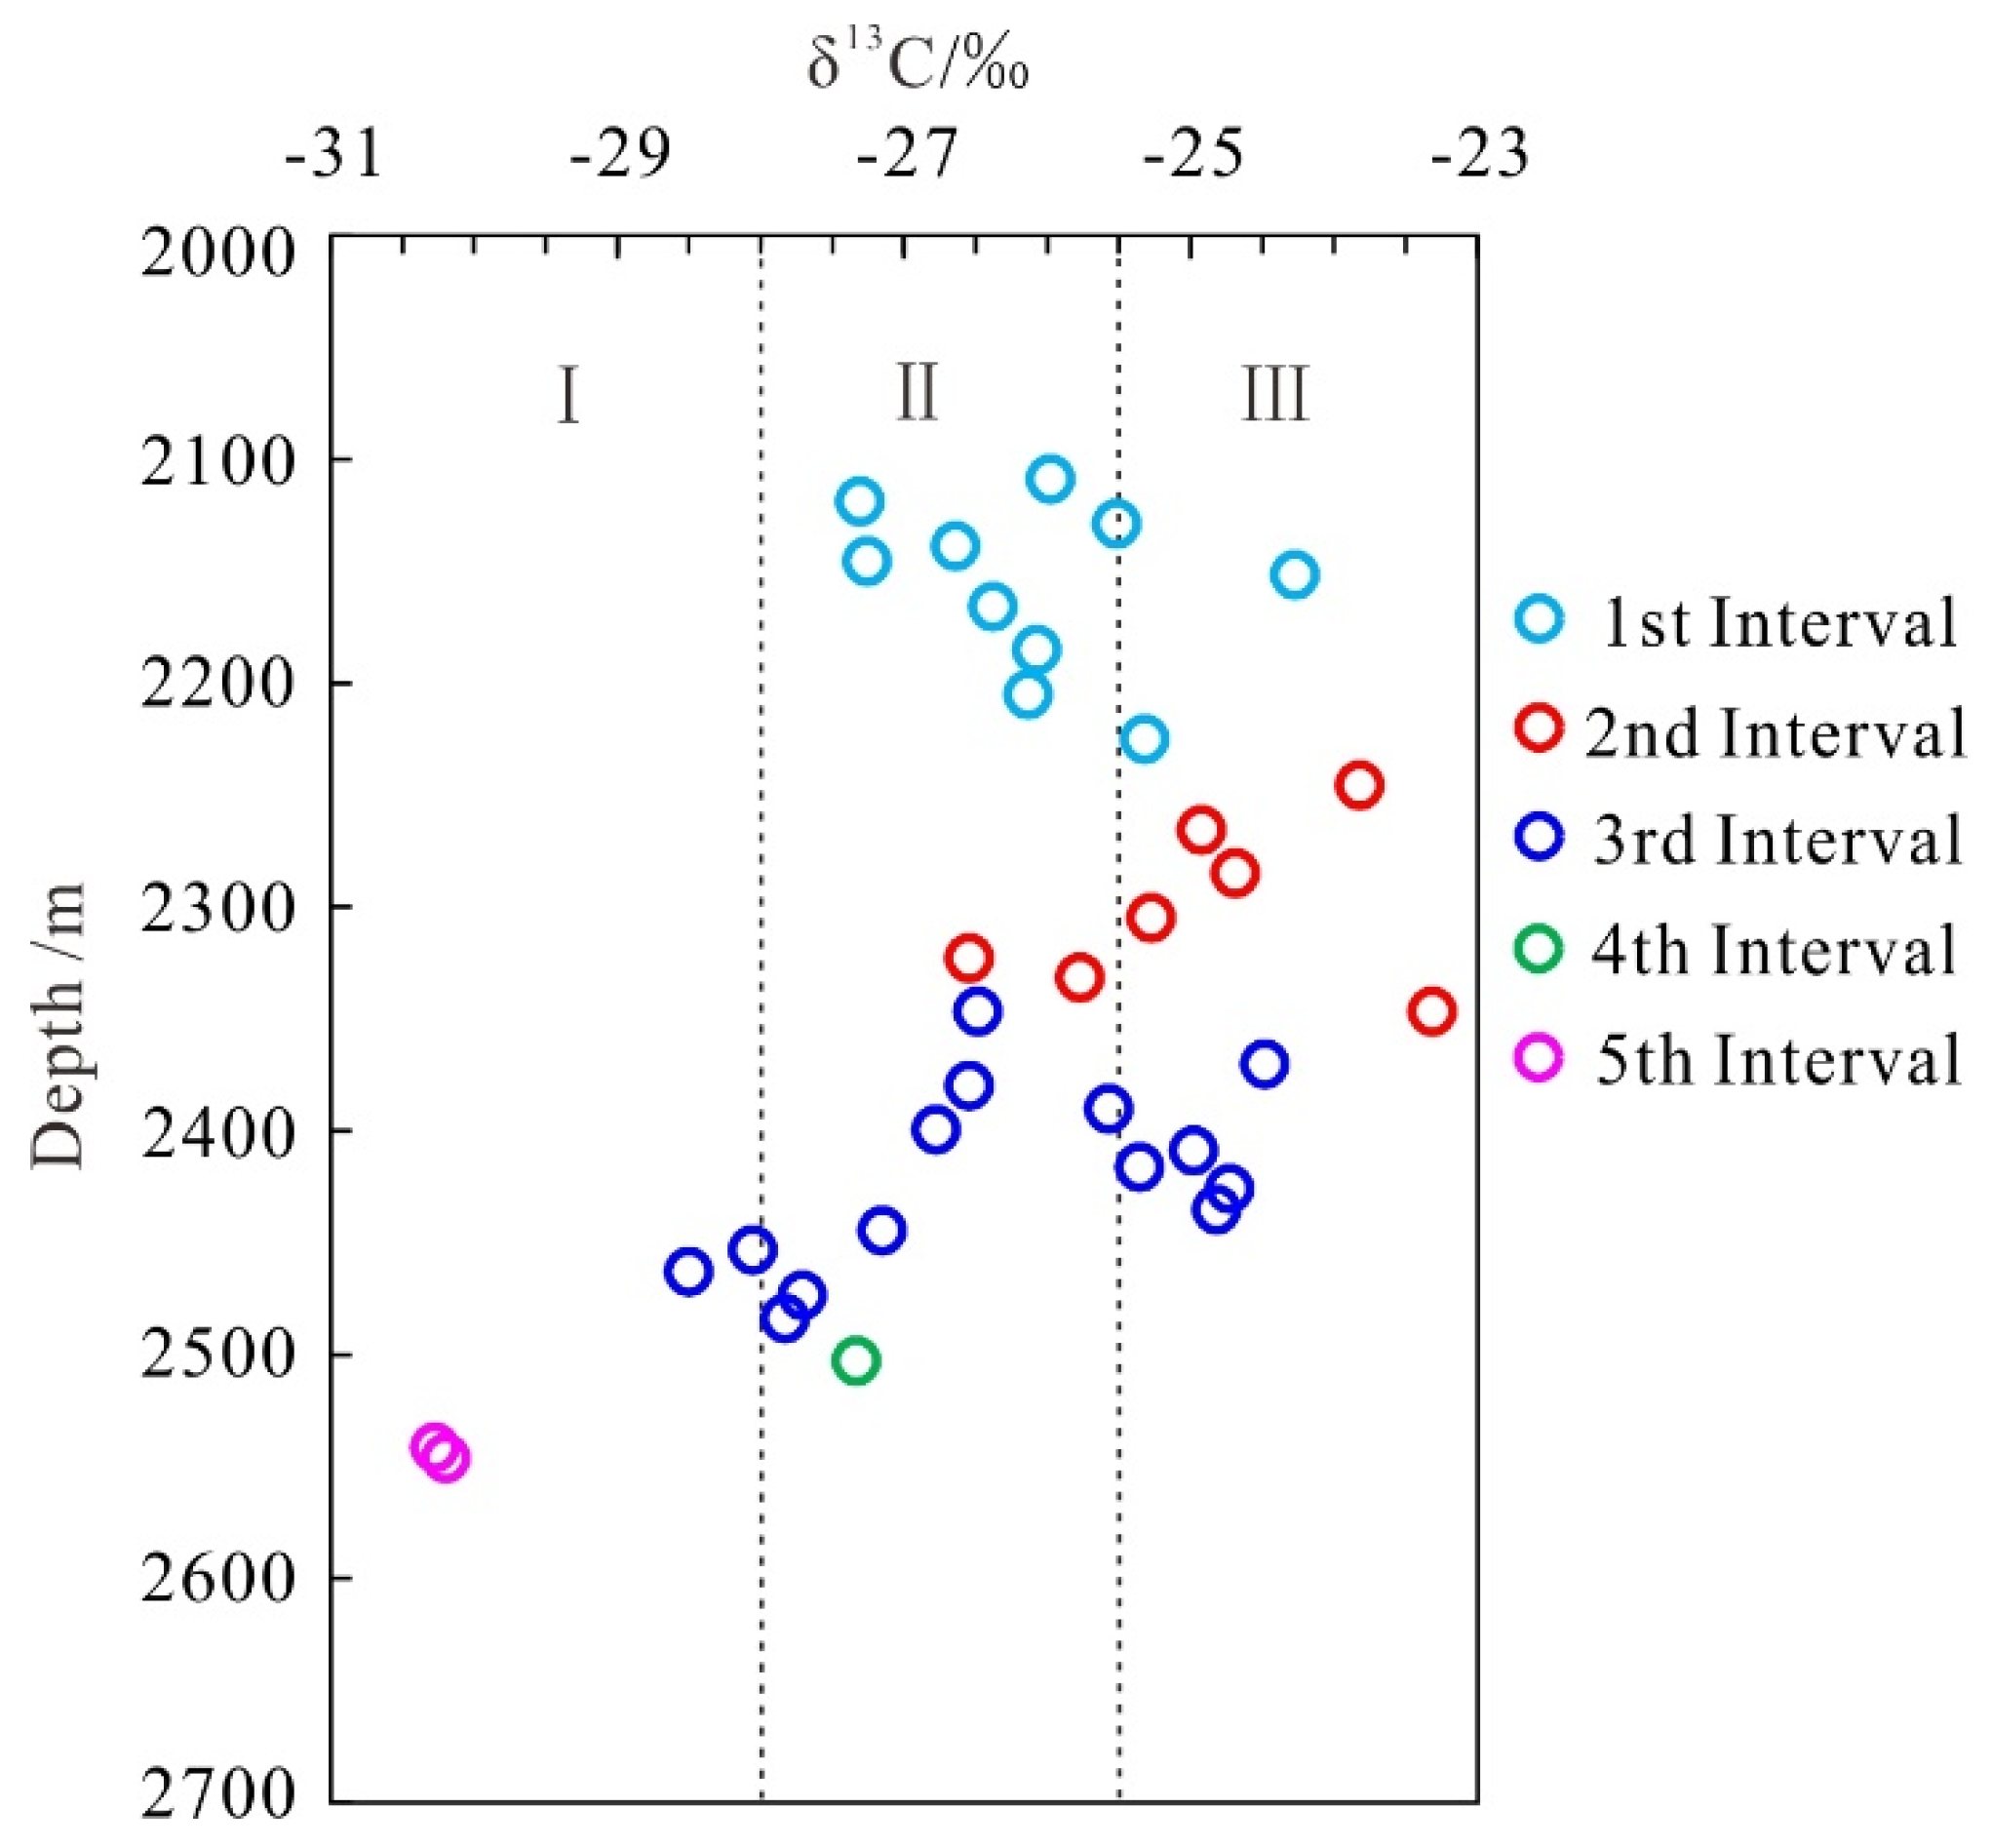
Kerogen carbon isotopes (δ13C) are often used to identify organic matter types [53,54,55,56,57]; type I kerogen δ13C values are less than −28‰, type II kerogen δ13C values are between −28‰ and −25.5‰, and type III kerogen δ13C values are greater than −25.5‰ [58]. According to the isotopic analysis results of kerogen in the G1 well of the Qingshankou Formation, the organic matter types are mainly type II and type III, and type I is the auxiliary type (Figure 7). However, δ13C is a function of maturity, and the δ13C value becomes heavier with increasing degrees of thermal evolution. When the Ro of type Ⅰ kerogen is less than 1.5%, the δ13C value changes up to 3.8‰ [58], which is consistent with the longitudinal evolution trend of δ13C in the G1 well. The Ro corresponding to the burial depth of 2445 m is 1.5% (Appendix A, Table A1), and the organic matter types above this depth are mainly type II and type III (Figure 7). Actually, considering the influence of maturity [59], the primary organic matter types in the Qingshankou Formation are type I and type II.

4.2.4. Intersection Diagram of Pr/nC17 and Ph/nC18

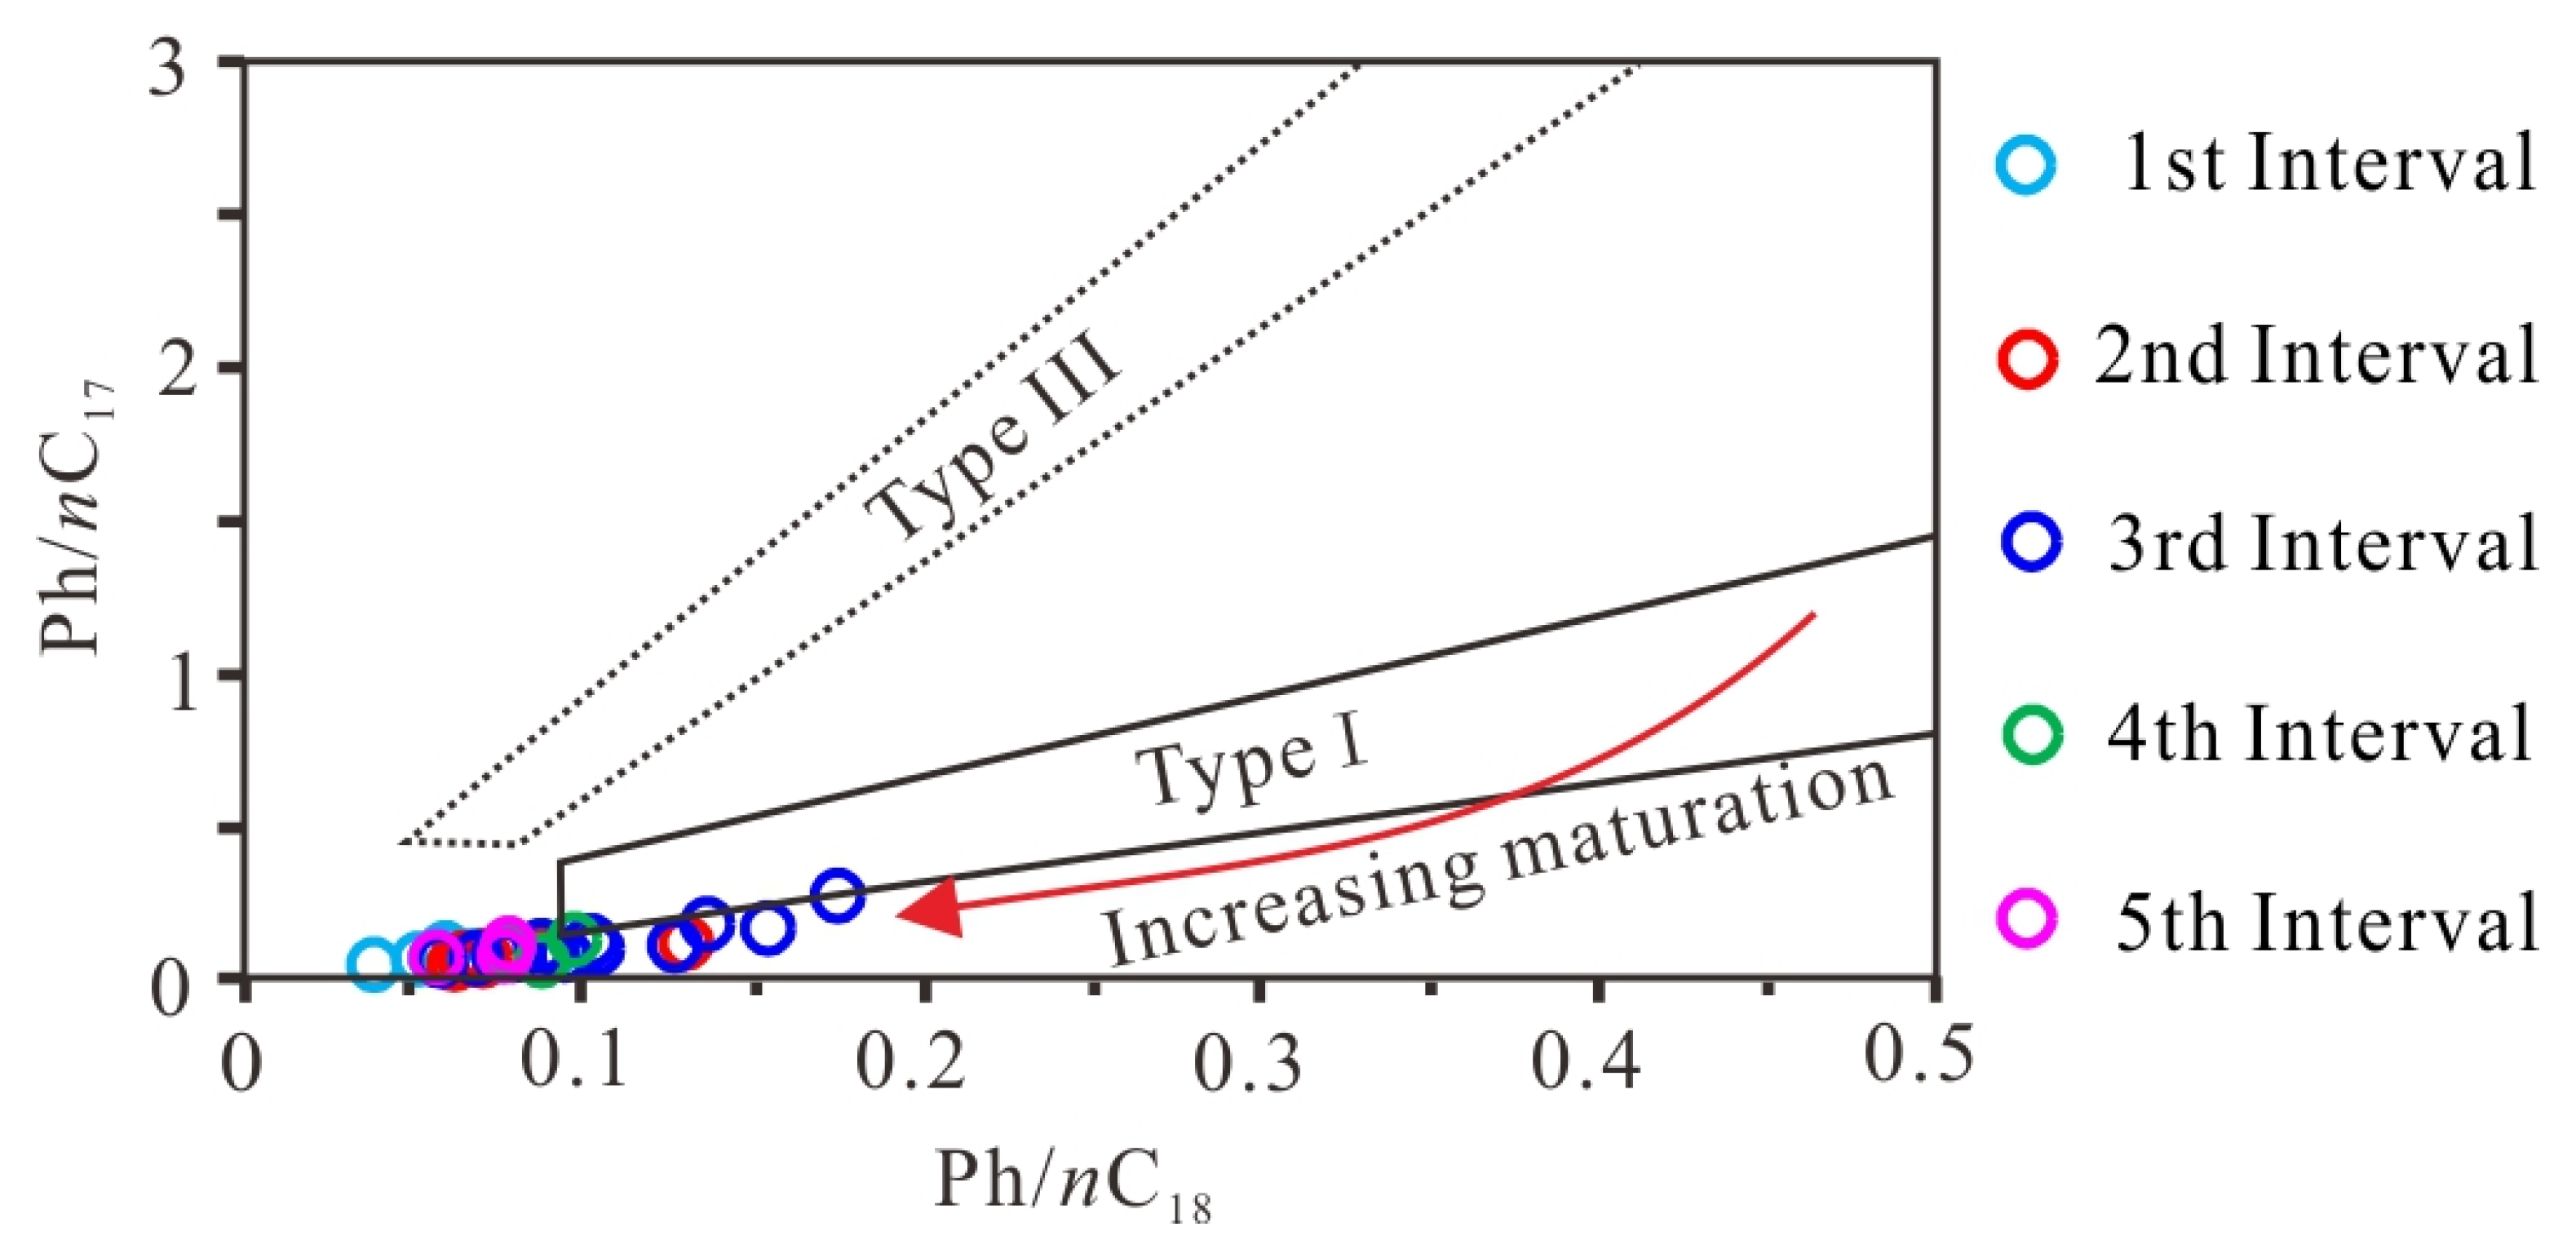
Pr/nC17 and Ph/nC18 are commonly used to judge the type and formation environment of organic matter [59], and Pr/nC17 and Ph/nC18 decrease with increases in the evolution degree. The shale Pr/nC17 and Ph/nC18 in the G1 well of the Qingshankou Formation of the Gulong Sag are 0.05–0.27 and 0.04–0.17, respectively (Figure 8), and the organic matter types are mainly type I.

4.2.5. Determination of Organic Matter Types

The type of organic matter is controlled by the composition of biogenic materials and the stage of thermal evolution. For well G1, it is mainly influenced by maturity, because the Qingshankou Formation in this well is in the stage of mature to highly mature evolution, and the organic matter has been largely transformed into oil and released from the source rock. The small H/C atomic ratio and the high carbon isotope of kerogen are mainly caused by high thermal evolution [49], which leads to the deterioration of the type. In comparison, TOC, S2 values, Pr/nC17, and Ph/nC18 values are all reduced under the influence of maturity, so the types reflected in the intersection diagram are more reliable. Based on the above analysis, it is concluded that the Qingshankou Formation is mainly composed of oil-generative kerogen of type I and type II.

4.3. Maturity of Organic Matter

4.3.1. Vitrinite Reflectance (Ro)

There were many amorphous liptinitic materials in the Qingshankou Formation of the Gulong Sag [48], followed by fusinite, alginite, clastic saproclastite, collinite, and sporinite. The collinite was selected for the Ro test. The Ro of the Qingshankou Formation in the G1 well of the Gulong Sag increases pseudo-linearly with the increase in the burial depth, and the measured Ro ranges from 1.09% to 1.67%, which is in the mature to high-maturity evolution stage, in which interval 1 and interval 2 are in the mature stage, while interval 3 to interval 5 are in the high-maturity stage (Figure 9A).

4.3.2. Maximum Pyrolysis Peak Temperature (Tmax)

The Tmax value of the Qingshankou Formation shale in the G1 well mainly ranges from 390 °C to 450 °C, with an average value of 416.5 °C, and the Tmax value of 75.6% of the samples is lower than 435 °C (Figure 9B), which is significantly different from the maturity stage reflected by Ro. Moreover, with the increase in the burial depth, the Tmax has a decreasing trend, showing the opposite trend to Ro. In addition to the maturity of Tmax and Ro in interval 1, interval 2 to interval 5 are in the immature stage, according to the Tmax value, which is obviously contradictory to the high-maturity stage shown by the measured Ro value (1.23% to 1.67%). The inhibition of the Tmax value at the high-maturity stage is mainly related to the fact that kerogen has basically completed its transformation [59], and the relatively heavy hydrocarbon content of S2 reoccurrence is high [60,61], which leads to the non-prominent main peak of pyrolysis S2 and the shoulder effect (Figure 9C). This is the main reason for the abnormally low Tmax value in advance of extraction compared with that after extraction. Therefore, the Tmax value is not a true indicator of the thermal evolution degree of source rocks. Zhang et al. (2023) [62] conducted pyrolytic analysis on the shale at the mature to the high-maturity stage in the Gulong Sag after extraction, and the pyrolysis Tmax value was between 440 and 490 °C, which is consistent with the measured Ro.

5. Discussion

5.1. Pyrolytic Light-Hydrocarbon Loss and Heavy Hydrocarbon Correction

5.1.1. Recovery of Light-Hydrocarbon Loss during Pyrolysis S1

After underground high-temperature and high-pressure rocks are exhumed to shallower depths and the temperature and gaseous pressure are reduced, light hydrocarbons in shale will dissipate [63]. Generally, the higher the maturity, the greater the amount of gaseous hydrocarbons dissipating. Therefore, the S1 of pyrolysis experiments and the chloroform extracts of conventional methods are actually residual hydrocarbons (Figure 10), which cannot represent the approximate amount of hydrocarbons retained at the subsurface. The recovery of lost light hydrocarbons is useful in determining the degree of enrichment of retained hydrocarbons and the location of sweet spots.
There are many methods to determine the loss of light hydrocarbons, including hydrocarbon generation kinetics [64], the mass balance method [65], the formation volume coefficient method [66], fresh core freezing and hermetic pyrometry [67], the pressurization and hermetic coring method [24], etc. However, the recovery results of the different methods are very different. On the one hand, this shows the limitations of different methods in determining the loss of light hydrocarbons. On the other hand, it reflects that there are many factors affecting the loss of light hydrocarbons, and the law of the loss of light hydrocarbons is complicated. Hydrocarbon loss is a continuous process, and there will be different degrees of hydrocarbon loss during coring, preservation, and crushing experiments [68]. Meanwhile, various influencing factors, such as reservoir physical properties, original oil content, fractures, hydrocarbon properties, and composition [69] make the light-hydrocarbon loss more complicated. The pyrolytic S1 obtained by pressurized closed coring, liquid nitrogen freezing, and closed sample crushing is the closest to the actual underground situation.
Figure 10. Pyrolysis parameters and hydrocarbon composition distribution of chloroform asphalt “A” (revised from [63,70]).
Energies 17 02877 g010
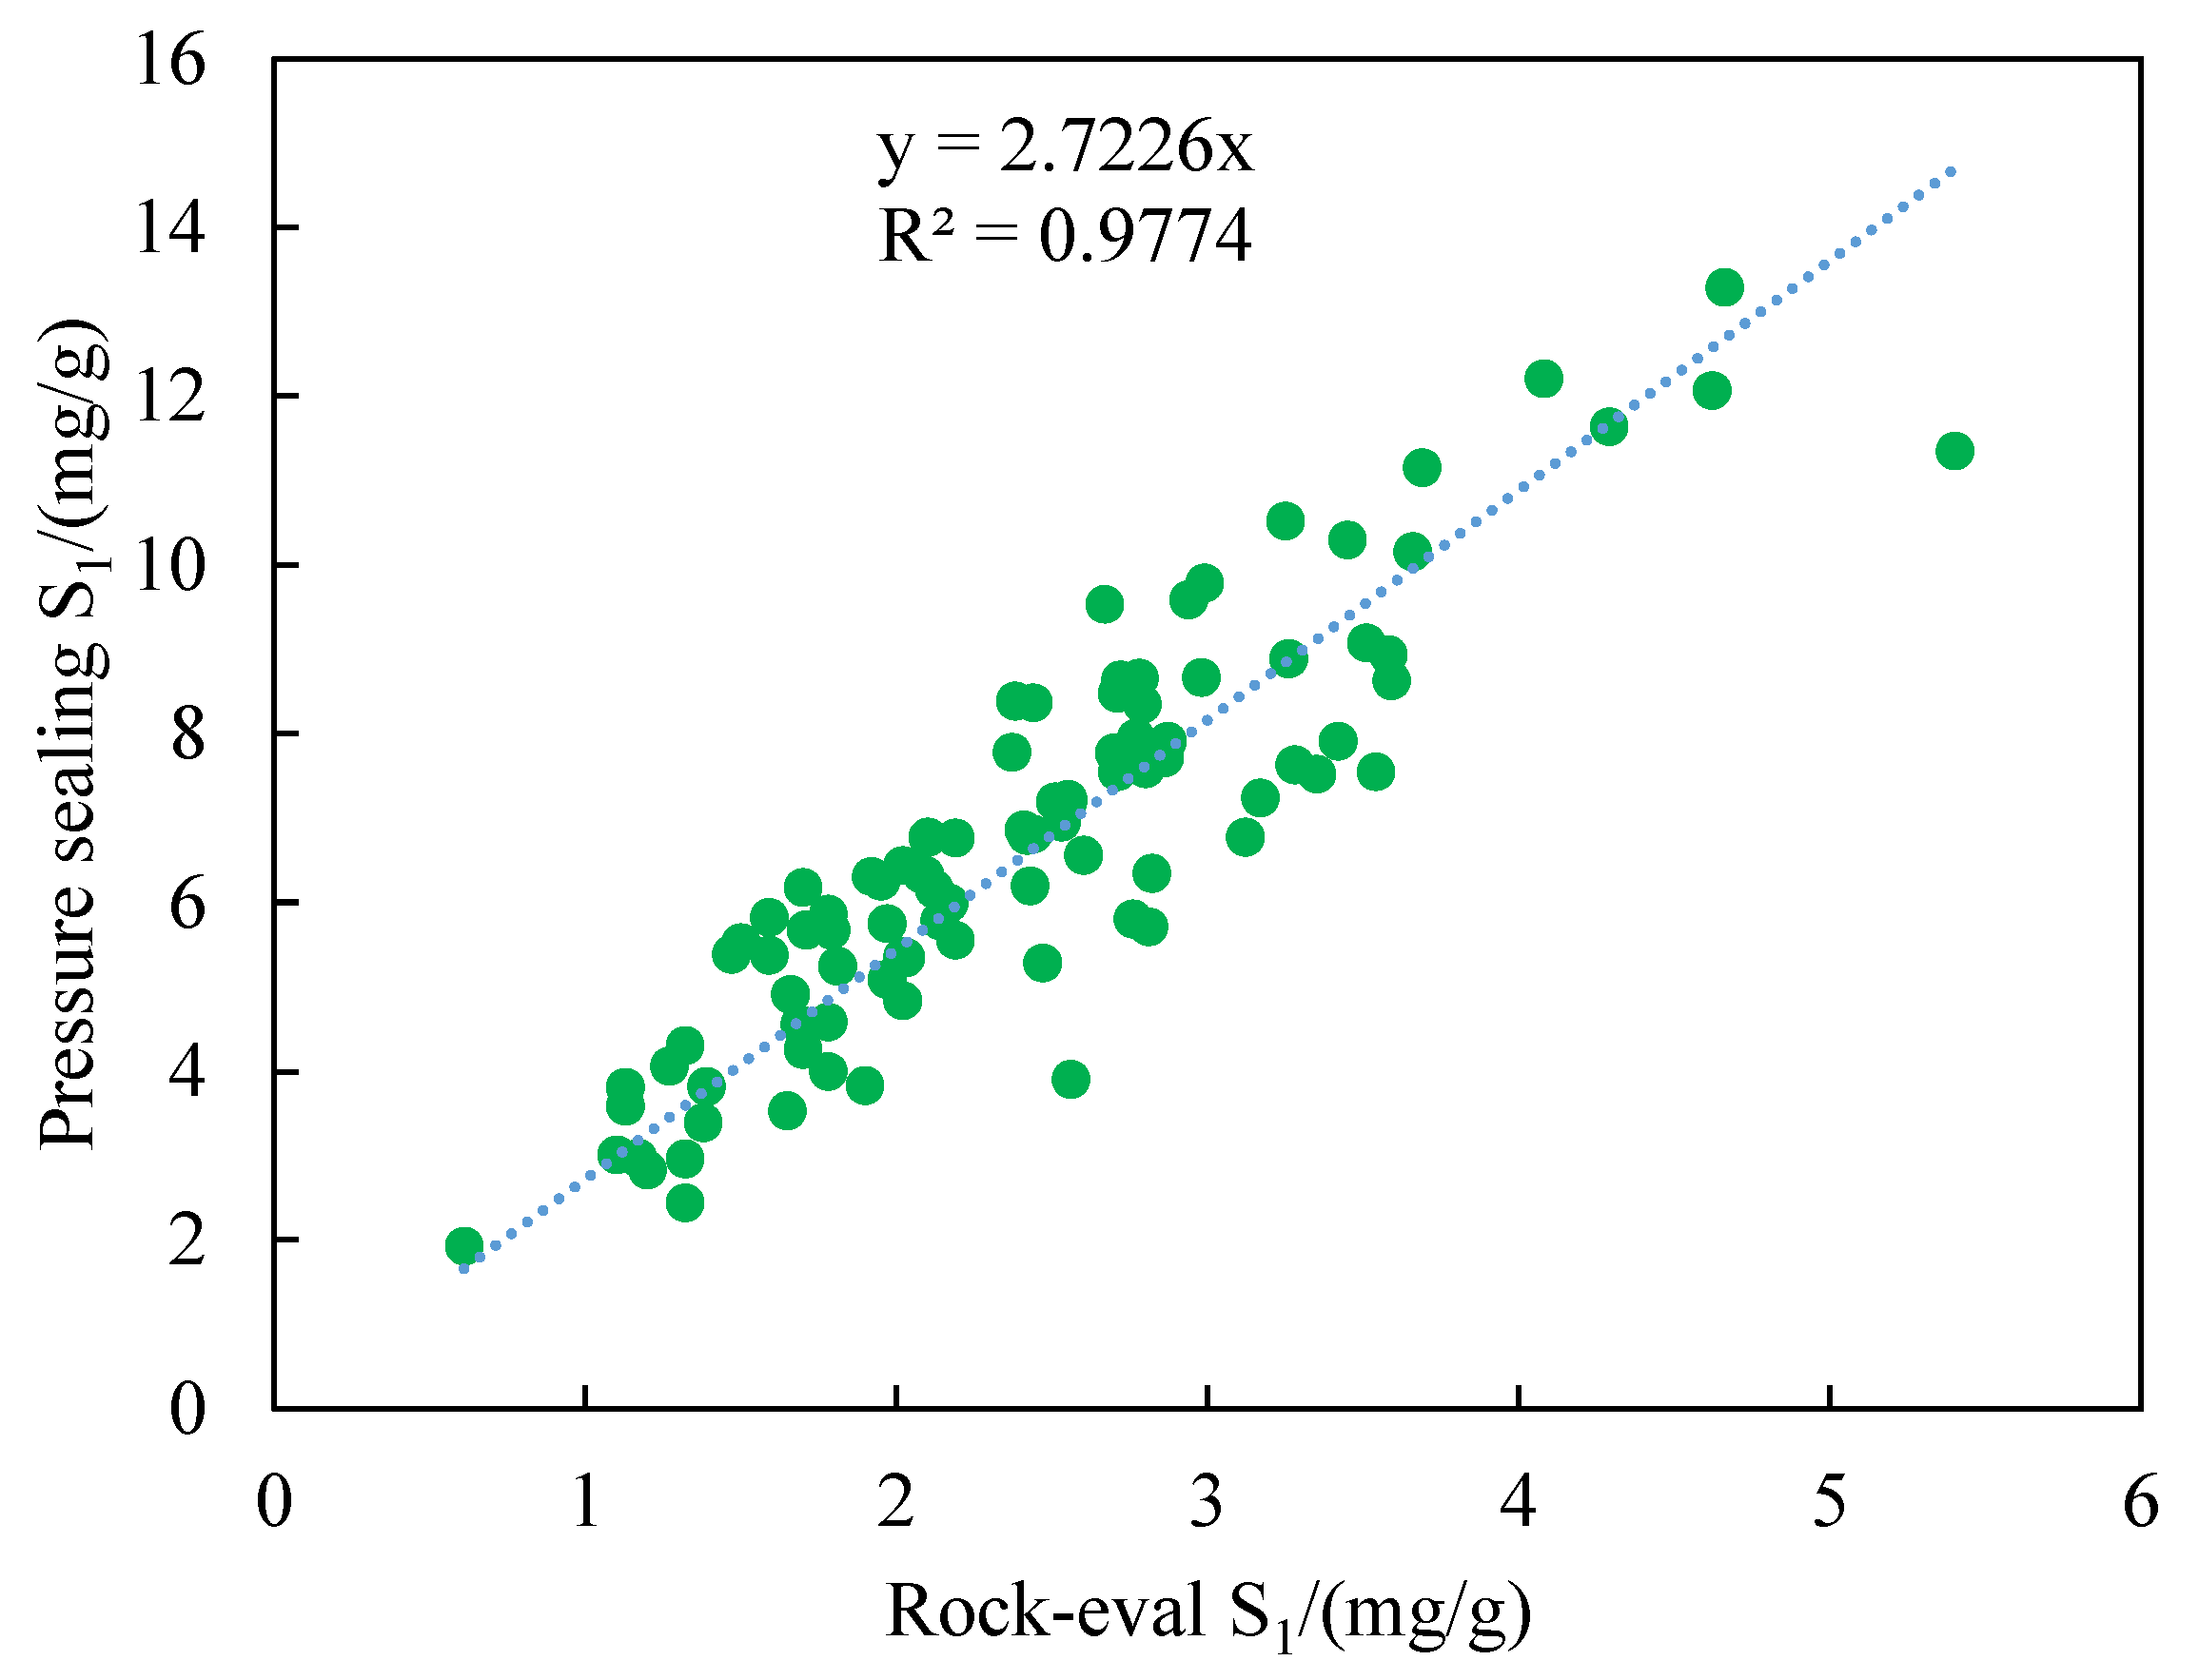
According to the relationship between pressure-maintenance coring pyrolysis and conventional pyrolysis S1 in the Gulong Sag [71], a significant positive correlation was shown between their parameters (Figure 11), and the in situ free hydrocarbon retention underground was 2.72 times that of conventional pyrolysis S1. Conventional pyrolysis S1 ranges from 0.61 to 5.4 mg/g, and pressurized closed pyrolysis S1 ranges from 1.71 to 13.29 mg/g. The calculated loss of light hydrocarbons is from 1.12 to 8.63 mg/g, with an average value of 4.27 mg/g, 1.76 times that of conventional pyrolysis S1 (average value 2.42 mg/g). The loss of light hydrocarbons accounted for 34.49~72.84% of the remaining free hydrocarbons in situ, with an average of 63.27%. It can be seen that for shale oil in the mature to the high-maturity stage, the loss of light hydrocarbons cannot be ignored, and they may be the main components of realistically movable shale oil.
The light-hydrocarbon (including gaseous hydrocarbons) loss coefficients recovered by Wang et al. (2022) for the shale of the Qingshankou Formation in the Gulong Sag are all above two, and the maximum is up to six times the conventional pyrolysis S1 [33], which is significantly higher than the results in this study. The reason for this difference may be related to the fact that the light hydrocarbons recovered at this time did not contain gaseous hydrocarbons. In addition, some light liquid hydrocarbons may have been lost in the powdered samples during the pre-pyrolysis process [31,68].

5.1.2. Pyrolysis S1 Heavy Hydrocarbon Correction

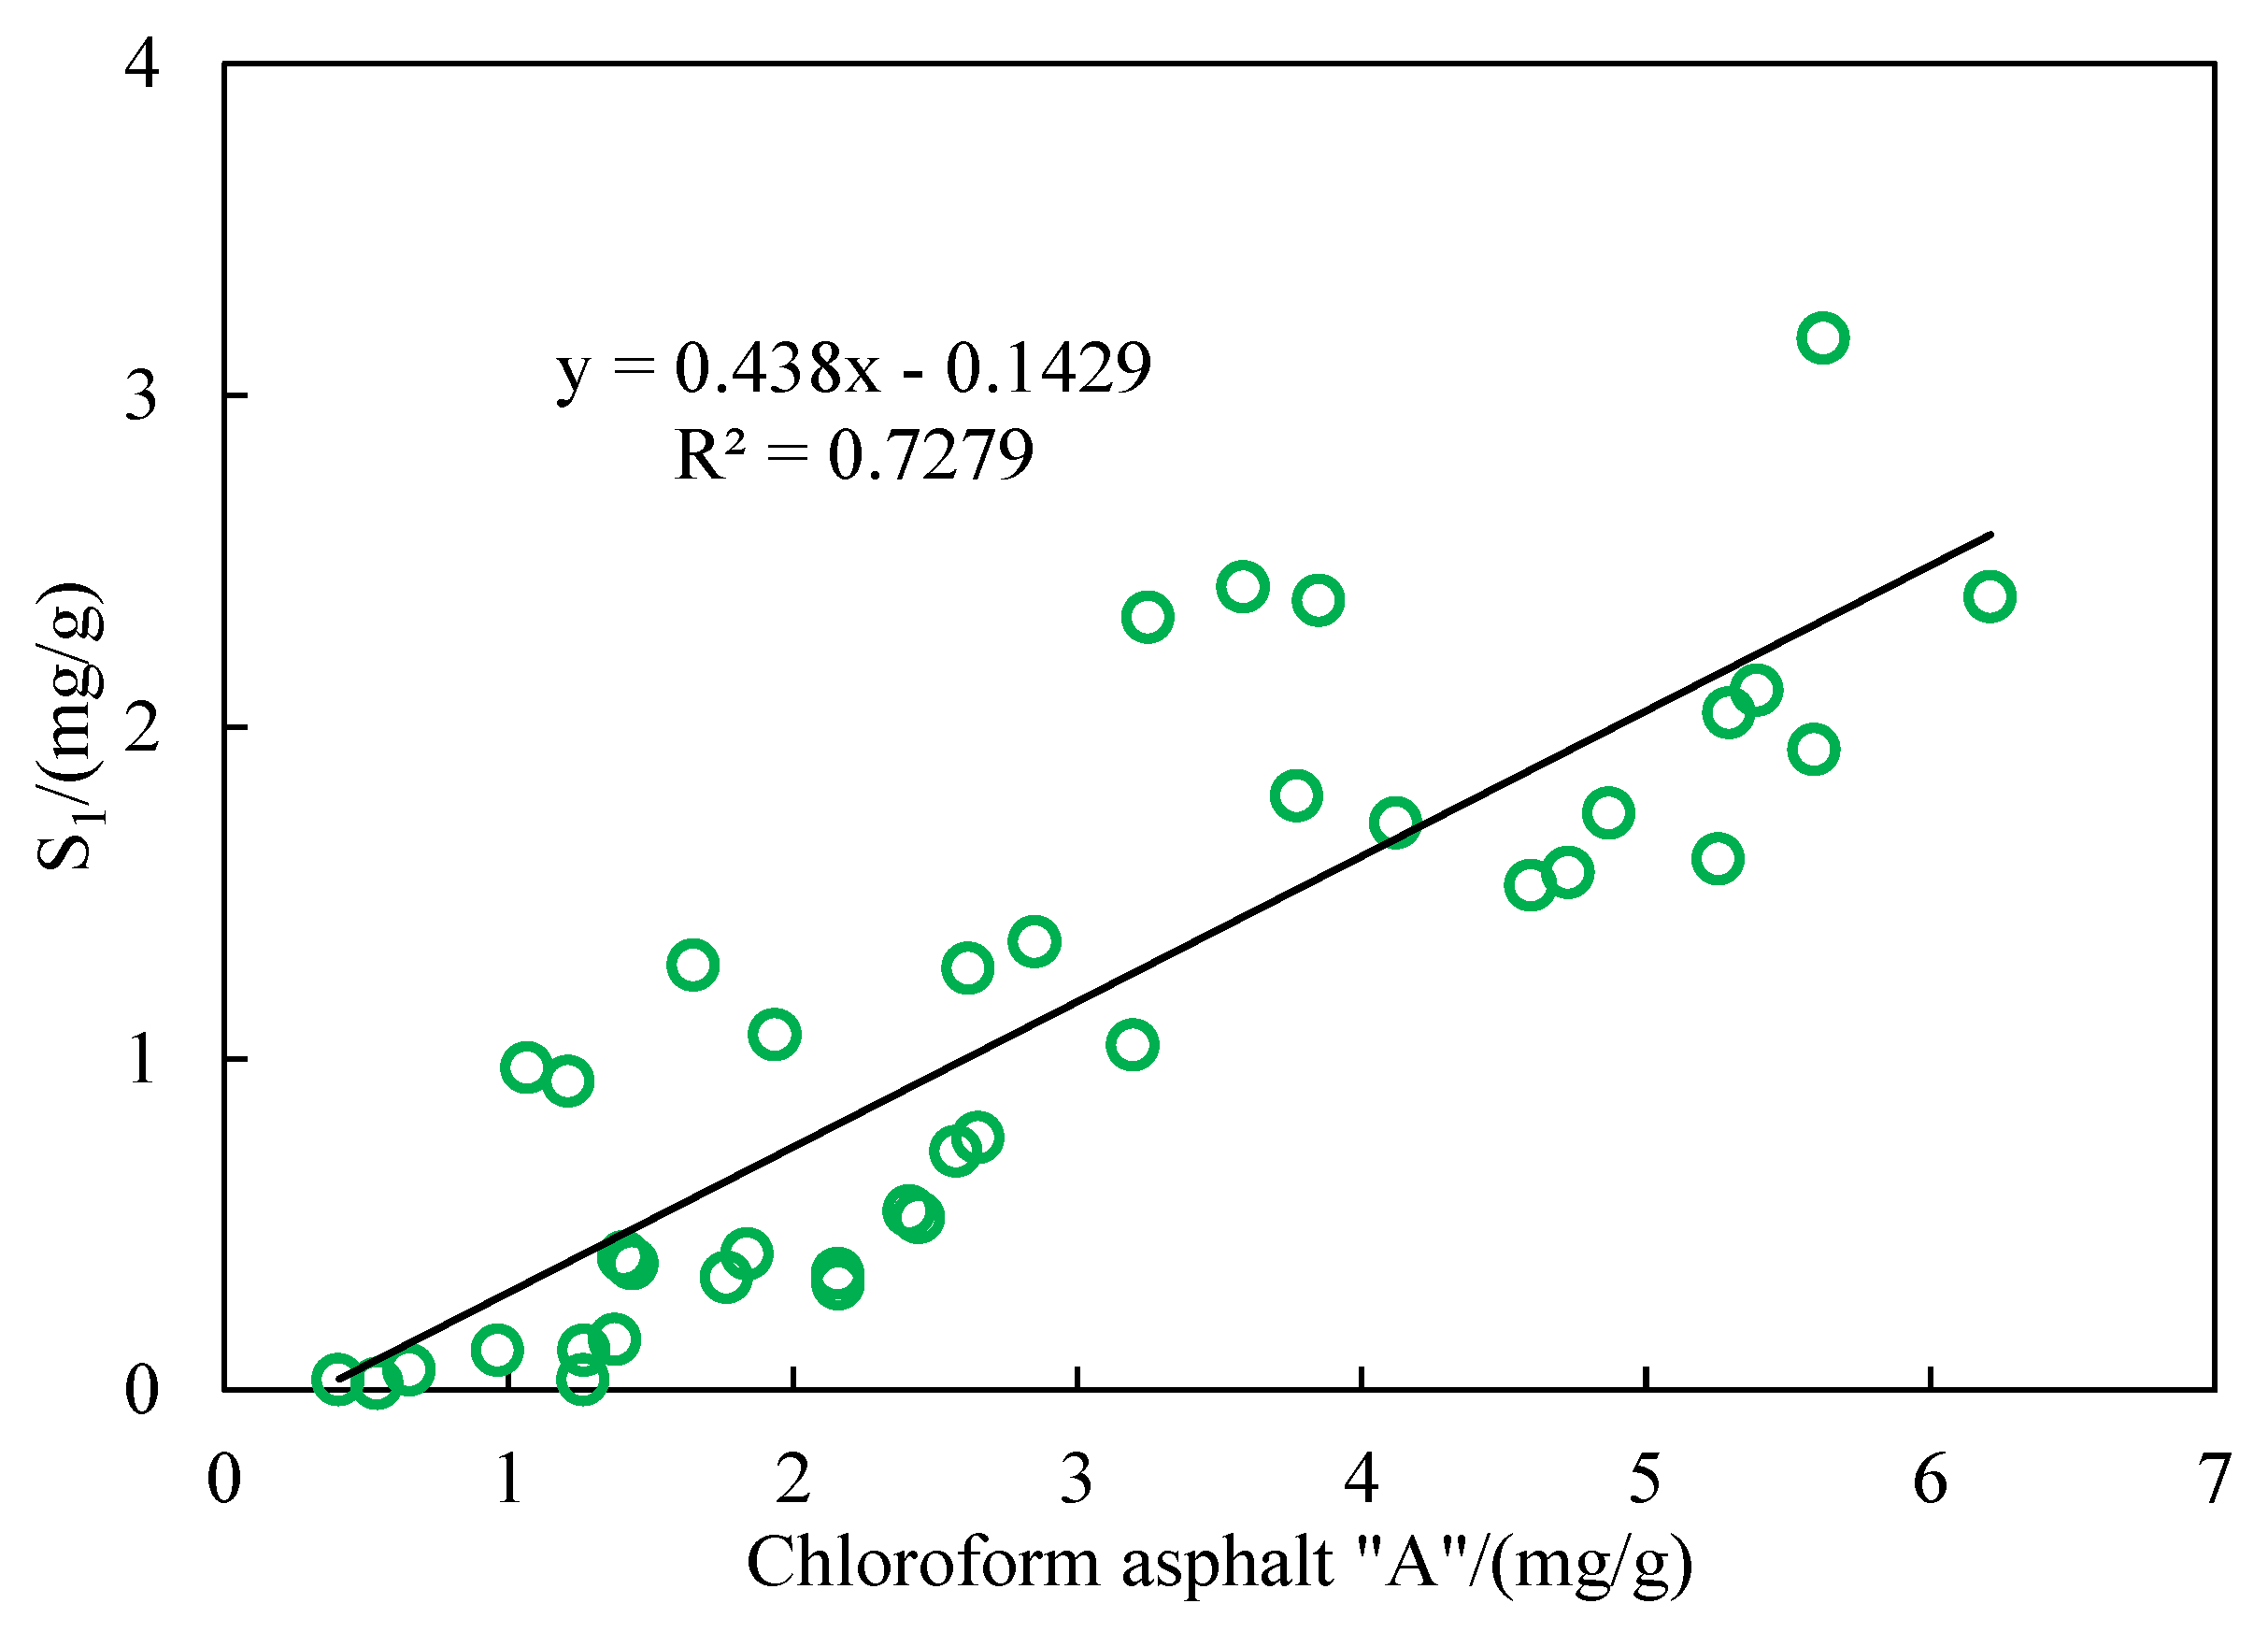
Many studies have shown that not all pyrolyzed hydrocarbons in the traditional pyrolysis of S2 are kerogen, and some relatively heavy hydrocarbons are not released at temperatures less than 300 °C but still remain in S2 [72,73]. Therefore, heavy hydrocarbon correction is required for pyrolysis S1. Chloroform asphalt “A” represents the sum of hydrocarbons, resins, and asphaltenes that have been generated. During the experiment, the water temperature was heated to 80 °C, there was a loss of light hydrocarbons, and hydrocarbons lower than C14 were lost, which is basically equivalent to the loss of light hydrocarbons during pyrolysis S1. Therefore, the difference between chloroform asphalt “A” and pyrolysis S1 was approximately the amount of heavy hydrocarbons remaining in S2. The correction value of heavy hydrocarbons in the Qingshankou Formation shale of the G1 well ranges from 0.1 to 3.82 mg/g, with an average value of 1.71 mg/g (Figure 12).

5.2. Shale Oil Occurrence and Mobility Evaluation

5.2.1. Adsorbed Oil

Compared with inorganic minerals, the adsorption capacity of kerogen is much larger than that of minerals [74]. Therefore, for pure shale oil, kerogen is the main medium for the occurrence of adsorbed shale oil, and the TOC reflects the kerogen content, so the TOC determines the quantity and quality of adsorbed oil. However, a large number of studies have shown that S1 is not all free hydrocarbons. In addition to the lost part of light hydrocarbons, some relatively heavy high-carbon hydrocarbons are still retained in pyrolysis S2 [72,75,76,77,78], and this part has a stronger adsorption capacity and cannot be moved under reservoir conditions [66,79]. Therefore, the adsorbed oil content is approximately equal to the correction value of pyrolysis S1 heavy hydrocarbons.

5.2.2. Free Oil

In situ free oil is the sum of light-hydrocarbon loss and pyrolysis S1, which is equal to the value of pyrolysis S1 in closed coring under pressure. According to the regression formula established in Figure 11, the shale oil content of the Qingshankou Formation can be calculated. The results show that the content of free oil was 1.71~13.29 mg/g, the average was 6.90 mg/g, and the average free oil was four times that of the adsorbed oil.

5.2.3. Shale Oil Mobility Evaluation

Free oil is not necessarily mobile oil, which is free flowing oil under reservoir conditions, but the understanding of shale oil mobility is not unified. Jarvie (2012) [80] proposed that shale oil has exploration potential when the oil saturation index (S1/TOC) is greater than 100 mg/g, which has been widely used internationally for shale oil evaluation. Michael et al. (2013) [81] stated that almost all S1 was mobile oil. However, other scholars report that the actual amount of mobile hydrocarbon during multi-temperature pyrolysis less than 200 °C is the maximum amount of mobile hydrocarbon during pyrolysis below 350 °C [73,82]. Obviously, if the free hydrocarbons below 200 °C are used as the mobile hydrocarbons, the potential of the mobile oil will be underestimated, the hydrocarbons during pyrolysis between 200 °C and 350 °C will include both free hydrocarbon and adsorbed hydrocarbon [78], and the temperature boundary between the two will not be easy to determine. Therefore, the viewpoint of Michael et al. (2013) [81] is adopted in this paper, i.e., that free hydrocarbons are mobile hydrocarbons. In addition, by comparing the chromatogram of saturated hydrocarbons between the crude oil in the Qingshankou Formation of the G1 well and the chloroform extract (Figure 13), it was found that the main carbon peak of the crude oil in the production layer was C10, which is mainly light hydrocarbons, but there were also some medium to heavy hydrocarbons with a high carbon number, while compounds below C19, primarily medium to heavy hydrocarbons, in the core extract were not detected, and light hydrocarbons were lost. This is consistent with the conclusion of Gorynski et al., 2019 [83] in their study on sedimentary basins in Western Canada. The difference is that the shale oil extract from the G1 well of the Qingshankou Formation in the Gulong Sag also has the characteristics of highly saturated hydrocarbons, and the resin content is slightly lower than that of the produced oil, which reflects the accumulation and retention of light liquid hydrocarbons in the shale layer of the Gulong Sag.

5.3. Shale Oil Desert Section

5.3.1. Shale Oil Desert Evaluation Parameters

There are many evaluation parameters of shale oil deserts, and the most important ones, from a geological perspective, are oil content and mobility. The Qingshankou Formation in the Gulong Sag is mainly dominated by pure shale series and forms a residual shale reservoir [19]. Therefore, the abundance of organic matter determines the hydrocarbon generation capacity, which affects the enrichment of shale oil. According to the relationship between the TOC and HI, it was found that when the TOC is less than 1%, the two have a positive correlation, which may indicate the formation of petroleum and is mainly concentrated in the shale layers. When the TOC is between 1% and 2%, the two have a remarkable negative correlation, indicating that large amounts of petroleum are generated and expelled from source rocks. When the TOC is greater than 2%, the relationship between the TOC and HI is not significant, indicating that the hydrocarbon expulsion process has ended. According to the periodic change characteristics of the TOC, a TOC of less than 1% is defined as poor organic matter, a TOC between 1% and 2% is defined as containing organic matter, and a TOC greater than 2% is defined as rich organic matter (Figure 14A).
From the relationship diagram between the TOC and mobile hydrocarbons, the two show a good positive correlation. The average mobile hydrocarbon content corresponding to 1% and 2% of the TOC was 2 mg/g and 5 mg/g, respectively. This limit value is used as the classification evaluation standard of shale oil mobility. After recovering from the loss of pyrolytic light hydrocarbons, the recalculated OSI and TOC show that with the increase in the TOC, the OSI first increases, then decreases, and then increases again. When the TOC is between 1% and 2% and when the TOC > 3%, the OSI value is above 150 mg/g on average, with a maximum of 400 mg/g, indicating that the shale oil has good mobility and exploration potential.

5.3.2. Evaluation of Shale Oil Geological Sweet Spots

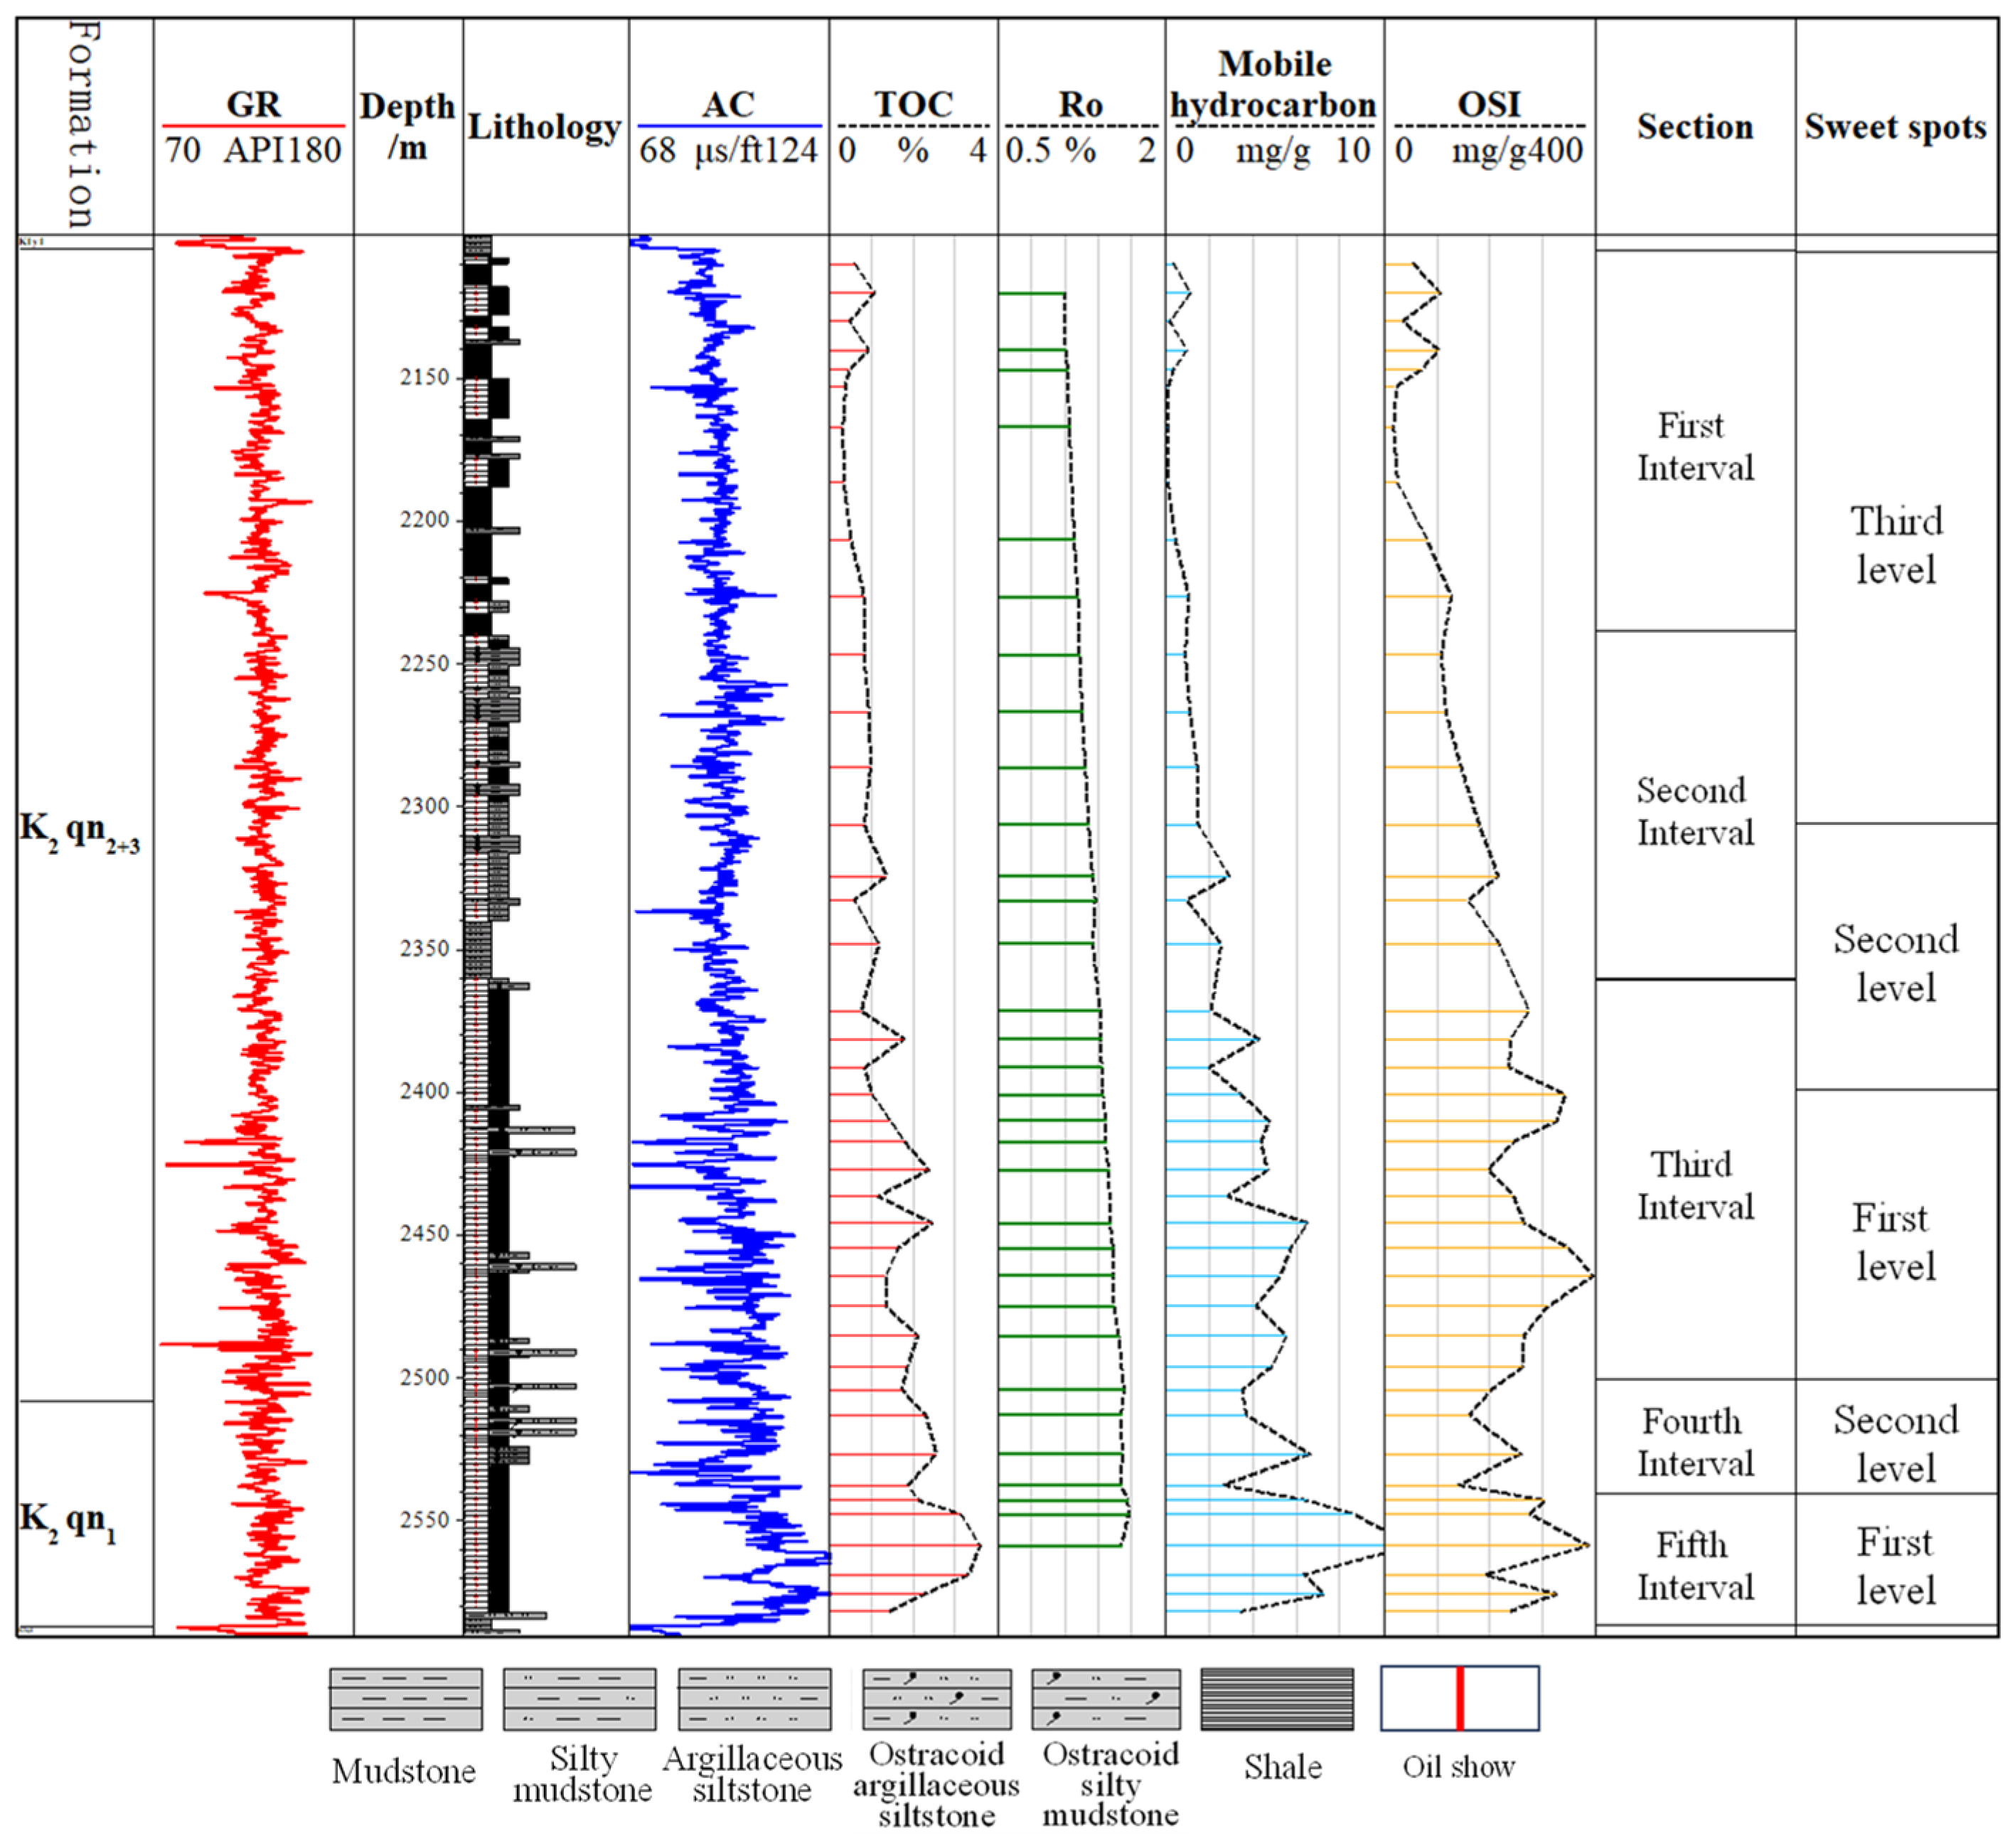
Taking the oiliness and mobility of shale oil as the main reference indexes for desert evaluation, the tertiary evaluation of the Qingshankou Formation shale oil geological desert in the G1 well was carried out. According to the OSI, mobile hydrocarbon content, Ro, and TOC, it was determined that interval 5 and the middle–lower part of interval 3 are the first favorable sections of shale oil, interval 4 and part of intervals 2 and 3 are the second favorable sections, and interval 1 and the upper part of interval 2 are the low-efficiency layers (Figure 15). It can be seen that this classification of deserts focuses on the mobile hydrocarbon content and the OSI, that is, starting from the recoverable shale oil, and the evaluation results are directly linked to the development of shale oil, which has strong practicability. The GYP 1 well deployed next to the G1 well adopted horizontal well and volume fracturing technology to obtain a maximum daily industrial oil flow of 30.5 t [83] during the oil testing in the first section of the Qingshan Formation, which further verifies the reliability of the geological sweet spot determined by the G1 well. Compared with the previous evaluation methods of shale oil sweet spots [23,34], a significant feature of this study is that the reliability of the evaluation results of sweet spots is improved by calculating or restoring the amount of hydrocarbons retained under formation conditions. Because most of the previous evaluation considered the amount of hydrocarbon retained after the loss of light hydrocarbons, this cannot represent the underground conditions.

6. Conclusions

By studying the organic geochemical characteristics of mature to highly mature shales and the occurrence characteristics of shale oil in the Qingshankou Formation, Gulong Sag, Songliao Basin, this study identified the controlling factors of oil content, established the geochemical evaluation criteria for shale oil deserts, and predicted the favorable exploration layers. The main conclusions are as follows:
  • The Qingshankou Formation shale in the Gulong Sag, Songliao Basin, is an oil-source rock dominated by type I and type II1 kerogen with high organic matter abundance and has reached the stage of mature to high-maturity evolution.
  • The average loss of light hydrocarbons in the Qingshankou Formation is 4.27 mg/g, accounting for 63.27% of the total amount of stranded free hydrocarbons, which is also the main component of mobile hydrocarbons. The mobile hydrocarbon content in intervals 2~5 is higher than the adsorbed hydrocarbon content, the shale oil has the best mobility, and the saturated hydrocarbon content of the extract is between 70% and 80%.
  • The Qingshankou Formation can be divided into three resource types—rich, moderately rich, and low-efficiency—with TOC limits of 1% and 2%, OSI limits of 200 mg/g, and mobile hydrocarbon limits of 2 mg/g and 5 mg/g.
  • The shale oil enrichment sweet spot of the G1 well is distributed in interval 5 and most of interval 3, while the moderately enriched shale oil is distributed in interval 4 and parts of interval 2 and 3, and the low-efficiency resources are mainly distributed in interval 1 and the upper part of interval 2. This study provides a geological basis for the selection of shale oil sweet spots of the Qingshankou Formation in the Gulong Sag.

Author Contributions

Conceptualization, Y.B., B.G. and J.L.; methodology, Z.F.; software, M.Y.; formal analysis, B.G.; investigation, Y.B. and J.L.; data curation, J.W. and Y.W.; writing—original draft preparation, B.G. and Z.F.; writing—review and editing, Y.B.; visualization, Y.Z. and H.S.; supervision, Y.B. and Z.F.; project administration, H.S. and B.G. All authors have read and agreed to the published version of the manuscript.

Funding

This work was supported by the National Natural Science Foundation of China (No. 42372155), the major scientific and technological research project of the China National Petroleum Corporation (2023ZZ15YJ01), the Key Laboratory of the Education Department of Shaanxi Province (No. 18JS090) and the Natural Science Foundation of Shaanxi Province (No. 2017JM4014).

Data Availability Statement

The original contributions presented in the study are included in the article, further inquiries can be directed to the corresponding author.

Conflicts of Interest

The authors declare that this study received funding from China National Petroleum Corporation. The funder was not involved in the study design, collection, analysis, interpretation of data, the writing of this article or the decision to submit it for publication. The authors declare no conflicts of interest.

Appendix A

Table A1. Organic geochemical characteristics of source rocks in the Qingshankou Formation, Gulong Sag.
NumberLithologySectionDepth/mTOC/%S1
/(mg/g)
S2
/(mg/g)
PG
/(mg/g)
Tmax
/°C
PIHIS1/TOC × 100
/(mg/g TOC)
Chloroform
Bitumen “A”/%
Carbon Isotope
of Kerogen/‰
Ro/%Standard DeviationTest Points
G1-1Black mudstoneFirst Interval2110.010.600.121.161.284470.09194.0820.080.096−25.962/
G1-2Black mudstoneFirst Interval2120.121.060.413.764.174500.10354.7238.680.184−27.2881.090.0614
G1-3Black mudstoneFirst Interval2130.120.470.060.660.724460.08139.7412.700.065−25.498/
G1-4Black mudstoneFirst Interval2140.120.920.353.023.374480.10327.1237.910.216−26.6221.100.058
G1-5Black mudstoneFirst Interval2146.960.460.121.071.194410.10230.3125.830.127−27.2381.120.059
G1-6Black mudstoneFirst Interval2152.960.370.030.570.604450.05155.828.200.040−24.253/
G1-7Black mudstoneFirst Interval2166.960.310.020.370.394430.05118.256.390.054−26.3621.140.047
G1-8Black mudstoneFirst Interval2186.540.330.030.340.374440.08102.759.070.126−26.058/
G1-9Black mudstoneFirst Interval2206.480.500.151.021.173990.13202.2229.740.138−26.1171.180.0421
G1-10Black mudstoneFirst Interval2226.480.820.382.222.604350.15270.8346.360.144−25.3021.220.069
G1-11Black mudstoneSecond Interval2246.920.810.321.852.174210.15229.0239.610.216−23.8021.230.0514
G1-12Black mudstoneSecond Interval2266.920.930.402.062.464270.16220.7742.870.141−24.9051.250.0616
G1-13Black mudstoneSecond Interval2286.300.970.521.742.263830.23179.2253.560.244−24.6731.280.0518
G1-14Black mudstoneSecond Interval2306.300.820.542.022.564070.21246.4365.880.241−25.2581.310.058
G1-15Black lamellar shaleSecond Interval2324.341.351.073.734.804320.22276.5079.320.194−26.531.350.0920
G1-16Black lamellar shaleSecond Interval2332.740.580.341.051.394070.24179.5258.130.177−25.7531.370.069
G1-17Black mudstoneSecond Interval2347.961.170.933.154.084060.23270.3479.810.121−23.2951.350.0615
G1-18Black lamellar shaleThird Interval2371.530.750.761.462.223920.34193.61100.780.265−26.4671.410.067
G1-19Black lamellar shaleThird Interval2381.331.771.563.404.964200.31191.6687.940.473−24.4641.420.0822
G1-20Black lamellar shaleThird Interval2391.400.830.721.622.343940.31195.2586.780.258−26.5261.430.078
G1-21Black lamellar shaleThird Interval2400.801.011.272.653.924100.32262.64125.870.262−25.5551.440.079
G1-22Black lamellar shaleThird Interval2410.001.451.743.395.134240.34234.12120.170.487−26.7611.460.079
G1-23Black lamellar shaleThird Interval2417.421.791.603.775.374190.30210.8589.490.526−24.9631.460.079
G1-24Black lamellar shaleThird Interval2427.222.361.714.386.094240.28185.3672.370.412−25.3371.490.089
G1-25Black lamellar shaleThird Interval2436.421.161.042.543.584020.29219.9190.040.320−24.71/
G1-26Black lamellar shaleThird Interval2445.792.452.395.407.794170.31220.1497.430.621−24.81.500.078
G1-27Black lamellar shaleThird Interval2454.491.642.113.906.014080.35237.23128.350.539−27.1351.530.088
G1-28Black lamellar shaleThird Interval2464.291.331.933.235.164130.37243.22145.330.559−28.041.530.088
G1-29Black lamellar shaleThird Interval2474.991.341.522.854.374020.35213.16113.690.460−28.4851.540.0913
G1-30Black lamellar shaleThird Interval2485.292.102.043.475.513950.37165.2497.140.529−27.6921.580.089
G1-31Black lamellar shaleThird Interval2495.991.851.792.964.753970.38159.7496.600.377−27.813/
G1-32Black lamellar shaleFourth Interval2504.211.721.282.693.974010.32156.1574.300.165−27.3181.630.0921
G1-33Black lamellar shaleFourth Interval2512.912.291.353.384.734130.29147.9259.080.285/1.600.0612
G1-34Black lamellar shaleFourth Interval2526.522.552.423.535.954180.41138.3294.830.358/1.610.0713
G1-35Black lamellar shaleFourth Interval2537.521.870.972.113.084030.31112.7251.820.107/1.610.0712
G1-36Black lamellar shaleFifth Interval2542.872.122.383.255.634260.42153.01112.050.385−30.2571.660.0925
G1-37Black lamellar shaleFifth Interval2547.663.133.174.928.094350.39157.34101.380.562−30.1831.670.0818
G1-38Black lamellar shaleFifth Interval2558.763.595.105.3610.464290.49149.30142.060.553/1.610.0819
G1-39Black lamellar shaleFifth Interval2568.823.322.333.706.033220.39111.3570.120.325//
G1-40Black lamellar shaleFifth Interval2575.712.242.683.235.914270.45144.00119.48///
G1-41Black lamellar shaleFifth Interval2581.661.451.281.542.824040.45106.1388.22///
Note: “/” refers to parameters not measured.

References

  1. Potter, P.E.; Maynard, J.B.; Pryor, W.A. Sedimentology of Shale: Study Guide and Reference Source; Springer Science & Business Media: Berlin/Heidelberg, Germany, 1980. [Google Scholar]
  2. Morris, N.; Potra, A.; Samuelsen, J.R. Paleoenvironmental constraints on Paleozoic shale deposition in the midcontinent United States. AAPG Bull. 2024, 108, 1119–1147. [Google Scholar]
  3. Zheng, D.; Miska, S.; Ozbayoglu, E.; Zhang, J. Combined Experimental and Well Log Study of Anisotropic Strength of Shale. In SPE Annual Technical Conference and Exhibition? SPE: Kuala Lumpur, Malaysia, 2023; p. D031S046R003. [Google Scholar]
  4. Potter, P.E.; Maynard, J.B.; Depetris, P.J. Mud and Mudstones: Introduction and Overview; Springer Science & Business Media: Berlin/Heidelberg, Germany, 2005. [Google Scholar]
  5. Stow, D.A.V. Sedimentary Rocks in the Field: A Color Guide; Gulf Professional Publishing: Houston, TX, USA, 2005. [Google Scholar]
  6. Jiang, Z.; Liang, C.; Wu, J.; Zhang, J.; Zhang, W.; Wang, Y. Several issues in sedimentological studies on hydrocarbon-bearing fine-grained sedimentary rocks. Acta Pet. Sin. 2013, 34, 1031–1039, (In Chinese with English Abstract). [Google Scholar]
  7. Zou, C.; Zhu, R.; Chen, Z.; Ogg, J.; Wu, S.; Dong, D.; Qiu, Z.; Wang, Y.; Wang, L.; Lin, S.; et al. Organic-matter-rich shales of China. Earth-Sci. Rev. 2019, 189, 51–78. [Google Scholar] [CrossRef]
  8. Meng, M.; Ge, H.; Shen, Y.; Wang, L. Influence of rock fabric on salt ion diffusion behavior in upper cretaceous lacustrine shale from Songliao Basin. J. Pet. Sci. Eng. 2022, 208, 109355. [Google Scholar] [CrossRef]
  9. Folk, R.L. The distinction between grain size and mineral composition in sedimentary rock nomenclature. J. Geol. 1954, 62, 344–359. [Google Scholar] [CrossRef]
  10. Loucks, R.; Reed, R.; Ruppel, S.; Jarvie, D. Morphology, Genesis, and Distribution of Nanometer-Scale Pores in Siliceous Mudstones of the Mississippian Barnett Shale. J. Sediment. Res. 2009, 79, 848–861. [Google Scholar] [CrossRef]
  11. Slatt, R.; O’Brien, N. Pore types in the Barnett and Woodford gas shales: Contribution to understanding gas storage and migration pathways in fine-grained rocks. AAPG Bull. 2011, 95, 2017–2030. [Google Scholar] [CrossRef]
  12. Zou, C.; Yang, Z.; Cui, J.; Zhu, R.; Hou, L.; Tao, S.; Yuan, X. Formation mechanism, geological characteristics and development strategy of nonmarine shale oil in China. Pet. Explor. Dev. 2013, 40, 14–26. [Google Scholar] [CrossRef]
  13. Wirth, R. Focused Ion Beam (FIB) combined with SEM and TEM: Advanced analytical tools for studies of chemical composition, microstructure and crystal structure in geomaterials on a nanometre scale. Chem. Geol. 2009, 261, 217–229. [Google Scholar] [CrossRef]
  14. Klaver, J.; Desbois, G.; Urai, J.; Littke, R. BIB-SEM study of the pore space morphology in early mature Posidonia Shale from the Hils area, Germany. Int. J. Coal Geol. 2012, 103, 12–25. [Google Scholar] [CrossRef]
  15. Wei, M.; Zhang, L.; Xiong, Y.; Li, J.; Peng, P. Nanopore structure characterization for organic-rich shale using the non-local-density functional theory by a combination of N2 and CO2 adsorption. Microporous Mesoporous Mater. 2016, 227, 88–94. [Google Scholar] [CrossRef]
  16. Zhang, P.; Lu, S.; Li, J. Characterization of pore size distributions of shale oil reservoirs: A case study from Dongying sag, Bohai Bay basin, China. Mar. Pet. Geol. 2019, 100, 297–308. [Google Scholar] [CrossRef]
  17. Nelson, P.H. Pore-throat sizes in sandstones, tight sandstones and shales. AAPG Bull. 2009, 93, 329–340. [Google Scholar] [CrossRef]
  18. Li, J.; Wang, M.; Lu, S.; Liu, L.; Li, M.; Zhang, Y.; Wang, X.; Zhao, X.; Zhang, J.; Zhao, Y. Quantitative evaluation model of shale oil adsorption: A case study of the 1st member of Cretaceous Qingshankou Formation in northern Songliao Basin, NE China. Pet. Explor. Dev. 2023, 50, 1137–1150. [Google Scholar] [CrossRef]
  19. Jiang, F.; Hu, M.; Zhu, T.; Lv, J.; Huang, L.; Liu, C.; Jiang, Z.; Huang, R.; Zhang, C.; Wu, G.; et al. Major controlling factors and model of shale oil enrichment in Lower Permian Fengcheng Formation, Mahu Sag, Junggar Basin, NW China. Pet. Explor. Dev. 2023, 50, 812–825. [Google Scholar] [CrossRef]
  20. Liu, B.; Jiang, X.; Bai, L.; Lu, R. Investigation of oil and water migrations in lacustrine oil shales using 20 MHz 2D NMR relaxometry techniques. Pet. Sci. 2022, 19, 1007–1018. [Google Scholar] [CrossRef]
  21. Wang, Y.; Liang, J.; Zhang, J.; Zhao, B.; Zhao, Y.; Liu, X.; Xia, D. Resource potential and exploration direction of Gulong shale oil in Songliao Basin. Pet. Geol. Oilfield Dev. Daqing 2020, 39, 20–34. [Google Scholar]
  22. Sun, L.; Liu, H.; He, W.; Li, G.; Zhang, S.; Zhu, R.; Jin, X.; Meng, S. An analysis of major scientific problems and research paths of Gulong shale oil in Daqing Oilfield, NE China. Pet. Explor. Dev. 2021, 48, 453–463. [Google Scholar] [CrossRef]
  23. Sun, L.; Zhao, W.; Liu, H.; Zhu, R.; Bai, B.; Kang, Y.; Zhang, J.; Wu, S. Concept and application of “sweet spot” in shale oil. Acta Pet. Sin. 2023, 44, 1–13. [Google Scholar]
  24. Wang, M.; Xue, H.; Tian, S.; Ronald, W.T.; Wang, Z. Fractal characteristics of upper Cretaceous lacustrine shale from the Songliao Basin, NE China. Mar. Pet. Geol. 2015, 67, 144–153. [Google Scholar] [CrossRef]
  25. Zhang, P.; Misch, D.; Hu, F.; Kostoglou, N.; Sachsenhofer, R.F.; Liu, Z.; Meng, Q.; Bechtel, A. Porosity evolution in organic matter-rich shales (Qingshankou Fm.; Songliao Basin, NE China): Implications for shale oil retention. Mar. Pet. Geol. 2021, 130, 105–139. [Google Scholar] [CrossRef]
  26. Liu, B.; Wang, Y.; Tian, S.; Guo, Y.; Wang, L.; Qamar, Y.; Yang, J. Impact of thermal maturity on the diagenesis and porosity of lacustrine oil-prone shales: Insights from natural shale samples with thermal maturation in the oil generation window. Int. J. Coal Geol. 2022, 261, 104–179. [Google Scholar] [CrossRef]
  27. He, W.; Wang, M.; Wang, X.; Meng, Q.; Wu, Y.; Lin, T.; Li, J.; Zhang, J. Pore Structure Characteristics and Affecting Factors of Shale in the First Member of the Qingshankou Formation in the Gulong Sag, Songliao Basin. ACS Omega 2022, 7, 35755–35773. [Google Scholar] [CrossRef] [PubMed]
  28. Wang, X.; Wang, M.; Li, J.; Shao, H.; Deng, Z.; Wu, Y. Thermal maturity: The controlling factor of wettability, pore structure, and oil content in the lacustrine Qingshankou shale, Songliao Basin. J. Pet. Sci. Eng. 2022, 215, 110–618. [Google Scholar] [CrossRef]
  29. Sun, L.; He, W.; Feng, Z.; Zeng, H.; Jiang, H.; Pan, Z. Shale Oil and Gas Generation Process and Pore Fracture System Evolution Mechanisms of the Continental Gulong Shale, Songliao Basin, China. Energy Fuels 2022, 36, 6893–6905. [Google Scholar] [CrossRef]
  30. Zhang, Y.; Pan, H.; Bai, Y.; Chen, G.; Luo, J.; Zhang, Y. Pore Characteristics, Oil Contents and Factors Influencing Laminated Shale in the First Member of the Qingshankou Formation in the Gulong Sag, Northern Songliao Basin. Minerals 2023, 13, 1220. [Google Scholar] [CrossRef]
  31. Li, C.; Pang, X.; Huo, Z.; Wang, E.; Xue, N. A revised method for reconstructing the hydrocarbon generation and expulsion history and evaluating the hydrocarbon resource potential: Example from the first member of the Qingshankou Formation in the Northern Songliao Basin, Northeast China. Mar. Pet. Geol. 2020, 121, 104577. [Google Scholar] [CrossRef]
  32. Bai, L.; Liu, B.; Fu, X.; Hu, Q.; Huo, Q.; Wang, L.; Wang, Q.; Fu, L.; Ostadhassan, M. A new method for evaluating the oil mobility based on the relationship between pore structure and state of oil. Geosci. Front. 2023, 14, 101684. [Google Scholar] [CrossRef]
  33. Wang, M.; Li, M.; Li, J.; Xu, L.; Shao, H.; Yu, C.; Li, T. Comparative analysis of test methods for shale oil content. Acta Pet. Sin. 2022, 43, 1758–1769. [Google Scholar]
  34. Cui, B.; Chen, C.; Lin, X.; Zhao, Y.; Cheng, X.; Zhang, Y.; Lu, G. Characteristics and distribution of sweet spots in Gulong shale oil reserviors of Songliao Basin. Pet. Geol. Oilfield Dev. Daqing 2020, 39, 45–55. [Google Scholar]
  35. Li, Z.; Liu, Y.; He, J.; Sun, Z.; Leng, J.; Li, C.; Jia, M.; Xu, E.; Liu, P.; Li, M.; et al. Limits of critical parameters for sweet-spot interval evaluation of lacustrine shale oil. Oil Gas Geol. 2023, 44, 1453–1467. [Google Scholar]
  36. Wang, P.J.; Mattern, F.; Didenko, N.A.; Zhu, D.F.; Singer, B.; Sun, X.M. Tectonics and cycle system of the Cretaceous Songliao Basin: An inverted active continental margin basin. Earth Sci. Rev 2016, 159, 82–102. [Google Scholar] [CrossRef]
  37. Yuan, X.; Zhou, H.; Zhang, Z.; Wang, Z.; Cheng, D.; Guo, H.; Zhang, Y.; Dong, W. Depositional features and growth pattern of large shallow-water deltas in depression basin. Lithol. Reserv. 2021, 33, 1–11. [Google Scholar]
  38. Rafieepour, S.; Zheng, D.; Miska, S.; Ozbayoglu, E.; Takach, N.; Yu, M.; Zhang, J. Combined experimental and Well log evaluation of anisotropic mechanical properties of shales: An application to wellbore stability in Bakken Formation. In Proceedings of the SPE Annual Technical Conference and Exhibition, Virtual, 26–29 October 2020. [Google Scholar] [CrossRef]
  39. Zheng, D.; Ozbayoglu, E.; Miska, S.; Zhang, J. Experimental study of Anisotropic strength properties of Shale. In Proceedings of the ARMA 23241 at the 57th US Rock Mechanics/Geomechanics Symposium, Atlanta, GA, USA, 23–26 June 2023. [Google Scholar]
  40. Zhang, H.; Wang, X.; Jia, C.; Li, J.; Meng, Q.; Jiang, L.; Wang, Y.; Bai, X.; Zheng, Q. Whole petroleum system and hydrocarbon accumulation model in shallow and medium strata in northern Songliao Basin, NE China. Pet. Explor. Dev. 2023, 50, 784–797. [Google Scholar] [CrossRef]
  41. Li, S.C.; Zhang, J.; Gong, F.; Zhu, H.; Bai, Y. The characteristics of mudstones of Upper Cretaceous Qingshankou Formation and favorable area optimization of shale oil in the north of Songliao Basin. Geol. Bull. China 2017, 36, 654–663. [Google Scholar]
  42. Lafargue, E.; Marquis, F.; Pillot, D. Rock-Eval 6 applications in hydrocarbon exploration, production, and soil contamination studies. Oil Gas Sci. Technol. 1998, 53, 421–437. [Google Scholar] [CrossRef]
  43. Behar, F.; Beaumont, V.; Penteado, H.L.; De, B. Rock-Eval 6 technology: Performances and developments. Oil Gas Sci. Technol. 2001, 56, 111–134. [Google Scholar] [CrossRef]
  44. Carvajal-Ortiz, H.; Gentzis, T. Critical considerations when assessing hydrocarbon plays using Rock-Eval pyrolysis and organic petrology data: Data quality revisited. Int. J. Coal Geol 2015, 152, 113–122. [Google Scholar] [CrossRef]
  45. National Energy Administration. Method of Determining Microscopically the Reflectance of Vitrinite in Sedimentary (SY/T 5124—2012); Petroleum Industry Press: Beijing, China, 2012. [Google Scholar]
  46. Schimmelmann, A.; Lewan, M.M.; Wintsch, R.P. D/H isotope ratios of kerogen, bitumen, oil, and water in hydrous pyrolysis of source rocks containing kerogen types I, II, IIS, and III. Geochim. Cosmochim. Acta 1999, 63, 3751–3766. [Google Scholar] [CrossRef]
  47. SY/T 5735—1995; Geochemical Evaluation Method of Continental Source Rocks. Standards Press of China: Beijing, China, 1995; China National Petroleum Corporation.
  48. Huo, Q.; Zeng, H.; Zhang, X.; Fu, L.; Wang, Y.; Chang, L.; Qiao, Y. Organic matter characteristics and shale oil formation of Gulong shale in Songliao Basin. Pet. Geol. Oilfield Dev. Daqing 2020, 39, 86–96. [Google Scholar]
  49. Tissot, B.P.; Welte, D.H. Petroleum Formation and Occurrence: A New Approach to Oil and Gas Exploration; Springer: Berlin/Heidelberg, Germany; New York, NY, USA, 1978. [Google Scholar]
  50. Langford, F.F.; Blanc-Valleron, M.M. Interpreting Rock-Eval pyrolysis data using graphs of pyrolizable hydrocarbons vs. Total Organic Carbon. AAPG Bull. 1990, 74, 799–804. [Google Scholar]
  51. Farouk, S.; Saada, S.A.; Fagelnour, M.S.; Arafat, M. Petrophysical and Gas Chromatographic Analysis Integration for Hydrocarbon Identifications in Cretaceous Reservoirs, Azhar Field, Beni Suef Basin, Egypt. Egypt. J. Pet. 2024, 33, 7. [Google Scholar] [CrossRef]
  52. Cornford, C.; Gardner, P.; Burgess, C. Geochemical truths in large data sets I: Geochemical screening data. Org. Geochem. 1998, 29, 519–530. [Google Scholar] [CrossRef]
  53. Stahl, W.J. Carbon and nitrogen isotopes in hydrocarbon research and exploration. Chem. Geol. 1977, 20, 121–130. [Google Scholar] [CrossRef]
  54. Huang, D.; Li, J.; Zhang, D. Kerogen types and study on effectiveness limitation and interrelation of their identification parameters. Acta Sedimentol. Sin. 1984, 2, 18–34. [Google Scholar]
  55. Huang, F.; Xin, M. Geochemical Evaluation Method of Nonmarine Source Rocks; China National Petroleum Corporation: Beijing, China, 1995. [Google Scholar]
  56. Xiong, Y.; Zhang, H.; Geng, A. Variation of carbon isotopic composition of kerogen during thermal evolution. Pet. Geol. Exp. 2004, 26, 484–487. [Google Scholar]
  57. Farouk, S.; Khairy, A.; Shehata, A.M.; Uguna, C.N.; El Sheennawy, T.; Salama, A.; Meredith, W. Geochemical evaluation and hydrocarbon generation potential of the upper Cretaceous–Pliocene succession, offshore Nile Delta, Egypt. J. Afr. Earth Sci. 2023, 205, 105004. [Google Scholar] [CrossRef]
  58. Shanmugam, G. Significance of coniferous rain forests and related organic matter in generating commercial quantities of oil, Gippsland Basin, Australia. AAPG Bull. 1985, 69, 1241–1254. [Google Scholar] [CrossRef]
  59. Tissot, B.P.; Durand, B.; Espitalie, J.; Combaz, A. Influence of the nature and diagenesis of organic matter in formation of petroleum. AAPG Bull. 1974, 58, 499–506. [Google Scholar]
  60. Yang, S.Y.; Horsfield, B. Critical review of the uncertainty of Tmax in revealing the thermal maturity of organic matter in sedimentary rocks. Int. J. Coal Geol. 2020, 225, 103500. [Google Scholar] [CrossRef]
  61. Katz, B.J.; Lin, F. Consideration of the limitations of thermal maturity with respect to vitrinite reflectance, Tmax, and other proxies. AAPG Bull. 2021, 105, 695–720. [Google Scholar] [CrossRef]
  62. Zhang, S.; Zhang, B.; Wang, X.; Feng, Z.; He, K.; Wang, H.; Fu, X.; Liu, Y.; Yang, C. Gulong shale oil enrichment mechanism and orderly distribution of conventional–unconventional oils in Qingshankou Formation, Songliao Basin, NE China. Pet. Explor. Dev. 2023, 50, 1045–1059. [Google Scholar] [CrossRef]
  63. Bordenave, M.L. Applied Petroleum Geochemistry; Techniq: Paris, France, 1993; pp. 1–524. [Google Scholar]
  64. Chen, J.; Pang, X.; Pang, H. Hydrocarbon evaporative loss evaluation of lacustrine shale oil based on massbalance method: Permian Lucaogou Formation in Jimusaer Depression, Junggar Basin. Mar. Pet. Geol. 2018, 91, 422–431. [Google Scholar] [CrossRef]
  65. Chen, Z.; Li, M.; Jiang, C. Shale oil resource potential and its mobility assessment: A case study of Upper Devonian Duvernay shale in Western Canada Sedimentary Basin. Oil Gas Geol. 2019, 40, 459–468. [Google Scholar]
  66. Zhu, R.; Zhang, L.; Li, J.; Liu, Q.; Li, Z.; Wang, R.; Zhang, L. Quantitative evaluation of residual liquid hydrocarbons in shale. Acta Pet. Sin. 2015, 36, 13–18. [Google Scholar]
  67. Jiang, C.; Chen, Z.; Mort, A.; Milovic, M.; Robinson, R.; Stewart, R.; Lavoie, D. Hydrocarbon evaporative loss from shale core samples as revealed by Rock-Evaland thermal desorption-gas chromatography analysis: Its geochemical and geological implications. Mar. Pet. Geol. 2016, 70, 294–303. [Google Scholar] [CrossRef]
  68. Qian, M.; Li, M.; Jiang, Q.; Li, Z.; Tao, G.; Bao, Y. Evaluation of evaporative loss of hydrocarbon in shale samples and its geological implications. Pet. Geol. Exp. 2022, 44, 497–514. [Google Scholar]
  69. Gao, B.; He, W.; Feng, Z.; Shao, H.; Zhang, A.; Pan, H.; Chen, G. Lithology, physical property, oil-bearing property and their controlling factors of Gulong shale in Songliao Basin. Pet. Geol. Oilfield Dev. Daqing 2022, 41, 68–79. [Google Scholar]
  70. Xue, H.; Tian, S.; Wang, W.; Zhang, W.; Du, T.; Mu, G. Correction of oil content—One key parameter in shale oil resource assessment. Oil Gas Geol. 2016, 37, 15–22. [Google Scholar]
  71. Clementz, D.M. Effect of oil and bitumen saturation on source-rock pyrolysis. Am. Assoc. Pet. Geol. Bull. 1979, 63, 12. [Google Scholar]
  72. Li, M.; Chen, Z.; Qian, M.; Jiang, Q.; Li, Z.; Tao, G.; Wu, S. What are in pyrolysis S1 peak and what are missed? Petroleum compositional characteristics revealed from programed pyrolysis and implications for shale oil mobility and resource potential. Int. J. Coal Geol. 2020, 217, 103321. [Google Scholar] [CrossRef]
  73. Zhang, L.; Bao, Y.; Li, J.; Li, Z.; Zhu, R.; Zhang, L.; Wang, Y. Hydrocarbon and crude oil adsorption abilities of minerals and kerogens in lacustrine shales. Pet. Geol. Exp. 2015, 37, 776–780. [Google Scholar]
  74. Delvaux, D.; Martin, H.; Leplat, P.; Paulet, J. Comparative Rock-Eval pyrolysis as an improved tool for sedimentary organic matter analysis. Org. Geochem. 1990, 16, 1221–1229. [Google Scholar] [CrossRef]
  75. Han, Y.; Mahlstedt, N.; Horsfield, B. The Barnett Shale: Compositional fractionation associated with intraformational petroleum migration, retention, and expulsion. AAPG Bull. 2015, 99, 2173–2202. [Google Scholar] [CrossRef]
  76. Zink, K.G.; Scheeder, G.; Stueck, H.L. Total shale oil inventory from an extended Rock-Eval approach on non-extracted and extracted source rocks from Germany. Int. J. Coal Geol. 2016, 163, 186–194. [Google Scholar] [CrossRef]
  77. Romero-Sarmiento, M.F. A quick analytical approach to estimate both free versus sorbed hydrocarbon contents in liquid rich source rocks. AAPG Bull. 2019, 103, 2031–2043. [Google Scholar] [CrossRef]
  78. Li, M.; Chen, Z.; Ma, X. Shale oil resource potential and oil mobility characteristics of the Eocene-Oligocene Shahejie Formation, Jiyang Super-Depression, Bohai Bay Basin of China. Int. J. Coal Geol. 2019, 204, 130–143. [Google Scholar] [CrossRef]
  79. Jarvie, D.M. Shale resource systems for oil and gas: Part 2—Shale-oil resource systems. In Shale Reservoirs—Giant Resources for the 21st Century; Breyer, J.A., Ed.; AAPG Memoir 97: Tulsa, OK, USA, 2012; Volume 97, pp. 89–119. [Google Scholar]
  80. Michael, G.E.; Packwood, J.; Holba, A. Determination of in-situ hydrocarbon volumes in liquid rich shale plays. In Proceedings of the Unconventional Resources Technology Conference, Denver, CO, USA, 12–14 August 2013. [Google Scholar]
  81. Jiang, Q.; Li, M.; Qian, M. Quantitative characterization of shale oil in different occurrence state and its application. Pet. Geol. Exp. 2016, 38, 842–849. [Google Scholar]
  82. Gorynski, K.E.; Tobey, M.H.; Enriquez, D.A. Quantification and characterization of hydrocarbon-filled porosity in oil-rich shales using integrated thermal extraction, pyrolysis, and solvent extraction. AAPG Bull. 2019, 103, 723–744. [Google Scholar] [CrossRef]
  83. Sun, L.; Cui, B.; Zhu, R. Shale oil enrichment evaluation and production law in Gulong Sag, Songliao Basin, NE China. Pet. Explor. Dev. 2023, 50, 441–454. [Google Scholar] [CrossRef]
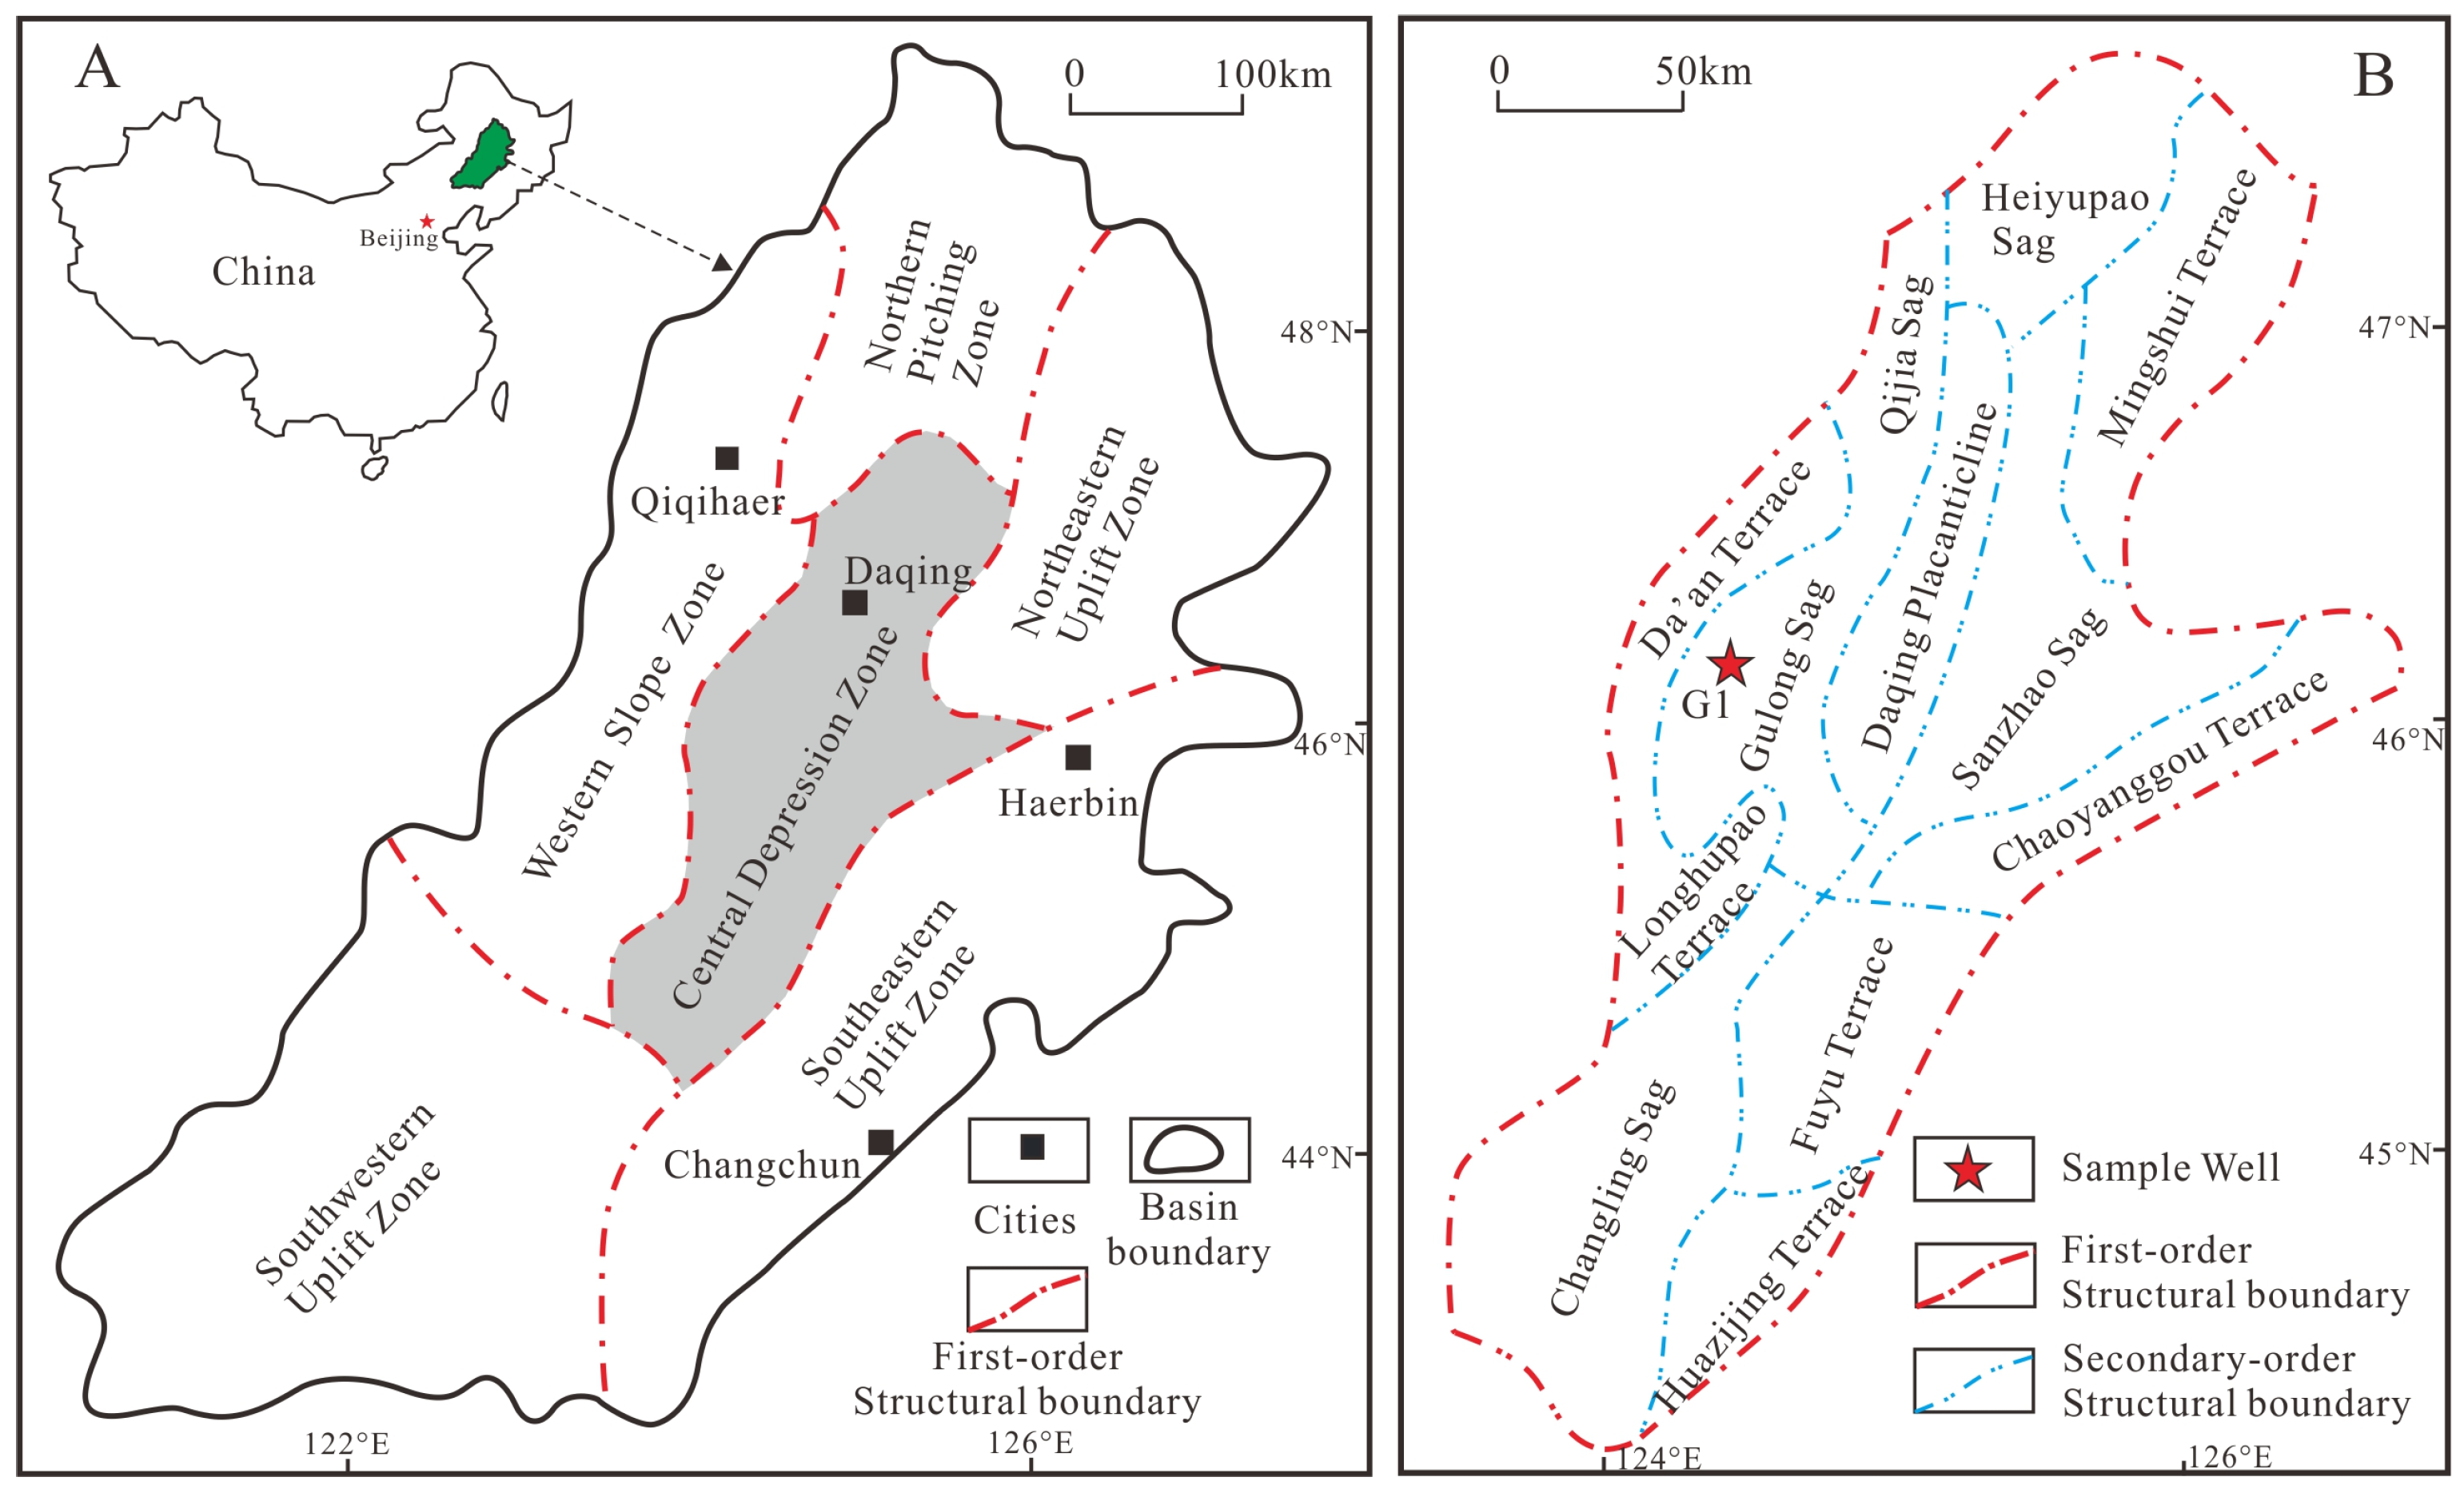
Figure 1. Location and tectonic units of the Songliao Basin (A). Division of the secondary-order tectonic units and location of well G1 in the Gulong Sag (B).
Energies 17 02877 g001
Figure 2. Simplified stratigraphic column of the Gulong Sag, Songliao Basin (modified from [22,27]).
Energies 17 02877 g002
Figure 3. Depth profile of the shale pyrolytic geochemistry in the G1 well of the Qingshankou Formation, Gulong Sag, Songliao Basin.
Energies 17 02877 g003
Figure 4. Relationship between the TOC and the PG of shale of the G1 well, Qingshankou Formation, Gulong Sag, Songliao Basin (modified from [45]).
Energies 17 02877 g004
Figure 5. Relationship between the O/C atomic ratio and the H/C atomic ratio of shale in the G1 well, Qingshankou Formation, Gulong Sag, Songliao Basin (modified from [48]).
Energies 17 02877 g005
Figure 6. Relationship between the TOC and S2 of the Qingshankou Formation shale in the G1 well, Gulong Sag, Songliao Basin (modified from [50]).
Energies 17 02877 g006
Figure 7. Variations in δ13C, with burial depth in the Qingshankou Formation shale of the G1 well in the Gulong Sag, Songliao Basin.
Energies 17 02877 g007
Figure 8. Intersection diagram of Pr/nC17 and Ph/nC18 of Qingshankou Formation shale in the G1 well, Gulong Sag, Songliao Basin.
Energies 17 02877 g008
Figure 9. (A) in the relationship between Ro and depth; (B) The relationship between Tmax and depth; (C) Pyrolysis spectra of chloroform after and before extraction.
Energies 17 02877 g009
Figure 11. Relationship between coring pyrolysis S1 under pressure and conventional pyrolysis.
Energies 17 02877 g011
Figure 12. Relationship between chloroform asphalt “A” and conventional pyrolysis S1 in the Qingshankou Formation shale of the G1 well.
Energies 17 02877 g012
Figure 13. Comparison of the saturated hydrocarbon chromatography of chloroform extracts from the Qingshankou Formation shale in the G1 well with the total hydrocarbon chromatography of oil in the production layer.
Energies 17 02877 g013
Figure 14. Standard chart of shale desert parameter evaluation of the Qingshankou Formation in the G1 well. (A) Correlation map of TOC and HI; (B) Correlation map of TOC and mobile hydrocarbon; (C) Correlation map of TOC and OSI.
Energies 17 02877 g014
Figure 15. Comprehensive evaluation map of the shale desert in the G1 well, Qingshankou Formation, Gulong Sag.
Energies 17 02877 g015
Disclaimer/Publisher’s Note: The statements, opinions and data contained in all publications are solely those of the individual author(s) and contributor(s) and not of MDPI and/or the editor(s). MDPI and/or the editor(s) disclaim responsibility for any injury to people or property resulting from any ideas, methods, instructions or products referred to in the content.