1. Introduction
Conventional energy based on coal as an energy resource is increasingly losing its importance and should be replaced with energy based on ecological and renewable energy sources. However, its share in the overall global energy generated is significant and will remain at a high level during the energy transition. In 2022, Poland’s share totaled 69%. In the same year, globally, the share of coal in energy production decreased but was still considered high at 35.6% [
1]. Changes in the energy sector in different countries are taking place at varied rates depending on the technical and economic conditions. Hence, old conventional power plants will probably be in operation for many years, and problems related to their safety and durability will remain relevant.
Ensuring the safe use of conventional power units is related to the use of materials with properties that enable the transfer of high mechanical and thermal loads. These include, among others, ferritic steels P91 and P92, which are used for the production of high-pressure apparatus, including steam pipelines and their shaped elements—tee pipes, Y junctions, and four-junction pipes or superheater headers. The impact of high, time-varying temperatures and pressures on these elements causes creep and fatigue phenomena, which, over time, can lead to permanent deformations and damage that pose a threat to the maintenance of the power plant and determine the durability of the equipment. The technical condition of these elements is usually monitored during operational processes, and any damage is removed on an ongoing basis. The methods for predicting the behavior of the material under conditions of mechanical and thermal interactions are helpful tools in the diagnostics of the technical condition of the devices under consideration, and they enable the analysis of the course of the deformation processes of the elements. These methods are based on the results of laboratory tests of the material from which the elements were made. These methods assess the intensity of the damage processes based on the analysis of the strains and stresses occurring inside them caused by temperature and mechanical loads.
Numerous reports have investigated the creep behavior of steels operating under elevated temperature and mechanical loading, including creep tests of P91 and P92 steels. The technical literature deals with this problem in general or in a specific manner.
For example, Ref. [
2] studied P92 steel at a temperature of 700 °C, where the creep behavior of the steel was studied in relation to stress ranging from 75 to 150 MPa. They presented test charts and determined the parameters of Norton’s power law. Additionally, the parameters for a generalized and modified Monkman–Grant relation were calculated between the minimum creep rate and rapture life. This was accompanied by structural analyses of the fracture surfaces. Ref. [
3] investigated the P92 steel grade’s mechanical and creep behavior in relation to prior short-term aging. The possible effects of overheating at the beginning of long-term operation were studied. The steel was aged at a temperature of 650 °C for up to 100, 200, 500, 1000, 2000, and 5000 h, before it was tested. The authors found that aging had little influence on the tensile properties at ambient temperature. The creep properties were studied for the as-received conditions and the conditions after isothermal aging at temperatures of 600 and 650 °C, within the power law creep period. Tensile stress in the range of 90 to 200 MPa was applied and revealed the substantial influence of isothermal aging on creep properties even after short periods of aging. It was found that the observed decrease in the creep life with aging was related to changes in the dislocation substructure and its instability.
Many studies have examined the phenomenon of the fatigue of the aforementioned steels, taking into account the influence of elevated temperature. Ref. [
4] presented an outcome of low-cycle fatigue (LCF) testing of P91 and P92 steel grades. The authors conducted total axial strain-controlled tests with a constant strain rate of 3 × 10
−3 1/s and values of strain ranging from ±0.25% to ±0.6%. The temperature of these tests was between 550 and 600 °C. Additionally, they found a continuous softening behavior. P92 steel resulted in a lower stress response compared to the P91 grade. However, when the strain amplitudes were lower, P92 steel had a higher stress response. The softening rate of P92 steel increased with strain amplitude, which was in contrast to P91. Regarding fatigue lives, the studied grades proved to have no relation. Ref. [
5] focused on low-cycle fatigue (LCF) tests for P92 steel, carried out at both room temperature and an elevated temperature of 600 °C. The tests showed that P92 steel had softening characteristics during fatigue at both temperatures. The authors concluded that increased temperature and strain amplitude led to reduced uni-axial fatigue life. The specimens before and after the fatigue tests were analyzed by transmission electron microscope, coupled with energy-dispersive X-ray spectroscopy and selected area electron diffraction. These analyses proved that cyclic softening was caused by the annihilation of dislocations, along with fragmentation and polygonization of the lath structure. This study succeeded in describing the evolution of the microstructure of P92 steel during the low-cycle fatigue process.
The ductile to brittle fracture transition temperature is an important feature of steels working under mechanical and thermal loading in power plants. Interestingly, ref. [
6] analyzed steel grade P92 and its predecessor P91 are used in nuclear power plants. This application led to irradiation, which can cause a lowering of the ductile to brittle fracture transition temperature. The basic Charpy toughness testing was conducted and monitored by field electron scanning microscopy (FESEM). Consequently, even at room temperature, the brittle fracture that occurred mixed with the ductile one, whereas, at lower temperatures, the brittle fracture was dominant.
Recently, many papers have dealt with more and more sophisticated tests, including fatigue, creep, and relaxation tests conducted with specimens of the material to determine the failure criteria and to link them with structural changes. Sometimes, the specimens to be studied are cut out of the welded joints, which is crucial for maintenance purposes. Nowadays, attempts to mimic multi-axial loading are studied as well. In certain cases, a particular constituent part is tested, because its shape can significantly influence the stress and strain field, and the only way to analyze its failure is to test a genuine part or its scaled replica.
Chang et al. [
7] presented a detailed analysis of the thermo-mechanical fatigue of P92 steel grade, aiming to study how temperature, dwell time, and mechanical load affected the fatigue life of the studied steel. Testing occurred at a temperature ranging from 350 to 650 °C, where the material’s life decreased with the increase in the average temperature of the in-phase, out-of-phase, and isothermal fatigue tests. The short dwell periods affected the lifetime, depending on the dwell itself. Tensile dwell lowered the lifetime for the in-phase tests, whereas symmetric dwell promoted an increase. In-phase thermo-mechanical fatigue testing proved the existence of stress relaxation and dynamic strain aging. While the dwell enhanced creep stress relaxation, dynamic stress aging was restrained. In this way, the latter caused increased fatigue resistance. The study also examined fracture development. Symmetric dwell diminished crack propagation by blunting the crack tip. This was linked to the combined action of accelerated creep stress relaxation and weakening dynamic stress aging. The structural investigation showed that deformation was controlled by transforming lath structures into substructures. Additionally, equi-axial sub-grain growth increased with the strain amplitude and dwell period. Finally, the authors applied current life evaluation models, namely Coffin–Mason–Basquin, energy, and Ostergren, under both isothermal and thermo-mechanical fatigue tests. These results were inadequate; hence, they attempted to modify the Coffin–Mason model by considering the mean and maximum stress and the temperature limits in the power law forms.
Guo et al. [
8] studied P92 welds under thermo-mechanical fatigue conditions at a temperature ranging from 550 to 650 °C. Interestingly, the study covered isothermal, in-phase, and opposite-phase cases, as well as in-phase cases with a 90° shift. They found that the joints were described by ongoing softening and that the fatigue life depended on the amplitude of the strain and the phase angle. The fatigue life increased when the strain amplitude lowered, and the phase angle grew. Similarly, Chang [
7] confirmed that fracture occurred in different places, depending on the strain amplitude phase angle. They compared the simplified energy model, Ostergren model, traditional energy model, and modified energy model. Consequently, the most sophisticated model, namely the modified energy model was proposed by considering the mean stress and phase angle.
Song et al. [
9] analyzed the creep and fatigue relationships of the weld joints of P92 steel grade at a temperature of 650 °C. They considered different dwell times for compressive and tensile loads and different means and amplitudes of strain. A modern method of nanoindentation was implemented to determine the local mechanical properties, such as hardness, elastic modulus, and creep resistance. A proper fractography was used to examine morphology and internal defects. Strain rate insensitivity, expressed by dislocation density, was determined and discussed to reveal the creep mechanism. Hence, they linked the type of applied load with the fracture mechanism of the weld joints.
Mao et al. [
10] described the creep–fatigue tests of P92 steel at a temperature range of 550 to 650 °C. The research showed how temperature, load holding time, and pre-fatigue affected damage, and the results were presented quantitatively. The authors confirmed that the load holding time affected the stress relaxation behavior and pre-fatigue damage occurring at the initial stage of the cycle stress response, reducing the stable stage period. Several damage models were implemented, and their results compared the linear cumulative, strain range division model, and strain energy density exhaustion. It was highlighted that the strain energy density exhaustion proved to have been more accurate than the others, although the others were also accurate. Furthermore, the microstructure of the specimen and fracture pre- and post-test was observed to explain the damage evolution mechanism of the creep–fatigue interaction. The broad microstructure analysis revealed that the tempered martensite was in a lath shape, and several carbides were dispersed at the grain boundary. These carbides reduced the mechanical properties; because of their poor thermal stability, they coarsen and connect after creep. Additionally, short-term load holding led to fatigue fracture damage, and long-term load holding promoted creep fracture damage.
The creep–fatigue behavior of welds of P92 steel was analyzed by Zhang et al. [
11], where they compared the creep lifetime for “pure” creep, and the creep after low-cycle fatigue at 650 °C. The prior LCF was stepped by 10% of the number of failure cycles, as determined by LCF testing alone. It was concluded that the remaining creep lifetime was reduced by the fatigue period to a great extent. Yet, the ductility of the creep increased. The influence of the LCF on creep was determined for both the weld and base material. Proper fractography analysis was conducted, and the location of the found creep rapture depended on the number of cycles of LCF, before the creep. Qualitatively, and eventually quantitatively, the authors assessed the processes using a proposed fatigue damage indicator, ranging from 0 to 1, and related with the observed remaining creep life and creep rapture strain. Hence, it was possible to characterize the studied phenomenon.
Recently, Gao et al. [
12] researched the loading from uni-axial to multi-axial, mimicking the material’s real operation. The authors performed multi-axial fatigue tests of P92 steel grade for a set of stress amplitudes and ratios at a temperature of 600 °C. The microstructure and dynamic stress aging were examined to describe the cyclic deformation and eventual damage. Its outcome confirmed the relation between the increasing strain amplitudes and ratios that promoted cyclic softening. Additionally, the strain amplitude, ratio, and loading direction influenced the dynamic stress of the aging. Regarding the microstructure, the bigger the stress amplitude, the more intense growth of sub-grains and transforming dislocations was observed. The authors showed that increasing the ratio of strain accelerated planar slip dislocation. The fracture mode of the steel was observed as I and II, depending on torsional plasticity. When it was dominant, the fracture was mainly mode II, and the cleavage surface was more broken; however, when the torsional plasticity was weak, the fracture was more likely to be from uni-axial loading, and mode I was detected.
Attempts to suggest proper and precise durability criteria for materials under mechanical and thermal loadings have been made for years. There are new studies modifying previously known criteria or proposing new approaches to the issue of determining durability in creep or fatigue conditions.
For example, Barat et al. [
13] described inelastic strain rate methodology based on tests of nickel superalloys, namely Haynes 282 and IN 718. The authors highlighted the evolution of differential strain rates during creep and fatigue. They utilized a relative rate of strain accumulation and derived a relative rate of interaction, which was presented in charts.
There are examples of efforts to assess the failure of a specific part of power plants, where a material specimen is not required. Kim et al. [
14] showed that the seismic activity may produce a large displacement of piping and other parts. Elbows were chosen as being the most vulnerable to this incident. An 88.9 × 7.62 carbon steel pipe elbow was studied. To produce genuine conditions, pressure was applied inside the tube, whereas the part was fatigue tested with in-plain cyclic bending, with displacement control ranging from ±10 to ±80 mm. These tests led to the determination of several failure cycles. Interestingly, the leakage, which defined the failure, was identified by optical surveillance and image analysis. The authors proposed and implemented a damage index, which was defined by dissipated energy due to angular deformation of the part.
This topic was continued by the same research group in 2023 [
15], where they analyzed failure, depicted by leakage. They highlighted that the component fails when subjected to cyclic loads, such as earthquakes, because of low-cycle fatigue in conjunction with ratcheting. Therefore, steel pipe elbows in piping systems should exhibit sufficient strength, ductility, and energy dissipation capacity characteristics to withstand seismic loads. Different failure-assessing models were analyzed, namely the cumulative plastic deformation index, cumulative work index, energy dissipation index, cumulative energy reduction index, Park and Ang index, and Ban index. SCH40 steel pipe elbows were tested and were again made with 88.9 × 7.62 carbon steel. Displacement control ranging from ±20 to ±100 mm was implemented. The relationship between an applied force and measured displacement proved to be linear. The authors concluded that the Banon index could determine the failure–leakage moment caused by fatigue cracking.
Numerous studies have examined the operating parameters of power boilers; yet, the considered technological parameters are rarely linked to the stress and strain of the solid constituent parts of the power plant structure. To model and simulate the strength of these parts, with regard to their life and durability, mechanical engineers and designers require such data. One of the few works in this field is by Yang et al. [
16], where they simulated an entire boiler with a capacity of 500 MW. The heat transfer parameters used in the simulation were of considerable interest. In the case of superheaters and re-heaters, the overall heat transfer coefficients were assumed to be 3000 W/m
2K, whereas the water wall’s coefficients were equal to 500 W/m
2K. In this case, they considered the steam convection and tube conduction without the combustion gas convection and radiation.
Asefinejad et al. [
17] investigated a gas-fired, subcritical power plant, where they focused on the issue of the two-phase heat transfer from the combustion gas through the water wall tubes to water, evaporating along the height of the water walls. Although the study did not consider coal-fired super-critical boilers, certain investigated parameters were interesting. The critical heat flux is when the fluid film disappears, and the only steam as water vapor reduces the conveyed heat, leading to overheating of the tubes and fast material damage. The water walls were made with 31 m long tubes, with an outside diameter of 63.6 mm and a 4.9 mm thick wall. The determined critical heat flux value was 30 for a normal operation to 80 kW/m
2K under some conditions. These values may serve as limits for the numerical simulation of stress–strain fields.
Zhang et al. [
18] described an entirely automatic point of view for a boiler, particularly a drum. The operating parameters were converted into variables of a coordinated control system.
Recently, Madejski et al. [
19] examined fluidized-bed boilers, where the operating parameters differed from those in pulverized coal-fired boilers. However, some parameters describing heat transfer were shown and could be used for numerical modeling of the stress–strain fields. As the average heat transfer coefficients varied around 200 W/m
2K, the coefficients from the steam to the tube walls increased to 2000 W/m
2K during the first 100 min of the start-up.
Taler et al. [
20] examined the modern problem of cooperation between power boilers, solar panels, and wind turbines. The authors studied the thick-walled parts of boilers with regard to possible high thermal stress caused by fast start-ups, e.g., approx. 100 min for boiler drums in the case of a start from a cold state.
The authors of this manuscript numerically studied and published papers devoted to parts of conventional, coal-fired power plants regarding their stress–strain response to start-up and shut-down operating procedures [
21,
22,
23]. FEM analyses, along with heat transfer modeling, enabled incorporated material properties, which, in the function of operating temperature, allowed one to mimic the genuine conditions of the parts. The parts under consideration were the Y-junction of pipes, the elbows, and a drum.
Due to the nature of the damage formation phenomena in the elements of power installations subjected to the influence of temperature that varies over time, causing thermal stresses, modeling using computer methods seems to be one of the basic methods of analyzing the mechanical determinants of these phenomena. At the same time, regardless of the necessity to maintain limited confidence in the accuracy of the analytical or computer calculation methods used in this case, their application to the description of the behavior of elements subjected to mechanical and thermal loads is hindered by several difficulties related to the characteristics of the effects to which they are subjected in the operating conditions. The analysis of the fatigue process occurring for the modeling methods required the use of several material characteristics, which, in most cases, are difficult to access. To determine these characteristics, it is necessary to use unconventional laboratory test methods.
Therefore, to develop a methodology for the strength assessment of the elements under consideration, it is necessary to use a mutually complementary approach:
Fatigue tests carried out under conditions similar to those occurring during operational procedures;
Tests carried out under industrial conditions, the results of which provide information on the magnitude of external impacts and constitute the basis for defining the boundary conditions for the calculation of temperature, stress, and strain distributions;
Modeling with the use of computational methods, enabling the determination of physical fields that change over time and determine the intensity of damage processes.
A current attempt to present a uniform approach to the issue of the strength evaluation of pressure equipment elements operating under fatigue conditions is the EN 12952-3 standard used by designers [
24]. In this standard, stress and strains are determined using simplified relationships, and stress accumulations resulting from the complexity of the geometry of the elements are taken into account by introducing form factors, the numerical values of which can be determined from the appropriate nomograms. It should be noted that the relevant relationships in the standard refer to the range of elastic behaviors of the material. Current computational analysis methods provide a significant improvement in the accuracy obtained using the method described above. This is due to the possibility of using material models that more adequately reflect their actual behavior and are a more accurate representation of the shape of the elements.
Using an approach different from that described in the standard requires an individual approach to each element or group of elements, taking into account the specifics of the conditions of their use. It is necessary to discover the interrelationships between the components of the strength assessment procedure, which depend on the type of device and the material from which it is made. In the presented paper, we capture such interdependencies based on the example of a selected device: a steam superheater header installed in a power block with increased operating parameters made of P92 steel.
2. Low-Cycle and Thermo-Mechanical Fatigue Study
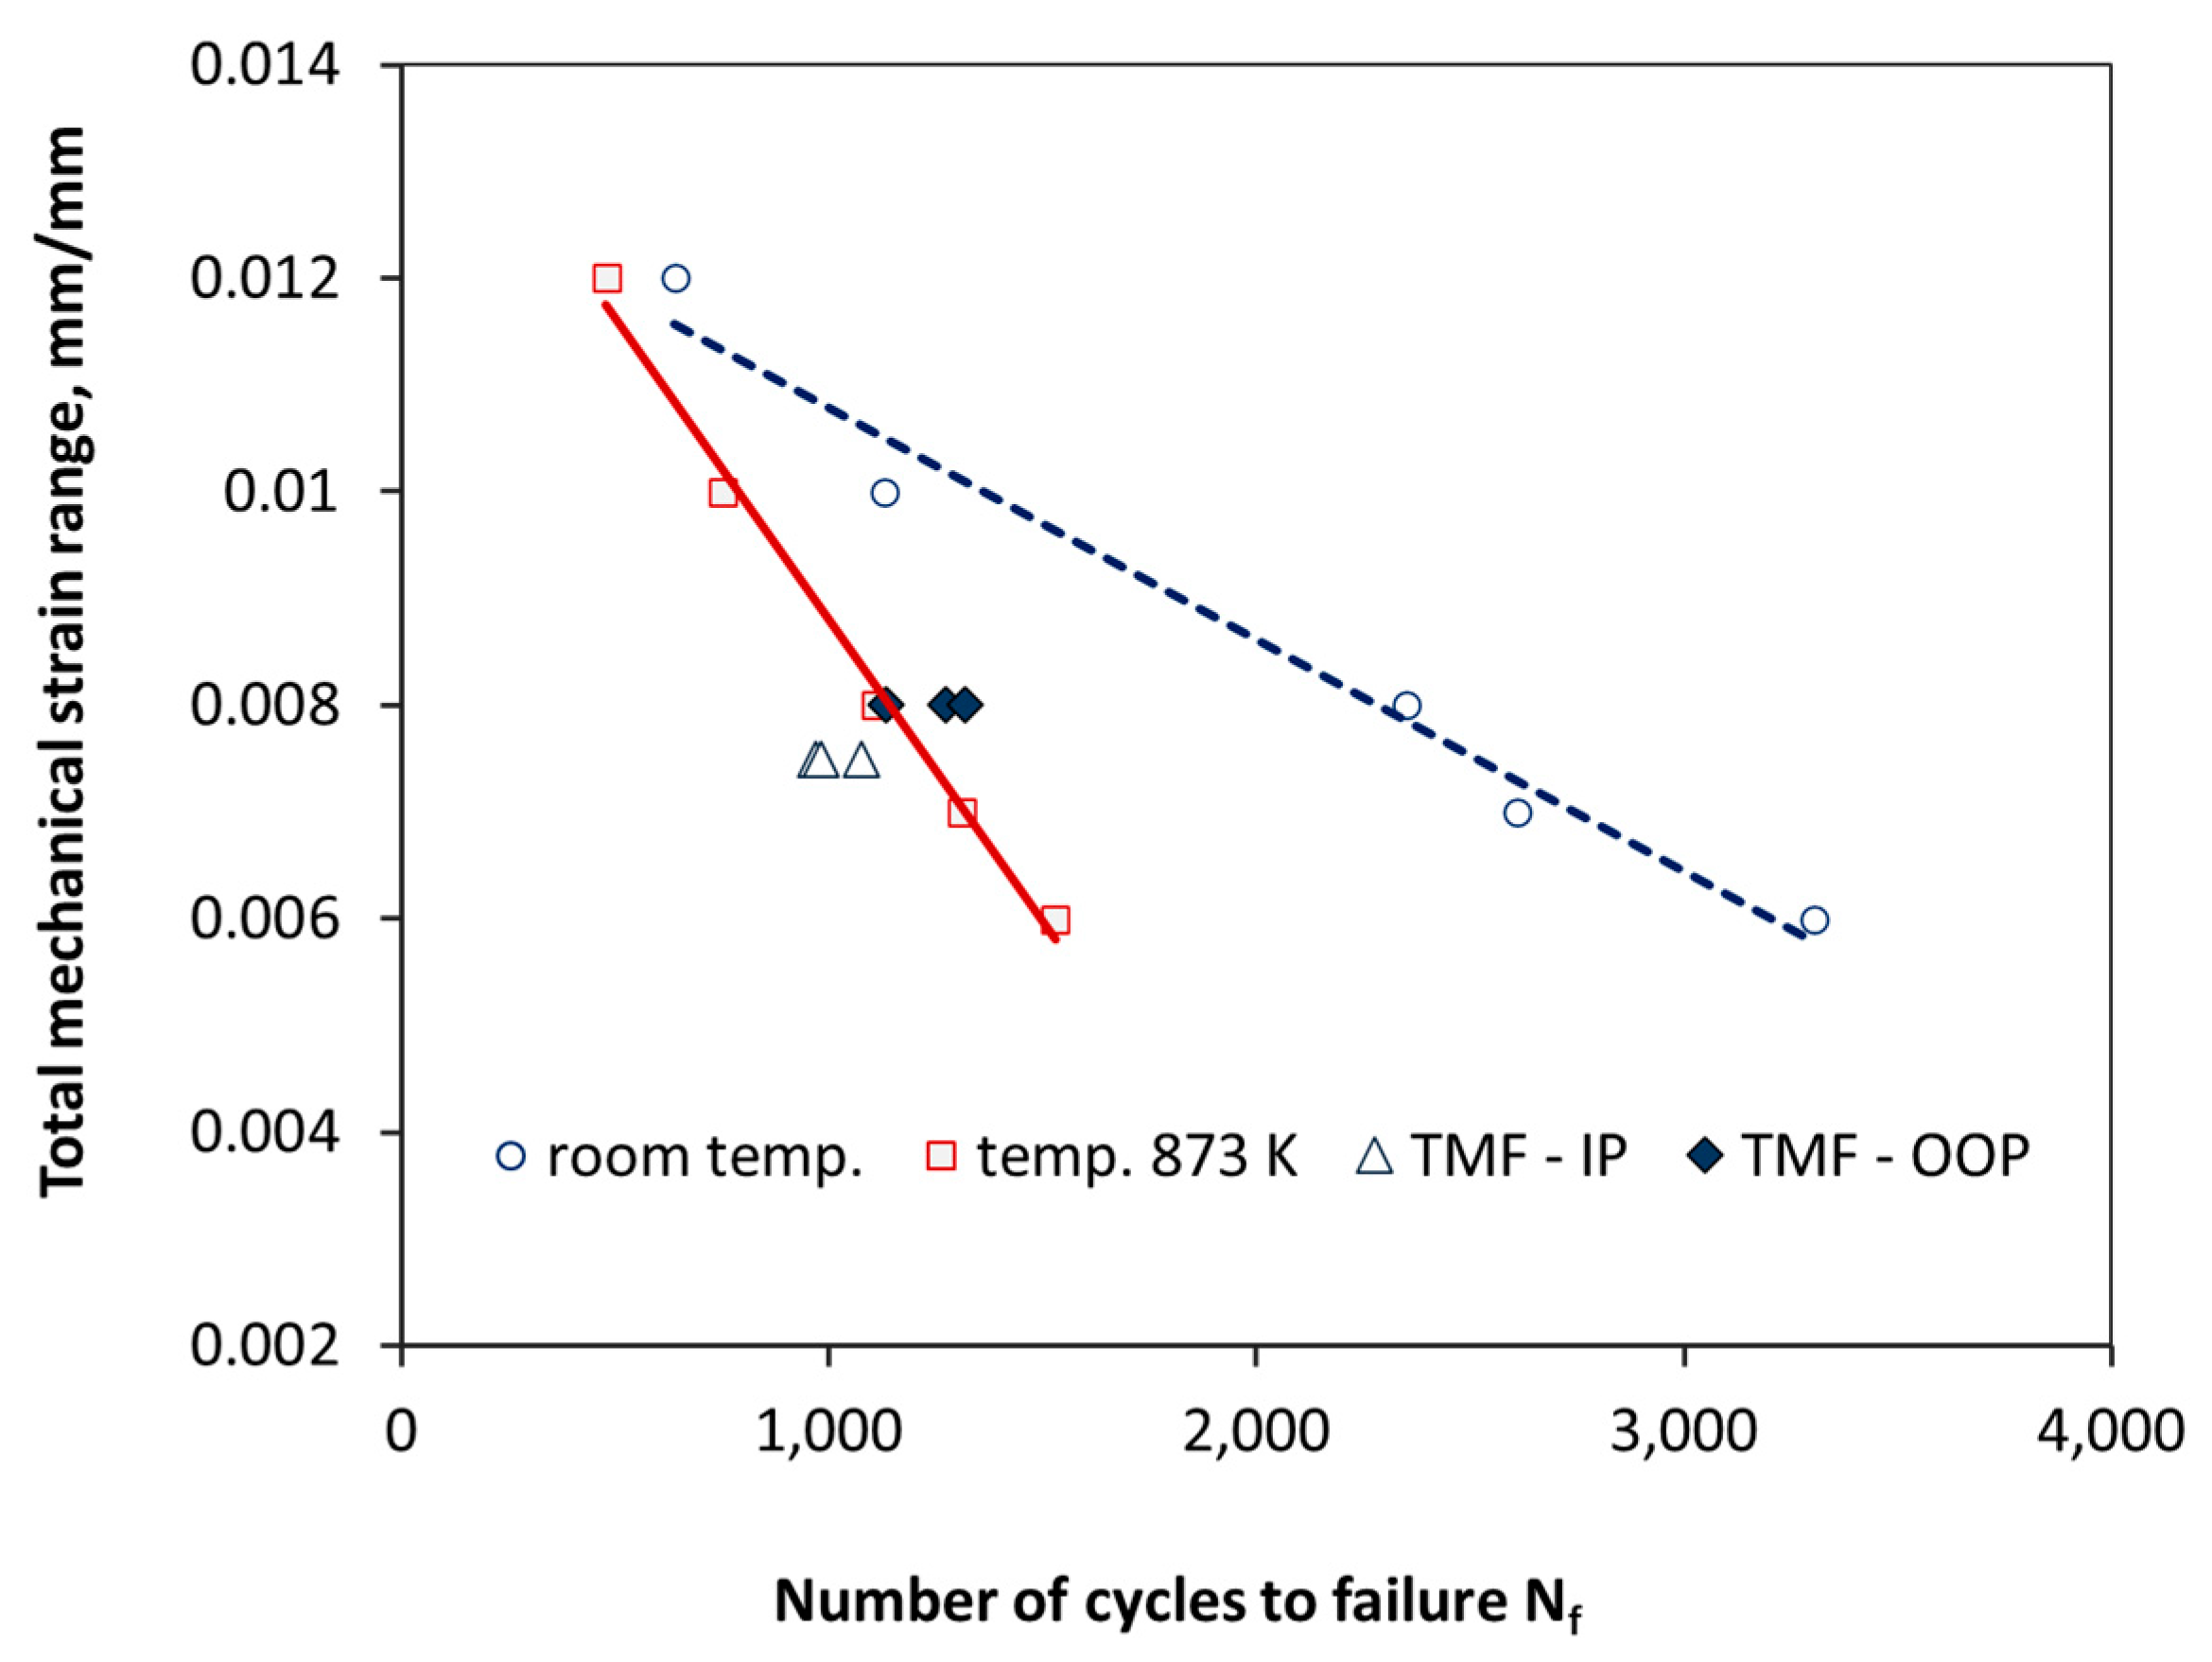
Importantly, to discover the relationships between the phenomena and the factors determining the processes of damage formation in the considered element, the study began with a description of the fatigue behavior of P92 steel. Low-cycle fatigue tests at ambient temperature and 600 °C, as well as thermo-mechanical fatigue tests, were performed. Basic low-cycle fatigue tests were carried out using round cross-section specimens with a diameter of 12 mm in the measuring part and a gauge length of 25 mm as the basis of the extensometer. The MTS 850 servo-hydraulic system was used to provide inductive heating of specimens. The tests were performed with the control of the total strain. Fatigue tests were performed for selected ranges of total strain using the symmetrical cycle of total strains—the amplitude coefficient of the strain cycle R = −1 during fatigue tests. The course of the time-varying relationships between strain and force in individual fatigue cycles was recorded. On this basis, the relationships between strain and stress in the form of hysteresis loops were determined. The tested steel exhibited the phenomenon of cyclic weakening in successive fatigue cycles, both at room temperature and at 600 °C. The tests were carried out until the specimens ruptured, and the number of cycles to failure for the given ranges of total strain were noted. From this information, the fatigue diagrams were developed—the relationships between the number of cycles to failure and the range of total strain, which are presented in
Figure 1.
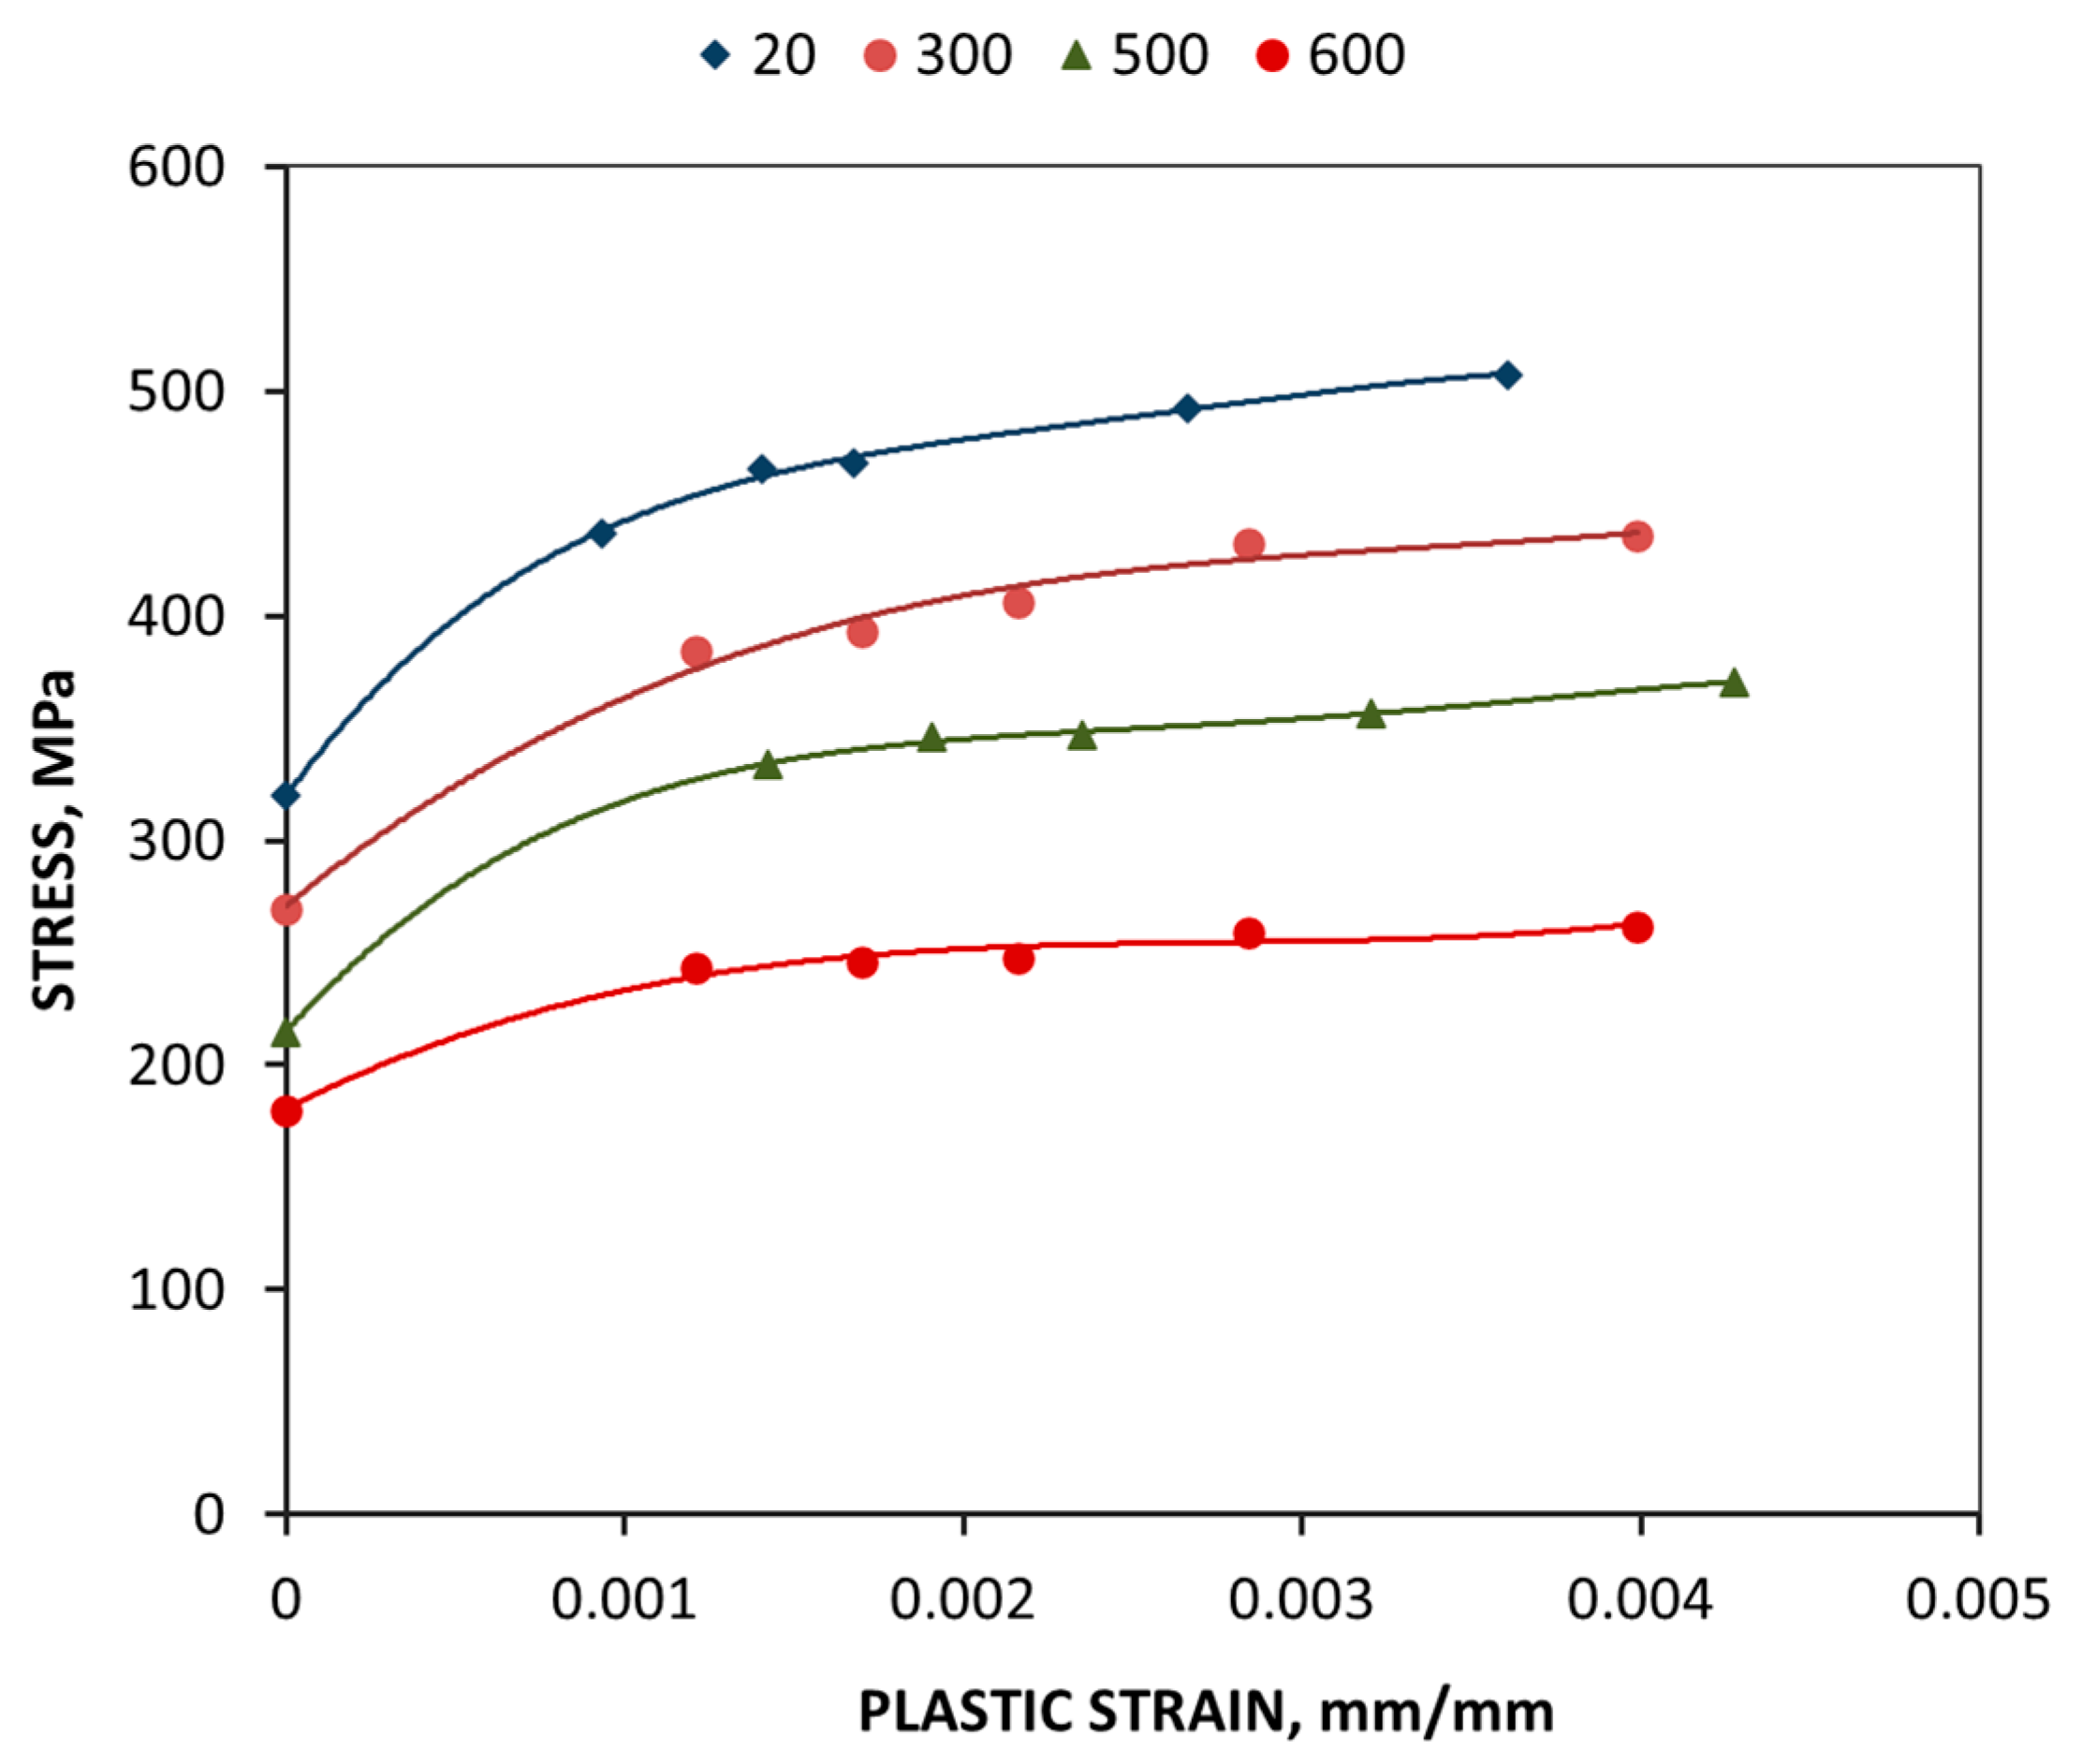
Fatigue tests were also performed to determine the relationship between strain and stress under low-cycle fatigue conditions. Based on the analysis of the course of hysteresis loops corresponding to half of the number of cycles to the material’s failure, the range and amplitude of stress, as well as the range and amplitude of plastic strain, were determined for each of the specimens tested using the different ranges of total strain at the selected temperatures. The range and amplitude of stress, as well as the range and amplitude of plastic deformation, were determined, providing cyclic hardening curves in the form of relationships between the amplitude of plastic strain and the amplitude of stress corresponding to half of the number of cycles to failure. Examples of the determined characteristics are shown in
Figure 2.
Figure 2 shows the approximated description of the material’s mechanical behavior under cyclic deformation conditions at elevated temperatures. Thermo-mechanical fatigue tests were carried out with a measuring setup; the basic system consisted of the MTS servo-hydraulic system equipped with the Test-Star computer control system and the temperature control system. The tests were conducted using the following guidelines of the “European code-of-practice for strain-controlled thermo-mechanical fatigue testing” [
25] developed by the project in the 5th Framework Programme.
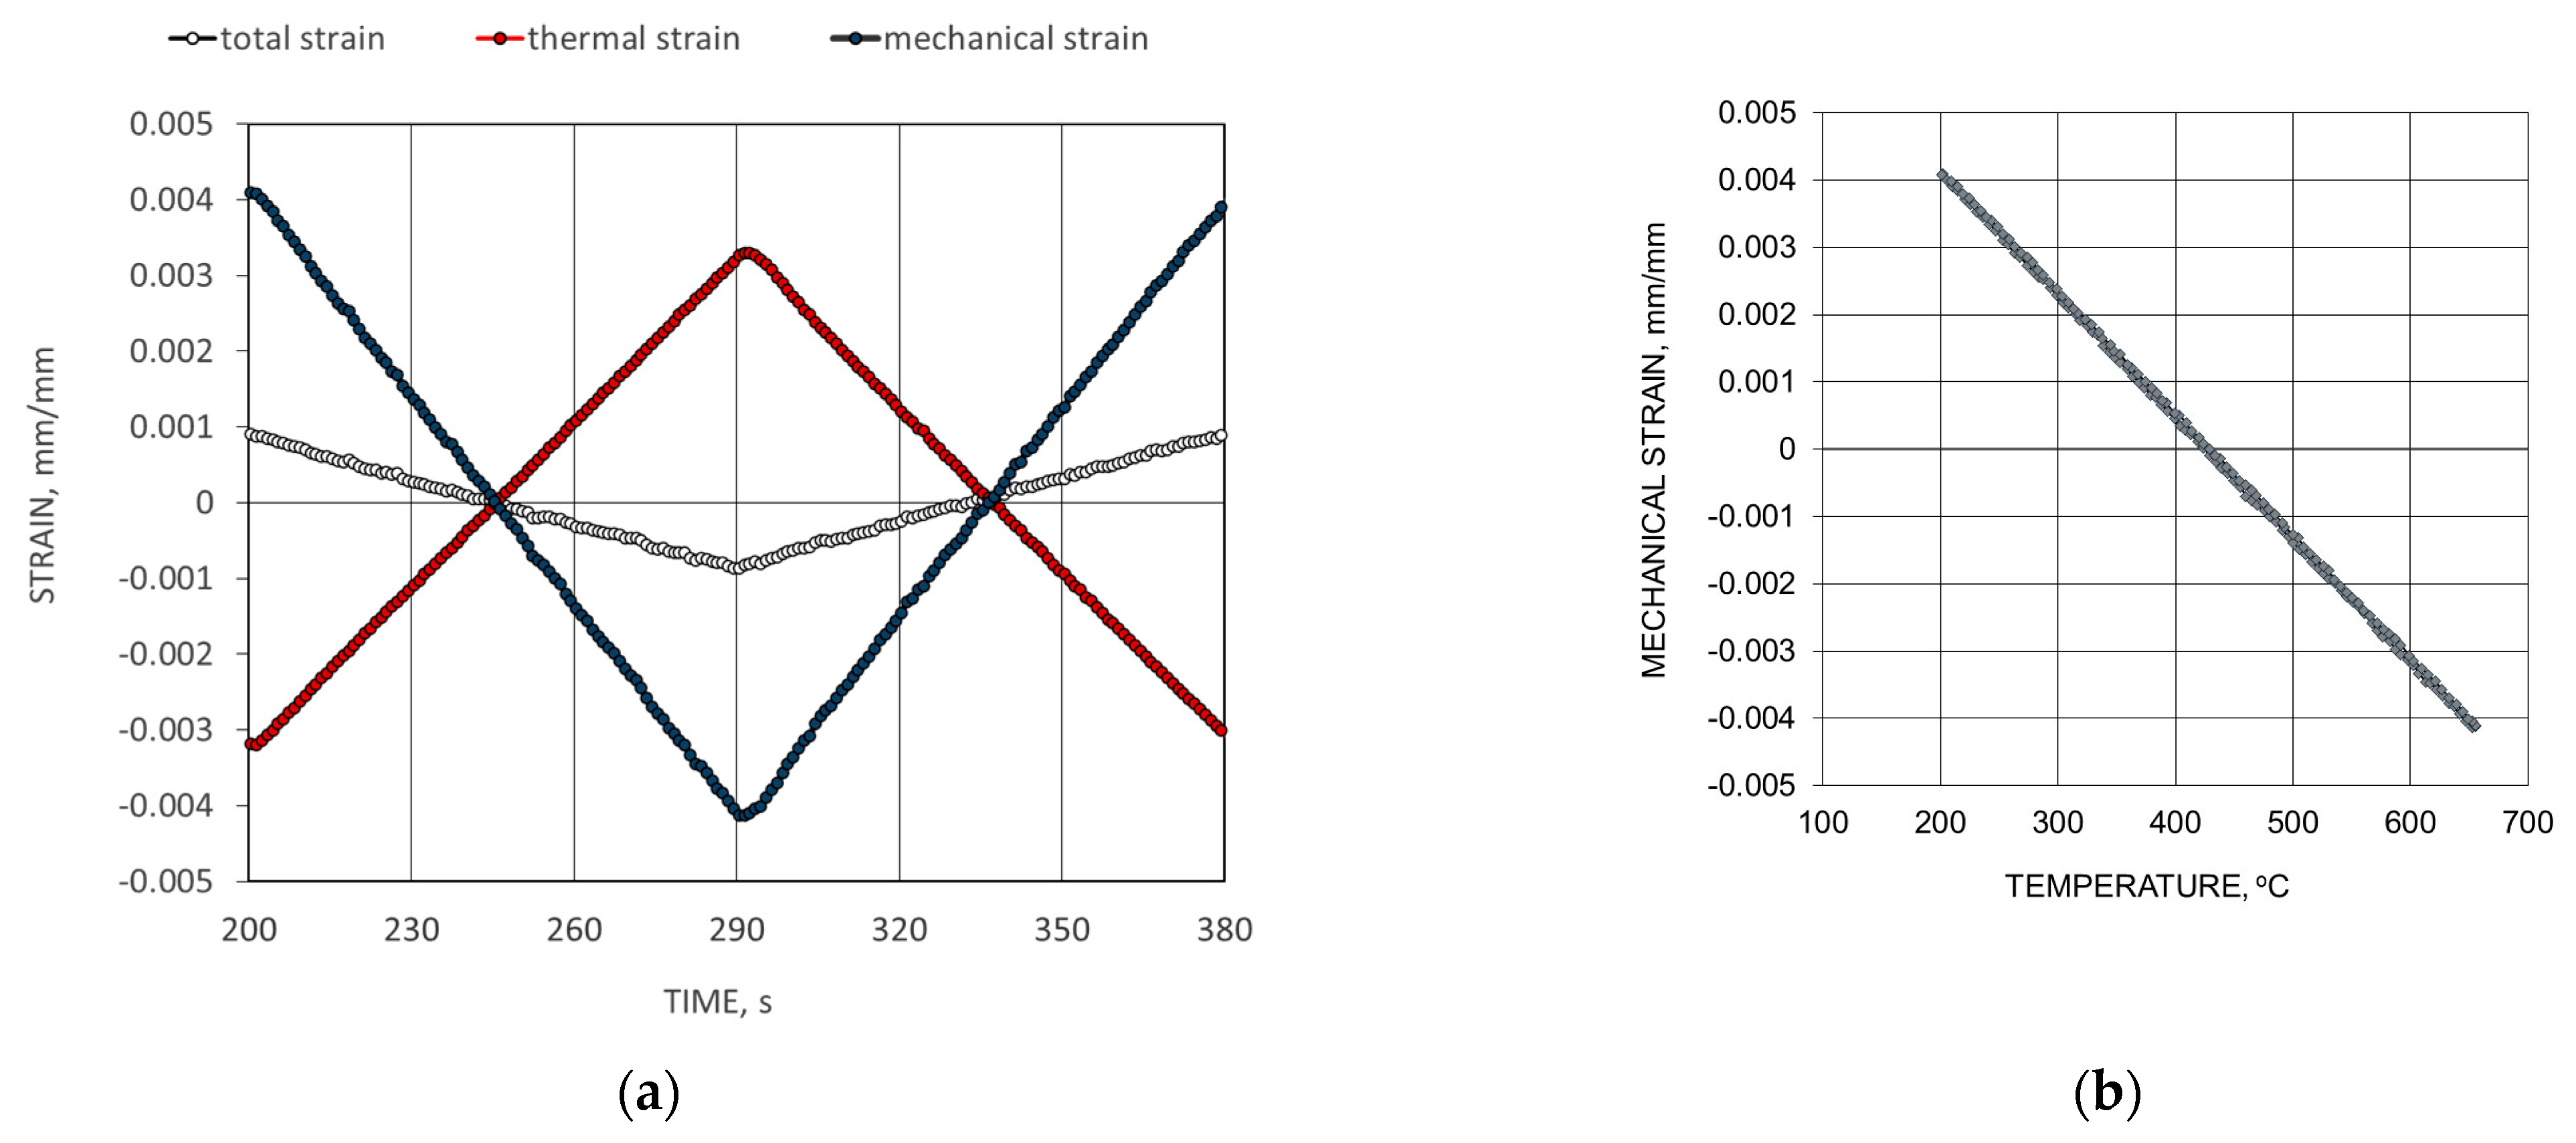
The tests were performed on cylindrical specimens in a gauge part with a diameter of 12 mm and an axial bore of 9 mm. The strain measurements were made using a gauge with a measuring base of 12 mm. The total strain signal and the temperature were controlled at the same time. The mechanical strain (
εM) was quantity-dependent on the thermal strain (
εT) and total strain (
εt) according to the following relation:
Cycles with linearly changing temperature as a function of time and total strain were used (
Figure 3). The tests used the cycle in which the temperature signal remained in the phase opposite to the signal of changes in the mechanical strain and where the signals of the temperature changes and mechanical strain remained in phase. These cycles were marked with the appropriate symbols, OOP-out of phase and IP-in phase. The diagrams presented show selected results of the tests performed for the OOP cycle with the mechanical strain range being equal to ∆
εM = 0.008, minimum temperature
Tmin = 200 °C, and maximum temperature
Tmax = 650 °C, as well as the IP tests with a mechanical strain range of ∆
εM = 0.007, minimum temperature
Tmin = 200 °C, and maximum temperature
Tmax = 650 °C.
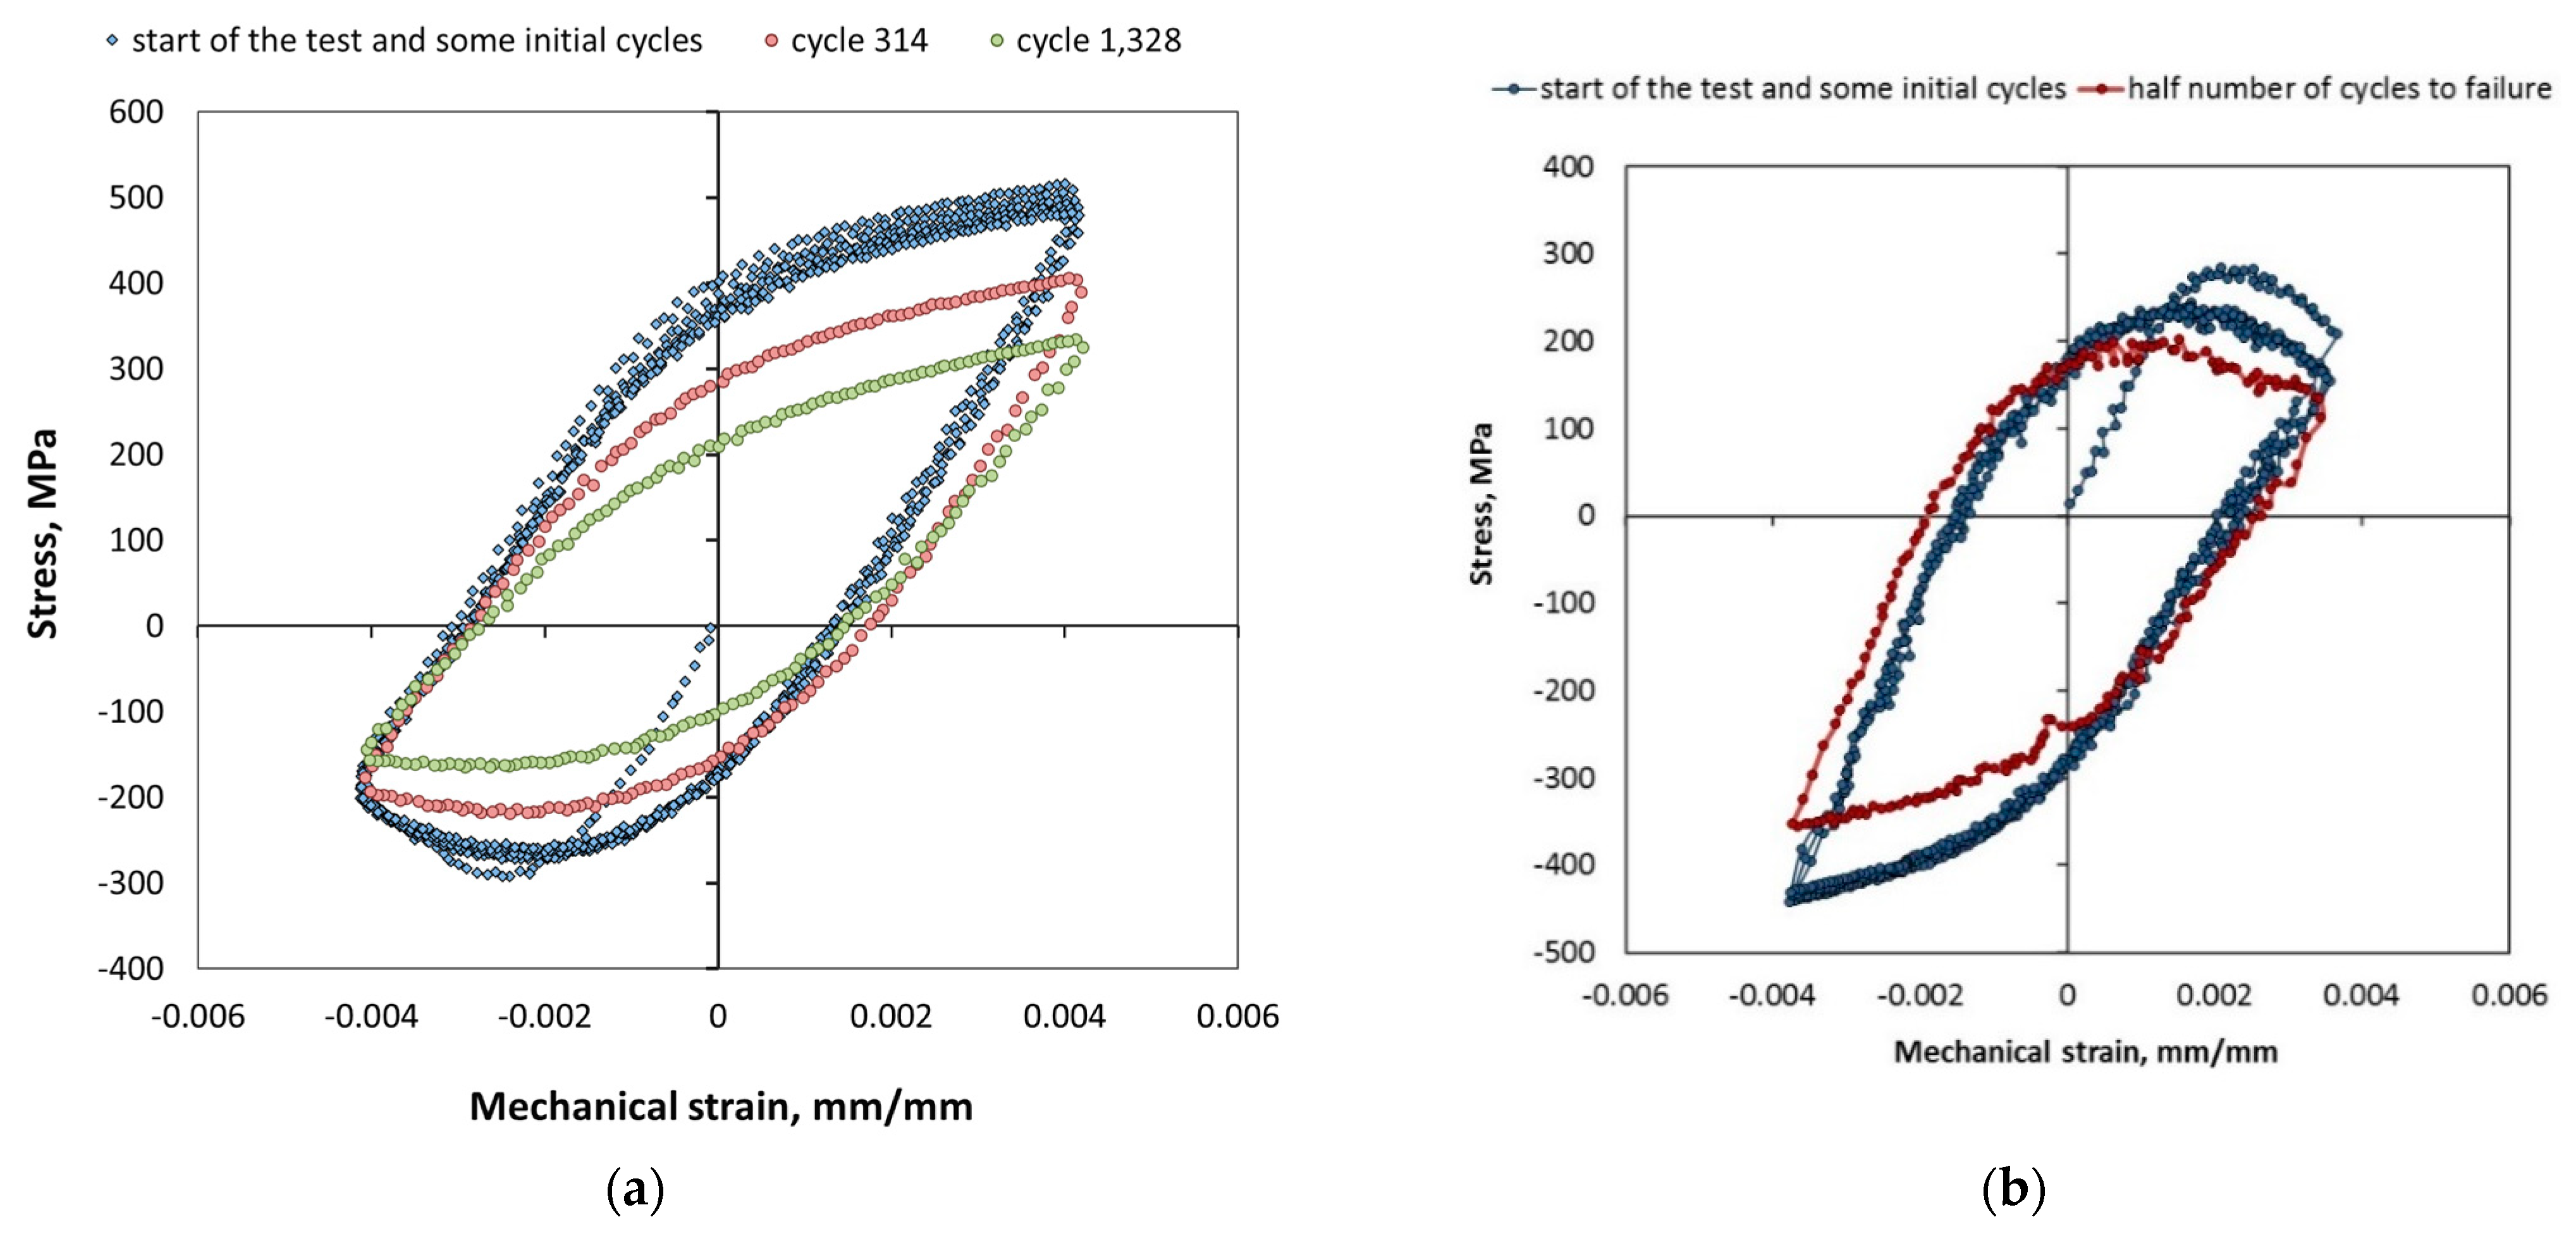
During the examination, changes in the hysteresis loop shape in the function of the number of cycles were observed (
Figure 4). The diagrams displayed in
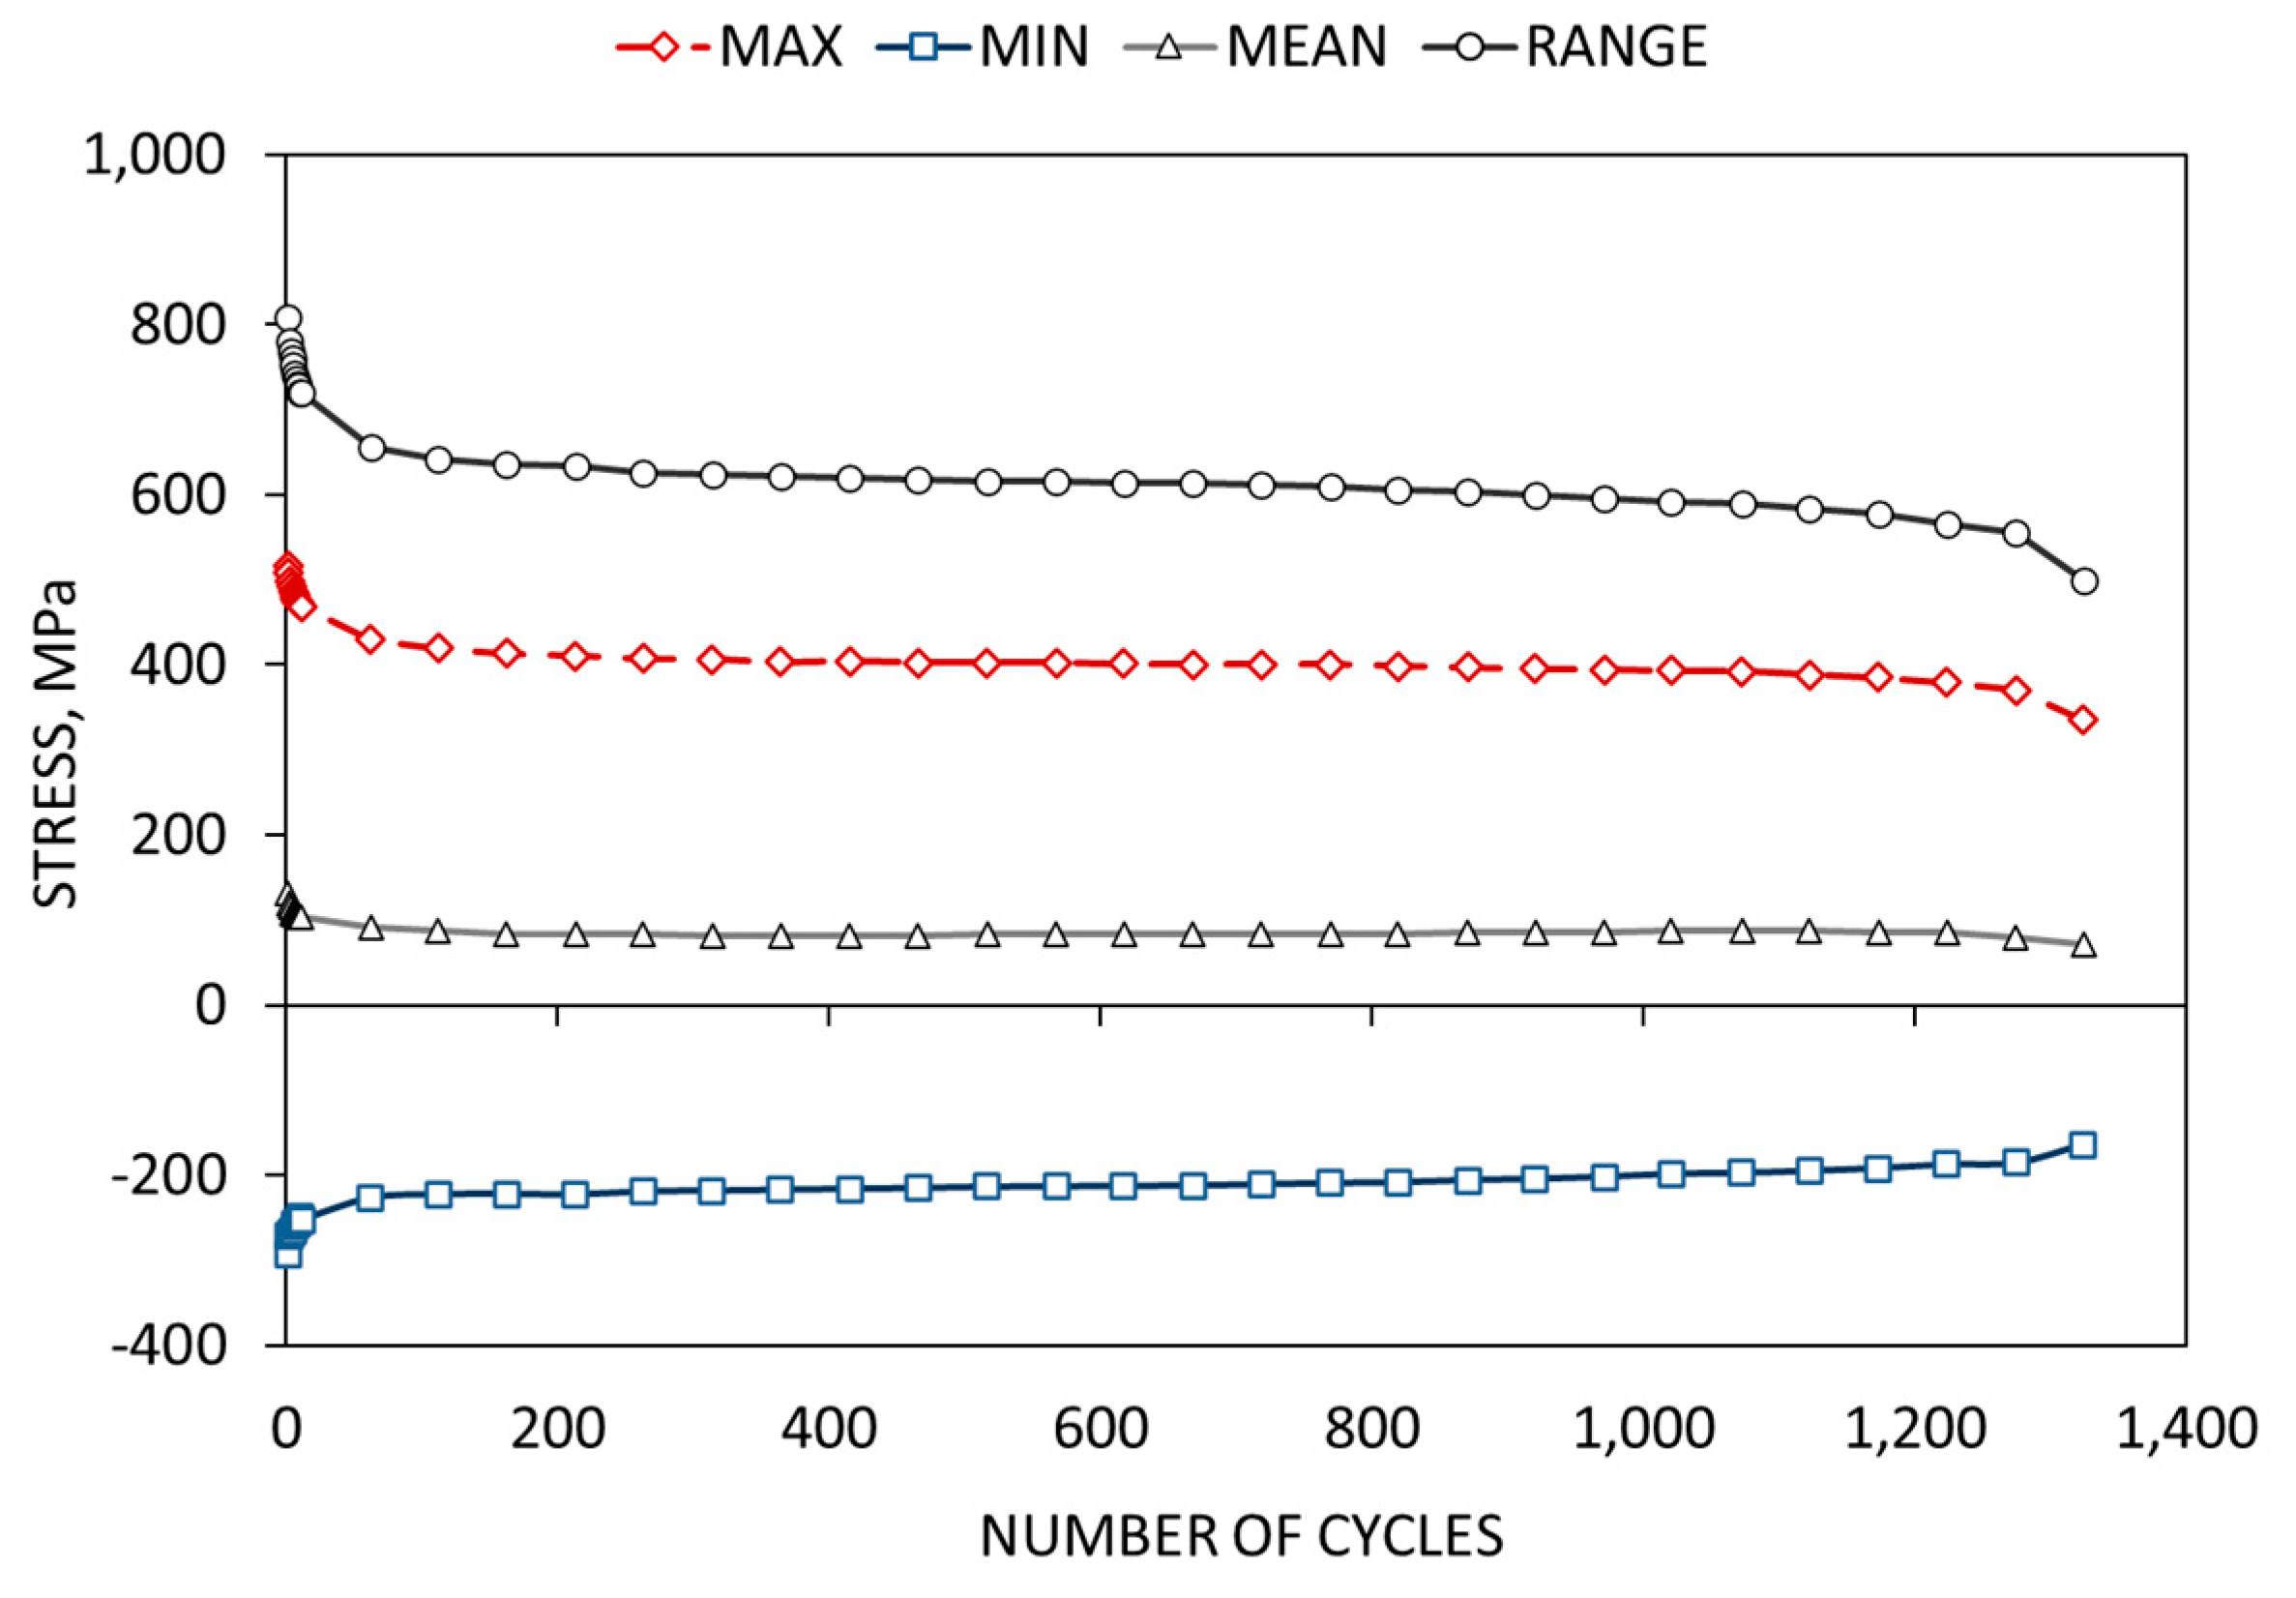
Figure 4 represent the hysteresis loops at the beginning of the fatigue test, where intensive changes in their course were observed. These changes were related to the weakening process occurring in the material. The hysteresis loops are also presented for selected cycles. The characteristics representing the course of the hysteresis loop when the maximum and minimum stress values were relatively stabilized were of particular interest. The period of time, when the hysteresis loops were stabilized, covered the dominant part of the fatigue life of the specimens, which was visible when examining changes in the maximum and minimum stress and the range of stresses as a function of time (
Figure 5).
The results of the thermo-mechanical fatigue tests are presented in
Figure 3,
Figure 4 and
Figure 5 and illustrate the behavior of the studied material under conditions of cyclically changing temperature and strain. The data were used to compare, among other things, the nature of the property changes in the case of tests carried out under isothermal conditions and at temperatures varying over time. The effect of temperature variability on the material’s durability was assessed.
Figure 1 shows the fatigue diagrams determined in the isothermal low-cycle fatigue tests and the fatigue test results under thermo-mechanical fatigue conditions. These results are close to the low-cycle fatigue characteristics determined at a temperature close to the maximum temperature of the thermo-mechanical fatigue cycle (
Figure 1). In this case, the value of the maximum temperature in the thermo-mechanical tests was the basic factor influencing the fatigue life of the material.
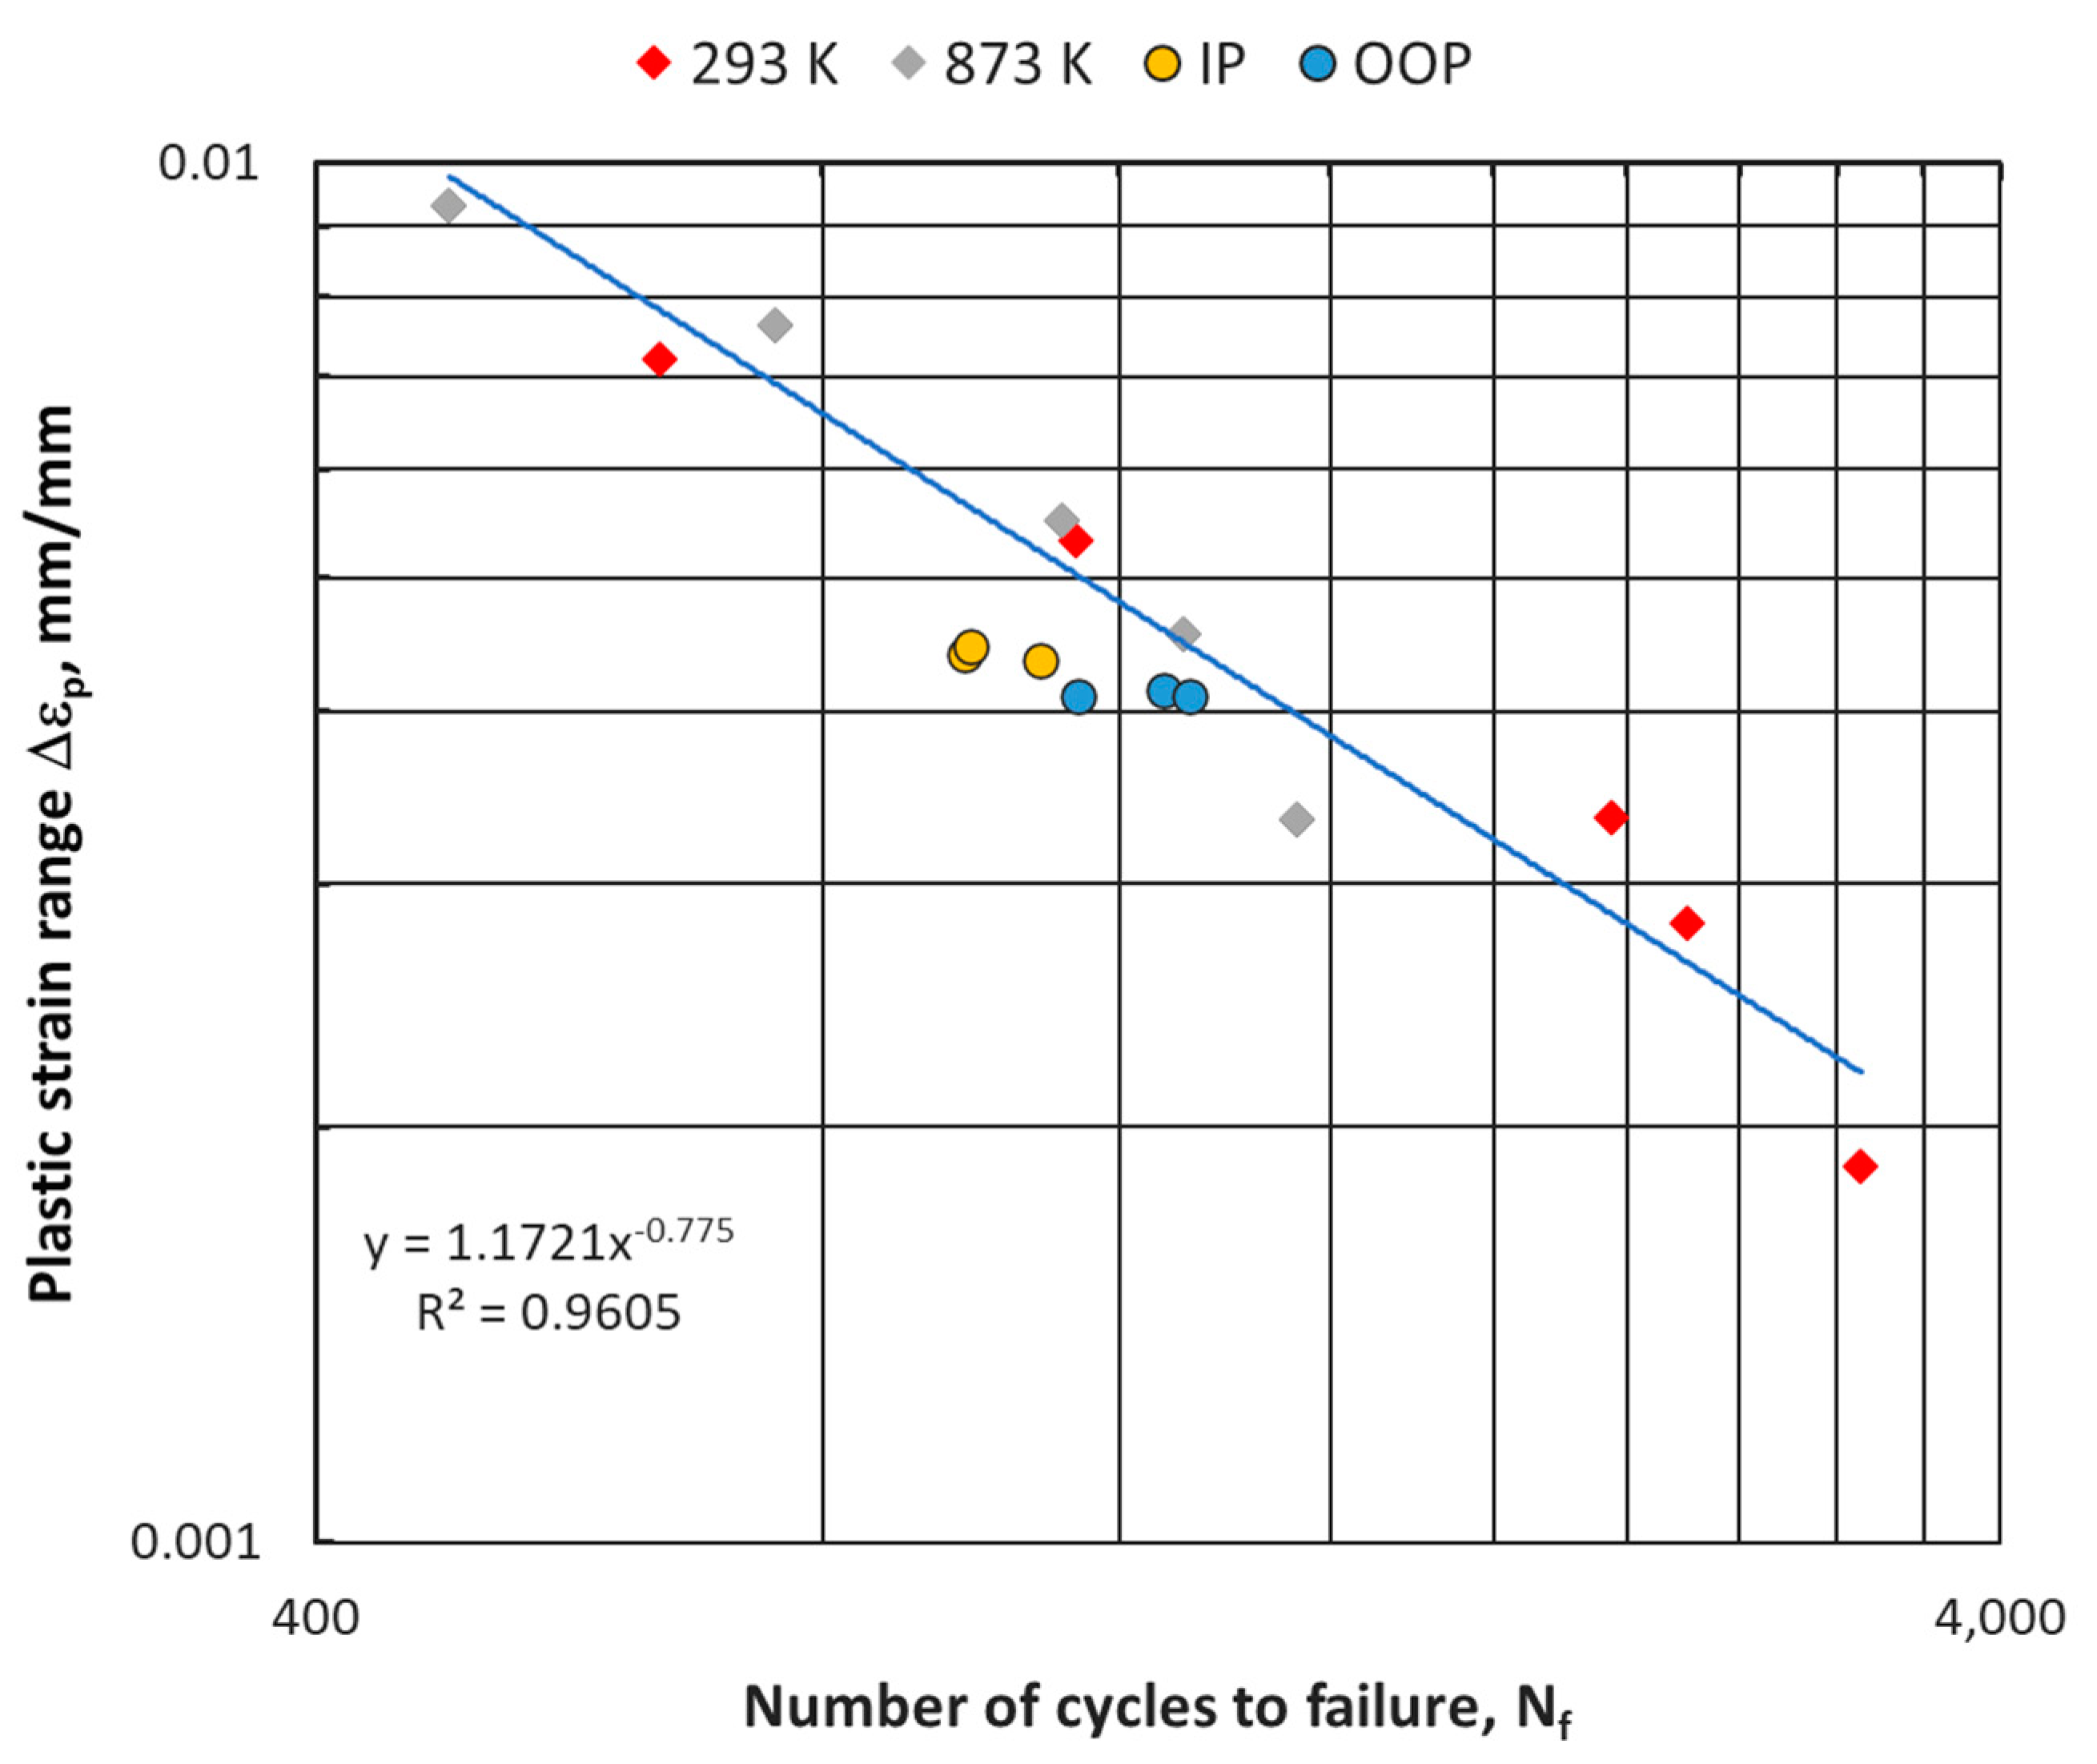
Figure 1 shows one of possible ways of capturing the durability depending on the parameters characterizing the magnitude of the mechanical and thermal interactions. For low-cycle fatigue under isothermal conditions, a commonly used method that represents the durability characteristics is the relationship between the number of cycles to failure and the range of total or plastic strain. When the total strain range was used as a criterion parameter (
Figure 1), two distinctly different characteristics corresponded to room temperature and elevated temperature. However, assuming the range of plastic deformation as a parameter characterizing the magnitude of mechanical loading, the points corresponding to the tests performed at different temperatures were arranged around one line (
Figure 6). Therefore, a relationship known as the Manson-Coffin relationship [
26,
27,
28] was used to describe the durability under fatigue conditions:
where ∆
εp is plastic strain range,
N is the number of cycles to failure, and
A and
n are the material constants.
As shown in
Figure 6, the points corresponding to the tests performed at room temperature are marked in red, and the results of the tests performed at 873 K are marked in grey. In addition, selected results of the thermo-mechanical fatigue tests are highlighted, including the test results for the temperature cycle in phase with the mechanical strain cycle, designated IP (in phase), and for the half-period-shifted mechanical strain cycle for the cycle and the mechanical strain cycle shifted by half the period for the thermal strain cycle—OOP (out of phase). The points obtained from the thermo-mechanical fatigue tests were arranged near the line, showing the results of the isothermal tests. The estimation of the fatigue life under thermo-mechanical fatigue conditions for the obtained results, based on the characteristics determined at constant temperatures, would be conservative, as evidenced by the location of the points marked with blue and yellow below the line approximating the results of the isothermal studies with a linear relationship in the doubly logarithmic coordinate system.
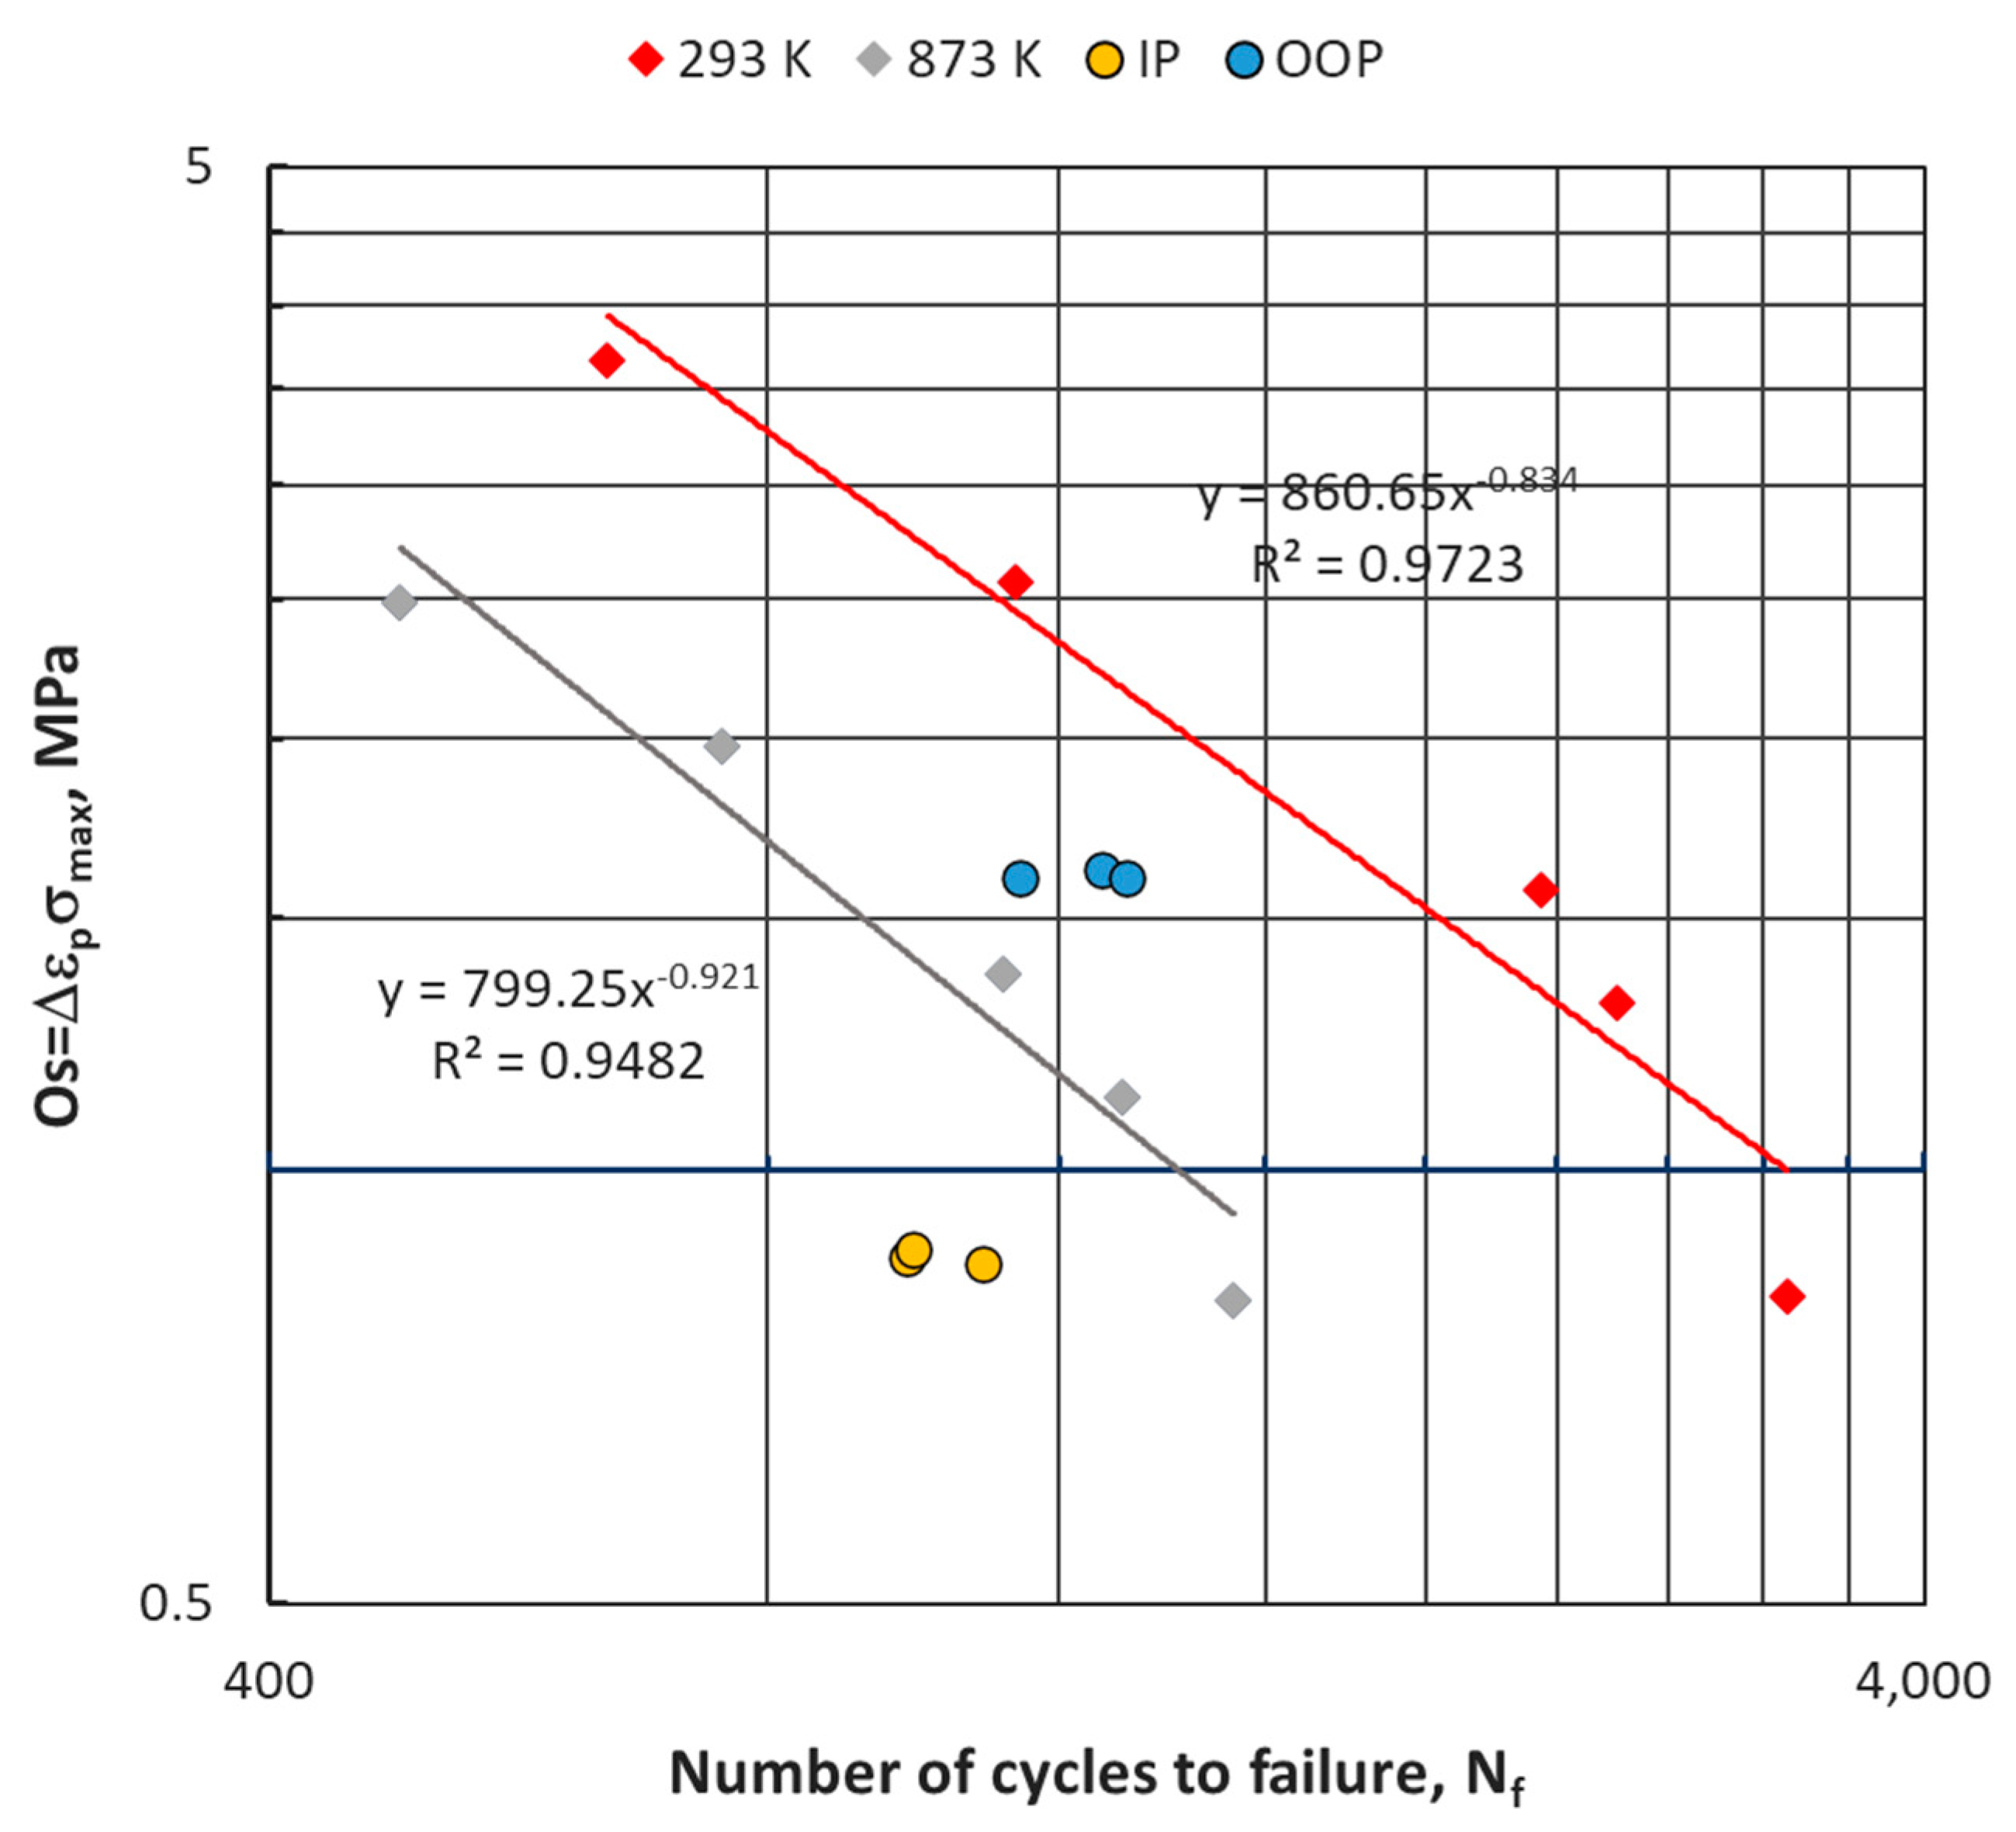
The Manson–Coffin criterion is one of the first methods used to describe the results of the low-cycle fatigue and thermo-mechanical fatigue tests. The Ostergren criterion is another criterion to evaluate durability under thermo-mechanical fatigue conditions [
29,
30,
31]. This approach highlights the relationship between the number of cycles to failure and the parameter, which is the product of the range of the plastic strain range and the maximum stress–stress under tensile conditions in the fatigue cycle in the isothermal and thermo-mechanical fatigue tests.
where ∆
εp is plastic strain range,
σmax is the maximal stress in the cycle,
N is the number of cycles to failure, and
C and
m are material constants.
The fatigue life diagrams determined for the tested P92 steel using the Ostergren criterion are shown in
Figure 7. A clear difference was observed for the tests carried out at room temperature (20 °C, 293 K) and an elevated temperature of 873 K. The results revealed that it was possible to determine two separate characteristics at 293 K and 873 K. The thermo-mechanical fatigue test results plotted on the graph in the
(
Figure 7) system were comparable to the characteristics determined in isothermal tests for the maximum temperature of 873 K. The discrepancies between the results of the isothermal tests and the results of the thermo-mechanical fatigue tests were differentiated depending on the type of test (IP or OOP).
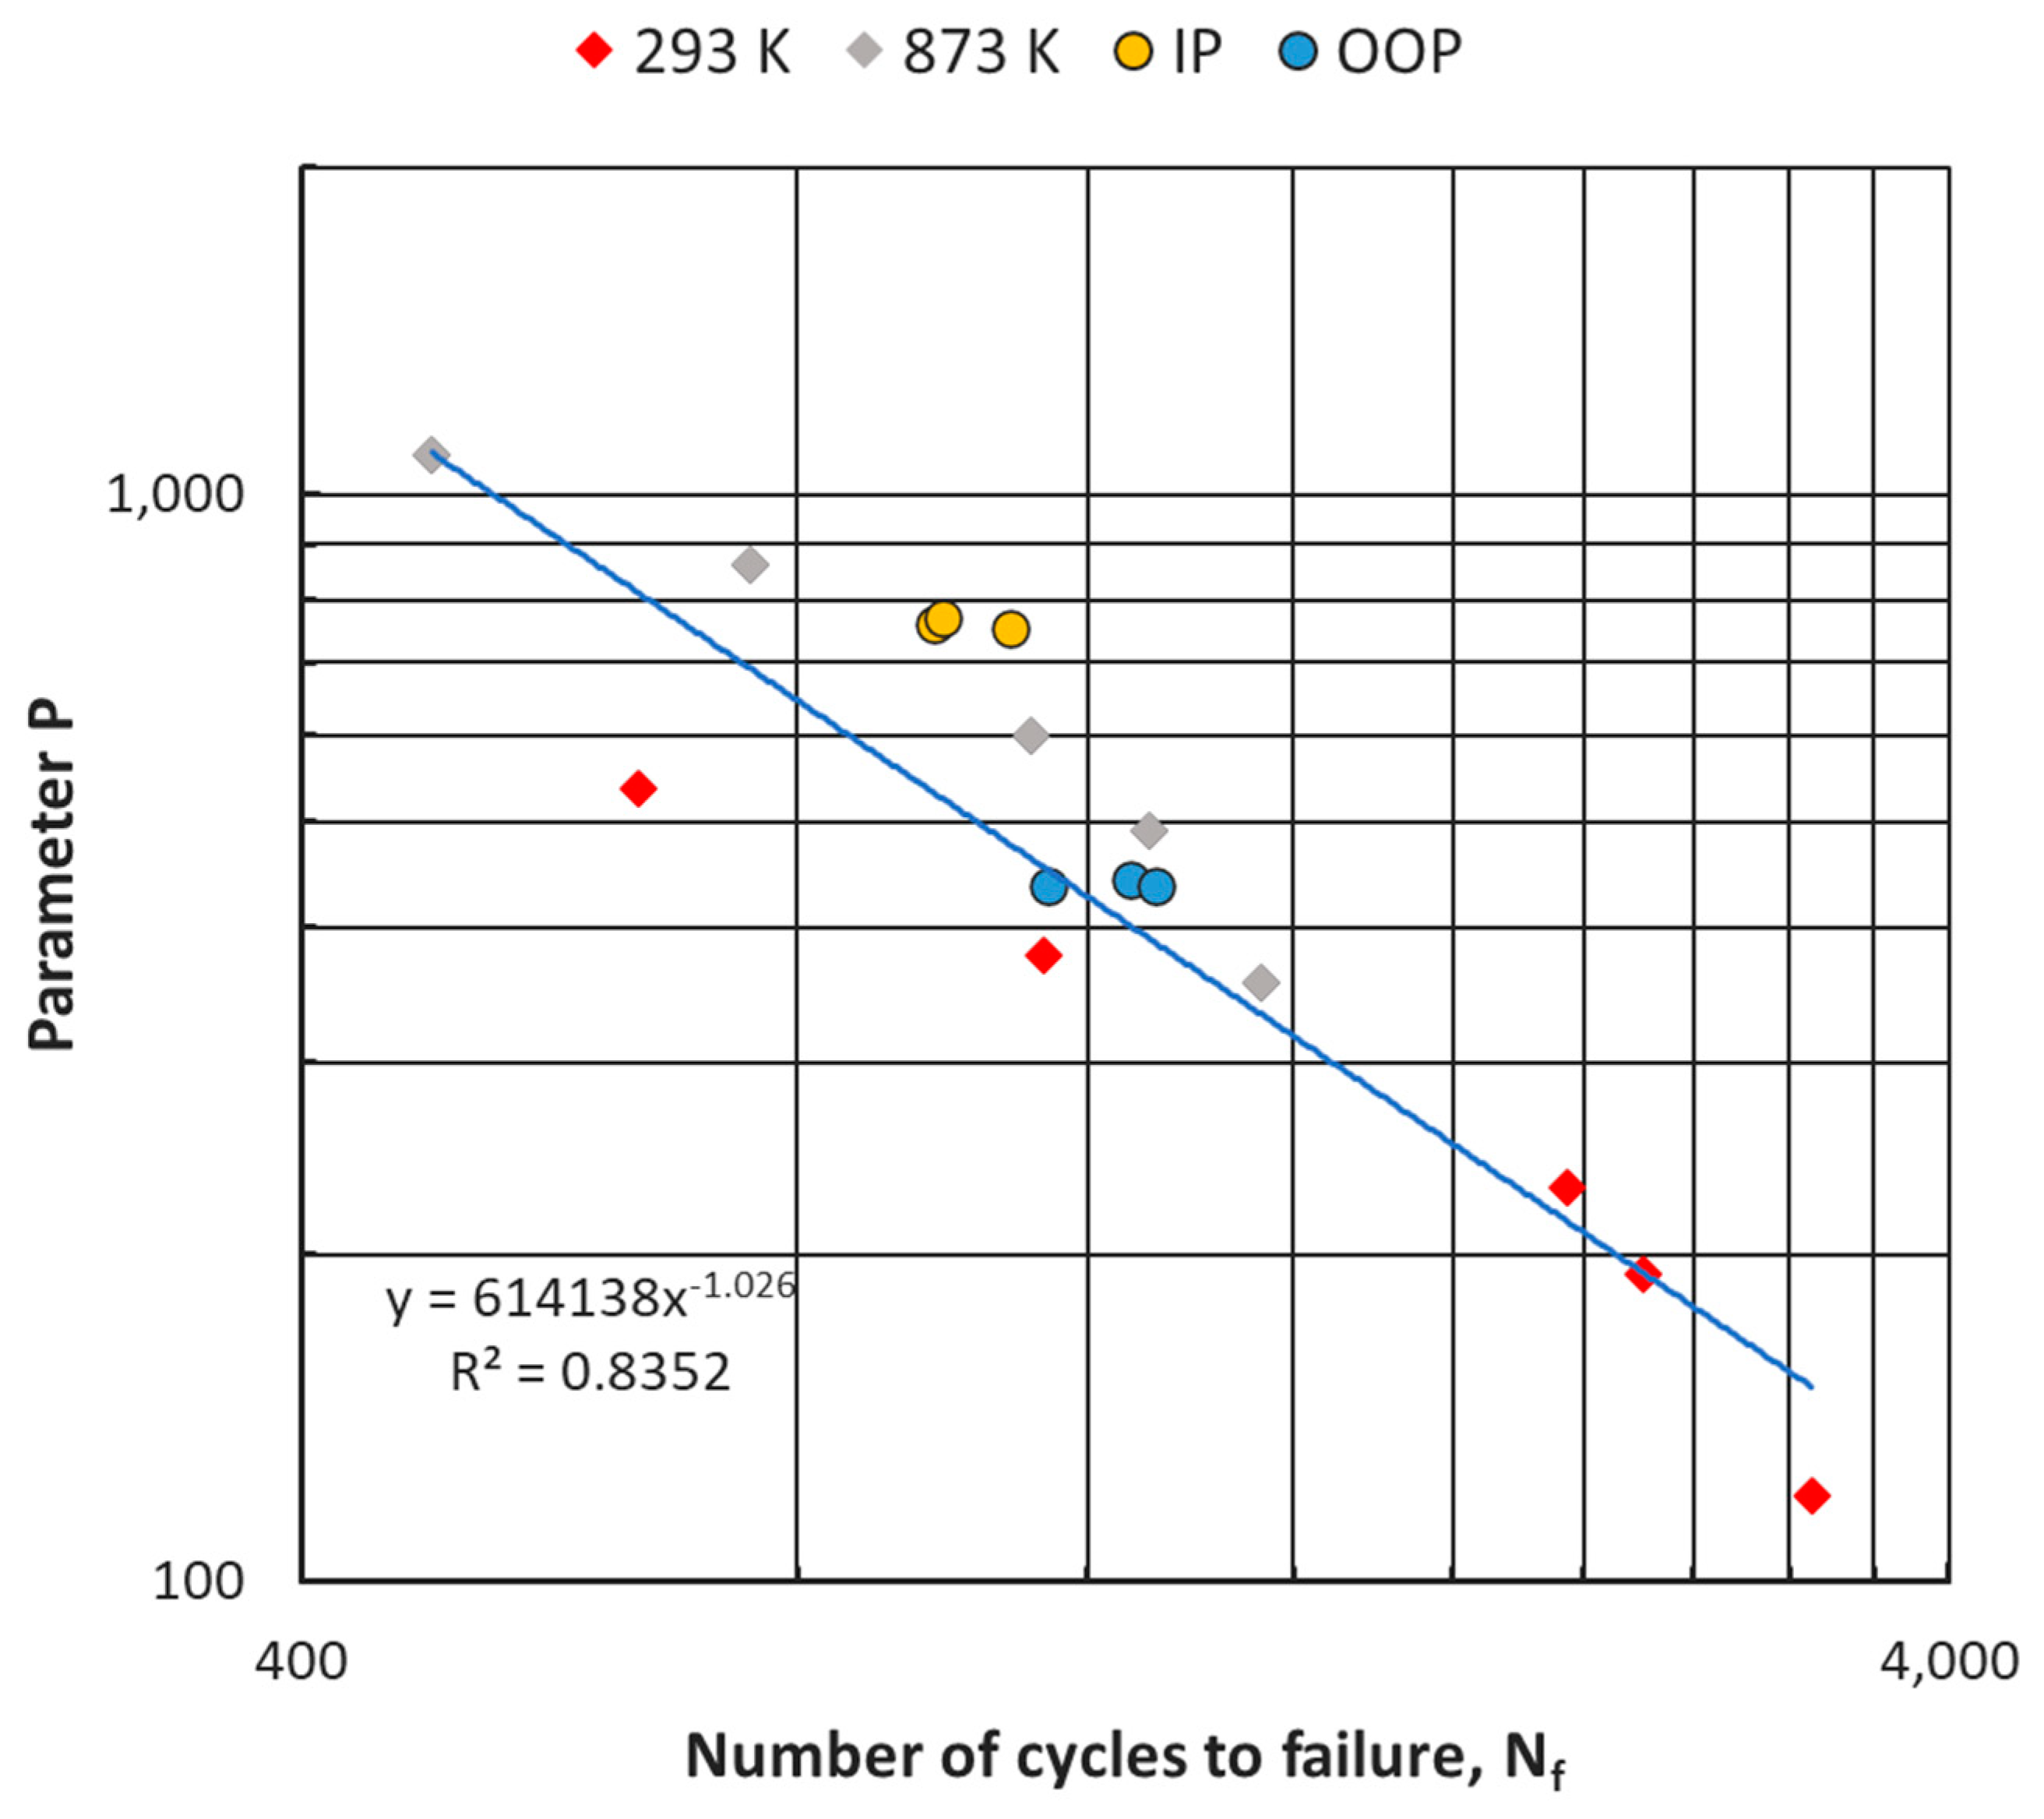
A comparison of the results obtained using the Manson–Coffin criterion and the Ostergren criterion shows that for the performance of the P92 steel in the fatigue tests, a better estimation of the durability for isothermal and thermo-mechanical fatigue tests was produced using the Manson–Coffin criterion. The study corrected the Ostergren criterion by incorporating temperature as an additional quantity (
Figure 8). In the case of the isothermal tests, this was the temperature at which they were conducted. For the thermo-mechanical fatigue tests, the temperature at which the maximal tensile stress was reached in the fatigue cycle,
TT, is proposed. The criterion parameter was then of the form
, and the relationship between the number of cycles to failure and the parameter P was as follows:
where ∆
εp is plastic strain range,
σmax is the maximal stress in the cycle,
TT is the is the temperature at maximal stress,
N is the number of cycles to failure, and
C and
m are the material constants.
This method allows the isothermal tests at 293 and 873 K to follow the same line, which was characterized by a linear relationship in a doubly logarithmic coordinate system.
The results of the conducted thermo-mechanical fatigue tests for the Manson-Coffin criterion were close to the line representing the results of the isothermal tests. Therefore, for the tested steel, it was possible to present the results of the isothermal tests using a single characteristic when the Coffin criterion or the modified Ostergren criterion was employed.
4. Model of a Superheater Header
Defining the boundary conditions reflecting actual operating conditions is one of the basic elements of the methodology for modeling the behavior of pressure equipment subjected to complex mechanical and thermal interactions. The correctness and accuracy determine the ability to assess the temperature, stress, and strain fields that vary over time. Additionally, how the properties of the material are captured is important. Depending on the type of material and working conditions, it is necessary to adopt different models—constitutive equations reflecting the relations between stresses, strains, temperature, and time. To analyze the conditions in which fatigue processes occur, the influence of temperature on the elastic and plastic properties of the material was considered. Concerning material behavior, a multilinear with a kinematic hardening model, a version of the Besseling proposition, was implemented [
32,
33,
34,
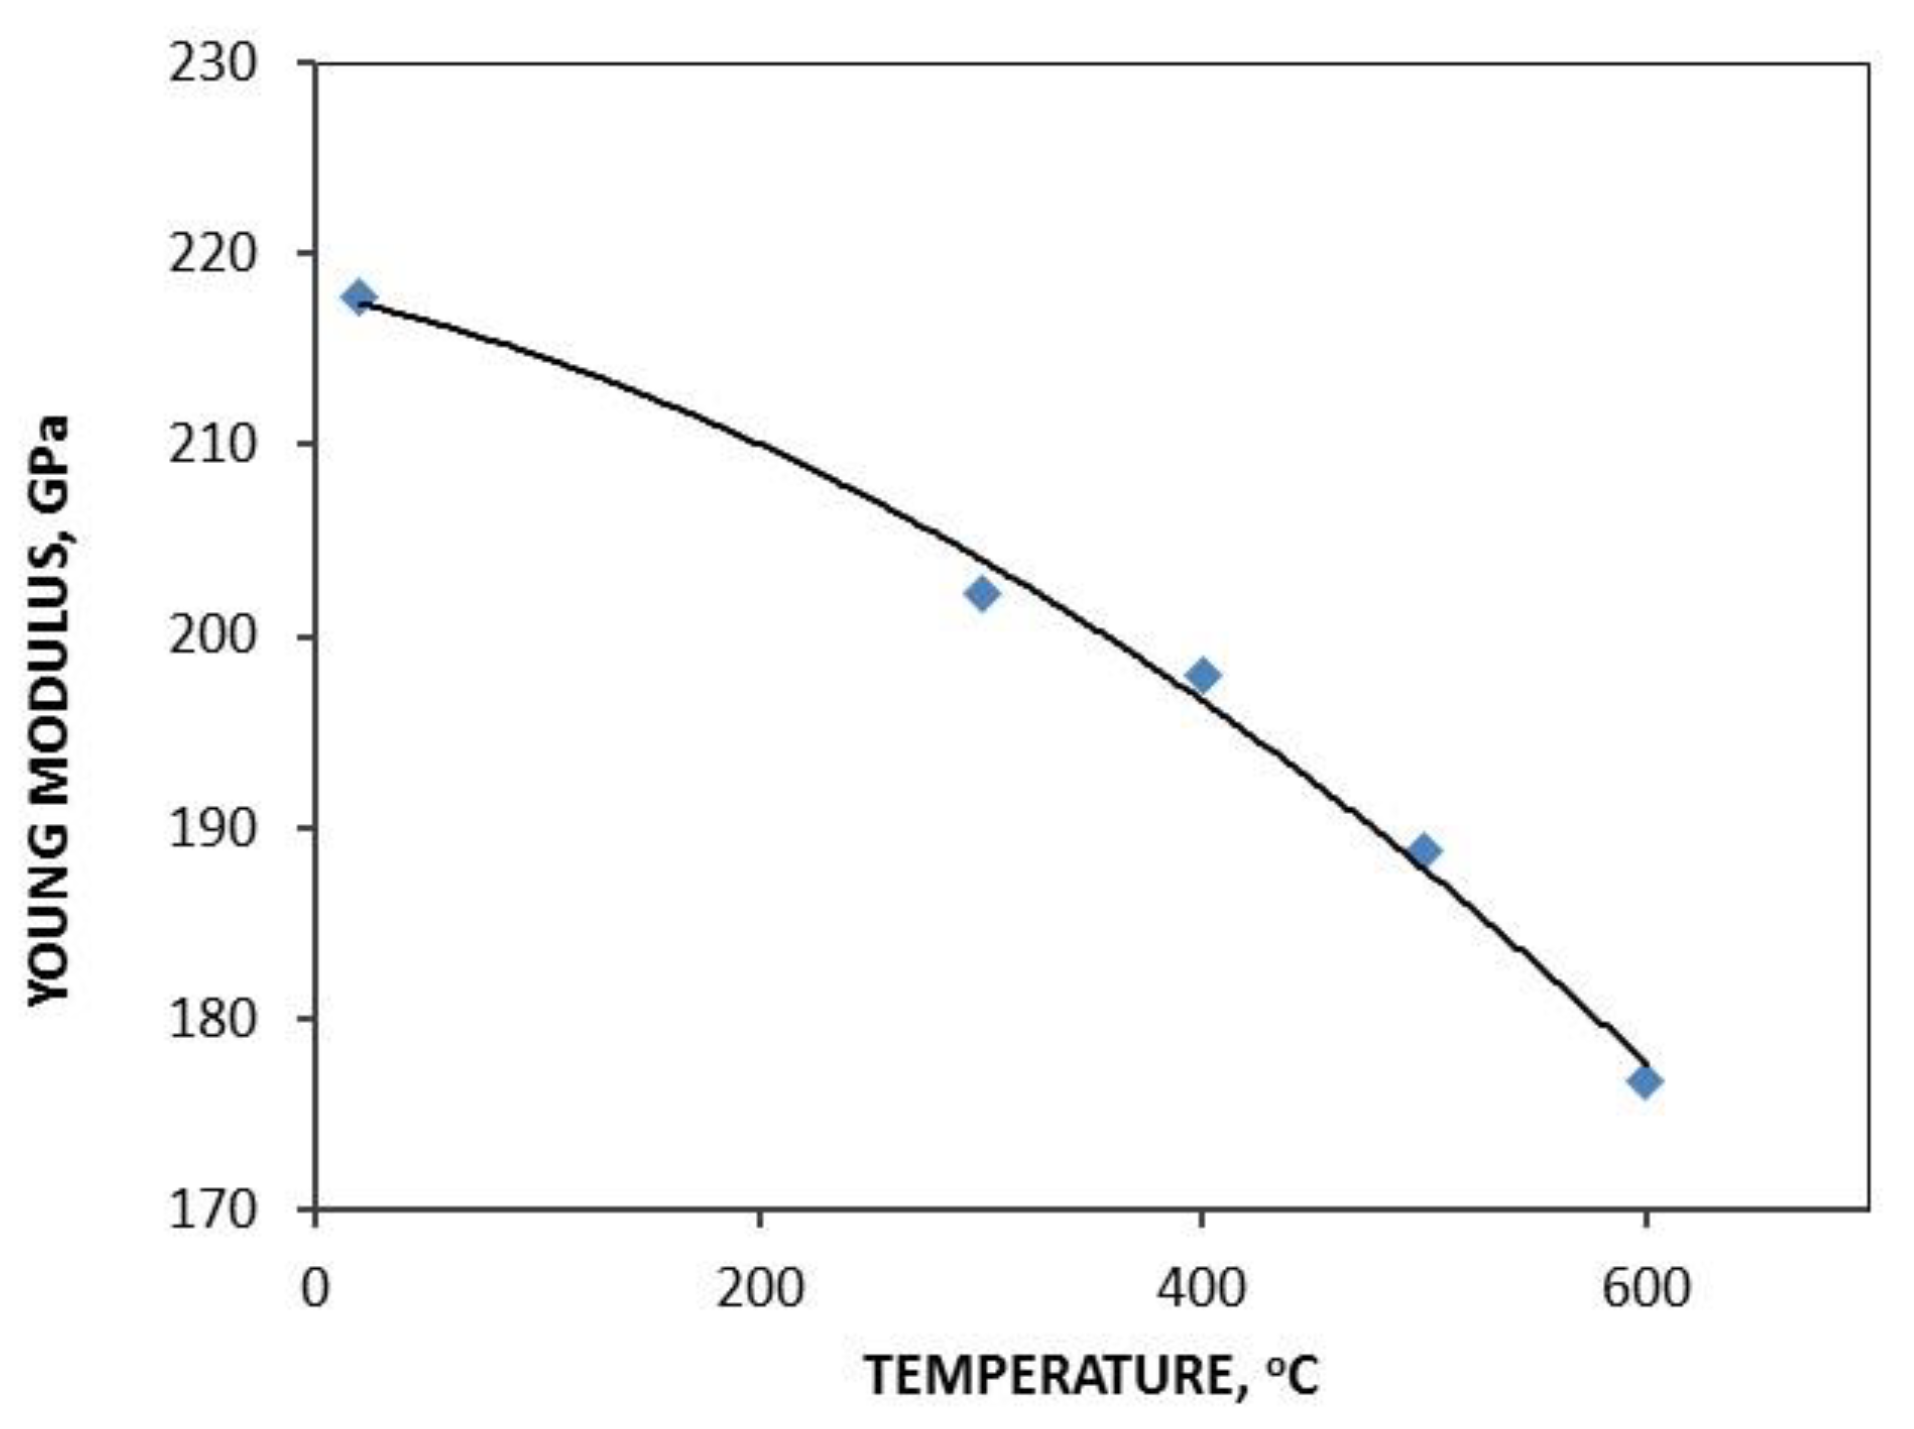
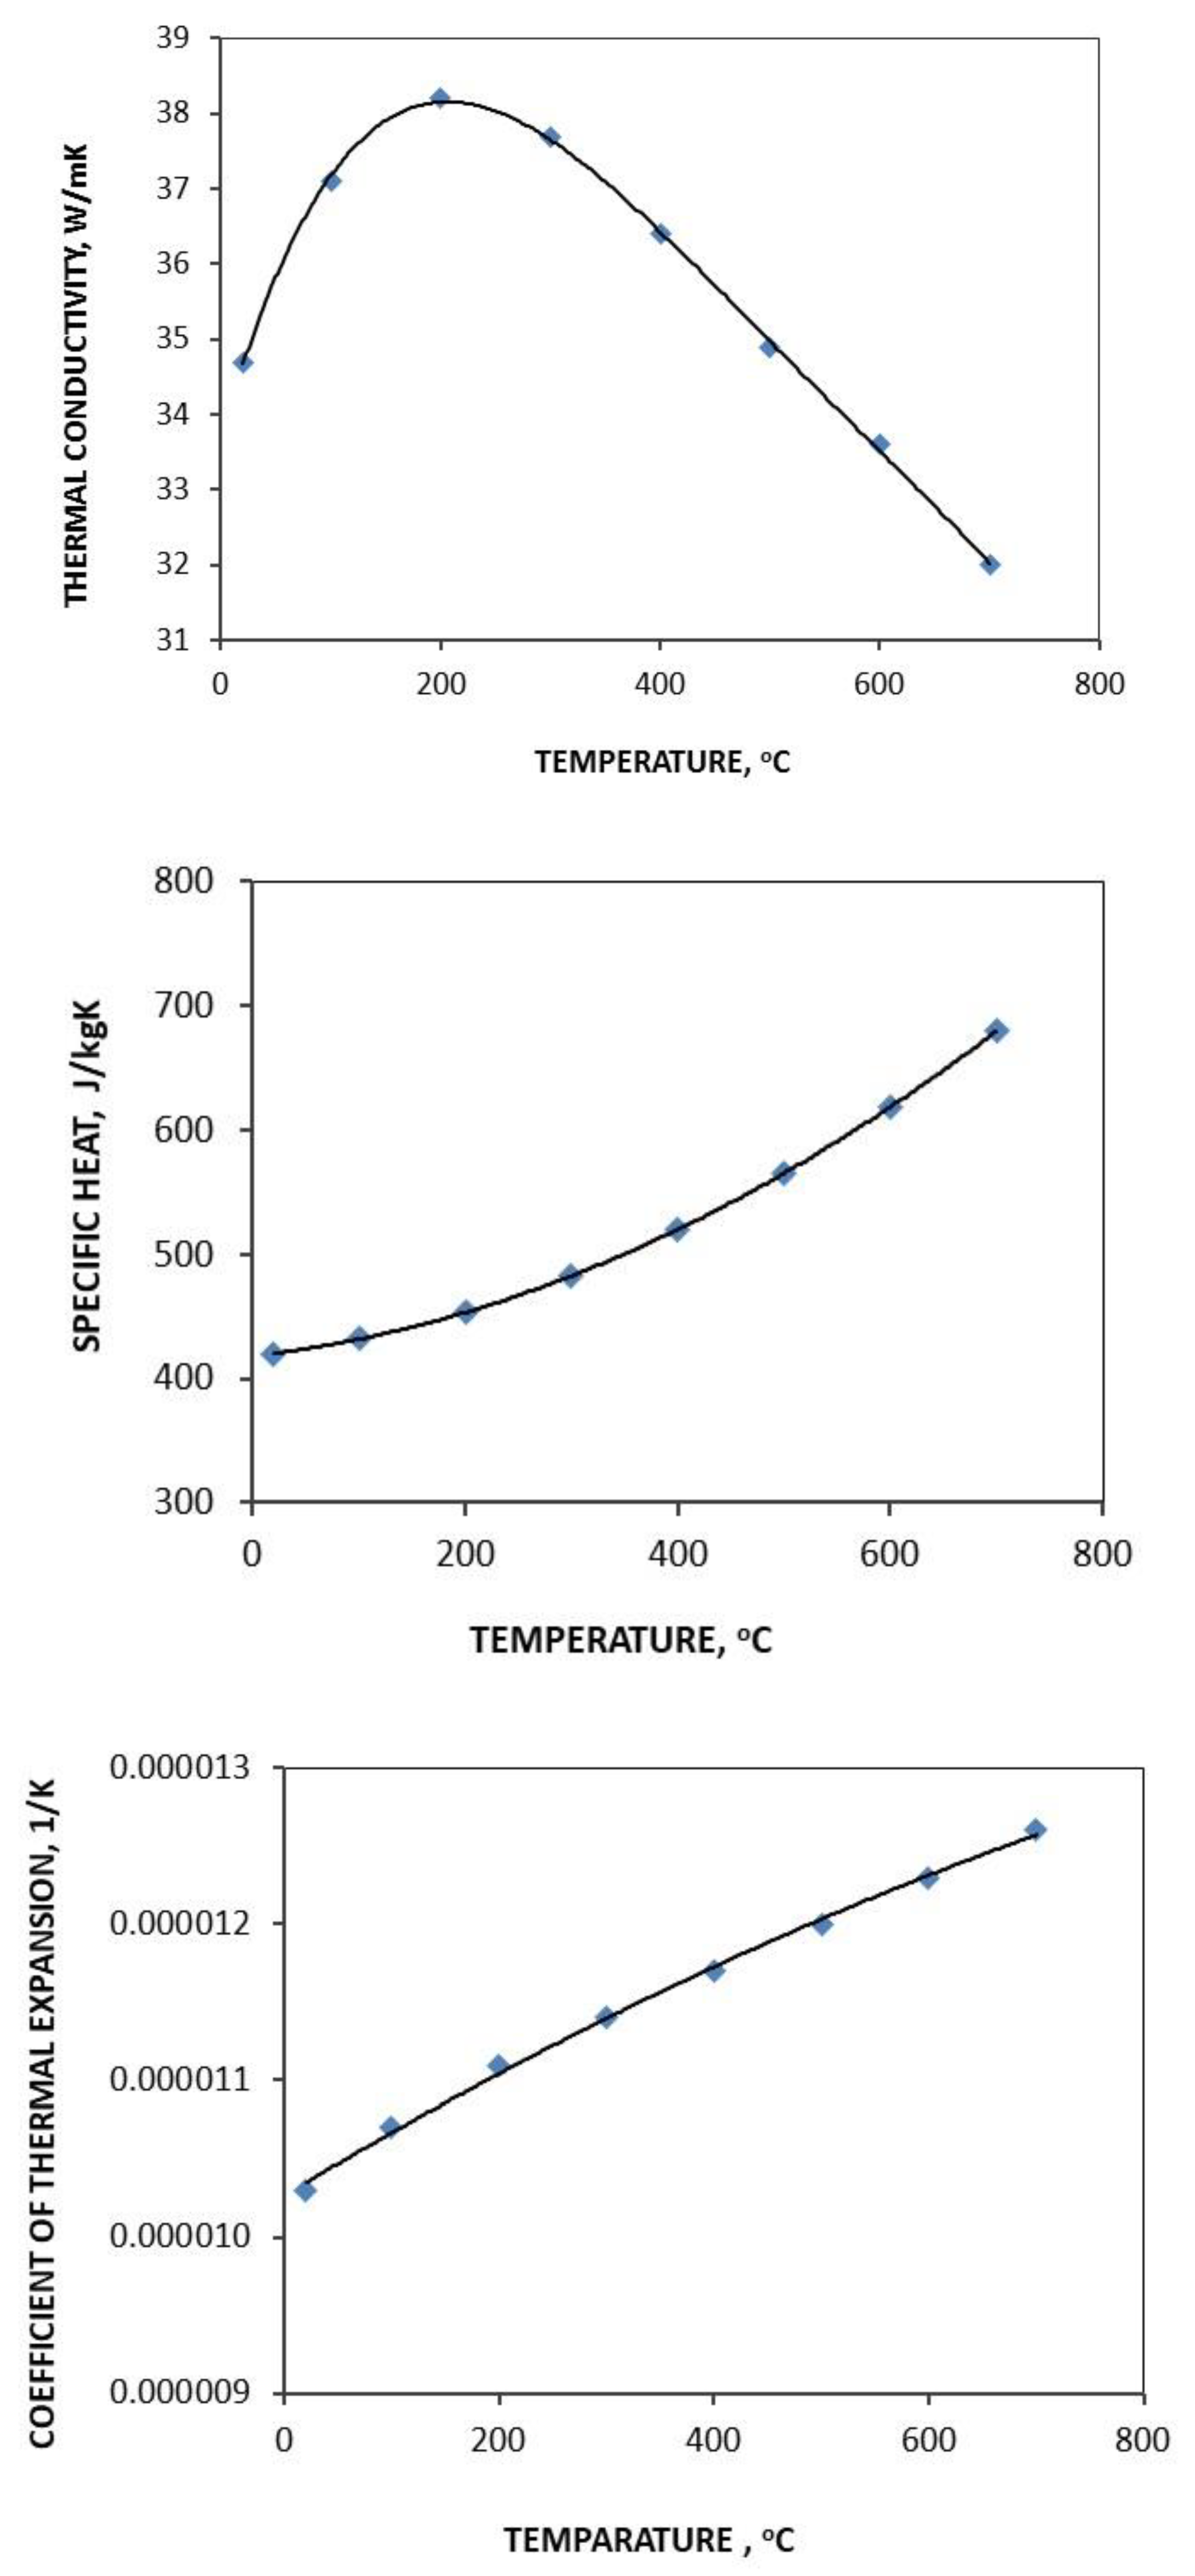
35]. This approach takes into account the fact that an elementary volume of elastoplastic material consists of different sub-volumes, of equal modulus of elasticity and total strain, but differing in yield strength. On this assumption each sub-volume presents perfectly plastic behavior. However, when these sub-volumes are combined, this model describes complex behavior characterized by a multilinear stress–strain curve. The Bauschinger effect was taken into consideration. The studied P92 was assumed to be elastic–plastic with kinematic hardening, while its features, Young’s modulus (
Figure 13) and the thermal expansion coefficient (
Figure 14), were temperature-dependent. The stress versus plastic strain curves during cyclic loading, as shown in
Figure 2, were also temperature-dependent and were determined based on uniaxial LCF tests.
Other physical properties necessary to describe the course of the changes in temperature over time and the mechanical behavior of the material under the conditions of the non-uniform interaction of the time-varying temperature field are presented in
Figure 14. The temperature-independent material density was assumed to be 7800 kg/m
3. ANSYS was used to calculate the variables as a function of time of temperature, stress, and strain fields. This program defined the boundary conditions relating to heat transfer in a wide range of cases, depending on the available data on the physical processes taking place in the systems under consideration. One of the basic ones was heat transfer by convection at a set, usually time-varying, ambient temperature. The value of the heat transfer coefficient was defined as a constant or variable value as a function of time. The correct selection of the value of this coefficient or the relation describing the course of its changes determines the accuracy of the mapping of temperature fields in the element under consideration [
22,
36]. In this case, it was possible to use the results of the temperature measurements at selected points of the devices under consideration for the process of the validation of the developed device model.
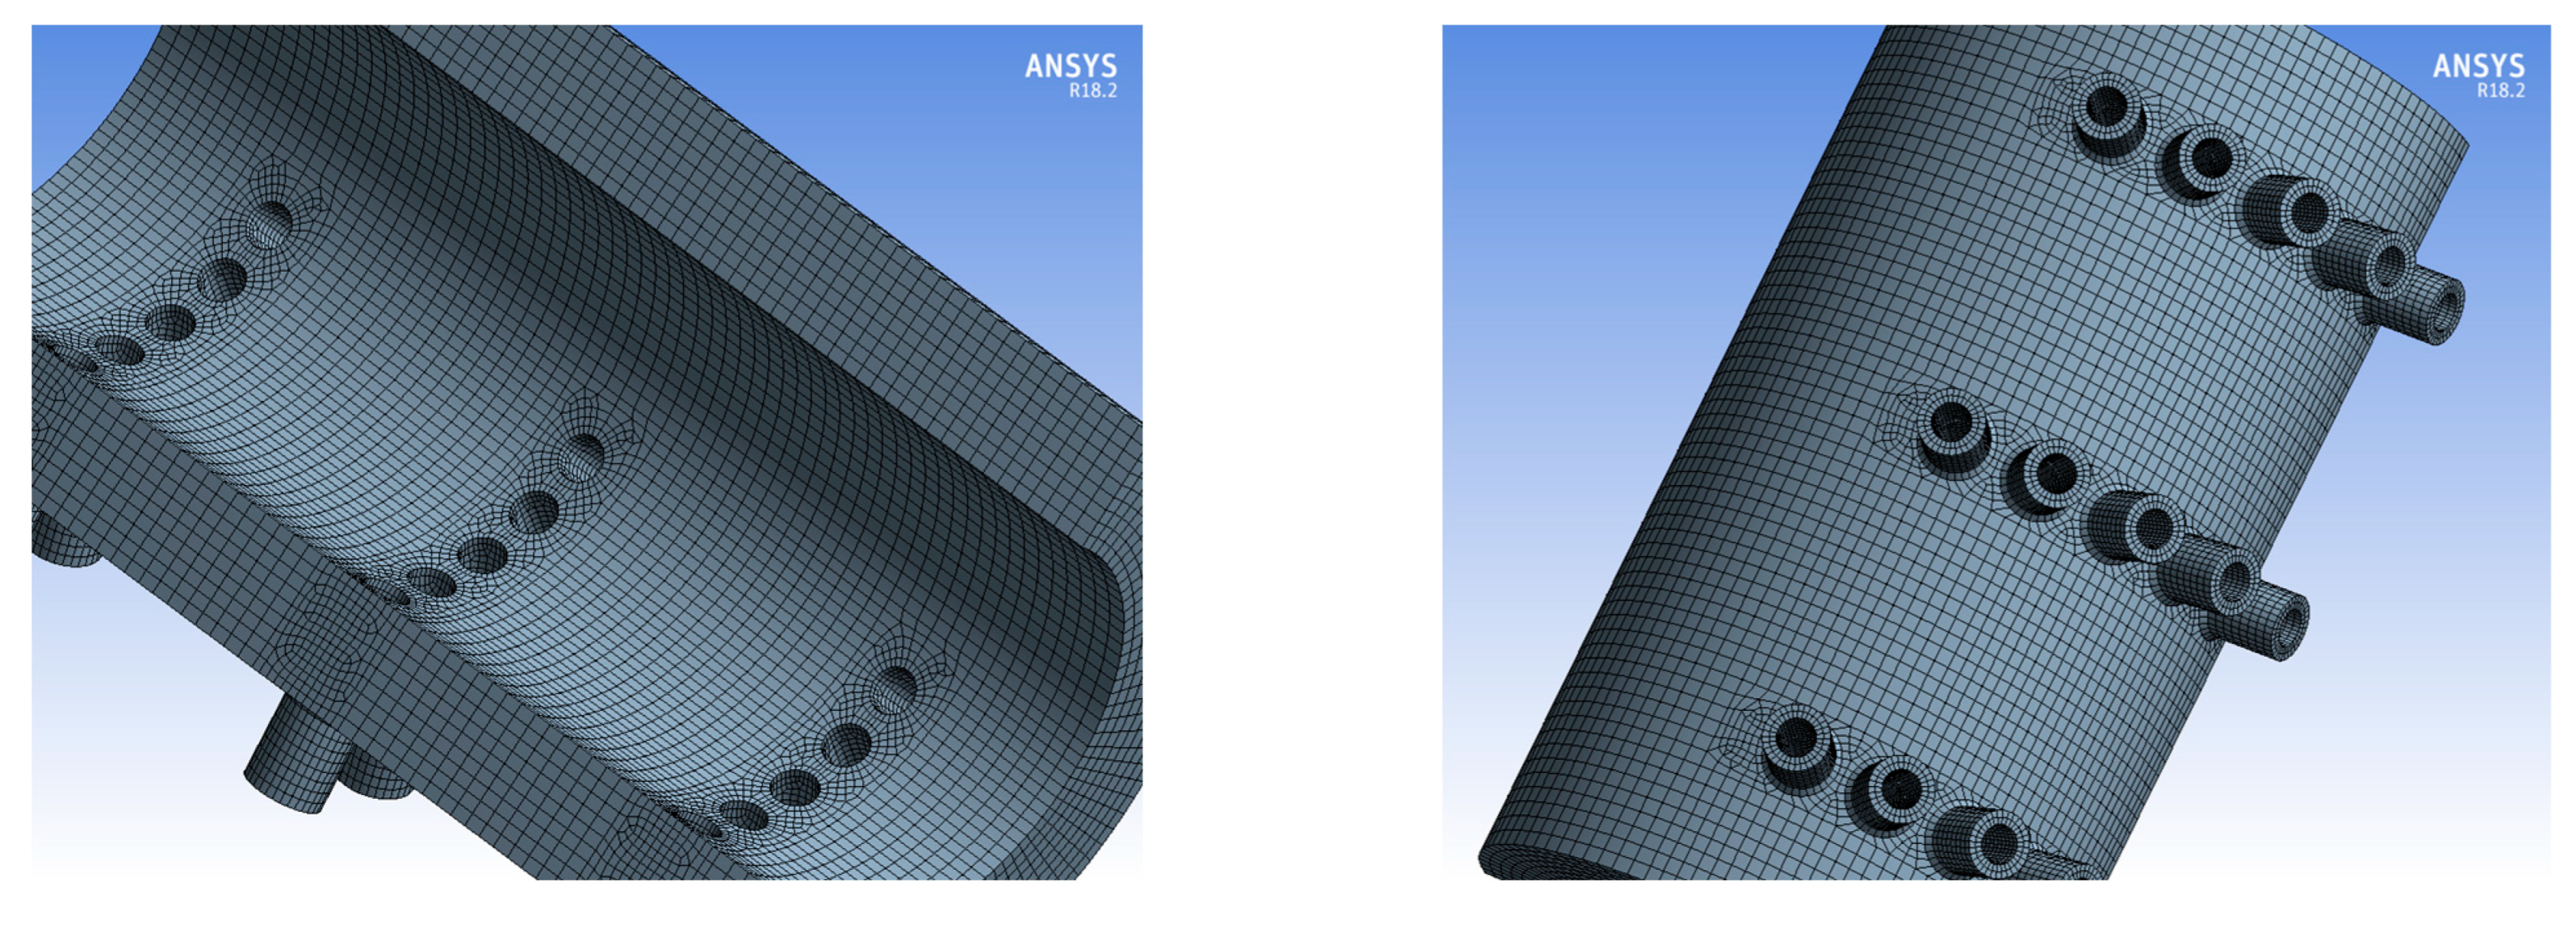
Figure 15 shows a fragment of a steam superheater header with outlet pipe connectors. The fragment was divided into 56,000 solid elements. The model in
Figure 15 shows a part of the superheater header separated by an intersection with a vertical plane of symmetry along the axis of the header and two planes perpendicular to its axis. Due to the length of the header, which was a thick-walled pipe with a large length-to-diameter ratio with holes in its walls and stub pipes, the separated part was treated as a section of the header of infinite length.
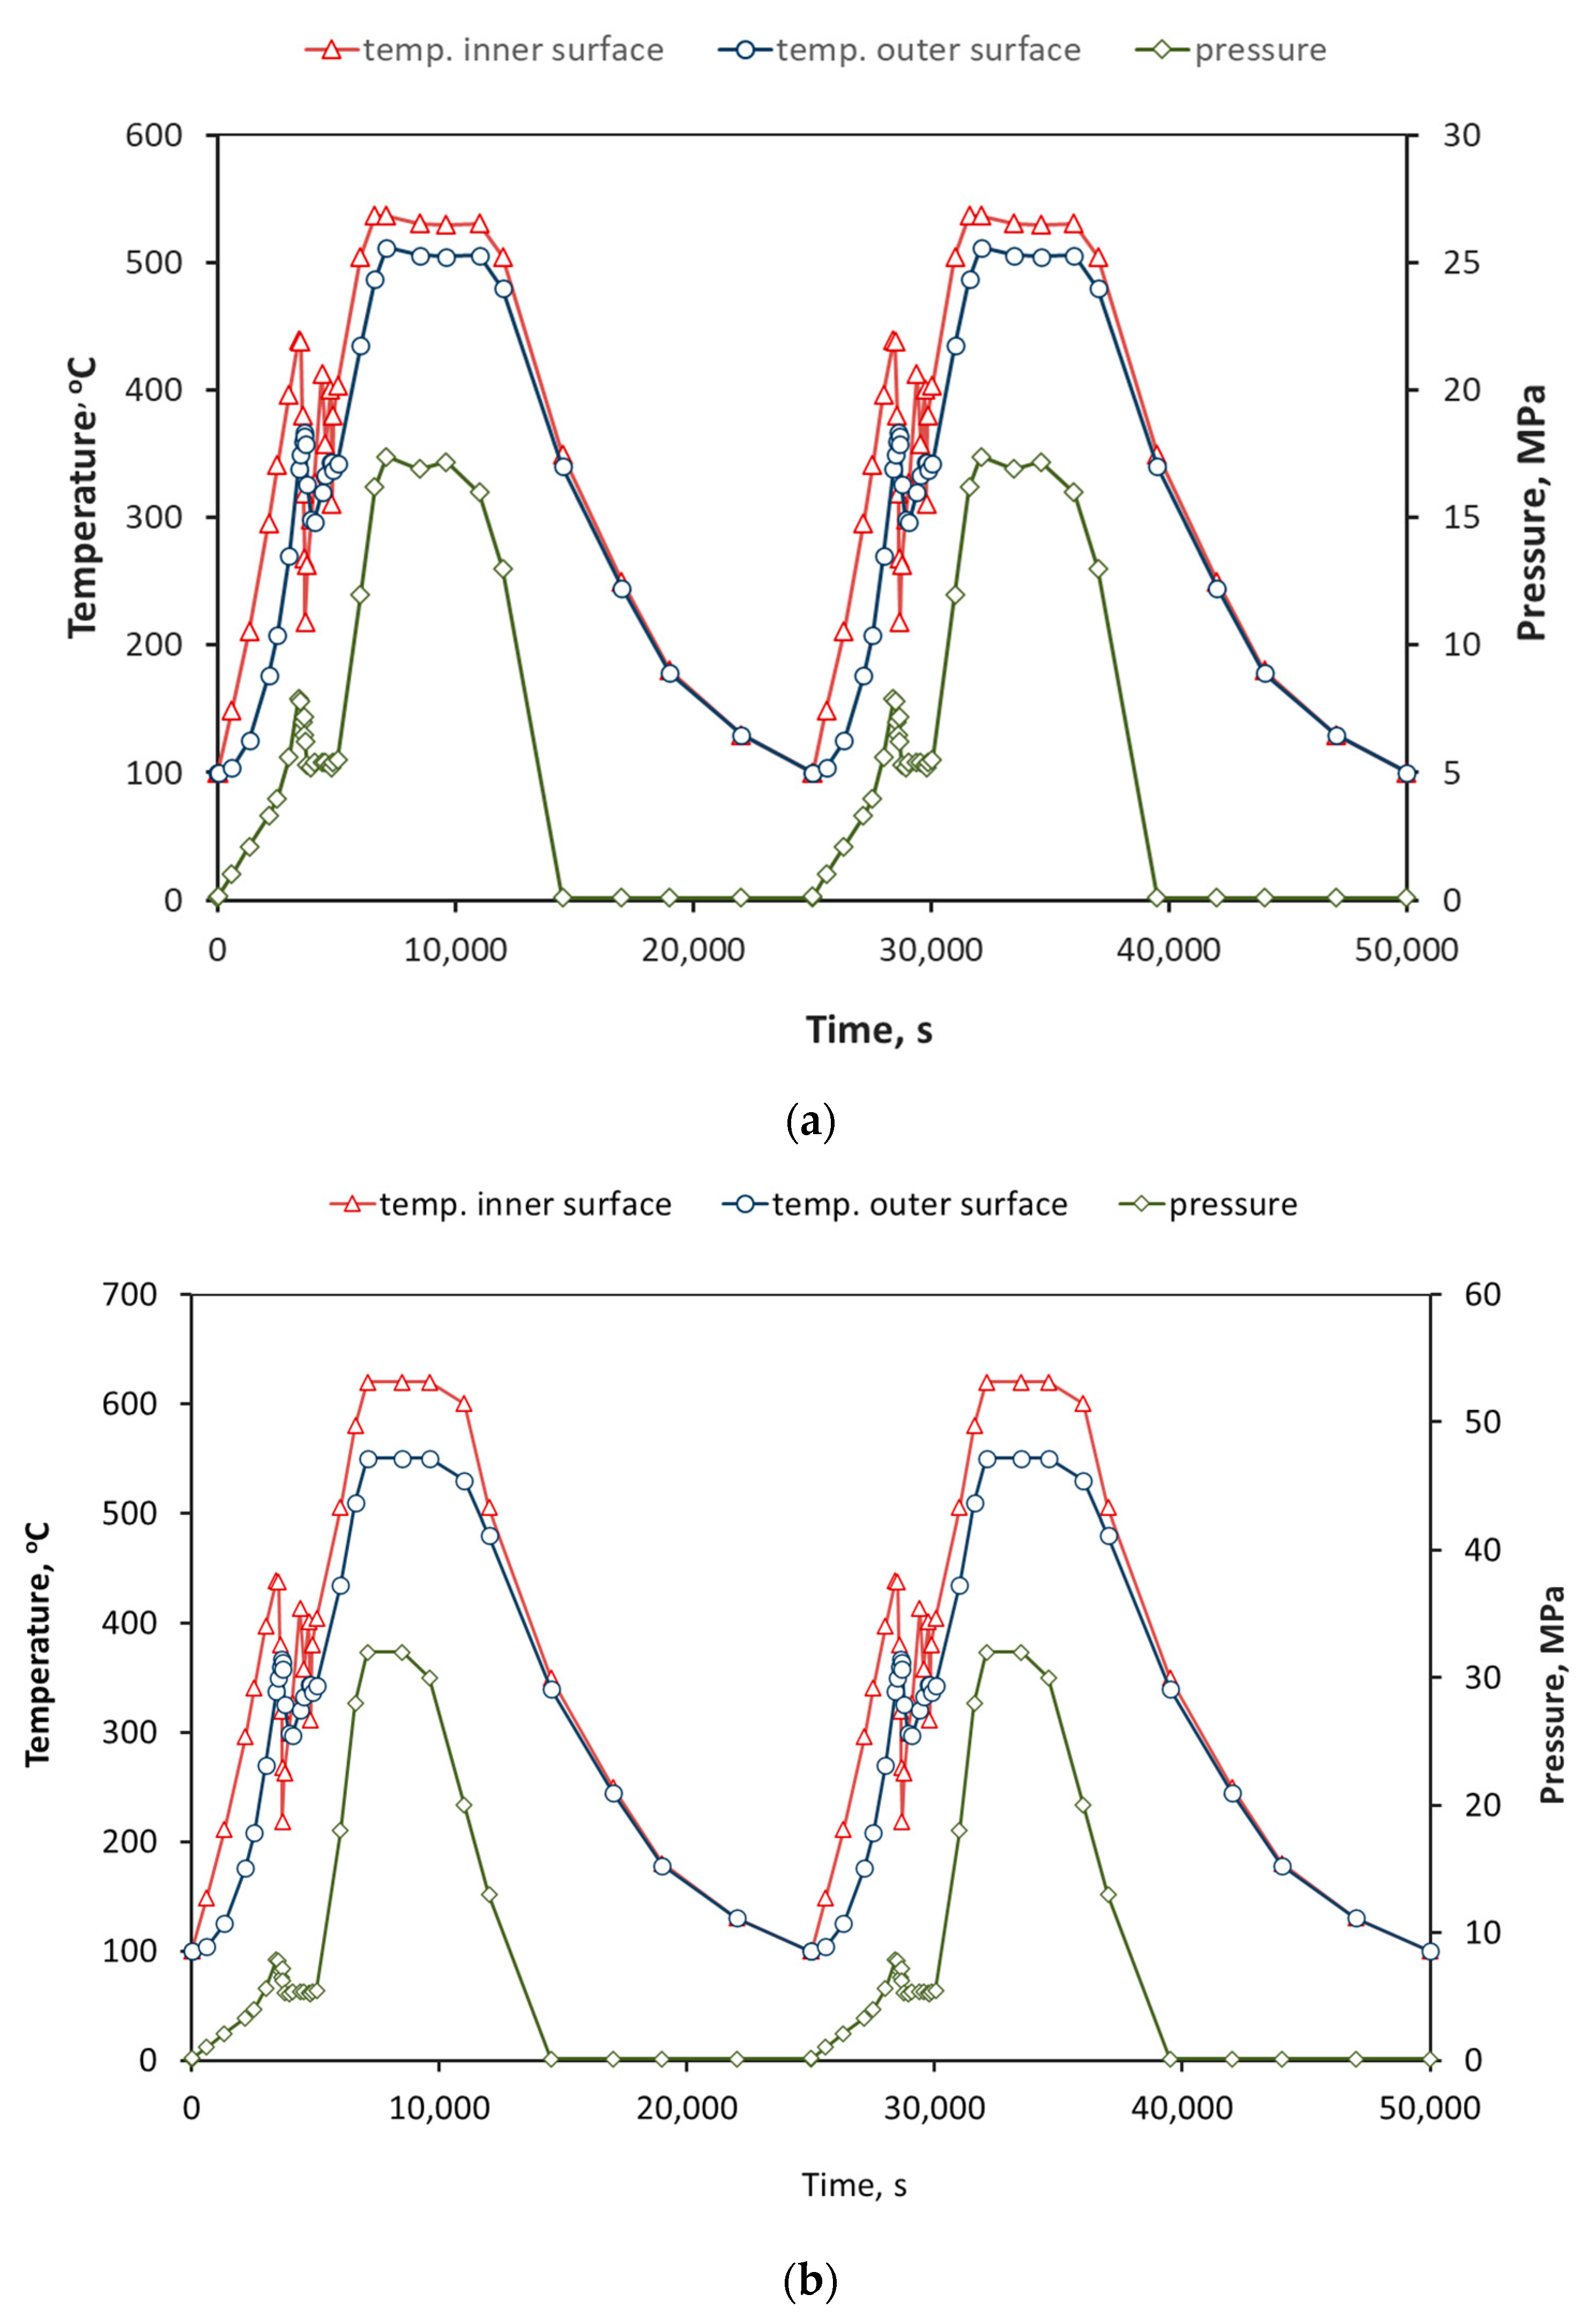
The considerations were carried out by assuming changes in the steam temperature on its inner surface and the inner surface of the header; the relationship is shown by the red line in
Figure 12b. On the outer surface of the header and the spigots, the temperature changes as a function of time were assumed, as described by the course of the relationship shown in
Figure 12b (marked in blue). Both the characteristics of the medium’s temperature changes on the inner and outer surface show periods of a slow monotonic temperature increase, temperature oscillation with high rates of increase and decrease, an almost constant temperature, and slow changes during the cooling of the power unit. The period of the steady-state temperature was assumed to be relatively short compared to the real-time steady operation of the power unit, due to its low influence on the variable values of the stresses that cause fatigue processes in the material. The characteristics of the pressure changes on the inner surface of the header related to the course of the temperature changes are shown in
Figure 12b (marked in green).
A wide range of changes in the temperature of the steam and the rate of its flow through the superheater header, as well as the changes in its state during the start-up period of the power unit, were examined. It was assumed that the heat transfer characteristics would also change in the operation cycle of the superheater header, which was reflected in the modeling process of the heat flow by assuming a variable heat transfer coefficient as a function of time [
22]. In the standards used by designers of pressure vessels subjected to variable temperature [
24], constant values of the above-mentioned coefficients were assumed: 1000 W/m
2K for steam and 3000 W/m
2K for water. It should be noted that the value of this coefficient in transients may significantly exceed the given numerical values, as evidenced by previous measurements and calculations [
22,
23,
32]. In our calculations, three selected values of the heat transfer coefficient of 3000, 15,000, and 45,000 W/m
2K were adopted. Such a wide range of values was intended to determine the intensity of the influence of this coefficient on the variables as a function of the time of the temperature field inside the superheater header and the related variables of the stress and strain component fields.
5. Fields of Temperature and Stress Components in a Superheater Header
Calculations were made for two simulated operation cycles of a power unit with a superheater header of P92 steel, including the start-up with temperature oscillations occurring during this period, a short steady-state operating interval, and slow cooling (
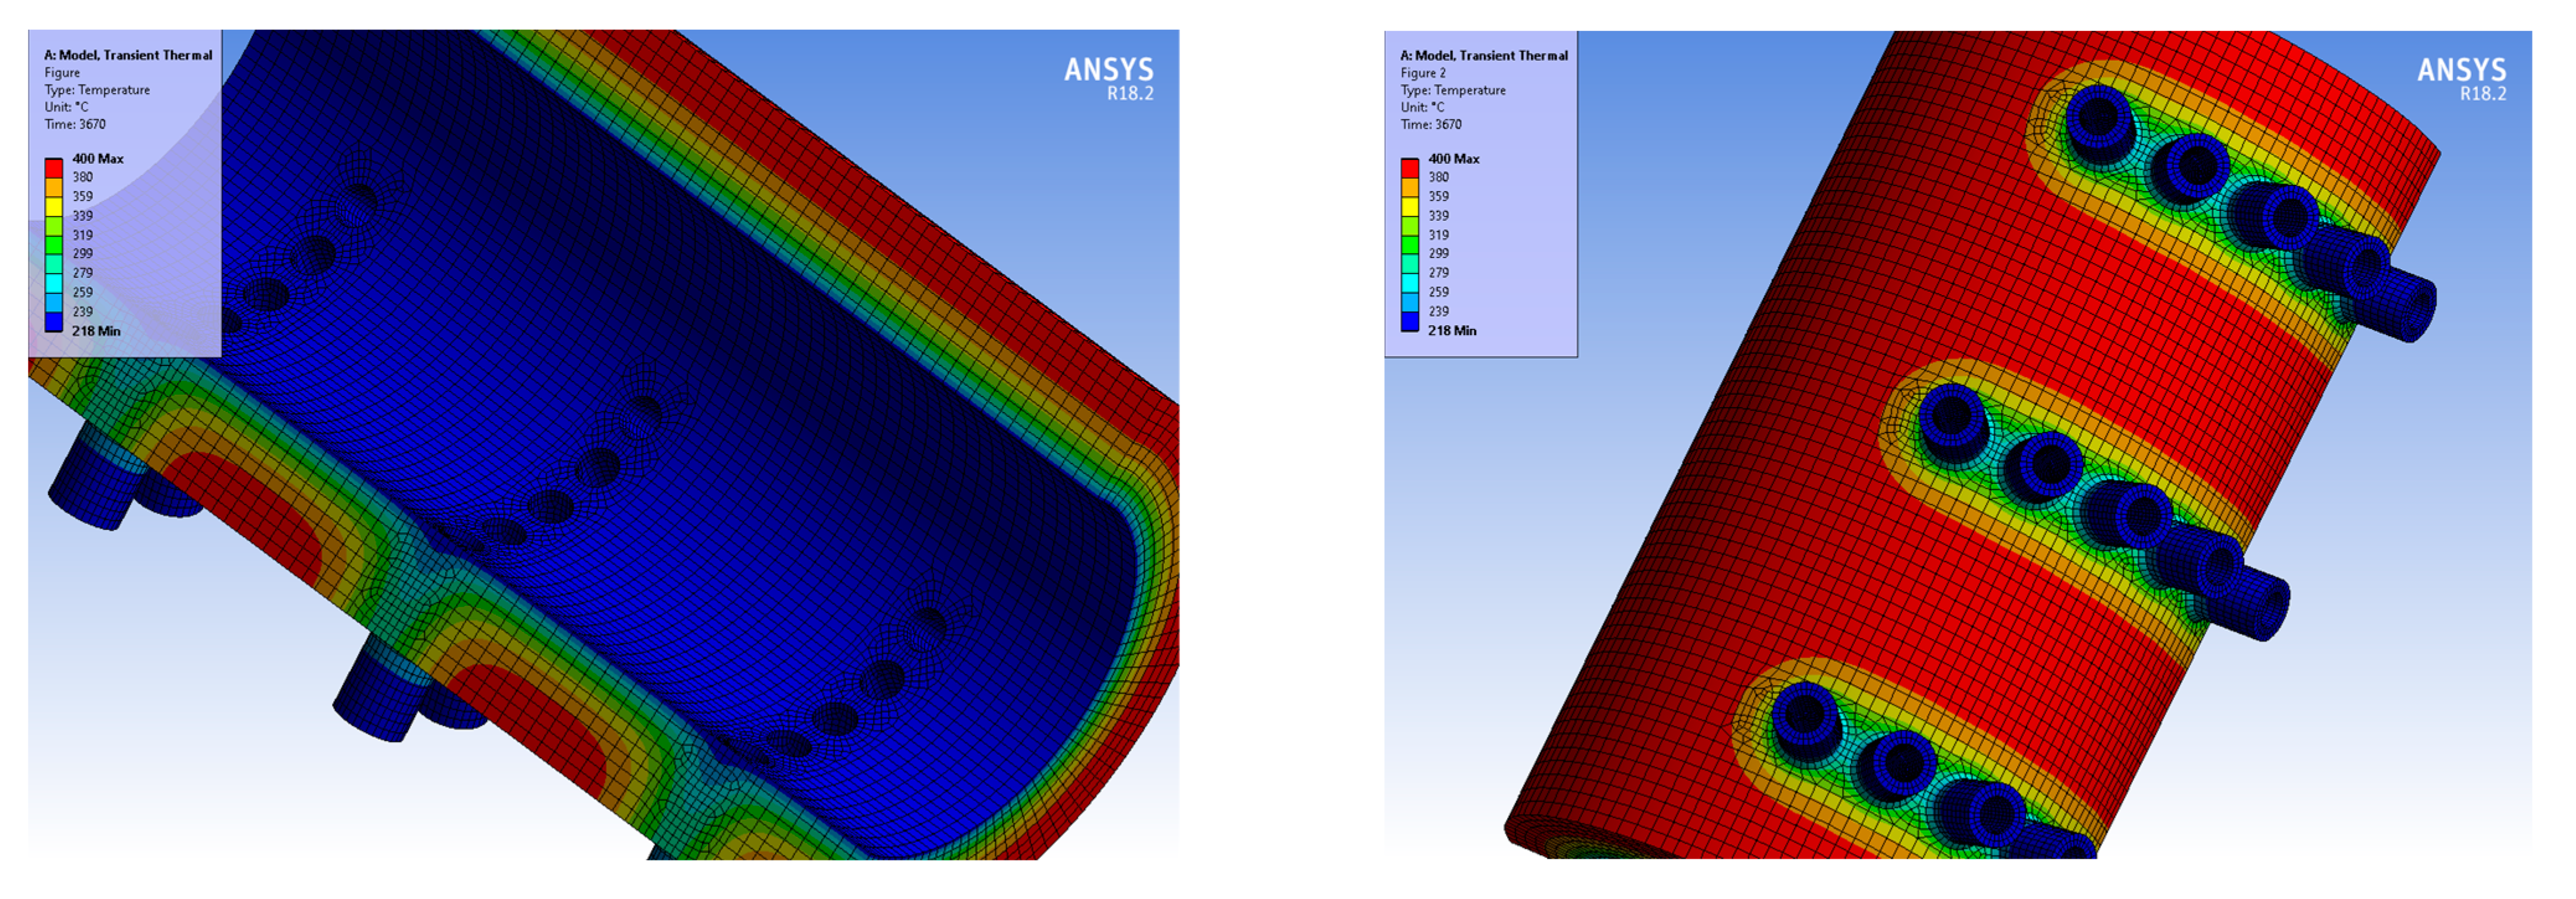
Figure 12b). Time-varying temperature fields were determined in the entire volume of the header section under consideration. Examples of temperature distributions on the surface of the superheater header and in its selected cross-sections for selected moments are shown in
Figure 16. The temperature distributions presented in
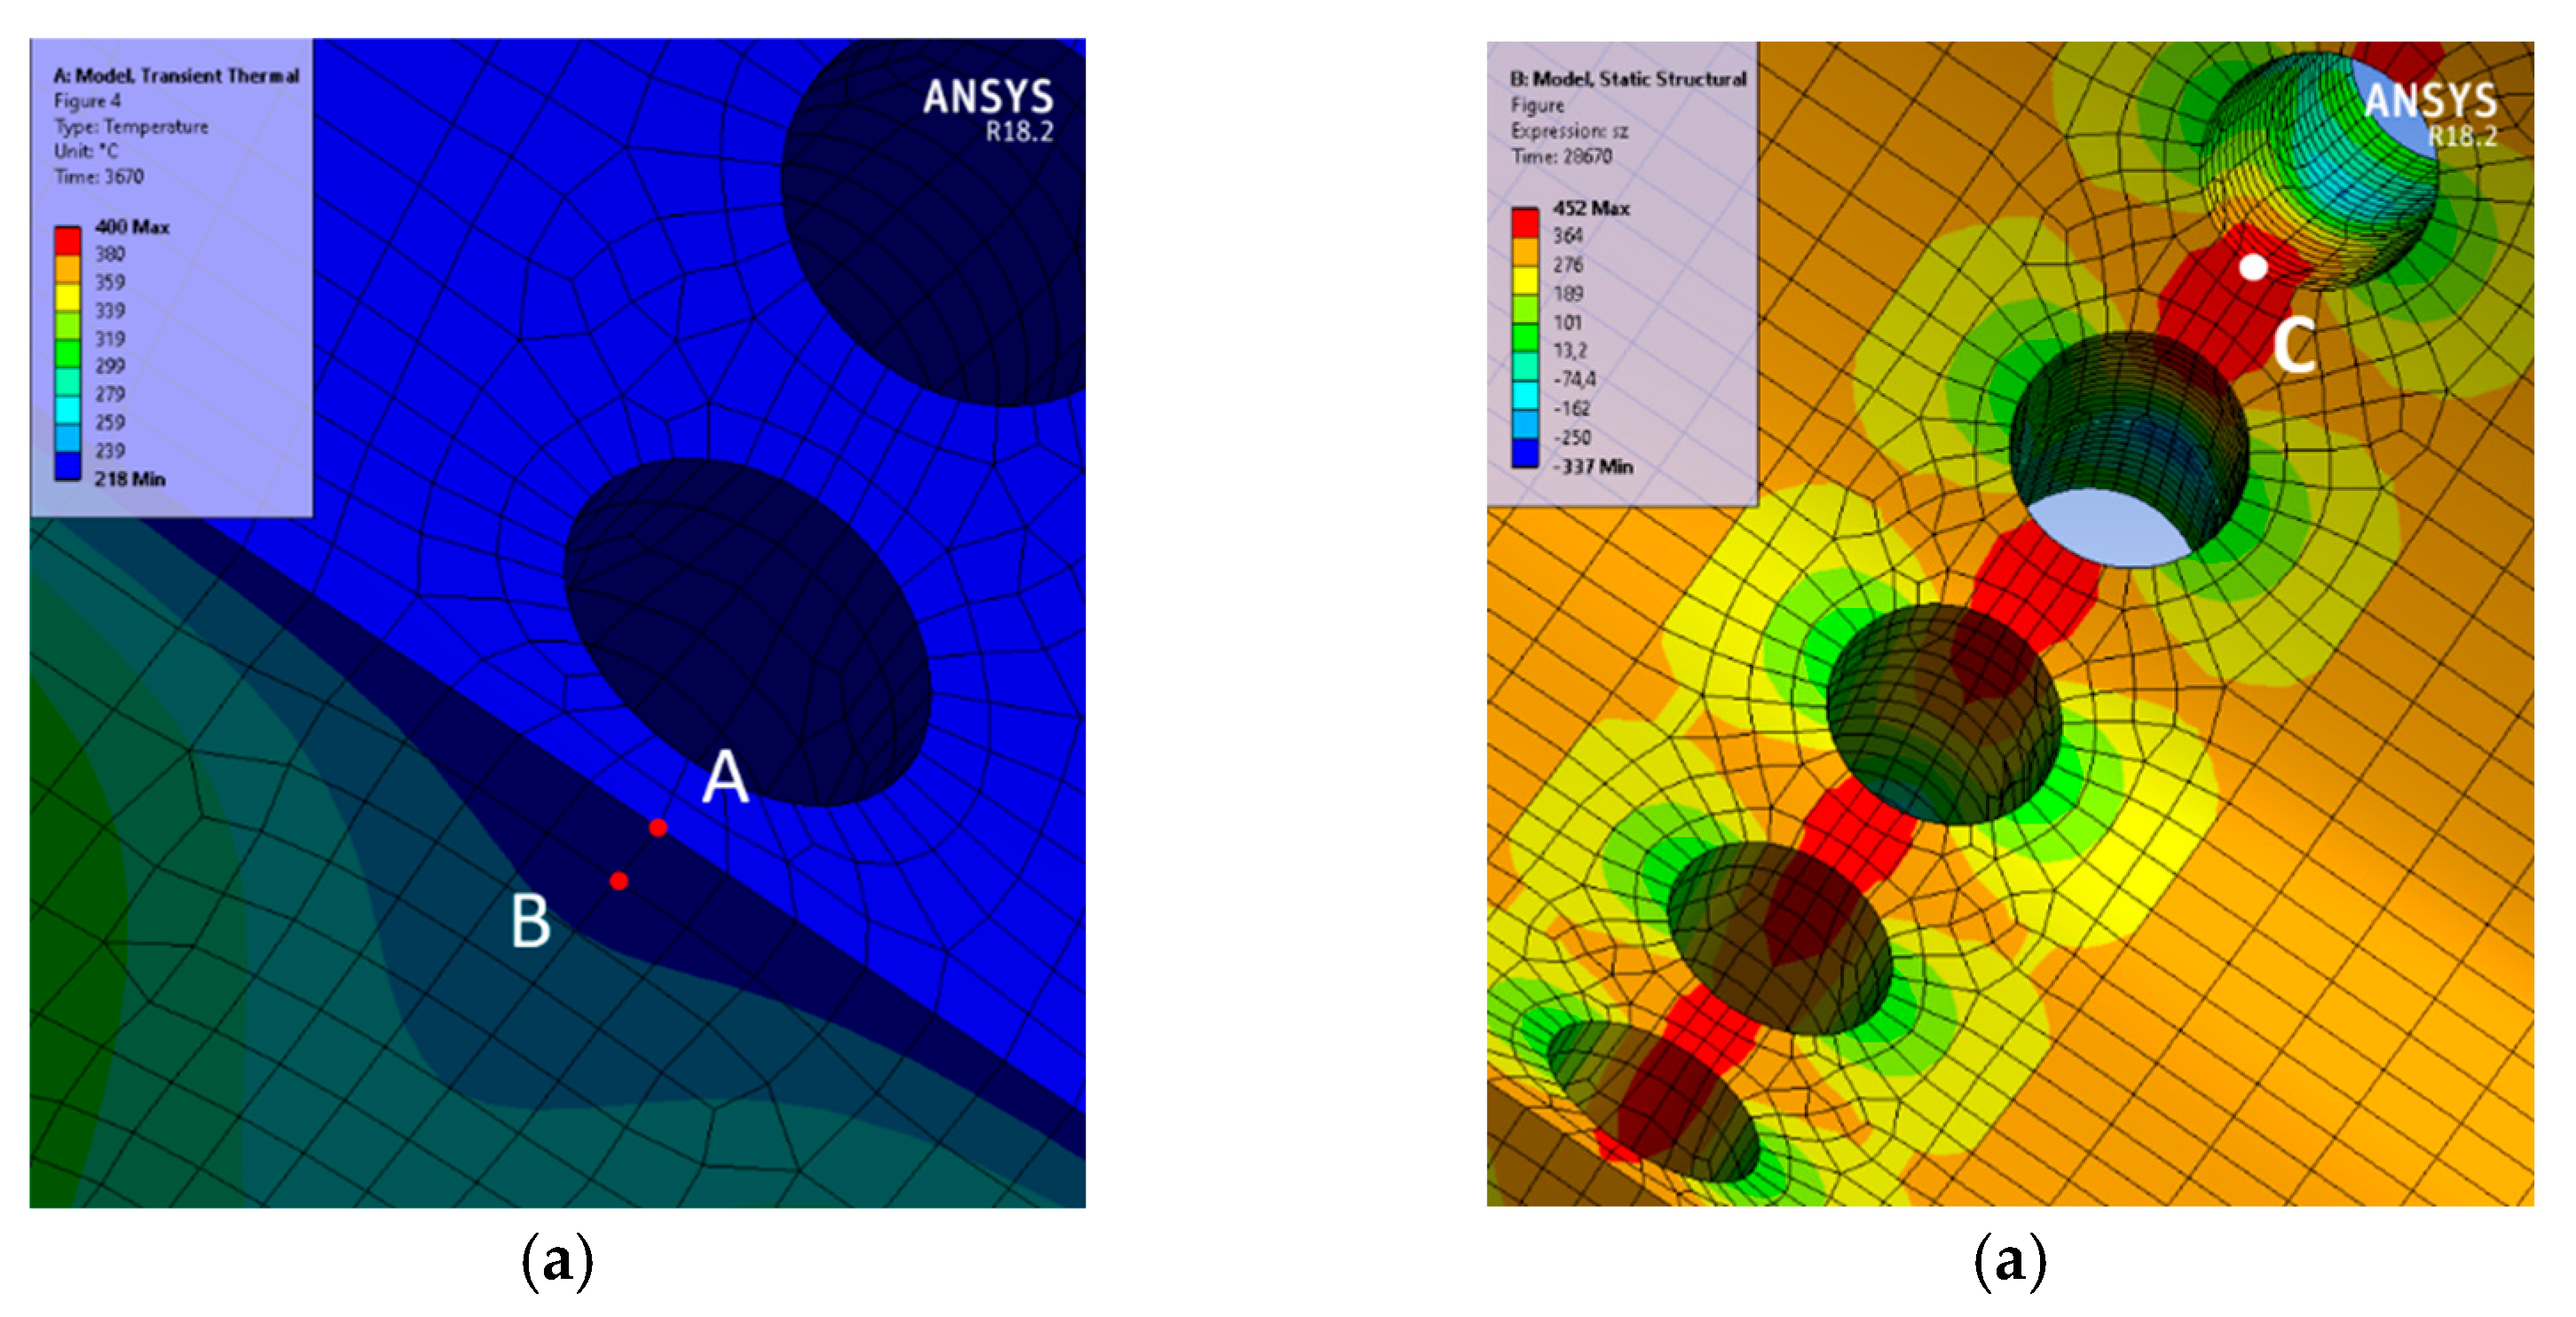
Figure 16 show a significant variation in the volume of the model under consideration, which was particularly visible during periods of oscillations in the course of the variable steam temperature. To illustrate the time-varying unevenness of the temperature distribution, two points, A and B, were chosen (
Figure 17a) near the steam outlet holes to the spigots.
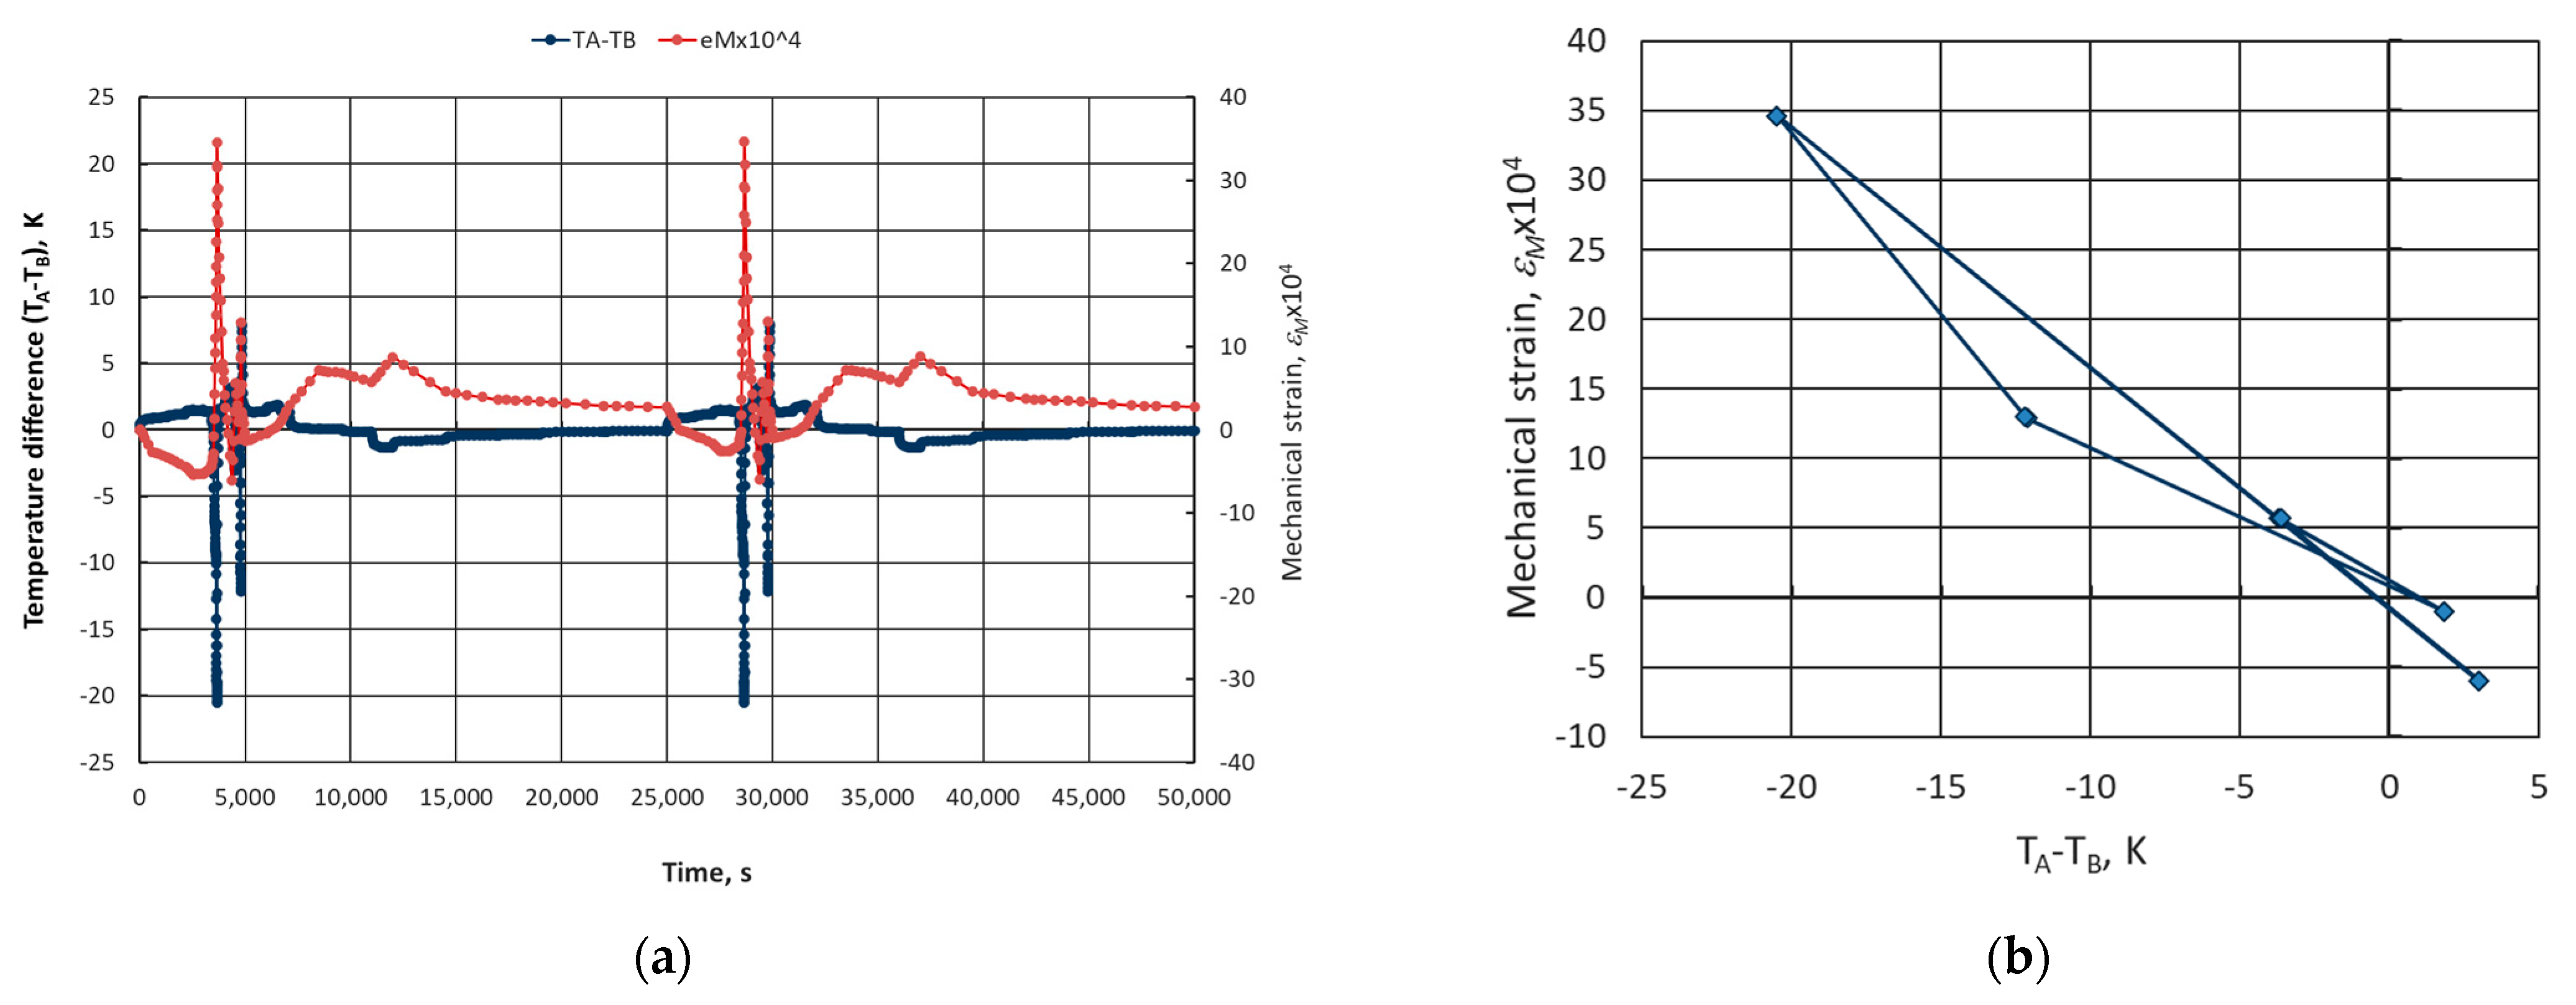
Figure 18a shows the variable value of the temperature difference at points A and B with the visible time intervals at which the difference reaches the greatest values. Within these ranges, extreme thermal stresses were expected.
At the next stage of the strength assessment of the header, we calculated the variable strain and stress fields. The selected calculation results are presented in
Figure 17b,
Figure 18,
Figure 19,
Figure 20 and
Figure 21.
Figure 17b shows the distribution of the axial component
σz of the stress state on the inner surface of the header for a characteristic moment during oscillation, with visible areas of stress concentration in the vicinity of the outlet holes. Due to the cracks occurring in these areas during operation, the state of the stress and strain at a selected point of one of these areas, at point C, was analyzed in detail (
Figure 17b).
The course of the changes in the temperature difference at points A and B and the axial mechanical strain versus time at point A, as well as the characteristics of the relationship between the difference
TA-
TB and the axial mechanical strain
εM, show that at this point, the cycles of the variable mechanical strain and thermal strain remained in opposite phases (OOP) with each other. Further analysis was conducted on the course of the changes in the components of the state of the stress and strain at the selected point C.
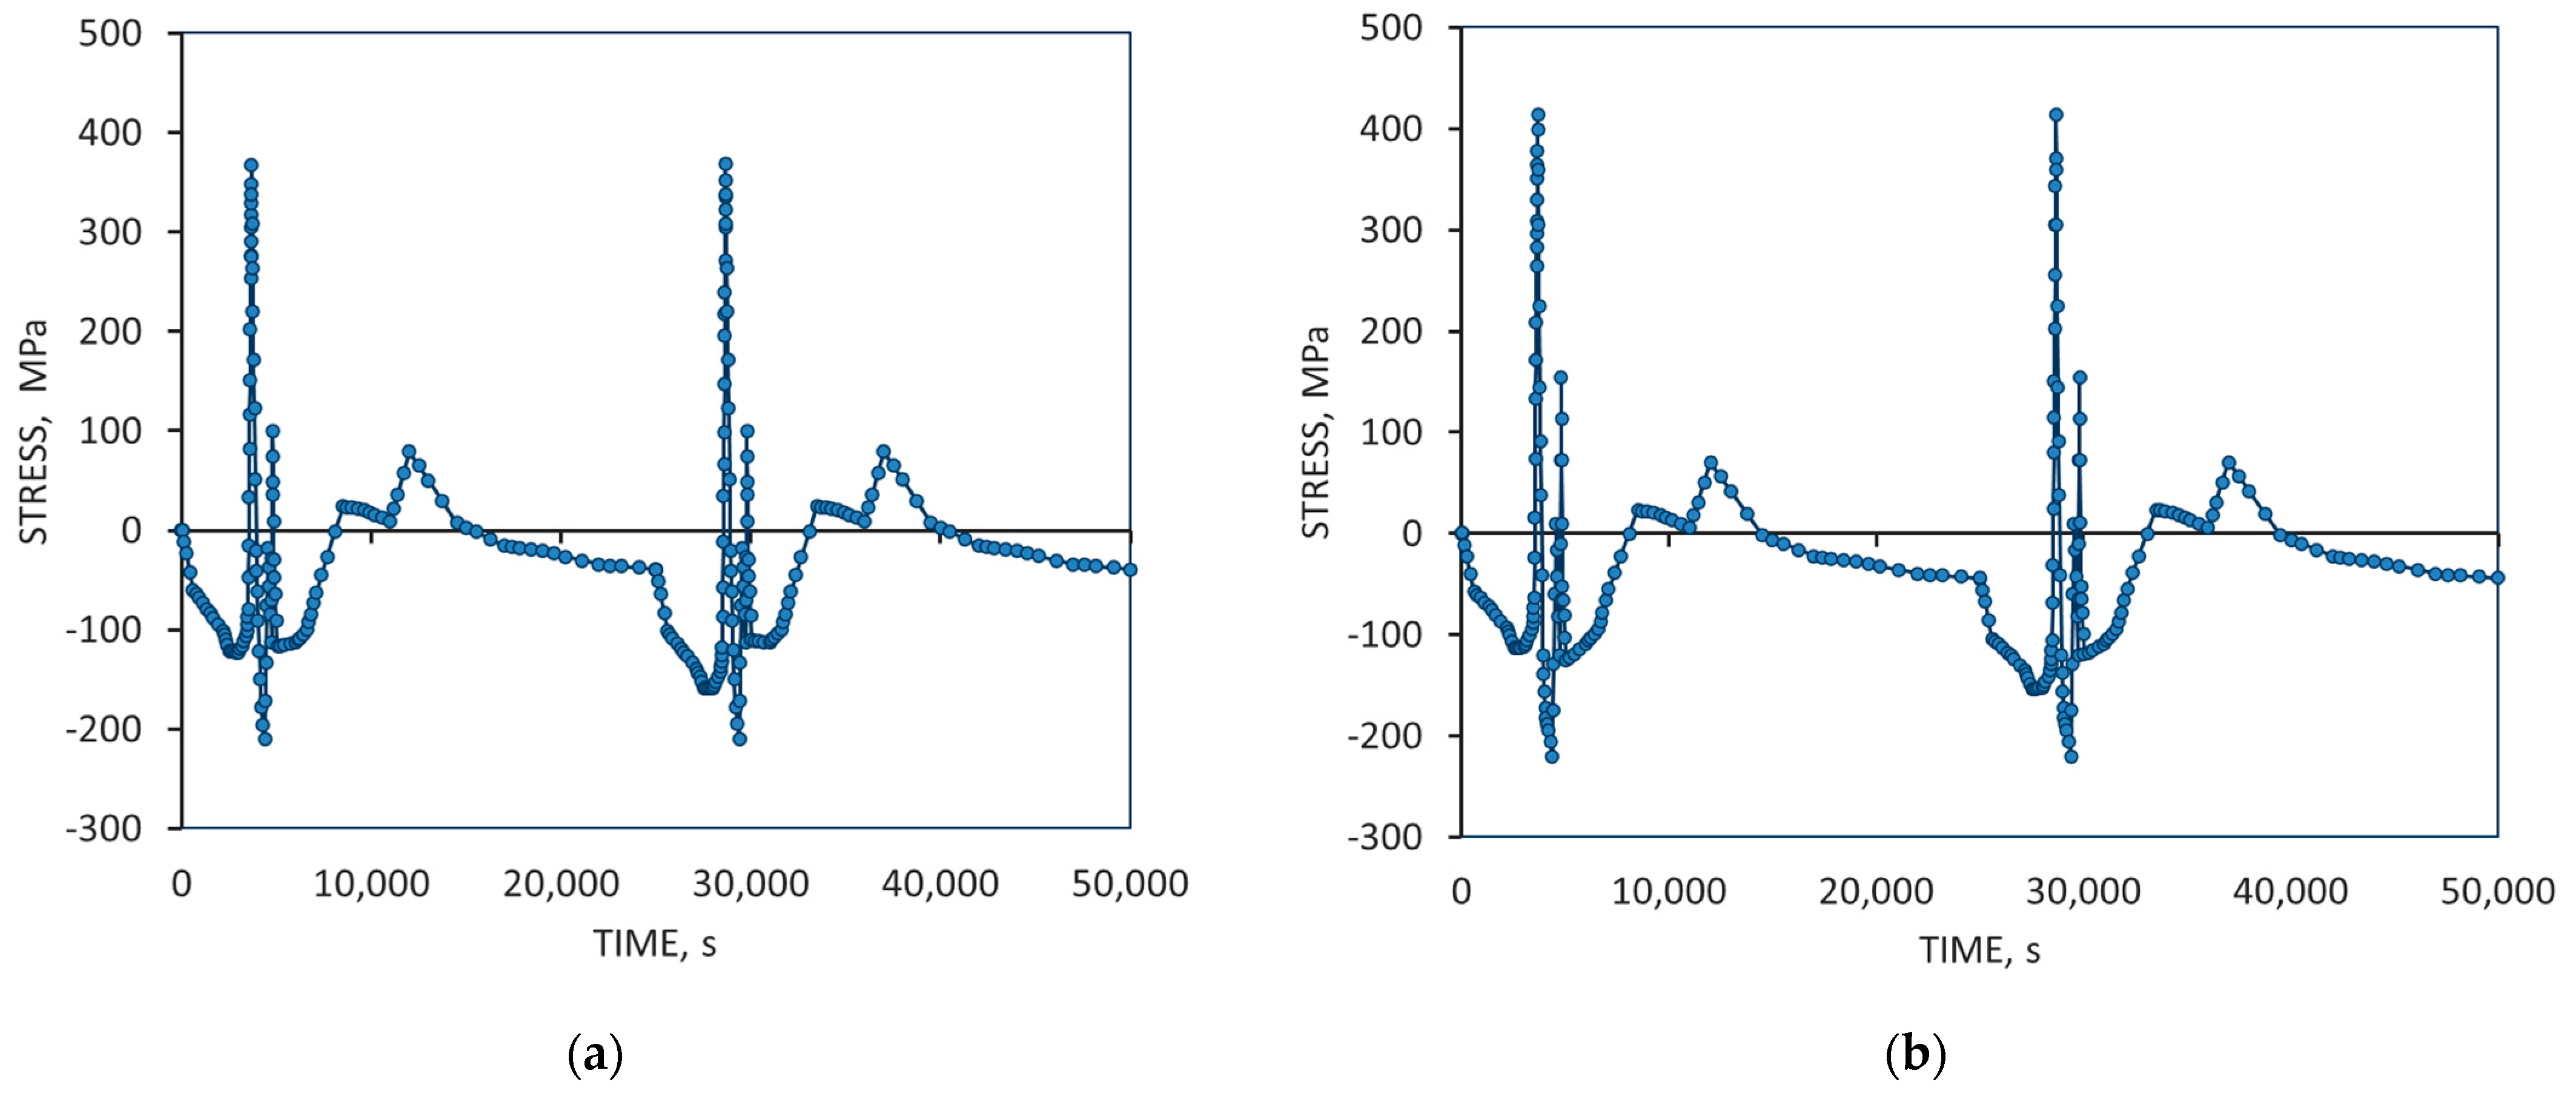
Figure 19 presents the course of changes in time of the component
σz of the state of stress and
εz of the state of strain at point C, determined for the assumed values of the heat transfer coefficient: 3000 W/m
2K (
Figure 19a) and 45,000 W/m
2K (
Figure 19b). The courses of the stress changes
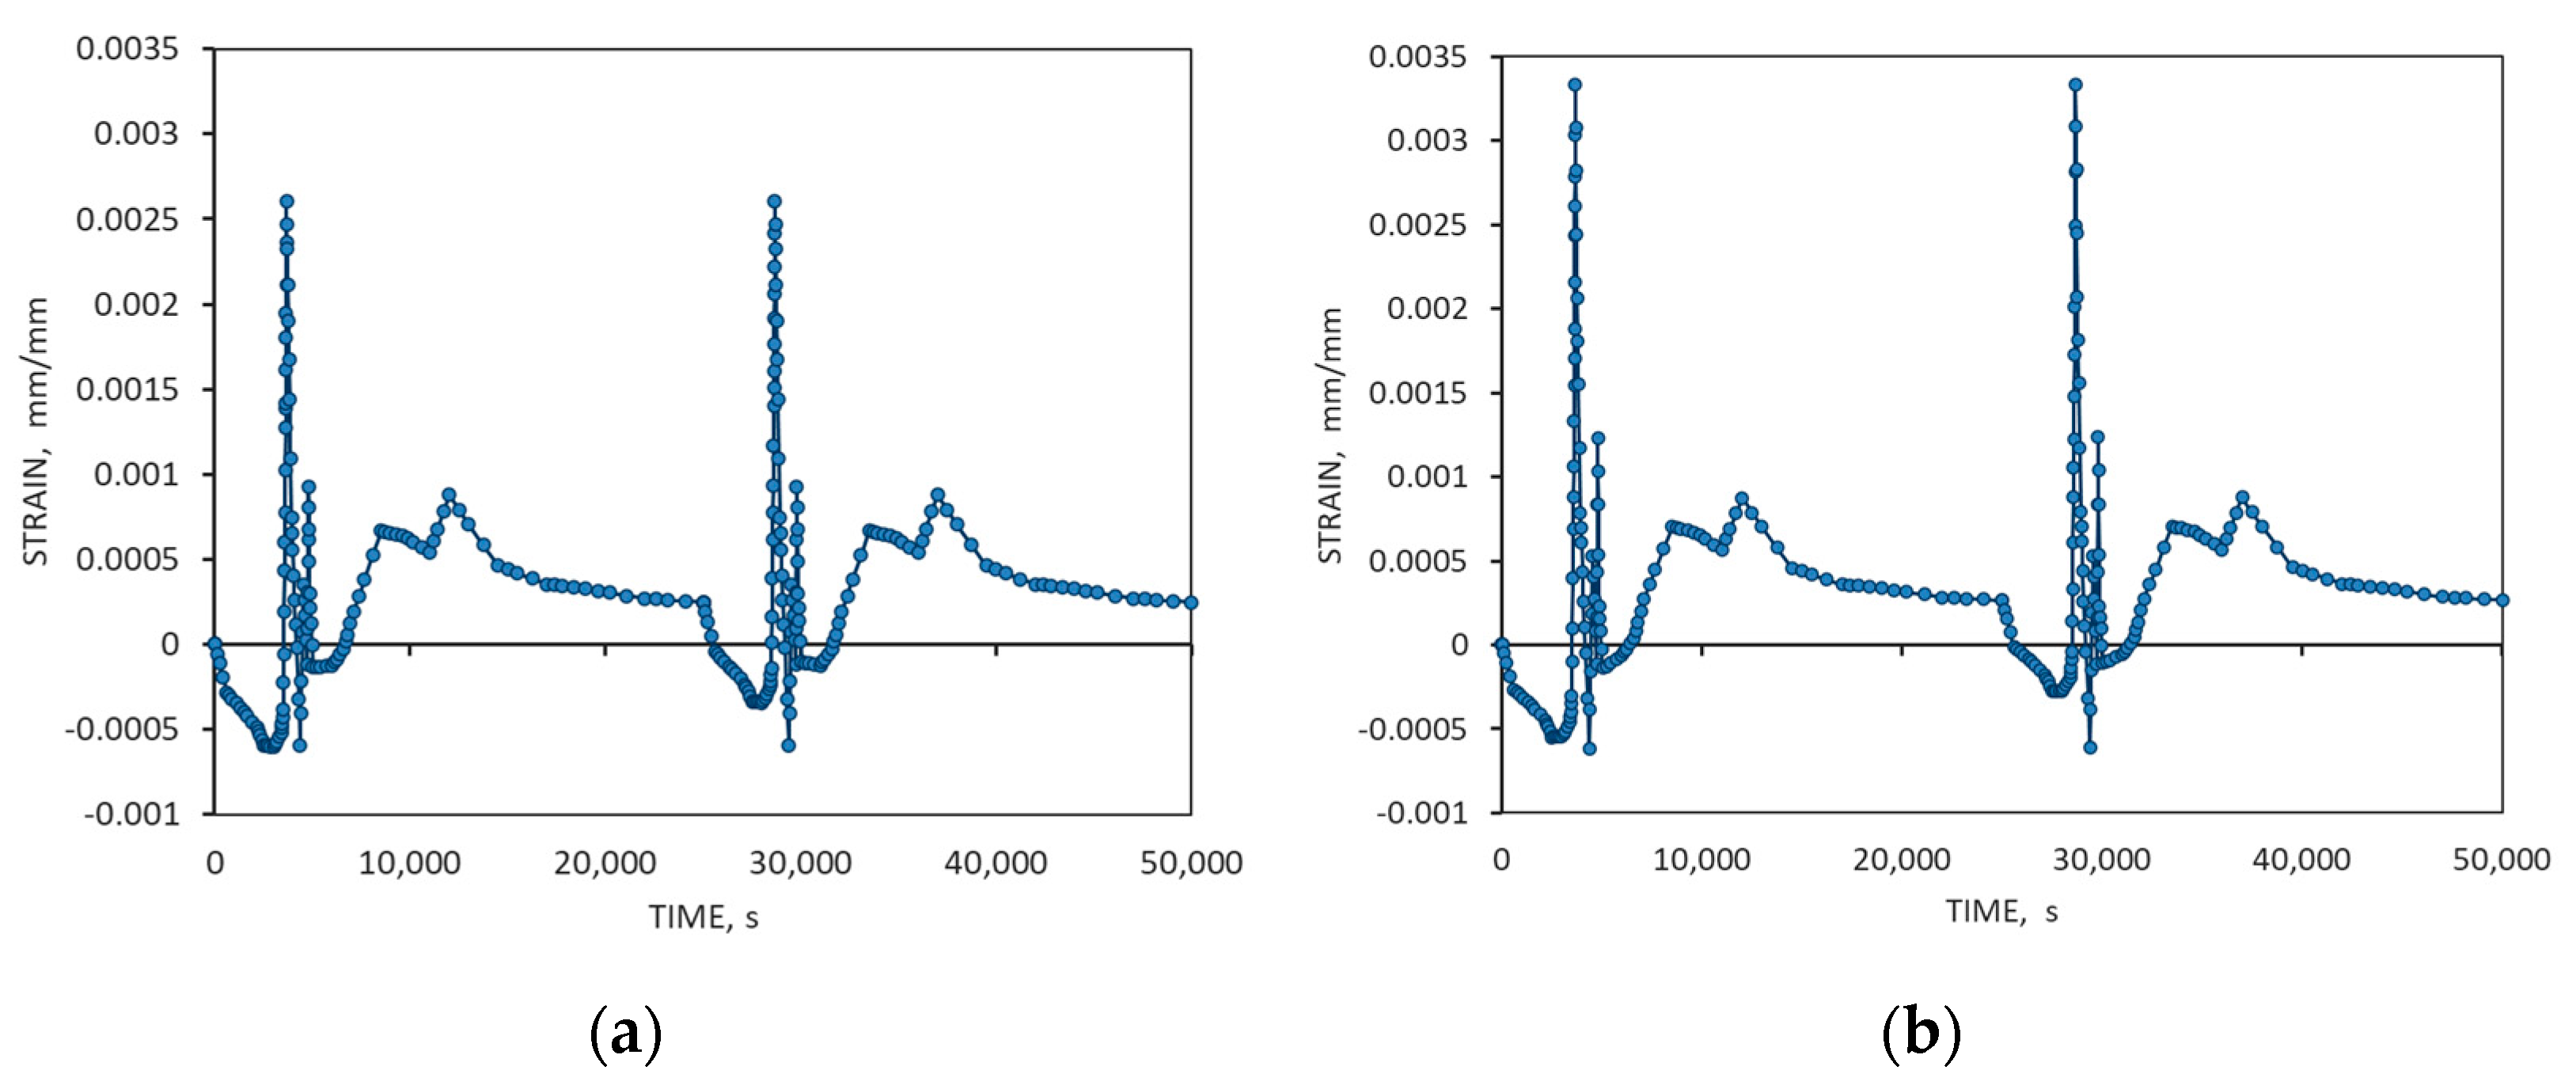
σz showed a slight variation in its values as a function of time for the assumed decidedly different values of the considered coefficient. At the same time, we found that the adopted value of the heat transfer coefficient significantly affected the extreme values of the mechanical strain—
εz (
Figure 20a,b).
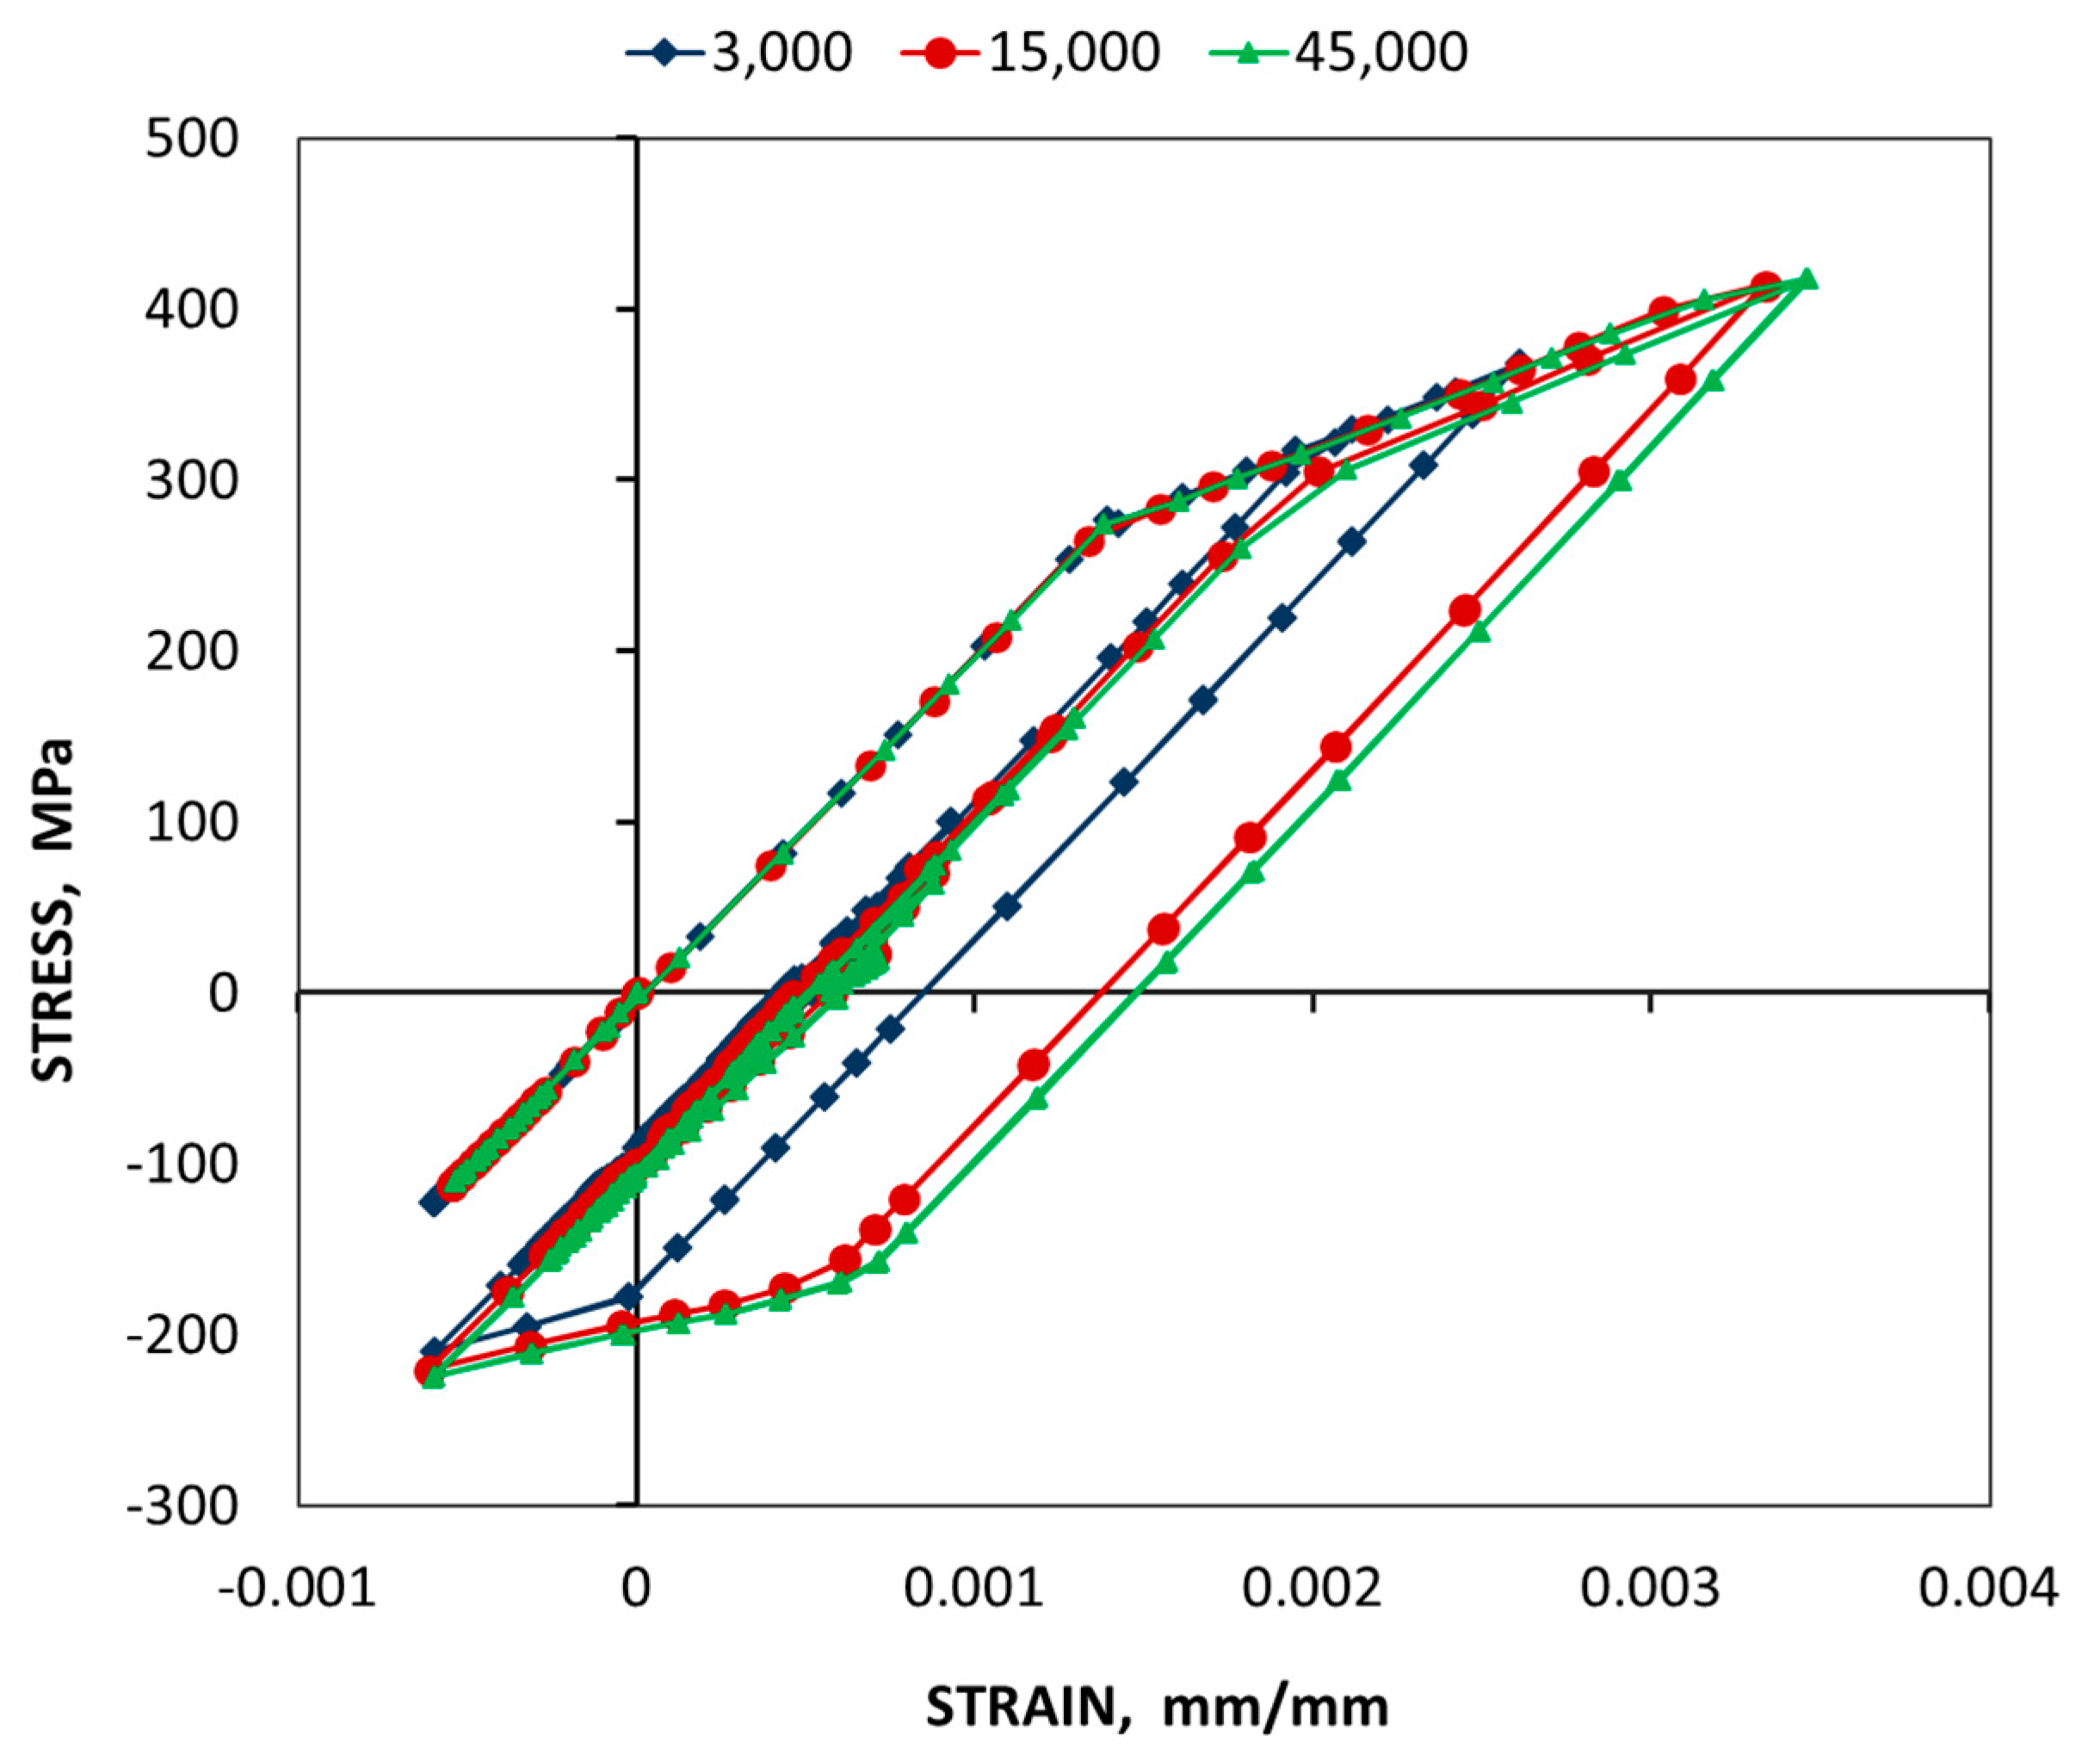
This differentiated influence was further illustrated by examining the course of the hysteresis loops
σz(
εz) determined for the considered point for different heat transfer coefficient values (
Figure 21).
Figure 21 shows a large difference in the values of this coefficient for the characteristics determined for 15,000 W/m
2K and 45,000 W/m
2K, which had little effect on the course of the hysteresis loops or, in particular, on the extent of the plastic strain range related to their width. To a much greater extent, the observed difference affected the range of the strain over a series of smaller values of the coefficient a, which was, upon comparison of the characteristics, determined for the coefficient of 3000 W/m
2K and 15,000 W/m
2K.
This effect was important for the sensitivity of the parameters characterizing the process of the local cyclic deformation to the conditions of heat transfer in the elements subjected to the external influences of the surrounding environment with a variable temperature in the case of contact of solids with the liquid state.
6. Discussion
The presented research results and calculations were used to try to define the issues related to the process of assessing the durability of power equipment components made of P92 steel, which were subjected to the impact of variable temperature and related thermal stresses and their impact on fatigue phenomena. These issues are important due to the safety of currently utilized installations and the increased operating parameters of the designed conventional power units.
The simultaneous effects of elevated temperature and time-varying mechanical loads under laboratory test conditions were mapped using low-cycle fatigue tests and thermo-mechanical fatigue tests. Low-cycle fatigue tests mainly reflect cases under operating conditions with varying loads acting on the material at a constant temperature. Thermo-mechanical fatigue tests determine the effect of the correlation between the temperature and stress cycles on the durability of the material. This applies to the values of the characteristic parameters of both the temperature and the stress cycle, as well as to the time synchronization of both waveforms of the variable quantities, allowing their mutual relations to best reflect the waveforms occurring under operating conditions. Since it was difficult to map all possible relationships between the temperature and stress cycles under laboratory conditions, in each case the parameters of the thermo-mechanical fatigue test or the low-cycle fatigue test, to some extent, reflected the actual fatigue conditions of the material.
The commonly used tests include tests where the maximum value of the mechanical strain cycle corresponds to the minimum value of the thermal strain. The temperature cycle is then out of phase for the stress cycle by half the period. This is called out of phase-OOP [
25,
37]. In certain cases, tests are performed for a phase shift equal to plus or minus a quarter of the period. Usually, the phase shift significantly affects the material’s fatigue life [
37,
38]. However, the nature of this influence depends on the type of material and the accepted range of temperature changes.
Herein, we present a selection of results from the low-cycle fatigue tests of P92 steel carried out at room temperature and elevated temperatures.
Figure 1 illustrates the influence of temperature on the low-cycle fatigue life of the material. The thermo-mechanical fatigue tests showed a cyclic weakening of P92 steel, which was similar to the conditions of isothermal low-cycle fatigue [
4,
39,
40,
41]. This was manifested by a reduction in the stress range in the OOP and IP tests (
Figure 4 and
Figure 5).
The fatigue tests of the material aimed to determine the characteristics needed to assess the durability of elements operating under fatigue conditions and to compare the results of low-cycle fatigue tests in isothermal conditions with thermo-mechanical fatigue tests. The results of the thermo-mechanical fatigue tests using both IP and OOP tests with a maximum temperature close to that used in the low-cycle fatigue tests were similar to the results of the isothermal tests (
Figure 1). It should be noted that IP testing proved more strenuous than OOP testing. This was because the durability determined in the IP tests, despite the lower value of the mechanical strain range (∆
εM = 0.007), was lower than that of the OOP tests carried out at a slightly higher value of the mechanical strain range (∆
εM = 0.008) while maintaining the same temperature cycle characteristics (
Figure 1).
The obtained results showed a noticeable impact of the type of fatigue test, related to the interdependence of the cycle of temperature and stress changes, on the durability of the material. However, with the infinite possible relationships between these cycles and the practical possibilities of carrying out laboratory tests, it seems reasonable to search for a type of test that considers this diversity. Additionally, it could provide a basis for sustainability forecasting methods while maintaining an appropriate degree of conservation of the forecast adopted. At present, by considering all the data from the thermo-mechanical fatigue tests, the fatigue tests under isothermal conditions, and our presented results, it is acceptable to take the following approach, where, with the appropriate degree of conservatism, the results of low-cycle fatigue tests under isothermal conditions at the maximum temperature of the TMF cycle could be used to estimate the durability under simultaneously changing mechanical and thermal loading. Due to the lack of appropriate material characteristics determined under thermo-mechanical fatigue conditions, such an assumption was assumed to assess the durability; this was similar to the previously performed tests of components subjected to fatigue under conditions of changing temperature and mechanical loading [
42]. The ability to reflect the actual operating conditions of elements subjected to mechanical and thermal impacts in strength calculations is an important aspect of designing modern power units, including both conventional units and devices of modern power plants based on renewable energy sources and nuclear energy. When analyzing the possible future behavior of equipment components in new installations, we must now rely mainly on the test results carried out earlier in industrial conditions, allowing the extrapolation of the behavior of installation elements, and, most often, increased parameters of use. This is due to the lack of adequate measurement results for units with increased operating parameters. After many years, the measuring equipment in the units and modern conventional power plants has been designed to evaluate the variable values of the parameters needed to control these devices. To a lesser extent, device designers take into account the possibility of performing measurements necessary for strength evaluation. If such measurements are made, it is mainly to evaluate creep strength. Thus, the currently available results obtained under industrial conditions, although unique and very difficult to obtain, provide only basic information for forecasting the characteristics of the thermo-mechanical loads of new power units.
To describe the behavior of power equipment components in relation to their strength and durability, using a computer modeling technique, one must determine time-varying mechanical loads and heat transfer conditions [
20,
21,
22,
23,
26]. The examples of the measurement results obtained under industrial conditions are presented in
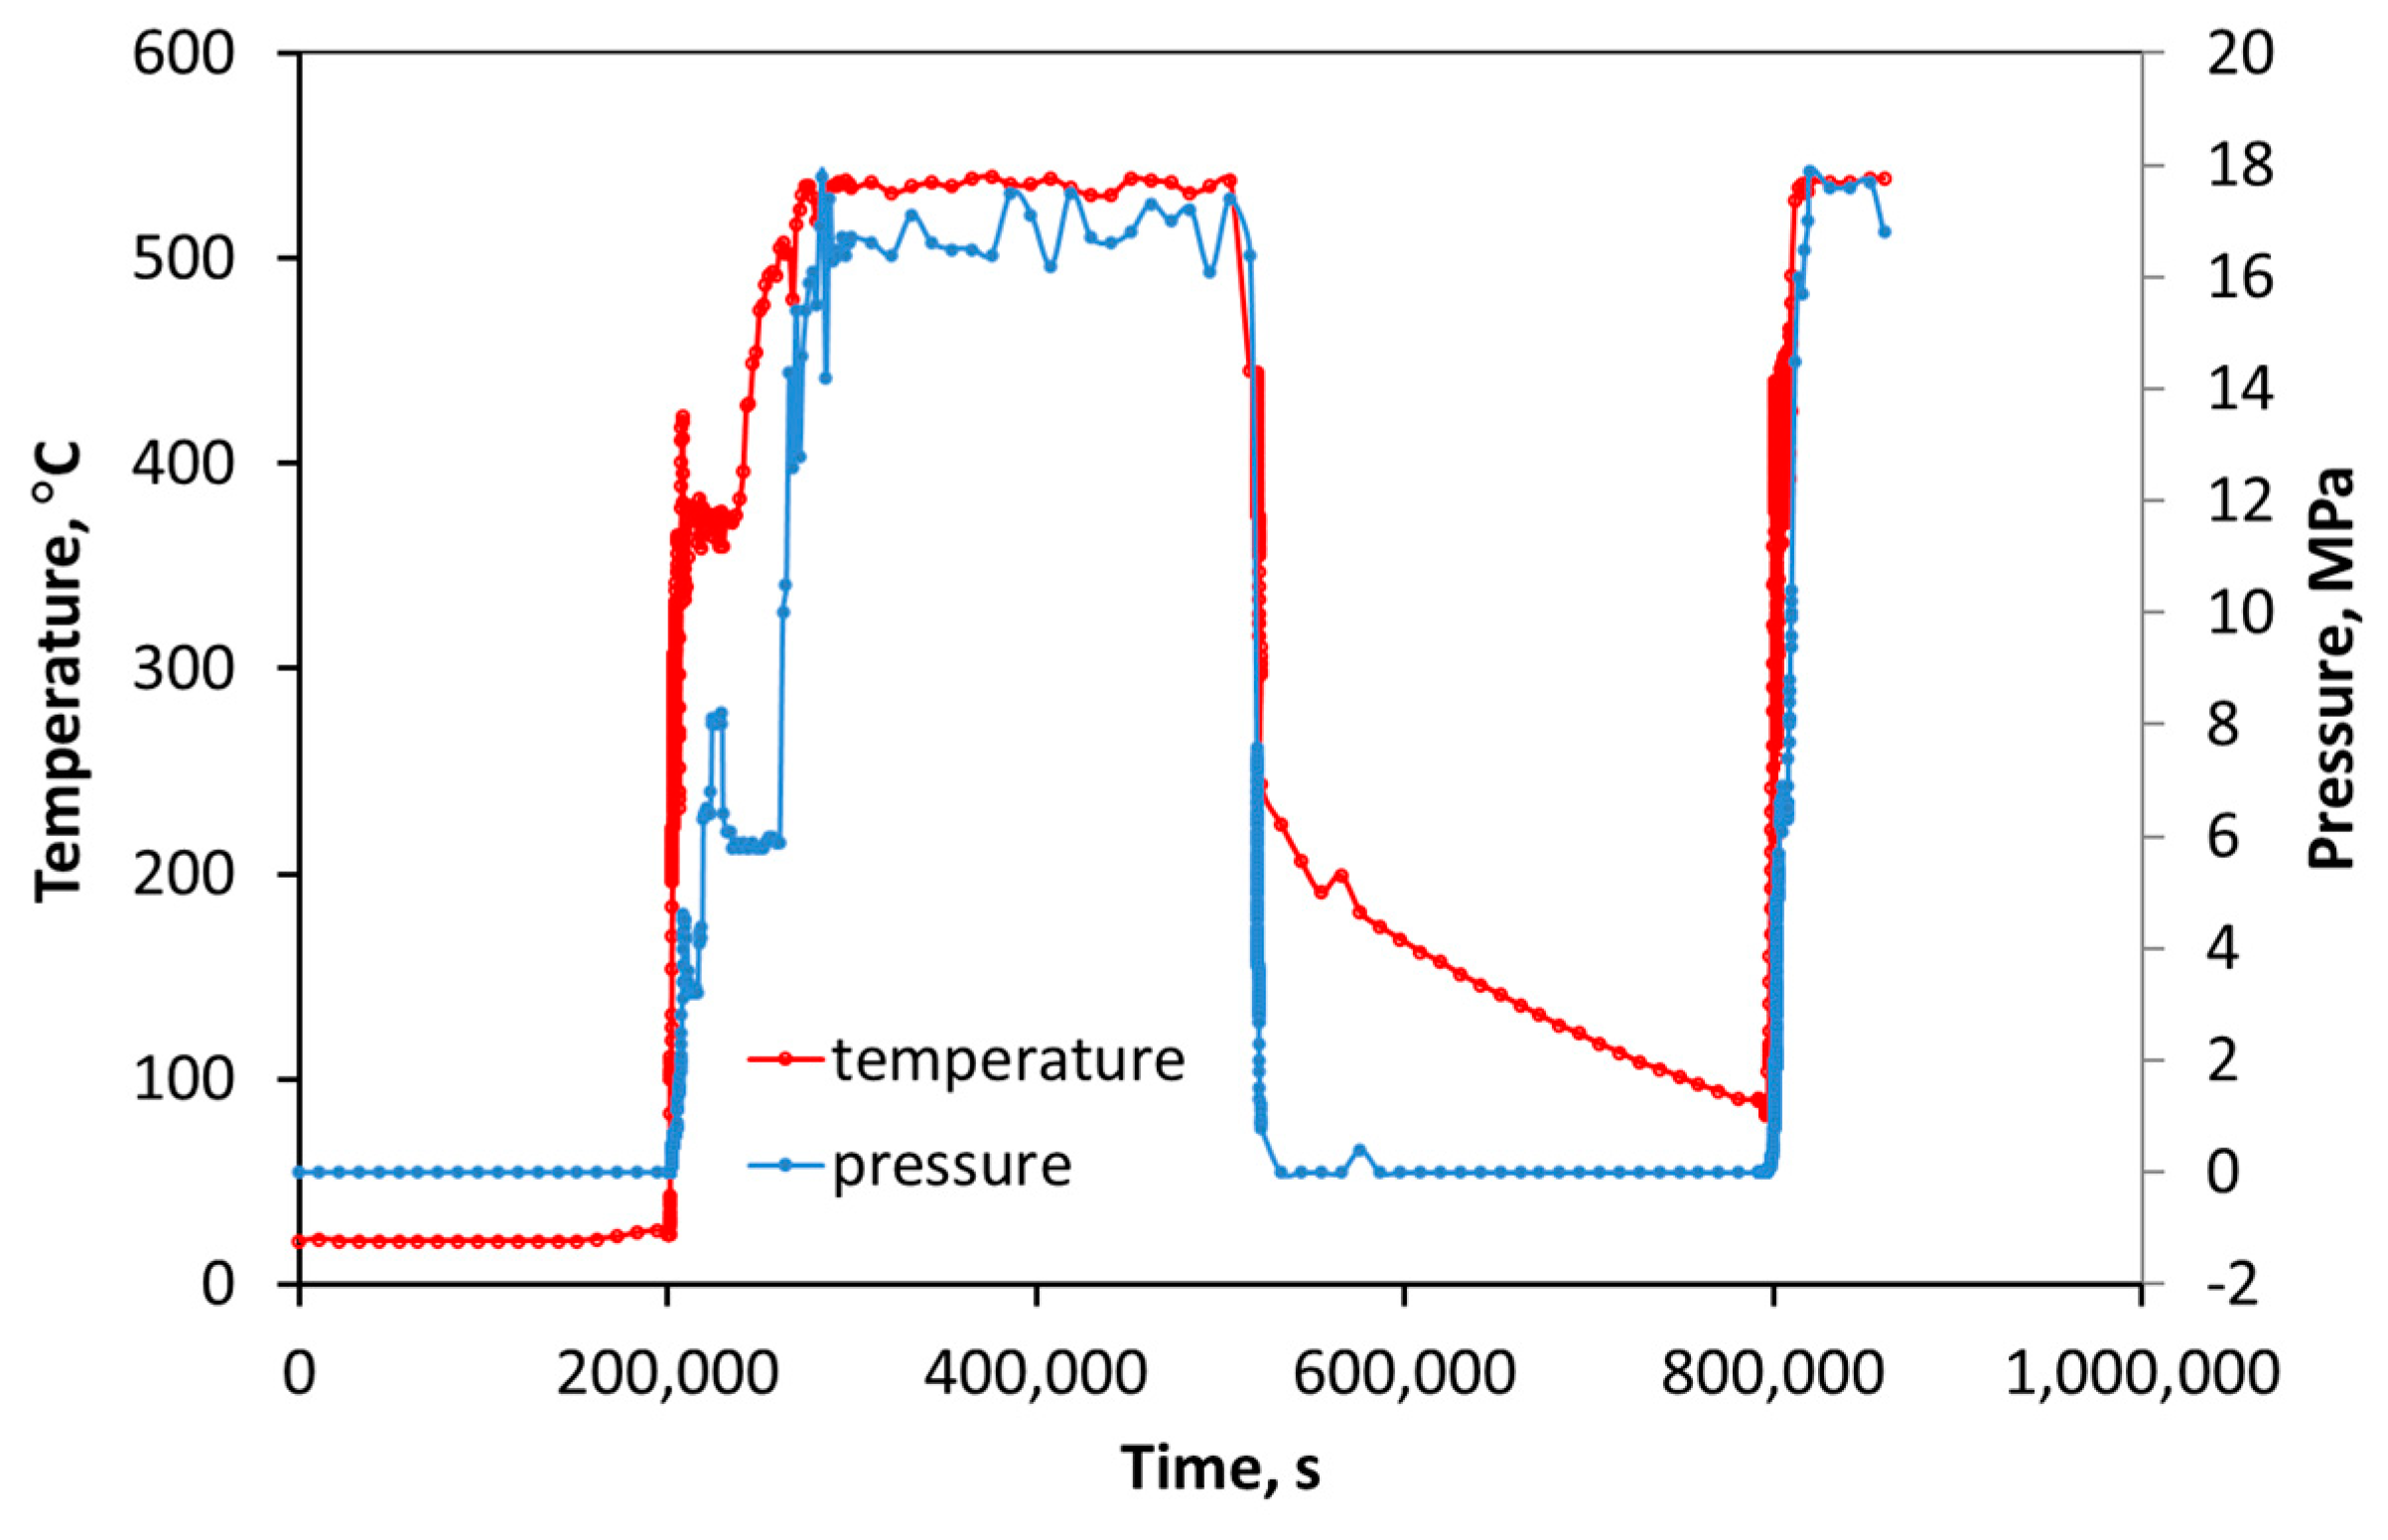
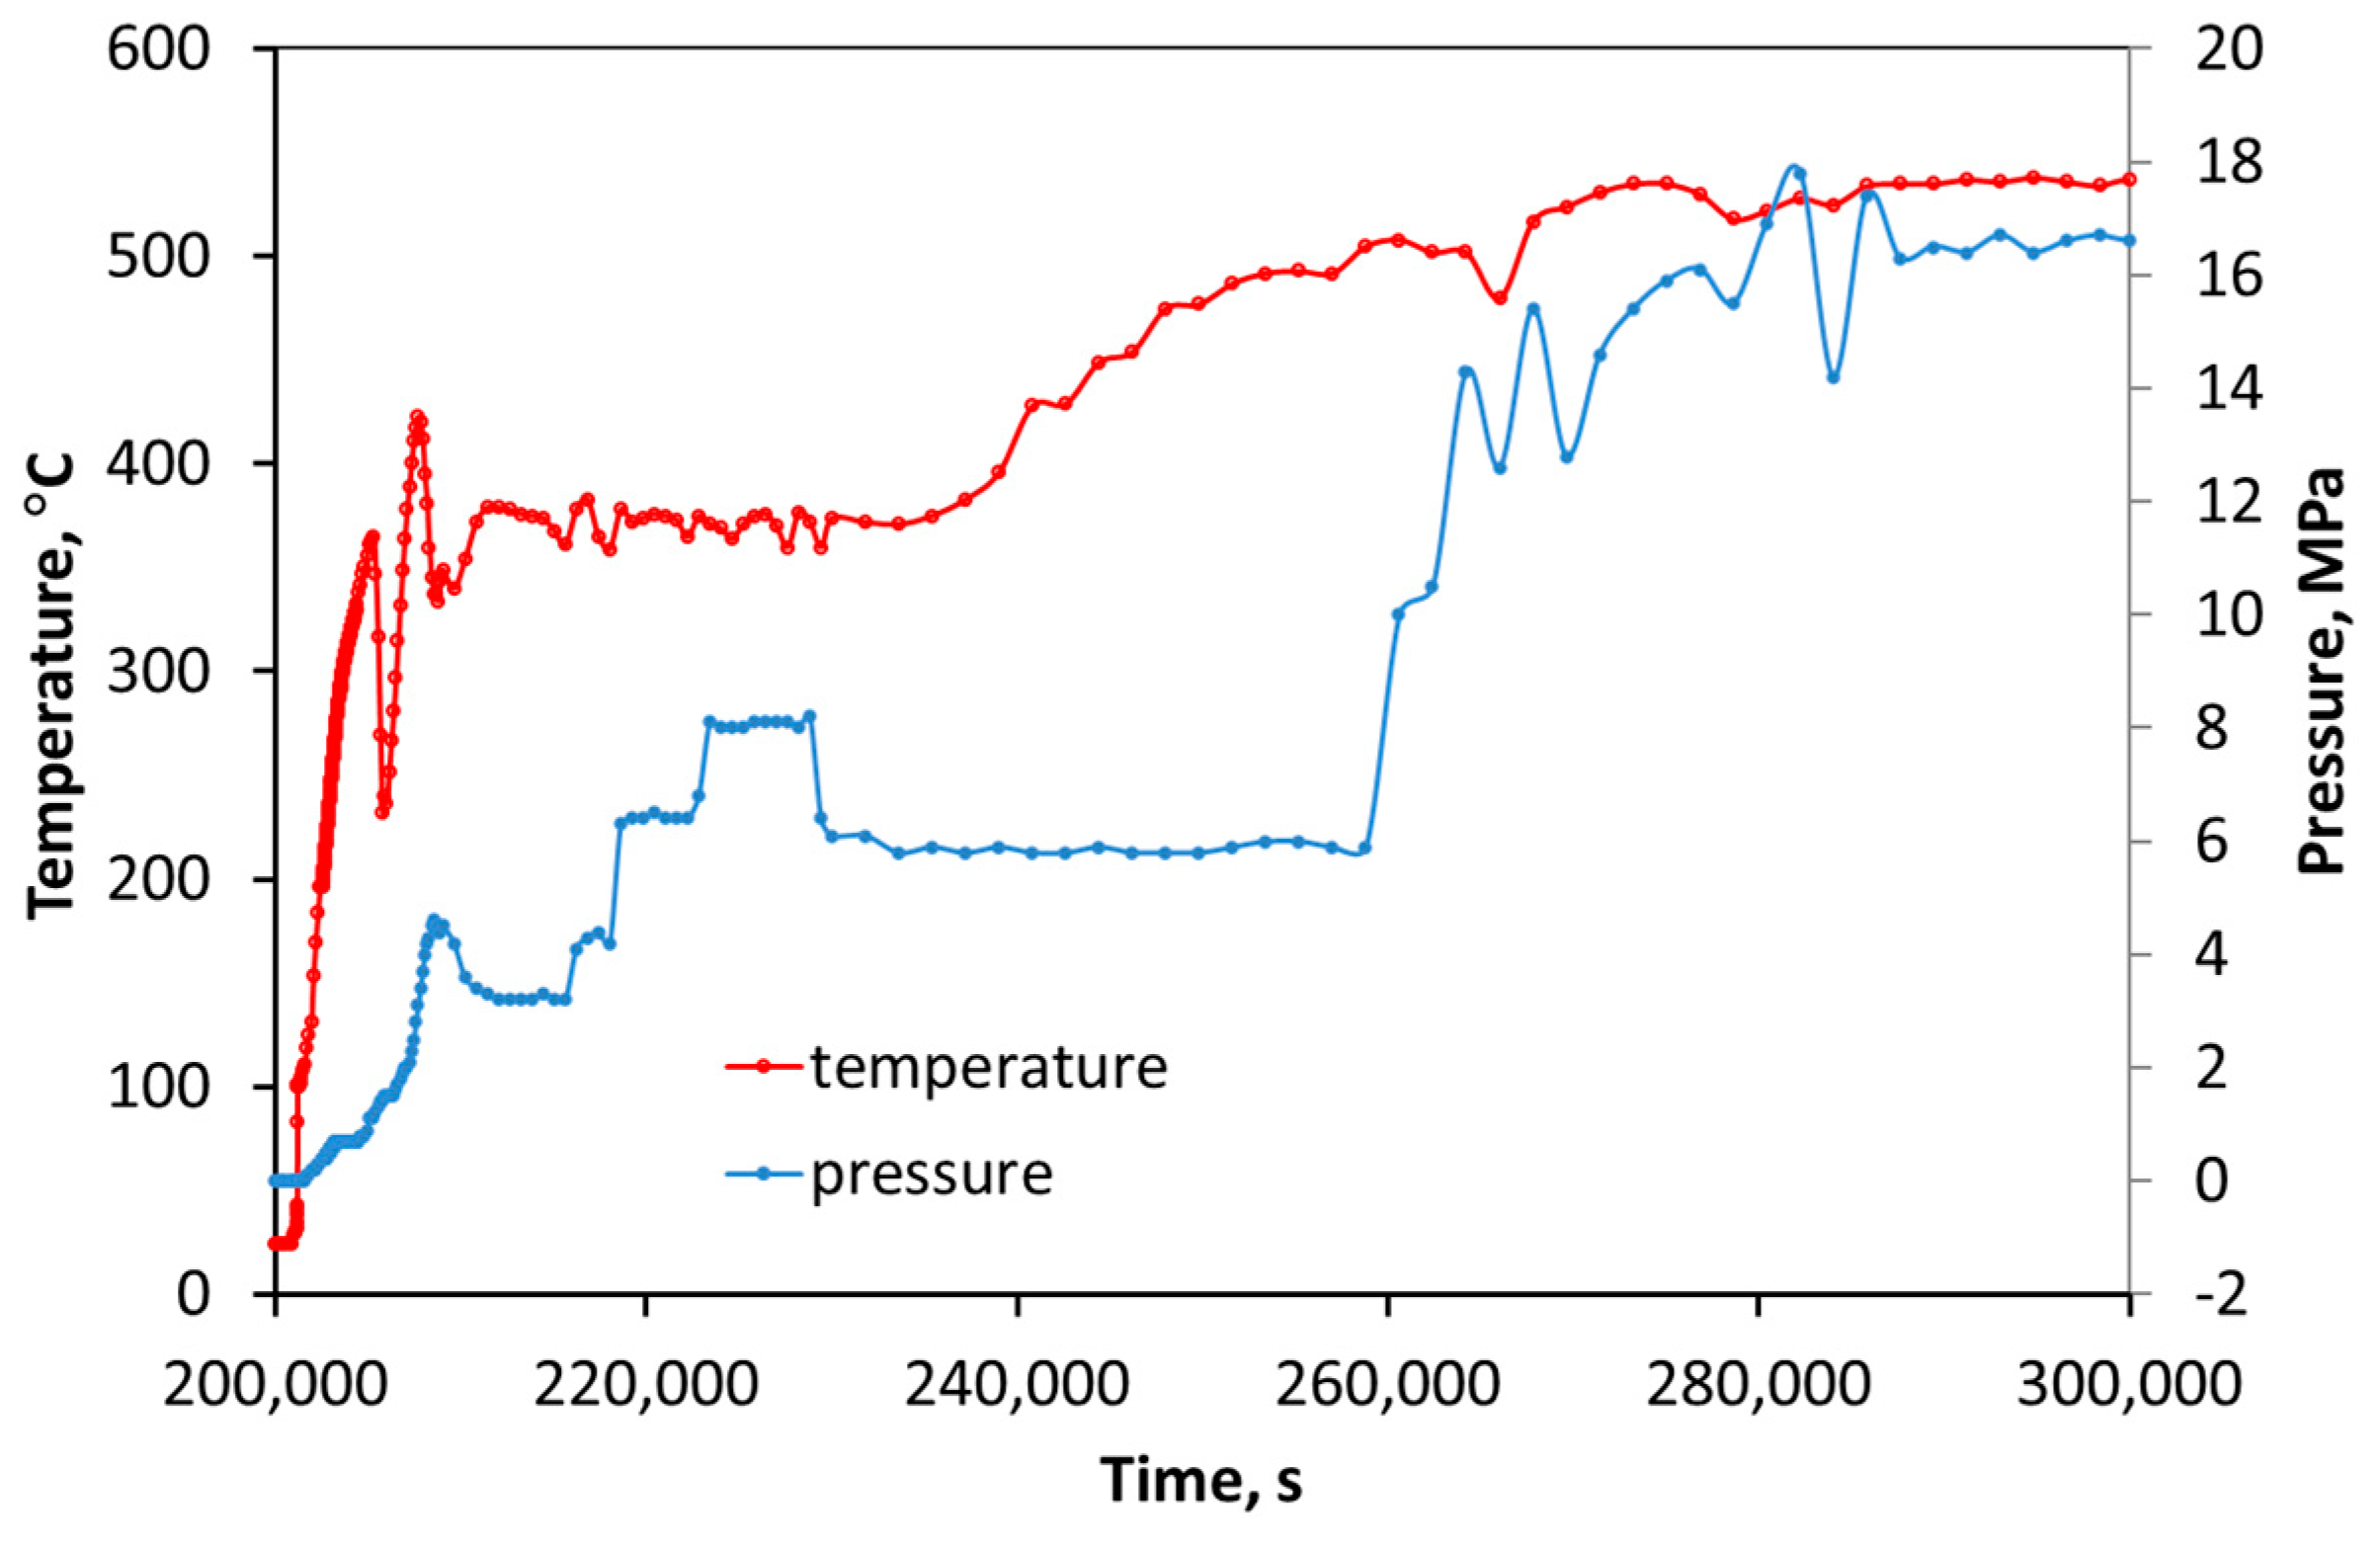
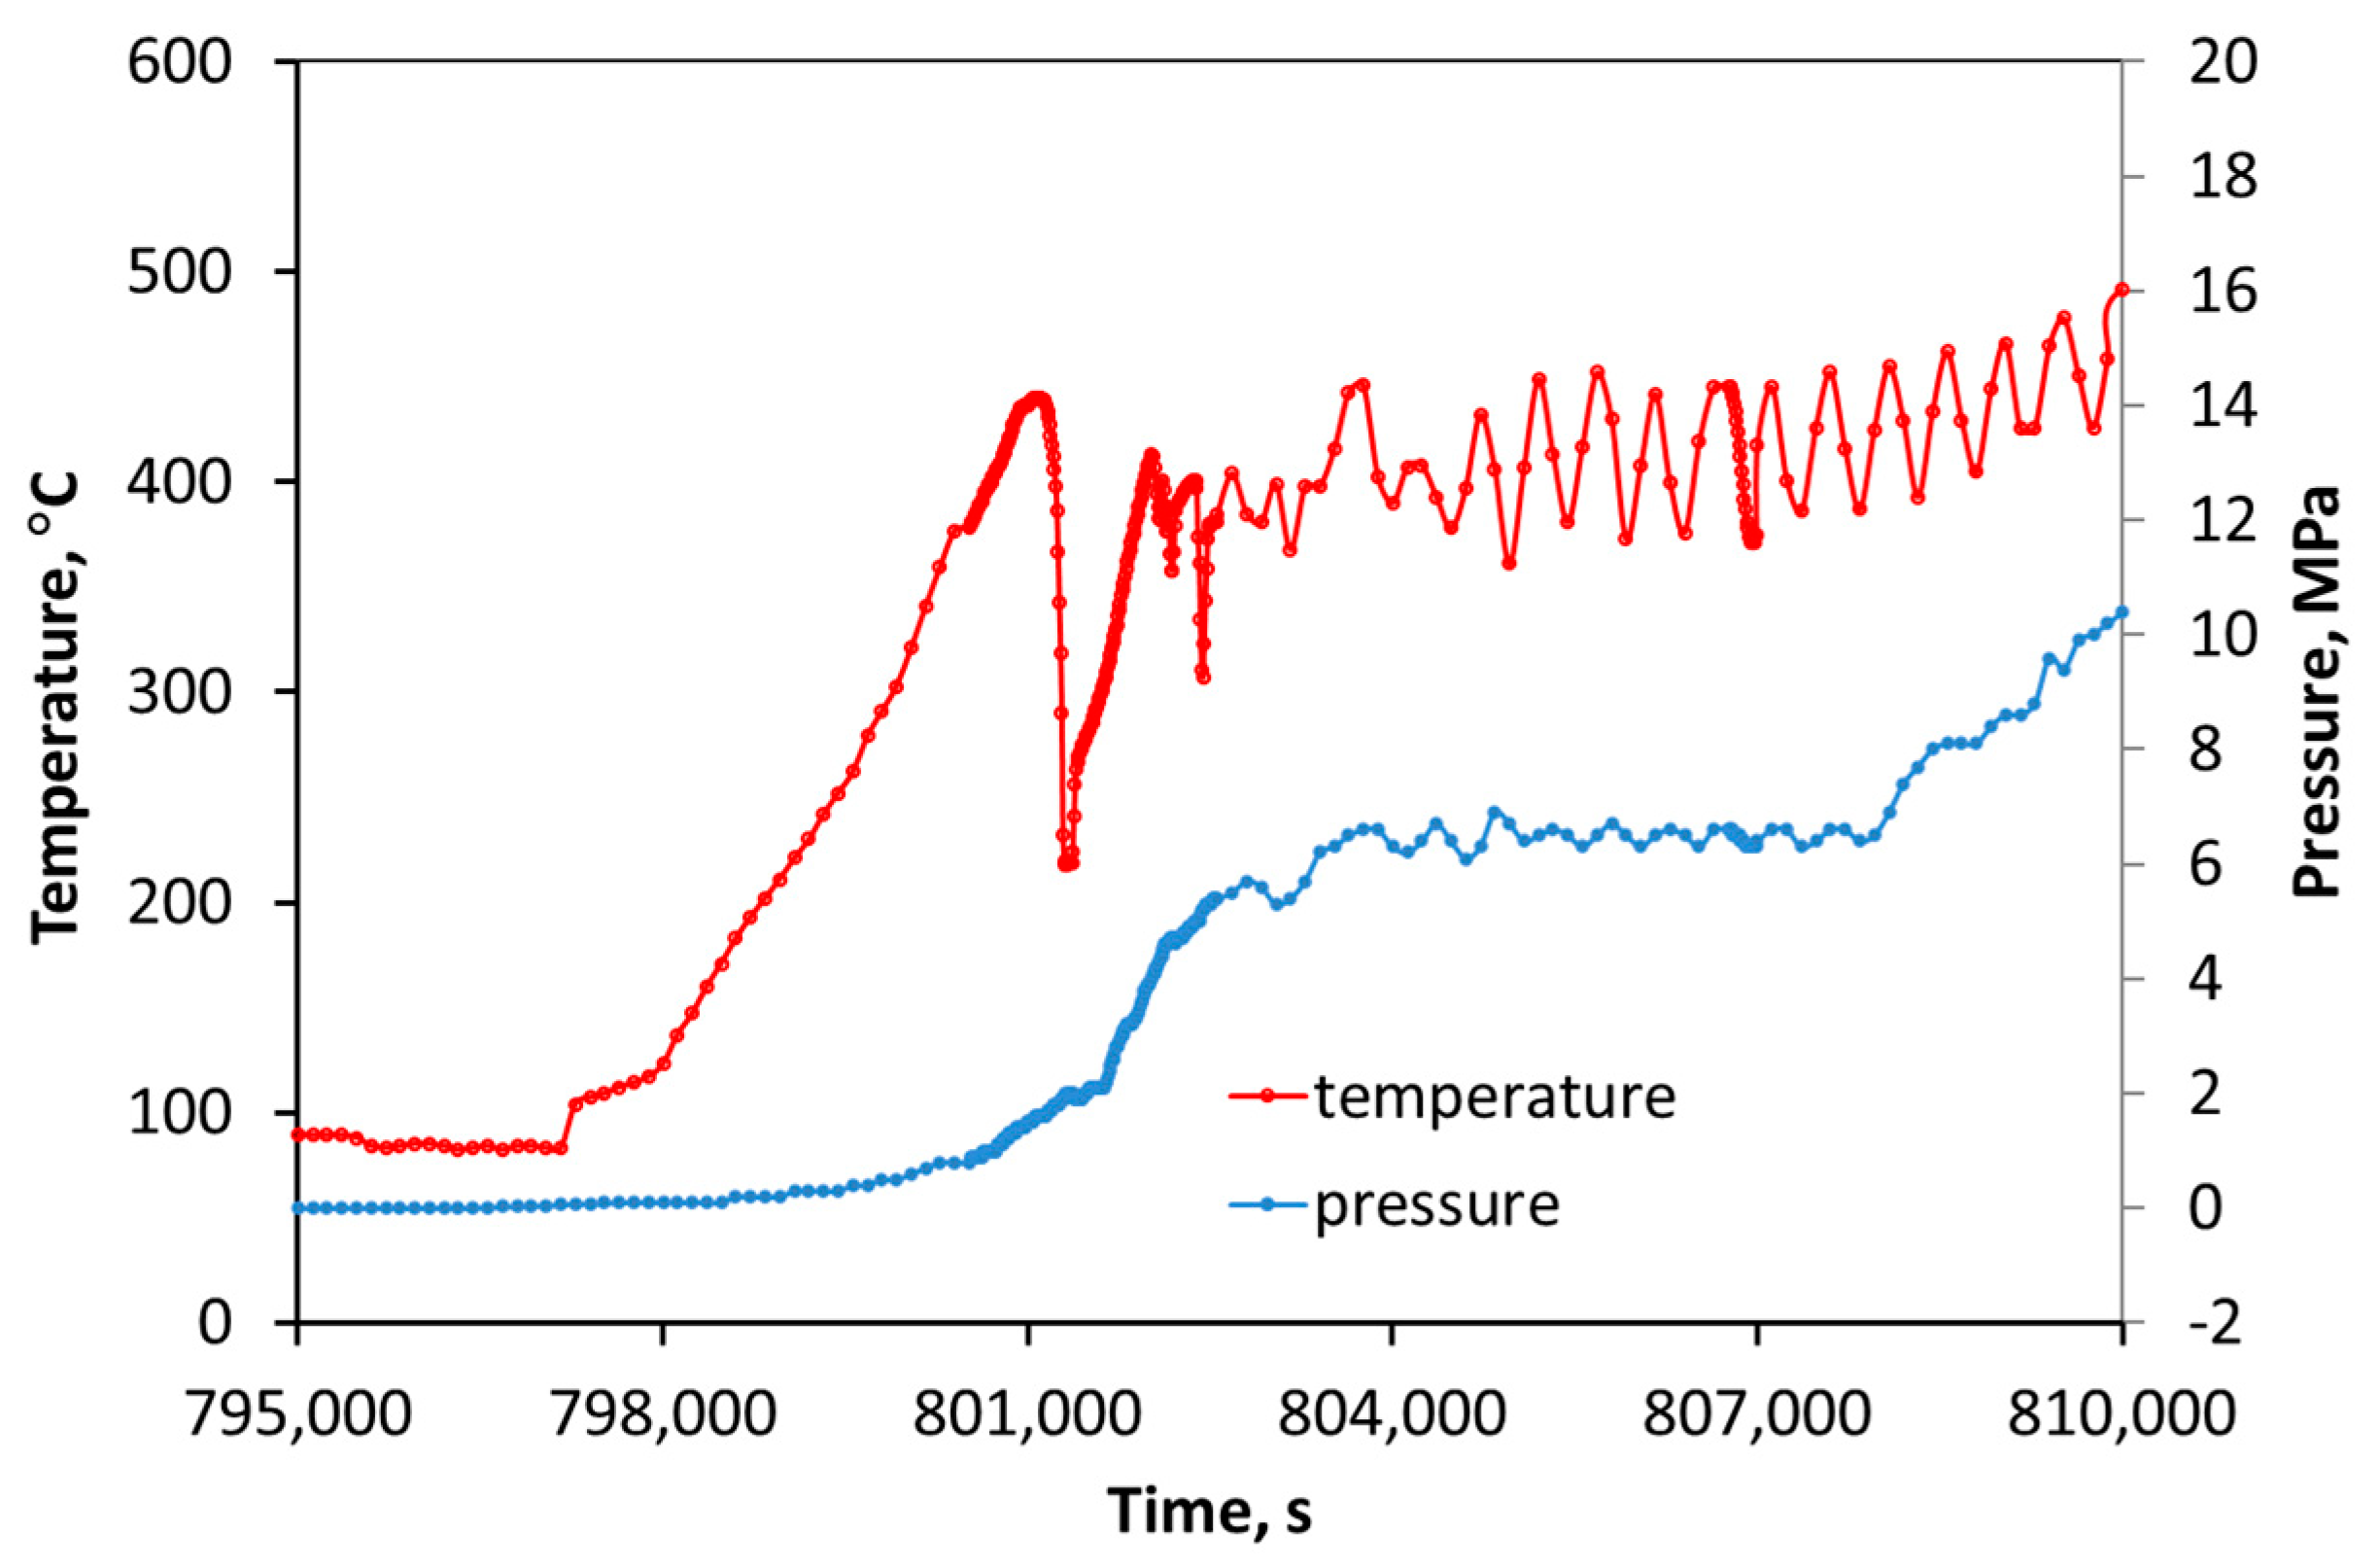
Figure 9,
Figure 10 and
Figure 11. The data show the course of time-varying pressure and temperature values and include periods of slow temperature rise and fall as well as time intervals in which there are rapid temperature changes manifested by oscillations around the characteristics revealing an increase in the average temperature value at the stage of starting the power unit.
Figure 12b illustrates the approximate and modified characteristics of the changes over time of these quantities. Maintaining the similarity of the characteristics measured and assumed in the calculations and taking into account the increase in temperature and steam pressure in the operating conditions determined in the presented modification, we estimated the possible course of changes in the operating parameters of the devices over time. Particular attention was paid to the mapping of temperature oscillations, which are particularly important for the value of changing thermal stresses [
32]. This method of presenting mechanical and thermal loads approximated the behavior of steam superheater chambers that operate in blocks with increased operating parameters. In the future, as the possibilities of obtaining more precise characteristics for the currently operating units expand, it will be possible to describe the behavior of certain parameters in more detail.
The calculations of the temperature, stress, and strain fields showed the influence of heat transfer phenomena on the course of the local deformation process, characterized by variable values of stress and strain state components. It was found that this influence was important when comparing local strain values, such as those at point C of the steam superheater chamber (
Figure 20). To a lesser extent, the value of the heat transfer coefficient affects the values of the components of the stress state that vary as a function of time (
Figure 19). The relationships between the axial component ε
z of the strain state and the axial component of the stress state shown in
Figure 21 illustrate this influence. It should be noted that an increase in the value of the heat transfer coefficient in the range of its smaller values from 3000 to 15,000 W/m
2K caused greater changes in the shape of the hysteresis loop shown in
Figure 21 compared to the impact of the changes in this coefficient in the range of its larger values from 15,000 to 45,000 W/m
2K. A similar influence of the heat transfer coefficient on the course of changes in the deformation process was observed in the previously performed numerical simulations for thick-walled elements subjected to the effect of a changing environment with temperature varying as a function of time.
The results of the material tests, measurements in industrial conditions, and computational simulations of the heat transfer process and time-varying components of the state of stress and strain in the considered header of the steam superheater were an attempt to capture selected correlations between the results of the above-mentioned types of tests to use them in the process of the analysis of time-varying deformation characteristics, which can be a measure of the intensity of the local damage process. In this sense, the work is the next stage of research on the interdependent elements that make up the methodology for assessing the durability of power equipment subjected to mechanical and thermal influences.
7. Conclusions
Thermo-mechanical fatigue tests determine the correlation effect between the temperature and stress cycles on the material’s durability. This stems from the possibility of the time synchronization of the waveforms of temperature and strains in a manner in which their mutual relations best reflect the waveforms occurring under operating conditions.
Since it was difficult to map all possible relationships between the temperature, strain, and stress cycles under laboratory conditions, in each case the parameters of the thermo-mechanical fatigue test or the low-cycle fatigue test more or less reflected the actual fatigue conditions of the material.
The significant influence of the temperature at which the tests were carried out on the low-cycle fatigue life of the material was observed.
The results of the thermo-mechanical fatigue tests using both IP and OOP tests with a maximum temperature close to the temperature used in the low-cycle fatigue tests were similar to the results of the isothermal tests.
At present, taking into account the results of the thermo-mechanical fatigue tests, the fatigue tests under isothermal conditions, and those obtained by our study, it was deemed that this approach was acceptable. The low-cycle fatigue test results under isothermal conditions at the maximum temperature of the TMF cycle could form the basis of methods for estimating durability under simultaneously changing mechanical and thermal loading.
The calculations of temperature, stress, and strain fields in the superheater header showed the influence of heat transfer phenomena on the course of the local deformation process, characterized by variable values of stress and strain state components.
To describe the behavior of power equipment components from the point of view of their strength and durability, using a computer modeling technique, one must overcome the main issue of determining time-varying mechanical loads and heat transfer conditions.
During modeling of the behavior of the components under mechanical and thermal loading, particular attention should be paid to the mapping of temperature oscillations, which are particularly important for the values of changing thermal strains and stresses and for deciding on the fatigue life of the components under mechanical and thermal loading.
It should be noted that an increase in the value of the heat transfer coefficient in the range of its smaller values from 3000 to 15,000 W/m2K causes greater changes in the shape of the hysteresis loop compared to the impact of changes in this coefficient in the range of its larger values from 15,000 to 45,000 W/m2K.
