Abstract
Gas–oil–water three-phase slug flows in pipes commonly exist in the oil and gas industry as oil fields are becoming mature and water production is becoming inevitable. Although studies on multiphase flows in pipes have been ongoing for decades, most previous research has focused on gas–liquid or oil–water two-phase flows, with limited studies on gas–liquid–liquid flows. This leads to limited modeling studies on gas–liquid–liquid flows. One factor contributing to the complexity of the gas–liquid–liquid flow is the mixing between the oil and water phases, which have closer fluid properties and low interfacial tension. Restrictions or piping components play a crucial role in altering phase mixing. Unfortunately, modeling studies that consider the effects of these restrictions are limited due to the scarcity of experimental research. To address this gap, we conducted experimental studies on a gas–liquid–liquid flow downstream of a restriction and developed a new mechanistic modeling approach to predict the pressure gradient. Our model focuses on the flow pattern where the oil and water phases are partially mixed. This work emphasizes the modeling approach. The model evaluation results show that the model outperforms other existing models, with an average absolute relative error of 6.71%. Additionally, the parametric study shows that the new modeling approach effectively captures the effects of restriction size, water cut, and gas and liquid flow rates on the three-phase slug flow pressure gradient in horizontal pipes. Most previous slug flow modeling work assumes either a stratified flow or fully dispersed flow between the oil and water phases. This work provides a novel perspective in modeling a three-phase slug flow in which the oil and water phases are partially mixed. In addition, this novel approach to modeling the restriction effects on the pressure gradient paves the way for future modeling for different types of piping components or restrictions.
1. Introduction
Gas–oil–water three-phase flows in pipes commonly exist in the oil and gas industry as oil fields are becoming mature and water production is becoming inevitable. The slug flow is one of the most common gas–liquid–liquid flow patterns occurring in the field [1]. While studies on multiphase flows in pipes have been ongoing for decades, most previous studies focused on gas–liquid or oil–water two-phase flows, and studies on gas–liquid–liquid flows are still limited. The oil–water flow pattern in a gas–oil–water flow is less predictable and can be influenced by many factors, due to their closer fluid properties and lower interfacial tension. In addition to the flowing conditions, such as flow rates, pipe inclinations and diameter, and fluid density and viscosity, agitation from piping components such as restrictions can also impact the flow pattern, especially for oil and water flow. There are many different types of restrictions in the oil and gas industry, such as valves, chokes, regulators, multiphase flow meters, reducers, etc. These restrictions are extensively employed in the field, to regulate flow rates or pressure in order to fulfill facility needs, ensure secure transportation, or generate more turbulence for flow measurement.
Previous studies on the effects of restriction (or expansion) on fluid flow have been mainly focused on gas–liquid flow, such as [2,3,4,5,6], or oil–water flow, such as [7,8,9,10,11,12,13,14,15,16]. Some studies used computational fluid dynamics to study the oil–water flow through restrictions, such as [17]. While some studies have demonstrated that the oil–water flow pattern could impact the corresponding pressure gradient in the pipe for the oil–water flow, such as [7], most of them focused on droplet breakup mechanisms or droplet sizes, such as [10,11,12,13,14,15,16]. Studies on gas–oil–water three-phase flow downstream of restrictions are still very limited.
To better understand how the oil–water flow pattern in gas–oil–water three-phase flow impacts the pressure gradient, we conducted an experimental study in a 13.7 m horizontal pipe, with a 5.25 cm inner diameter. A ball valve was installed near the beginning of the test section. The detailed experimental results are discussed in [18]. In this work, we develop a new modeling approach to predict the pressure gradient for a gas–liquid–liquid three-phase slug flow downstream of restrictions, with a focus on the flow pattern where the oil and water phases are partially mixed.
Before diving into the model development, we highlight some experimental observations that demonstrated the restrictions’ effect on the oil–water flow pattern in the three-phase slug flow, and their impacts on the pressure gradient, in the following section.
Modeling studies on three-phase flow are scarce, due to limited experimental studies on three-phase flow in pipes. Most previous three-phase flow mechanistic modeling studies were developed for a stratified flow in which gas, oil, and water flow separately, such as [1,19,20,21,22,23]. The model used the momentum equations for all three phases, coupled with various closure relationships, including the interfacial friction factor correlation, which was the one that impacted the predictions most. Some other models treat the oil and water phases as a mixture, allowing the implementation of gas–liquid two-phase models to three-phase gas–liquid–liquid flow. This implementation enables the models to work for a more complex flow pattern, such as slug flow.
In the literature, there are two main approaches to model three-phase slug flow. One approach involves treating the oil–water mixture as one liquid phase, which effectively simplifies the three-phase problem to a two-phase scenario. This allows the application of two-phase models, such as Dukler and Hubbard’s (1975) model [24], Taitel and Barnea’s (1990) model [25], and Zhang et al.’s (2003) unified model [26]. Hall (1992) [19] modified the Dukler and Hubbard (1975) [24] model for three-phase slug flow in horizontal pipelines. He assumed that the liquid phases were fully dispersed at the end of the mixing eddy in the slug body. The volume-averaged density and viscosity calculated using the Brinkman (1952) [27] equation were suggested to be used for liquid slug pressure gradient calculations. The author derived a formula for the pressure drop associated with the formation of dispersed drops during the eddy mixing and concluded that this pressure drop was negligible. Further, Hall (1992) [19] argued that it was common that oil and water flowed separately in the film region despite its dispersion state in the slug body. Therefore, the author suggested using the stratified model to solve for the liquid holdup in the film region. Stapelberg and Mewes (1994) [28] studied gas–liquid–liquid slug flow in horizontal pipes. They assumed that the liquid–liquid phase in the three-phase flow formed a homogeneous mixture and treated it as a single phase. Thus, they were able to use the gas–liquid two-phase slug models proposed by Dukler and Hubbard (1975) [24] or Nicholson et al. (1978) [29] to model three-phase slug flow. Dehkordi et al. (2019b) [30] proposed a model to solve three-phase slug flow based on Zhang et al. (2003) [26] two-phase unified model for the slug flow. They used the criteria from Zhang et al. (2006) [31] to determine if the liquid phase could be treated as a homogeneous single phase. In particular, they fitted a new formula for the slug unit length for their model, which reduced the calculation complexity greatly.
The other approach to model a three-phase slug flow in the previous literature is proposed by Zhang and Sarica (2006) [31], which treats each phase separately. In their model, the film region has three stratified layers, namely gas, oil, and water; and the slug body has two layers, oil and water. The model involves three combined momentum equations—two in the film region and one in the slug body—and four continuity equations. Cohen and Hanratty’s (1968) [32] interfacial friction factor was employed at the oil and water interface. They comment that the model gave unsatisfactory predictions for the slug flow that has partial mixing between oil and water phases. In their paper, they also proposed a criterion to determine if the oil and water can be treated as a mixture. If they can be treated as a mixture, the two-phase slug flow model can be employed, with the oil and water mixture’s apparent viscosity calculated using Brinkman’s (1952) [27] correlation. Otherwise, the separate model previously mentioned can be used.
In conclusion, there is still a gap in the current literature to model a slug flow that has partial mixing between the oil and water phases. Furthermore, a model that can capture the effects of the restrictions is also needed. In this paper, we focus on the “semi-dispersed” slug flow that has partial mixing, as introduced in the previous subsection. The following sections explain the model development in detail, followed by the model evaluation and discussion.
2. Observation of Gas–Oil–Water Flow Downstream of Restrictions
Zhou et al. (2023) presented an experimental study on a gas–oil–water three-phase flow in a horizontal pipe downstream of a restriction [18]. The study was conducted in a 5.25 cm horizontal pipe, with mineral oil as the oil phase, and air as the gas phase. The study employed a high-speed camera and an Electrical Capacitance Volume Tomography (ECVT) system, to better understand the oil–water flow patterns downstream of the restrictions. The latter was used to monitor the volumetric phase fraction distribution at the pipe cross-section with time. Details about the experimental setup and the instrument can be found in [18].
The experimental results have shown that the restriction size can influence the oil–water flow pattern in the slug film and slug body regions and impact the overall pressure gradient consequently. Figure 1 shows the pictures of the three-phase slug flow from a high-speed camera and Figure 2 shows the phase distribution at pipe axial and cross-sectional directions from the ECVT sensor, for a liquid superficial velocity of 0.5 m/s and gas superficial velocity of 0.2 m/s with a 60% water cut at different valve openings, indicated on the left. Since the permittivity of air is much closer to that of oil compared to that of water, the ECVT images show very similar colors between the oil and air phases. In the ECVT plots, the red color denotes water, and blue mainly represents oil in the slug body and air in the film region above the interface. Combining the high-speed camera videos and the ECVT images, we can better understand the oil–water flow patterns in the slug body, which mostly impacts the overall pressure gradient. From Figure 1, it can be seen that the restriction enhances the oil–water mixing and changes the flow pattern from a separated to dispersed flow as the opening is reduced. The oil–water flow pattern in the slug body gradually changes from a partially mixed oil-water flow to an oil-in-water dispersed flow (O/W) as the opening is reduced below 50%. The corresponding pressure drop is shown in Figure 3. Generally, the pressure gradient increases as the choke opening decreases, which is due to the increase in the thickness of the mixing layer or the mixture viscosity within the mixing layer.
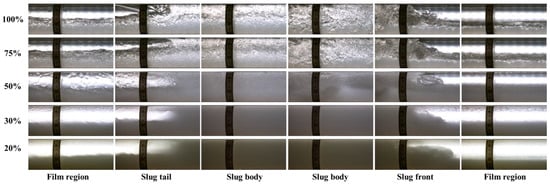
Figure 1.
Pictures of three-phase slug flow from a high-speed camera for vSL = 0.5 m/s and vSG = 0.2 m/s with a 60% water cut (the percentages in the picture indicate the opening of the valve).
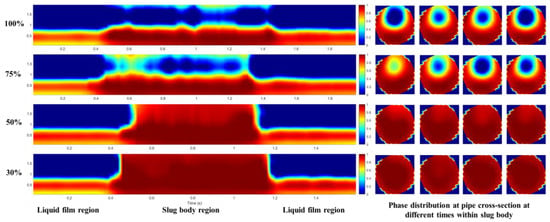
Figure 2.
Volumetric phase distribution at pipe axial and cross-sectional directions from ECVT sensor for vSL = 0.5 m/s and vSG = 0.2 m/s with a 60% water cut (the percentages in the picture indicate the opening of the valve). The red color denotes water, and blue mainly represents oil in the slug body and air in the film region above the interface.
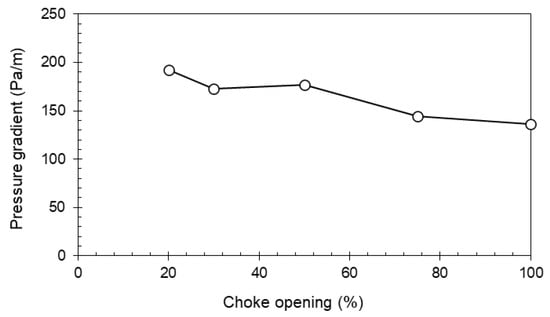
Figure 3.
Variation of pressure drop with choke opening for vSL = 0.5 m/s and vSG = 0.2 m/s with a 60% water cut.
The variation in the pressure gradient with the water cut also depends on the size of the restrictions. Figure 4 shows the pressure gradient as a function of the water cut for four different choke openings from 100% to 30%. The complex behavior is due to the mixing between oil and water phases, which depends on many operating parameters including the restriction size. Figure 5 shows the pictures from the high-speed camera videos for different water cuts at a 100% choke opening. It can be noticed that (1) the water layer at the bottom increases as the water cut increases, and (2) the oil and water are more mixed as the water cut increases, which fully becomes an oil-in-water dispersed flow as the water cut is 80%. For the 30% choke opening, the oil–water flow is mostly a dispersed flow, but with some inhomogeneities. The oil–water flow pattern is W/O (dispersed water-in-oil) for a 20% water cut, and O/W (dispersed oil-in-water) for a 30% water cut. The high-pressure gradient at the 30% and 40% water cuts is due to the densely packed layer at the top part of the pipe, which generates a high frictional pressure drop. This observation is consistent with previous studies on oil–water two-phase flow, such as [7,18]. More details can be found in [18].
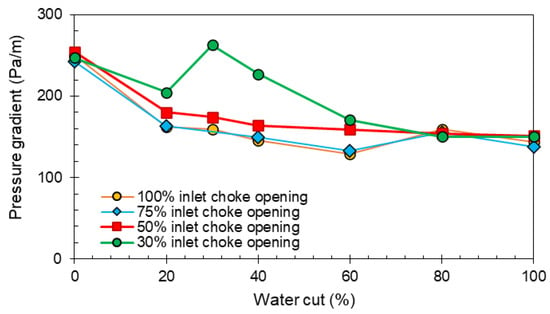
Figure 4.
Variation of pressure drop with water cut for vSL = 0.5 m/s and vSG = 0.2 m/s for different choke openings.
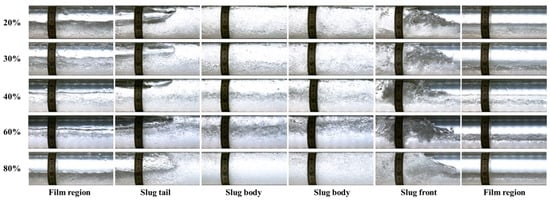
Figure 5.
Pictures of three-phase slug flow from a high-speed camera for vSL = 0.5 m/s and vSG = 0.2 m/s with 100% inlet choke opening (the percentages in the picture indicate the water cut).
From the modeling point of view, it is relatively easy to model a three-phase slug flow if the oil and water are fully dispersed (either oil-in-water or water-in-oil dispersion). Since the oil and water phases are fully mixed, they can be treated as a single phase, enabling the application of existing gas–liquid two-phase flow models for the gas–oil–water three-phase flow with a modification of the liquid properties. The most challenging phenomenon that has not been tackled is the “semi-dispersed” flow where the oil and water phases are partially mixed. In this study, we will focus on this type of flow pattern.
3. Model Development
In this section, we introduce a new three-phase slug flow modeling approach for pressure drop predictions, with a focus on the flow pattern that shows some stratifications in the oil and water mixture liquid phase (Figure 6 top). The bottom figure in Figure 6 shows a conceptual schematic of the three-phase slug flow with some stratifications. A typical slug unit is composed of a liquid film region (also called gas pocket region) and a slug body region, with a respective length of and , as shown in Figure 6. The length of the slug unit is which is the summation of and . The other typical slug flow characteristic parameters are also denoted in Figure 6. is the translational velocity, which represents the slug front velocity. and are the average liquid and gas velocities within the slug body, while and refer to the average liquid and gas velocities in the film region. and are the liquid holdup in the slug body and liquid film region, respectively.

Figure 6.
(top) a picture of slug flow with stratifications in the liquid mixture; (bottom) a schematic of three-phase slug flow that demonstrates stratifications in the liquid mixture (white: gas; orange: oil; blue: water).
The modeling approach starts with the predictions of the liquid holdup and slug characteristic parameters indicated in Figure 6. The pressure gradient is determined afterward based on the parameters obtained in the previous step.
The liquid holdup predictions are based on the fluid flow dynamics of the gas–liquid slug flow, assuming an equilibrium and constant film thickness along the entire film zone. In this approach, we treat the oil and liquid as a mixture to simplify the liquid holdup calculation procedure. Indeed, sensitivity studies were conducted to examine the model predictions of the liquid holdup in relation to the mixture viscosity, which is the most variable property among the oil and water mixture properties. The results showed minimal alterations, affirming the suitability of employing the proposed approach in the liquid holdup predictions. Figure 7 shows the flow chart for the liquid holdup calculations, as well as the other necessary slug flow characteristic parameters that will be used later for pressure gradient predictions.
The model requires iterations to solve for the liquid holdup in the liquid film region, using the combined momentum equation in the film region (Step 6 in Figure 7). The method and procedure are similar to the ones proposed by Taitel and Barnea (1990) [25]. It is worth mentioning that we also tested the slug flow model proposed by Zhang et al. (2003) [26]. The major difference between these two models is that Zhang et al.’s combined momentum equation has an extra term that considers the momentum exchange between the slug body and film region. However, Zhang et al.’s model overpredicted the liquid holdup in the film region at our experimental conditions by around 50%, which drove us to lean toward the approach developed by Taitel and Barnea (1990) [25].
Additionally, the model needs several closure relationships, including the slug translational velocity, liquid holdup in the slug body, gas velocity in the slug body, wall friction factor, interfacial friction factor, geometrical parameters in the film region, etc. In our model, we used the typical correlation from Nicklin et al. (1962) [33] for slug translational velocity prediction (Step 2 in Figure 7), where the flow distribution coefficient, , is 1.2 for turbulent flow and 2.0 for laminar flow. The drift velocity is from Bendiksen (1984) [34], which is given in Equation (1):
where is the gravitational acceleration, m/s2; is the pipe diameter, m; and is the inclination angle from horizontal. The liquid holdup in the slug body correlation is from Gregory et al. (1978) [35], and the gas velocity in the slug body correlation is from Wallis (1969) [36]. Since the gas entrainment is relatively low at our experimental conditions, we anticipate that these two correlations could have insignificant impacts on the final model predictions. However, the user can select the most suitable closure relationships for these two parameters based on their conditions. Details about the geometric parameters can be found in Taitel and Dukler (1976) [37]. In addition, the wall friction factor correlation is from Blasius (1907) [38], and the interfacial friction factor is from Andritsos and Hanratty (1987) [39].
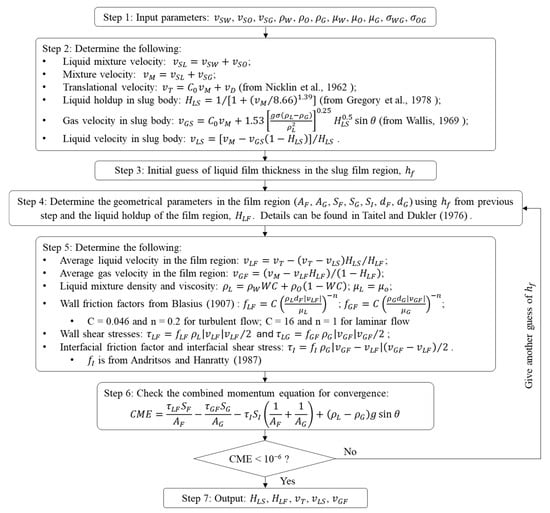

Figure 7.
Flow chart for liquid holdup and slug characteristic parameter calculation [33,35,36,37,38,39].
To predict the pressure gradient, we proposed a new approach that considers the partial mixing between the oil and water phases. Figure 8 shows the simplified conceptual schematic of the new approach framework for the three-phase slug flow with all the necessary parameters listed. The liquid phase is separated into two layers, namely a mixing layer and a water layer, to consider the stratifications in the liquid phase. The mixing layer takes into account the complex mixing behaviors between the oil and water phases near the top of the liquid phase. In Figure 8, represents the average holdup of the mixing layer in the film region, is the average holdup of the water layer in the film region, refers to the average holdup of the mixing layer in the slug body region, and is the average holdup of the water layer in the slug body region. Figure 9 shows the geometrical parameters at the pipe cross-section in the film region and slug body region, respectively. In the film region, , , and are the wetted perimeters of the gas, mixing layer, and the water layer. and are the lengths of the gas-mixture layer interface and the mixing-water layer interface. Similarly, in the slug body region, and are the wetted perimeters of the mixing layer and water layer, respectively. is the length of the interface between the mixing and the water layers. Since it is a horizontal pipe flow, we assume a flat interface geometry.

Figure 8.
Schematic of the three-phase slug flow model with two-layer assumptions in the liquid phase for pressure gradient prediction.

Figure 9.
Schematic of the phase distribution at pipe cross-section in the new three-phase slug flow model (left: liquid film region; right: slug body region).
The overall pressure drop over a slug unit is composed of two parts, namely the pressure drop in the slug body region , which is the dominant one, and the pressure gradient in the film region . The total pressure gradient is given in Equation (2):
The ratio of the slug body length and liquid film region can be derived from the continuity equation (Equation (3)), which is given in Equation (4). It is worth mentioning that, unlike some widely adopted models that assume a constant slug body length [26], this approach does not require correlation for the slug body length, which is one of the most unpredictable parameters compared to others such as the slug translational velocity or slug body liquid holdup.
The pressure drop in the slug body region consists of the pressure drops from the mixture layer and the water layer and can be determined from Equation (5). The pressure drop in the liquid film region includes the pressure drops of the mixture layer, the water layer, and the gas pocket region, given in Equation (6). The corresponding geometrical parameters are illustrated in Figure 9. We used the water cut to determine the wetted perimeters of the water and mixing layer, and . This assumption gives reasonable predictions based on our high-speed camera videos. Additionally, this assumption effectively captures the water cut’s impact on the free layer thickness, which directly impacts the overall pressure drop.
The wall shear stresses, and the friction factors, can be determined by Equations (7) and (8). represents the gas, water, or mixing layer in the slug body or film region, and the hydraulic diameters can be determined by for all involved phases except for the gas phase in the film region, where .
We propose a new approach to predict the mixing layer viscosity that considers the effects of the choke opening, water cut, oil viscosity, and the liquid flow rate, as given in Equation (9). is the reference viscosity that considers the effects of the dispersed phase fraction. The form was based on Brinkman’s (1952) [27] model, but with modified coefficients and exponents, as given in Equation (10). The first coefficient in Equation (9), , mainly accounts for the liquid mixture velocity effect on the mixing layer viscosity, which is also a function of the water cut based on the experimental observations. The second coefficient, , accounts for the effect of choke on the mixing layer viscosity. Consistent with the previous experimental observation, the higher the pressure drop across the choke, the higher the mixing layer viscosity, and therefore, the higher the pressure drop.
where is the water cut, -; is the water cut at the inversion point, -; is the oil viscosity, Pa·s; is the superficial liquid velocity, m/s; and is the pressure drop across the choke, kPa.
The following section discusses the model evaluation and the model performance through a parametric study.
4. Model Evaluation and Parametric Study
This section first describes the overall model performance, followed by a parametric study that systematically evaluates the model performance. The experimental data used for the model evaluation were from [18], described previously in the introduction. These are the only available data that systematically discussed the restrictions’ effects on the gas–liquid–liquid flow pressure gradient in horizontal pipes.
Figure 10 shows the comparison between the measured pressure gradient and the model prediction. The new model’s predictions are indicated as green dots. In addition to the new model, we also evaluated three other widely used slug flow models, in which the oil and water phases are treated as a mixture, as suggested by many previous studies. These models are Zhang et al.’s (2003) unified model [26], Taitel and Barnea’s (1990) slug flow model [25], and Dukler and Hubbard’s (1975) slug flow model [24]. Due to the complex mixing degree of the liquid phases within the flow, various correlations exist in the literature to predict the liquid–liquid effective viscosity. In this work, we evaluated three widely used models, presented in Equations (13)–(16). Brinkman (1953) [27] proposed a correlation for dispersed flow, given in Equation (13), which has been adopted and recommended by many modeling studies on gas–liquid–liquid flow, such as [1,19,31]. If the oil and water phases are relatively separated, the water cut averaged mixture viscosity can be used [1], given in Equation (14). Pan (1996) [40] suggested a mixing degree coefficient, given in Equations (15) and (16), to account for the fluid flow that has partial mixing in the liquid phases.
where is the mixture viscosity; is the viscosity of the continuous phase; is the volumetric fraction of the dispersed phase; is the water volumetric fraction; is the mixing degree coefficient proposed by Pan (1996); and is the three-phase Reynolds number. The model performances are illustrated in Figure 10 for the three different mixture viscosity correlations, respectively.

Figure 10.
Comparison between experimental measured and predictive pressure gradient from different models, including Zhang et al. (2003) [26], Taitel and Barnea (1990) [25], and Dukler and Hubbard (1975) [24]. Different effective viscosity correlations were used in the three plots. (a) model predictions using µmix; (b) model predictions using µsep; (c) model predictions using µPan (1996) [40].
Table 1 lists the corresponding statistical parameters (defined in Appendix B) for different models with different viscosity correlations. The new model gives reasonable predictions with the majority falling within the ±20% bars. The total absolute relative error is around 6.71%. The other models generally underpredict the pressure gradient, with Taitel and Barnea’s (1990) [25] model with the separate viscosity being the best. However, the results from the three different viscosity models are very close at the investigated experimental conditions.

Table 1.
Statistical parameters on model prediction.
Another important component in the model evaluation is the parametric study, which systematically investigates the model performance with different variables. The results of our parametric study are presented below in terms of the effects of the choking level, water cut, and superficial velocities, respectively.
4.1. Effect of Choke Opening
The experimental study has shown that the restriction can enhance the mixing between the oil and water phases, increasing the mixing layer thickness, decreasing the droplet sizes, and elevating the mixture viscosity and the frictional pressure drop as consequences (see Figure 1 and Figure 2). Figure 11 depicts the pressure gradient as a function of choke opening for three different gas flow rates at a constant liquid flow rate. The solid points are experimental measurements, and the hollow ones are the model predictions. Figure 12 illustrates the predictions from the other three widely used models with the three different oil and water mixture models discussed before. The experimental data demonstrate that the pressure gradient generally increases as the choke opening is reduced. This phenomenon is captured well by the new model. It is expected that the other models do not capture this phenomenon because the choking component is not included in their models. Another group of figures in Figure A1 and Figure A2 in the Appendix A show the model performance as a function of the choke opening for different water cuts at a constant gas and liquid velocity. It can be noted that the new model largely improves prediction as compared with the other models. The three mixture viscosity models, given in Equations (13)–(16), do not show a significant influence on the final model predictions for 60% and 80% water cuts, for which the oil and water flow is treated as oil-in-water dispersed in the mixture model. A large difference is observed for the 20% water cut, where the water-in-oil dispersed flow is assumed in the mixture model. The next subsection discusses the water cut effect on the pressure gradient as well as the model predictions further.
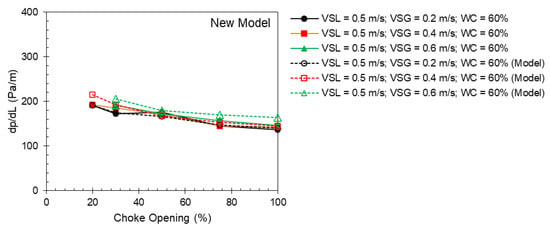
Figure 11.
Measured (solid points) and predicted (hollow points) pressure gradient from the new model as a function of choke opening for different gas flow rates at a superficial liquid velocity of 0.5 m/s and 60% water cut.
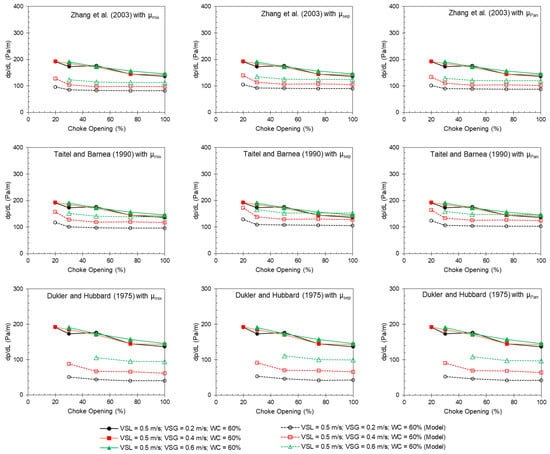
Figure 12.
Measured (solid points) and predicted (hollow points) pressure gradient from the other models by [24,25,26] as a function of choke opening for different gas flow rates at a superficial liquid velocity of 0.5 m/s and 60% water cut.
4.2. Effect of Water Cut
The variation in the pressure gradient with the water cut is a complex phenomenon and depends on the oil and water mixing degrees [1]. Figure 13 and Figure 14 show the pressure gradient as a function of the water cut for the different choke openings at a constant gas and liquid flow rate, and the model predictions. For large choke openings (≥50%), the pressure gradient first decreases as the water cut increases, due to the increase in the water layer thickness. This phenomenon is captured by the new model, which considered the thickness of the free water layer. The pressure gradient bumps up at around an 80% water cut, due to the dense mixing layer on top of the free water layer. This phenomenon is also captured in the new model by the mixing layer. For the 30% choke opening, the experimental results show that the oil and water phases are dominantly dispersed, i.e., a water-in-oil dispersion for a water cut ≤ 30%, and an oil-in-water dispersion for a water cut higher than 30%. The inversion phenomenon is reflected in the pressure gradient plot that shows a peak at around a 30% water cut. The mixing viscosity model in Equation (13) captures the trend well, as shown in Figure 14 (first column). Since the new model is developed mainly for a slug flow with partially mixed oil and water phases, the predicted trend is not as good as the ones predicted by Zhang et al. (2003) [26] or Taitel and Barnea (1990) [25] with the mixing viscosity model.
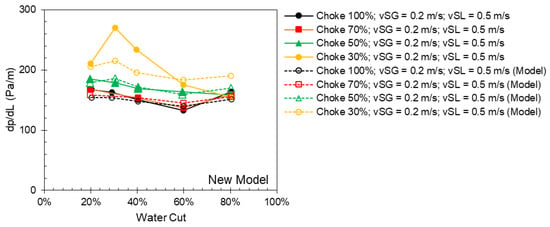
Figure 13.
Measured (solid points) and predicted (hollow points) pressure gradient from the new model as a function of water cut for different choke openings at a superficial liquid velocity of 0.5 m/s and a superficial gas velocity of 0.2 m/s.
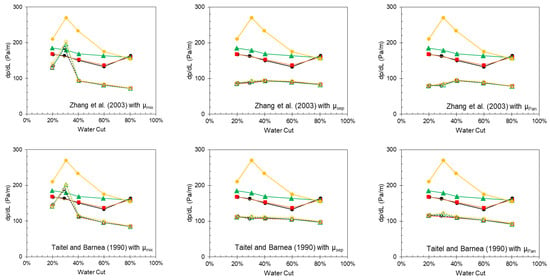

Figure 14.
Measured (solid points) and predicted (hollow points) pressure gradient from the other models by [24,25,26] as a function of water cut for different choke openings at a superficial liquid velocity of 0.5 m/s and a superficial gas velocity of 0.2 m/s.
4.3. Effect of Superficial Velocities
Generally, the pressure gradient increases with an increase in either the liquid or gas flow rate. Figure 15 and Figure 16 show the measured pressure gradient as a function of the superficial gas velocity for different choke openings at a constant liquid flow rate and water cut, and predictions from the new model and other models, respectively. Figure 17 and Figure 18 show the same plots but as a function of the superficial liquid velocity. Overall, all models correctly capture the increased trend with increasing flow rates. However, the other models generally underpredict the pressure gradient for the water cut investigated, regardless of the oil and water mixture viscosity model.
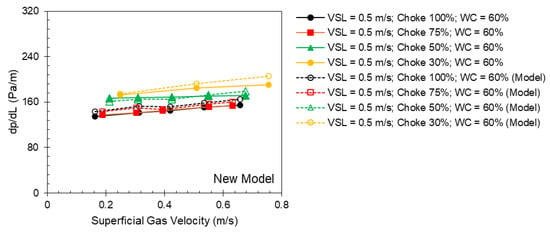
Figure 15.
Measured (solid points) and predicted (hollow points) pressure gradient from the new model as a function of superficial gas velocity for different choke openings at a superficial liquid velocity of 0.5 m/s and 60% water cut.

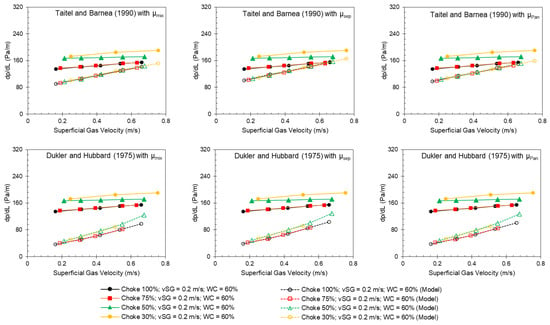
Figure 16.
Measured (solid points) and predicted (hollow points) pressure gradient from other models by [24,25,26] as a function of superficial gas velocity for different choke openings at a superficial liquid velocity of 0.5 m/s and 60% water cut.
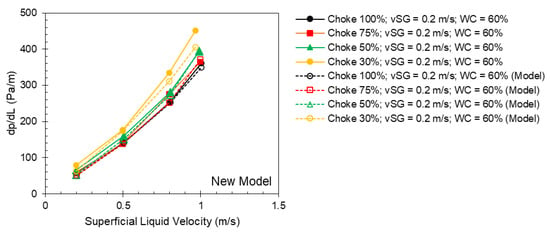
Figure 17.
Measured (solid points) and predicted (hollow points) pressure gradient from the new model as a function of superficial liquid velocity for different choke openings at a superficial gas velocity of 0.2 m/s and 60% water cut.

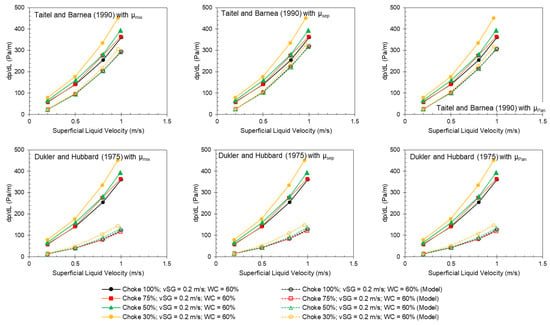
Figure 18.
Measured (solid points) and predicted (hollow points) pressure gradient from the other models by [24,25,26] as a function of superficial liquid velocity for different choke openings at a superficial gas velocity of 0.2 m/s and 60% water cut.
In summary, for the investigated experimental conditions, the new model gives the best predictions for the three-phase slug flow with the oil and water phases being partially mixed. Additionally, the parametric study shows that the new modeling approach effectively captures the effects of the choke size, water cut, and liquid and gas flow rate, on the pressure gradient in horizontal pipes, outperforming other models.
5. Discussion
Although the studies on multiphase flow in pipes have been ongoing for decades, the research on gas–oil–water three-phase flow is still very limited. Due to the complex mixing behavior between the oil and water phases that can be influenced by many factors, a three-phase flow is less predictable compared to the conventional gas–liquid two-phase flow [1]. The existing three-phase flow modeling can be divided into two groups: the stratified model and dispersed model. In the stratified model, the fluid flow is made of three layers, namely a gas, oil, and water layer. This applies to stratified flow such as [1,19,20,21,22,23], and also slug flow like [31]. In the dispersed model, the three-phase flow is treated as a two-phase flow, with the liquid phase being a mixture of oil and water phases in a dispersed status. Several correlations were available in the literature to predict the oil and water mixture effective viscosities [1]. However, the modeling of the three-phase slug flow with partial mixing between the oil and water phases is still blank. In this work, we proposed a novel approach to model this flow pattern. The model evaluation shows that this approach effectively captures the water cut and flow rate effects on the pressure gradient. Additionally, the modeling approach proposed a new method to account for the restriction effect on the pressure gradient. This paves the way for future modeling studies for different types of restrictions or piping components.
As more experimental studies on a three-phase flow downstream of restrictions become available, the modeling work can be expanded to cover a broader flowing condition, pipe diameter and inclination, or fluid properties. As one of our future goals, we are looking at developing a comprehensive model, including a transition boundary model that sheds light on the model selection between the partially mixed model and the fully dispersed model.
6. Conclusions
In this work, we proposed a new approach to model the gas–oil–water three-phase slug flow in horizontal pipes with a focus on the flow pattern in which the oil and water phases are partially mixed. The model considers the effects of restriction, water cut, and gas and liquid flow rates. The model evaluation and the parametric study show that the new approach captures these parameters well and outperforms other models, with an average absolute relative error of 6.71%.
Three-phase slug flow behavior is complex, especially considering the varying mixing degrees between the oil and water phases. Most of the previous slug flow modeling work assumes either a stratified flow or fully dispersed flow between the oil and water phases. The new approach fills the critical gap and provides a novel perspective in modeling a three-phase slug flow in which the oil and water phases are partially mixed. Additionally, the new approach on modeling the restriction effects on the pressure gradient paves the way for the future modeling of different types of piping components and restrictions.
Author Contributions
Conceptualization, D.Z. and Y.F.; methodology, D.Z. and Y.F.; software, D.Z. and Y.F.; validation, D.Z. and Y.F.; formal analysis, D.Z. and Y.F.; investigation, D.Z. and Y.F.; resources, D.Z. and Y.F.; data curation, D.Z.; writing—original draft preparation, D.Z.; writing—review and editing, Y.F.; visualization, Y.F.; supervision, Y.F.; project administration, Y.F.; funding acquisition, Y.F. All authors have read and agreed to the published version of the manuscript.
Funding
This research received no external funding.
Data Availability Statement
Data will be available upon request.
Conflicts of Interest
The authors declare no conflicts of interest.
Appendix A
The two figures in this appendix show the measured and predicted pressure gradient as a function of the choke opening for different water cuts at constant liquid and gas flow rates. The measurement is denoted as solid points, and the model predictions are hollow points. As can be seen, the new model gives the best predictions. For the other three models, the separated viscosity model generally underpredicts the pressure gradient, which is expected. The mixed viscosity model gives a better prediction for the 20% water cut, where water-in-oil dispersion is assumed. It underpredicts the pressure gradient if oil-in-water dispersion is assumed. Regarding the choking effect on the pressure gradient, only the new model can capture this phenomenon. This is also expected as no other model includes this term in the modeling approach.
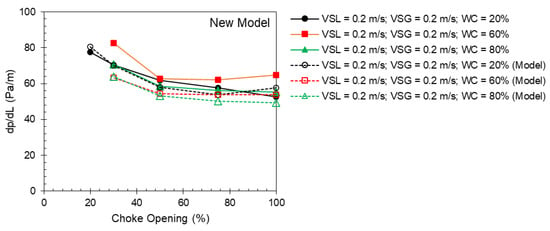
Figure A1.
Measured (solid points) and predicted (hollow points) pressure gradient from the new model as a function of choke opening for different water cuts at a superficial liquid velocity of 0.2 m/s and superficial gas velocity of 0.2 m/s.
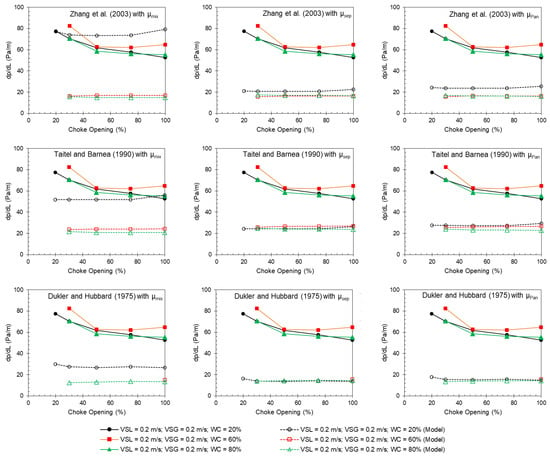
Figure A2.
Measured (solid points) and predicted (hollow points) pressure gradient from the other models by [24,25,26] as a function of choke opening for different water cuts at a superficial liquid velocity of 0.2 m/s and superficial gas velocity of 0.2 m/s.
Appendix B
This appendix explains the statistical parameters used in the model evaluation, which can also be found in [41]. Six errors were used in the model evaluation, which are defined in Equations (A1) to (A6), respectively.
where is the total number of data points; is the ith calculated value; and is the ith actual/measured value. is the average relative error, which indicates the agreement between the predicted and measured values. This means underprediction if it is negative, and overprediction if it is positive. is the average absolute relative error, which is mostly used to indicate the model performance. The smaller , the better the model performance. is the standard deviation. and are the average error and average absolute error, with the same unit as the investigated parameter. is the standard deviation.
References
- Hewitt, G.F. Three-phase gas–liquid–liquid flows in the steady and transient states. Nucl. Eng. Des. 2005, 235, 1303–1316. [Google Scholar] [CrossRef]
- Arabi, A.; Salhi, Y.; Si-Ahmed, E.K.; Legrand, J. Influence of a sudden expansion on slug flow characteristics in a horizontal two-phase flow: A pressure drop fluctuations analysis. Meccanica 2018, 53, 3321–3338. [Google Scholar] [CrossRef]
- Zitouni, A.H.; Arabi, A.; Salhi, Y.; Zenati, Y.; Si-Ahmed, E.K.; Legrand, J. Slug length and frequency upstream a sudden expansion in gas-liquid intermittent flow. Exp. Comput. Multiph. Flow 2021, 3, 124–130. [Google Scholar] [CrossRef]
- Alegría, L.F.A.; Enrique Ortiz-Vidal, L.; Álvarez-Pacheco, C.E.; Bolivar, J.E.C.; Rodriguez, O.M.H. Influence of a restriction on flow patterns, void fraction, and pressure drop in gas–liquid pipe flow. Exp. Therm. Fluid Sci. 2024, 155, 111180. [Google Scholar] [CrossRef]
- Celis, G.E.O.; Rosero, C.M.P.; Loureiro, J.B.R.; Silva Freire, A.P. Breakup and coalescence of large and small bubbles in sudden expansions and contractions in vertical pipes. Int. J. Multiph. Flow 2021, 137, 103548. [Google Scholar] [CrossRef]
- Almalki, N.; Ahmed, W.H. Evaluating the two-phase flow development through orifices using a synchronised multi-channel void fraction sensor. Exp. Therm. Fluid Sci. 2020, 118, 110165. [Google Scholar] [CrossRef]
- Schümann, H.; Tutkun, M.; Yang, Z.; Nydal, O.J. Experimental study of dispersed oil-water flow in a horizontal pipe with enhanced inlet mixing, Part 1: Flow patterns, phase distributions and pressure gradients. J. Pet. Sci. Eng. 2016, 145, 742–752. [Google Scholar] [CrossRef]
- Shmueli, A.; Unander, T.E.; Schümann, H. Oil/Water Pipe-flow dispersions: From traditional flow loops to real industrial-transport conditions. SPE Prod. Oper. 2019, 34, 260–269. [Google Scholar] [CrossRef]
- Skjefstad, H.S.; Dudek, M.; Øye, G.; Stanko, M. The effect of upstream inlet choking and surfactant addition on the performance of a novel parallel pipe oil–water separator. J. Pet. Sci. Eng. 2020, 189, 106971. [Google Scholar] [CrossRef]
- Van der Zande, M.J.; Van Heuven, K.R.; Muntinga, J.H.; Van den Broek, W. Effect of flow through a choke valve on emulsion stability. In Proceedings of the SPE Annual Technical Conference and Exhibition, Houston, Texas, 3–6 October 1999; p. SPE-56640. [Google Scholar]
- Malot, H.; Noïk, C.; Dalmazzone, C. Experimental investigation on water-in-crude oil emulsion formation through a model choke-valve: Droplet break-up and phase inversion. In Proceedings of the 11th International Conference on Multiphase ‘03: Extending the boundaries of flow assurance, San Remo, Italy, 11–13 June 2003; pp. 543–559. [Google Scholar]
- Dalmazzone, C.; Noik, C.; Galinat, S.; Masbernat, O.; Guiraud, P. Flow of a Concentrated Oil-Water Dispersion through a Restriction. In Proceedings of the 12th International Conference on Multiphase Production Technology, Barcelona, Spain, 25–27 May 2005. [Google Scholar]
- Fossen, M.; Arntzen, R.; Hemmingsen, P.V.; Sjöblom, J.; Jakobsson, J. A Laboratory-Scale Vertical Gravity Separator for Emulsion Characterization. J. Dispers. Sci. Technol. 2006, 27, 453–461. [Google Scholar] [CrossRef]
- Fossen, M.; Schümann, H. Experimental study of the relative effect of pressure drop and flow rate on the droplet size downstream of a pipe restriction. J. Dispers. Sci. Technol. 2017, 38, 826–831. [Google Scholar] [CrossRef]
- Paolinelli, L.D.; Rashedi, A.; Yao, J. Characterization of droplet sizes in large scale oil–water flow downstream from a globe valve. Int. J. Multiph. Flow 2018, 99, 132–150. [Google Scholar] [CrossRef]
- Silva, F.S.; Medronho, R.A.; Barca, L.F. Experimental study of water droplet break up in water in oil dispersions using an apparatus that produces localized pressure drops. Oil Gas Sci. Technol. –Rev. D’ifp Energ. Nouv. 2019, 74, 1. [Google Scholar] [CrossRef]
- Babakhani Dehkordi, P.; Colombo, L.P.M.; Guilizzoni, M.; Sotgia, G. CFD simulation with experimental validation of oil-water core-annular flows through Venturi and Nozzle flow meters. J. Pet. Sci. Eng. 2017, 149, 540–552. [Google Scholar] [CrossRef]
- Zhou, D. Three-phase Slug Flow in Horizontal Pipelines Downstream of Restrictions. Ph.D. Thesis, Colorado School of Mines, Golden, CO, USA, 2023. [Google Scholar]
- Hall, A. Multiphase Flow of Oil, Water and Gas in Horizontal Pipes. Ph.D. Thesis, University of London, London, UK, 1992. [Google Scholar]
- Taitel, Y.; Barnea, D.; Brill, J.P. Stratified three phase flow in pipes. Int. J. Multiph. Flow 1995, 21, 53–60. [Google Scholar] [CrossRef]
- Khor, S.H. Three-Phase Liquid-Liquid-Gas Stratified Flow in Pipelines. Ph.D. Thesis, University of London, London, UK, 1998. [Google Scholar]
- Khor, S.H.; Mendes-Tatsis, M.A.; Hewitt, G.F. One-dimensional modelling of phase holdups in three-phase stratified flow. Int. J. Multiph. Flow 1997, 23, 885–897. [Google Scholar] [CrossRef]
- Zaghloul, J.; Adewumi, M.; Thaddeus, M. Hydrodynamic Modeling of Three-Phase Flow in Production and Gathering Pipelines. J. Energy Resour. Technol. 2008, 130, 769–779. [Google Scholar] [CrossRef]
- Dukler, A.E.; Hubbard, M.G. A Model for Gas-Liquid Slug Flow in Horizontal and Near Horizontal Tubes. Ind. Eng. Chem. Fundam. 1975, 14, 337–347. [Google Scholar] [CrossRef]
- Taitel, Y.; Barnea, D. Two-Phase Slug Flow. In Advances in Heat Transfer; Hartnett, J.P., Irvine, T.F., Eds.; Elsevier: Amsterdam, The Netherlands, 1990; pp. 83–132. [Google Scholar]
- Zhang, H.-Q.; Wang, Q.; Sarica, C.; Brill, J.P. Unified Model for Gas-Liquid Pipe Flow via Slug Dynamics—Part 1: Model Development. J. Energy Res. Technol. 2003, 125, 266–273. [Google Scholar] [CrossRef]
- Brinkman, H. The viscosity of concentrated suspensions and solutions. J. Chem. Phys. 1952, 20, 571. [Google Scholar] [CrossRef]
- Herm Stapelberg, H.; Mewes, D. The pressure loss and slug frequency of liquid-liquid-gas slug flow in horizontal pipes. Int. J. Multiph. Flow 1994, 20, 285–303. [Google Scholar] [CrossRef]
- Nicholson, M.K.; Aziz, K.; Gregory, G.A. Intermittent two phase flow in horizontal pipes: Predictive models. Can. J. Chem. Eng. 1978, 56, 653–663. [Google Scholar] [CrossRef]
- Dehkordi, P.B.; Colombo, L.P.M.; Mohammadian, E.; Arnone, D.; Azdarpour, A.; Sotgia, G. Study of viscous oil-water-gas slug flow in a horizontal pipe. J. Pet. Sci. Eng. 2019, 178, 1–13. [Google Scholar] [CrossRef]
- Zhang, H.-Q.; Sarica, C. Unified modeling of gas/oil/Water-Pipe flow-basic approaches and preliminary validation. SPE Proj. Facil. Constr. 2006, 1, 1–7. [Google Scholar] [CrossRef]
- Cohen, L.S.; Hanratty, T.J. Effect of waves at a gas—Liquid interface on a turbulent air flow. J. Fluid Mech. 1968, 31, 467–479. [Google Scholar] [CrossRef]
- Nicklin, D.J. Two-phase bubble flow. Chem. Eng. Sci. 1962, 17, 693–702. [Google Scholar] [CrossRef]
- Bendiksen, K.H. An experimental investigation of the motion of long bubbles in inclined tubes. Int. J. Multiph. Flow 1984, 10, 467–483. [Google Scholar] [CrossRef]
- Gregory, G.A.; Nicholson, M.K.; Aziz, K. Correlation of the liquid volume fraction in the slug for horizontal gas-liquid slug flow. Int. J. Multiph. Flow 1978, 4, 33–39. [Google Scholar] [CrossRef]
- Wallis, G.B. One-dimensional Two-phase Flow; McGraw-Hill: New York, NY, USA, 1969. [Google Scholar]
- Taitel, Y.; Dukler, A.E. A model for predicting flow regime transitions in horizontal and near horizontal gas-liquid flow. AIChE J. 1976, 22, 47–55. [Google Scholar] [CrossRef]
- Blasius, H. Grenzschichten in Flüssigkeiten mit kleiner Reibung; Druck von B.G. Teubner: Leipzig, Germany, 1907. [Google Scholar]
- Andritsos, N.; Hanratty, T.J. Influence of interfacial waves in stratified gas-liquid flows. AIChE J. 1987, 444–454. [Google Scholar] [CrossRef]
- Pan, L. High-Pressure Three-Phase (Gas/Liquid/Liquid) Flow. PhD Thesis, University of London, London, UK, 1996. [Google Scholar]
- Shoham, O. Mechanistic Modeling of Gas-Liquid Two-Phase Flow in Pipes; Society of Petroleum Engineers: Richardson, TX, USA, 2006. [Google Scholar]
Disclaimer/Publisher’s Note: The statements, opinions and data contained in all publications are solely those of the individual author(s) and contributor(s) and not of MDPI and/or the editor(s). MDPI and/or the editor(s) disclaim responsibility for any injury to people or property resulting from any ideas, methods, instructions or products referred to in the content. |
© 2024 by the authors. Licensee MDPI, Basel, Switzerland. This article is an open access article distributed under the terms and conditions of the Creative Commons Attribution (CC BY) license (https://creativecommons.org/licenses/by/4.0/).