1. Introduction
In recent years, the unbundling of the electricity sector together with the profound energy landscape transformation has raised new challenges to network planners and regulators. The European climate and energy objectives aim at an increasing penetration of Renewable Energy Sources (“RES”), a greater diversification of generation sources, the use of sustainable solutions, and increased market integration [
1]. The electricity sector is recognized as one of the main contributors to the energy transition processes, taking place in most countries all over the world [
2]. In the European context, the Member States have made the crucial commitment to become climate-neutral and zero-gas-emission economies by 2050 [
3], as established by the European Green Deal. It is now clear that the energy transition will have an increasingly important impact on economies, labor markets, regulatory directives, and power system development [
4].
Consequently, expansion planning became a very complex multi-objective problem [
5,
6] including the following: the efficient location of transmission expansion developments, the mitigation of transmission congestion, the fulfillment of security and reliability requirements, the nondiscriminatory access to generation resources, the market participants’ competition facilitation, and social and environmental aspects [
7,
8].
New methods are required to identify cost-effective development strategies in the presence of increased uncertainties about load and generation trends, fuel availability, commodity prices, market rules, energy–climate policies, transmission infrastructure costs, and realization of energy storage systems [
8,
9,
10,
11,
12].
In Italy, for the first time in 2017, the Italian Regulatory Authority for Energy, Networks and Environment (ARERA) requested the Italian Transmission System Operator (Terna) to assess the “Target Capacity”, defined as the efficient level of additional transmission capacity to be realized, for each cross-border and cross-zonal boundary of the Italian power system in each significant planning scenario.
This paper presents the novel methodology developed and the results obtained by its third application to the Italian power system real case study, carried out in 2023 [
13].
1.1. The Concept of Target Capacity and Its Implementation in the Italian Regulatory Framework
This section of this paper explains the concept of target capacity and the discussions leading to its implementation in the period 2015–2018.
In the European Council of Barcelona in March 2002, an electricity interconnection target equivalent to at least 10% of the installed generation capacity for Member States by 2005 was established. In October 2014, the Council concluded that “the European Commission supported by the Member States will take urgent measures in order to ensure the achievement of a minimum target of 10% of existing electricity interconnections, as a matter of urgency, and no later than 2020”. Furthermore, the European Commission proposed to extend the interconnection target up to 15% by 2030.
These one-size-fits-all interconnection targets received heavy criticisms, among others from the Agency for the Cooperation of Energy Regulators (ACER) [
14], the Council of European Energy Regulators [
15], and the Italian Energy Regulatory Authority [
16,
17]. These criticisms relate to the risks of building inefficient transmission capacity (because the benefits could be lower than costs), to a potential risk of under-investment (when additional capacity above the interconnection target would be efficient), and to double counting effects when used in a cost–benefit analysis or in a multi-criteria analysis.
Also, for these reasons, since its public consultation 464/2015 [
18], ARERA proposed the concept of target capacity, meaning the transmission capacity which is economically efficient to build because its benefits outweigh its costs.
The concept of target capacity was initially proposed in 2012 by ACER in its Opinion 06/2012 on the draft Ten Year Network Development Plan (TYNDP) 2012 [
19]: “since the main purpose of the TYNDP is to identify the investment gaps, notably with respect to cross border capacities, the Agency expects ENTSO-E to develop a specific assessment of cross-border capacities. The aim should be to identify a target value (MW) for the additional transfer capacities at cross-border boundaries”. In the same opinion, ACER acknowledged the complexity related to the quantification of the target and the possibility to identify capacity ranges according to each scenario’s assumptions and each sensitivity case. We note that ACER initially proposed the concept of target capacity as the efficient additional capacity (beyond the existing capacity).
In order to help identify an optimal level of interconnection capacity between bidding zones, ENTSO-E introduced the definition and calculation of target capacities at each border in the TYNDP 2014 and refined them in the ENTSO-E Regional Investment Plans 2015 and in the TYNDP 2016. In particular, the target capacity for every boundary between bidding zones corresponds to the value above which further transmission capacity realization would not be beneficial because the economic benefit corresponding to the additional capacity cannot outweigh the deriving costs. We note that under such a definition (retained by ARERA), the target capacity is the total efficient capacity at a specific boundary.
After carrying out a second consultation in 2017, ARERA adopted its Decision 884/2017 [
20], which requested the Italian Transmission System Operator Terna to prepare during the year 2018 a report about the identification of the target capacities for the relevant internal market sections and towards external network borders of the Italian power system.
In 2018, as already envisaged during the public consultations, ARERA adopted an output-based regulatory scheme applicable at that time until 2023 and afterwards with amendments until 2027 [
21,
22], which rewards the commissioning of new transmission capacity at a number of boundaries of the Italian power system (till the target capacity level) related to the achieved system benefits. No rewards are foreseen for capacity increases which exceed the target capacity values set out by ARERA.
For each boundary, the maximum reward (which is granted to Terna when the target capacity is reached) is defined as a combination of a percentage of congestion revenues and of a percentage of the benefit related to the increase in Socio-Economic Welfare at that boundary. The choice of these parameters aims at providing more rewards for capacity increases at the boundaries where the congestion revenues and the expected benefits are higher.
If the increase in the transmission capacity does not reach the target capacity, the reward is granted as a part of the maximum reward proportionally to the ratio between the capacity increase and the difference between the target capacity and the previously available capacity.
Later, ARERA also requested the preparation of three editions of the Target Capacity Report (2020, 2022/2023, and 2024) and their review by several independent experts, publicly available [
23,
24]: from the first version in 2018 [
25], relevant improvements based on experts’ suggestions were introduced in the second [
26] and in the third editions of the target capacity assessment methodology.
Meanwhile, at European level, from 2018 onwards, ENTSO-E progressively implemented the same concept in the biennial editions of the “Identification of System Needs” report.
Since 2022, the concept of target capacity (under a new term “infrastructure gaps”) became an element of European legislation: Article 13 of Regulation (EU) 869/2022 requires ENTSO-E to perform an identification of infrastructure gaps every two years. In addition, Article 14 of the same regulation requires a specific “target capacity” exercise for offshore networks [
27].
In the rest of this paper, the target capacity can be interpreted as the cost-effective target value (MW) for the transfer capacity development across internal market sections/external borders.
1.2. Aim and Contribution
The aim of this paper is to present a novel iterative methodology for the identification of target capacities and its application to the Italian power system across internal market sections and external borders. To assess the cost-effective additional transmission capacity, both market simulations based on zonal models and network simulations based on detailed network topology have been performed so as to include in the analysis economic considerations (e.g., market design, regulation, generation costs, and power units bidding strategy) and technical network aspects (e.g., power flow distribution, losses, network topology, and reliability aspects).
The analyses have been carried out in two relevant planning contrasting scenarios for the long-term 2030 and very-long-term 2040 horizons, i.e., the policy scenario “Fit for 55” in 2030 (“FF55 2030”) and “Distributed Energy” in 2040 (“DE 2040”) and the technology-driven scenario “Late Transition” in 2030 and 2040 (“LT 2030”, “LT 2040”) [
28], with the aim to consider the uncertainty affecting the provisional demand, generation, and energy storage capacity trends and commodity prices in a long-term view.
The novel contributions of this paper are as follows:
- (1)
The formulation of a new heuristic methodology for assessing the cost-effective additional transmission capacity, adopting a multi-criteria analysis solved by the means of “Technique for Order Performance by Similarity to Ideal Solution” (“TOPSIS”) [
29,
30,
31,
32] to select transmission capacity increases to be implemented in each iteration of the process;
- (2)
The identification of different development strategies (one for each considered scenario) based on an iterative process adopting market and network simulators able to include several relevant planning aspects and benefit categories;
- (3)
The definition of marginal investment cost and benefit curves of new transmission capacity for each section/border in each considered planning scenario;
- (4)
The representation and discussion of the results obtained from a real case study application and the output stability when considering relevant input variations in specific sensitivity analysis.
1.3. Paper Organization
The rest of this paper is organized as follows:
Section 2 reports a literature review, while
Section 3 presents the formulation of the developed methodology. The simulation tools are described in
Section 4.
Section 5 illustrates the results obtained for the Italian power system case study for both the 2030 and 2040 horizons, together with sensitivity analysis outputs. Lastly,
Section 6 provides the main conclusions.
2. Literature Review
The purpose of the target capacity assessment methodology is to identify the additional cost-effective transfer capacity between internal bidding zones and at external borders of the Italian power system. The purpose of the activity is twofold: first, to facilitate the development of an efficient and economical transmission system, by supporting the decisions on new projects in the Ten Year National Development Plan (“NDP”) and, second, to support the definition of the output-based regulatory scheme rewarding the increases in transmission capacities.
It is worth highlighting that the proposed methodology does not replace the cost–benefit analysis associated with planned projects included in the NDP, neither is it aimed at verifying the individual planned projects’ usefulness. It instead provides the cost-effective level of interconnection within the national transmission system and to other external borders so to give indications where it is expected to be more beneficial to locate new transmission projects. The methodology aims at addressing the complexity of multiple capacity increases at several boundaries and at exploring an optimal development of the entire transmission system under study. Such a dimension is hardly addressed by the traditional cost–benefit analysis of individual projects, which has the purpose of confirming the features of pre-identified candidate projects and of quantifying their societal added value, while it cannot provide a holistic view about project interdependencies across the whole system.
As the target capacity across a market section/border is defined as the “cost-effective transfer capacity”, the present methodology is based on the definition of a marginal cost curve at each boundary and on an iterative process defining the marginal benefit of the new capacity addition for each section/border in each relevant planning scenario.
In the literature, several mathematical optimization, heuristic, and meta-heuristic methods [
33] have been proposed to solve the transmission expansion problem and identify robust development strategies in an uncertain environment. A complete literature review on transmission expansion models is presented in [
34].
The first category (mathematical optimization) includes all approaches formulizing the transmission planning as an optimization problem: once the objective function is defined, it is subjected to all relevant technical and economic constraints manageable by the algorithm. The solution is obtained by means of different techniques, such as linear programming [
35,
36], non-linear programming, mixed-integer linear programming (“MILP”) [
5,
37], and mixed-integer non-linear programming (“MINLP”) [
7]. The practical limitations of the use of the optimization methods are the substantial computational efforts and the need for simplifications reducing the quantity of transmission expansion problem aspects under consideration. In fact, the mathematical formulation of multiple conflicting planning objectives made the application of rigorous optimization methods to large power systems very difficult: most of the proposed approaches are then applied to the Garver 6-bus system, IEEE 14-bus system, IEEE 24-bus systems, or larger systems under perfect competition assumptions.
According to [
34], the heuristic methods proceed “step-by-step, generating, evaluating and selecting expansion options” with or without direct user actions. Some works based on heuristic methods are [
38], describing a transmission expansion tool based on the “least effort” criterion, ref. [
39] presenting a transmission expansion model based on the decomposition in different investment and operation subproblems, and ref. [
40] proposing a branch and bound technique to solve the investment sub-problem.
A further classification of transmission expansion planning methods can be based on different relevant aspects included in [
41]. The two network probabilistic reliability criteria, Lack Of Load Expectation (LOLE) and Expected Energy Not Supplied (EENS), are considered in [
42,
43], and the maintenance impacts on transmission expansion costs and reliability are included in [
44]. The maximization of producers’ surplus, consumers’ surplus, and transmission operator profit is modeled in [
38]. The investment cost is included in methods proposed in [
10,
45], while a formulation considering bidding strategy estimation from historical data and fuel costs is presented in [
7]. The environmental constraints related to CO
2 emissions are addressed in [
46] together with network security aspects.
With the aim of developing a methodology able to find feasible solutions to the target capacity assessment regulator request, obtaining reasonable computational times while taking into account all relevant information about the main characteristics of the whole interconnected European power market and the detailed national grid topology for transmission (400–230 kV) and sub-transmission (150–132 kV) voltage levels, Terna adopted a heuristic approach. Standard development options are early assessed in terms of investment costs and transfer capacity increase size and then tested in each suitable section/border to define the related benefits. A multi-criteria decision-making (MCDM) problem is applied to rank the alternatives and reduce the computational effort: the congestion hours, the average values of hourly price spreads, the investment cost, and the project progress indicators are used to select the market sections/borders where transmission capacity increases might be profitable, in order to have shortened running time requirements. This kind of approach allows us to fix robust sub-optimal development strategies in a multi-scenario analysis, exploring a large research solution space under the constraints derived from empirical evidence. Three different custom-written tools enclosing the specific characteristics and inherent complexity of the Italian power system in the restructured competitive environment are adopted: demand hourly profiles, reliability and security costs, maintenance constraints, multiple contingencies, ohmic losses, hydrological scenarios, and bidding strategies are all aspects considered in the Day-Ahead zonal Market, Ancillary Services zonal Market, and Grid Reliability and Adequacy nodal network simulators in our analysis [
47,
48,
49]. The investment costs are included based on the most recent information about already planned projects and reference values available in the literature.
The developed approach represents a relevant novelty in planning methods adopted by the other European TSOs. In fact, the yearly “Network Option Assessment Report” (“NOA”) carried out by the Great British System Operator “National Grid” [
50] aims at recommending in which development projects proposed by the Transmission Owners (“TOs”) there should be investment during the coming year, performing a market analysis consistent with the significant energy scenarios and the system requirements identified in the “Electricity Ten Years Statement” [
51] and providing a prioritization of the candidate options. The “Power System Needs 2030 and 2040 Report” [
52] of ENTSO-E is a partial exercise detecting the one cross-border cost-efficient capacity-specific dimension of the European power system. Moreover, this latter analysis is performed in one energy scenario, and only the Socio-Economic Welfare benefit is evaluated (“SEW-based” needs). However, both the mentioned practices adopt only the market simulations performed through a single tool.
The iterative methodology developed by Terna detects the cost-efficient target capacity for each internal section and external border of the Italian power system in a multi-scenario and multi-year analysis including network topology details, evaluating several benefits and exploring new solutions able to increase the interconnection levels besides the transmission capacity provided by the already planned projects, avoiding the risk of profitable investment underestimation.
Terna developed the methodology for the target capacity assessment consistently with regulator directives and academic experts’ reviews and launched its consultation: relevant stakeholders’ feedback supported improving the methodology before its application.
3. Target Capacity Assessment Methodology
3.1. Formulation
The present methodology provides the cost-effective target capacity for each scenario under study and in each considered time horizon; the least regret technique [
51,
53,
54] is then applied to define the unique recommended development strategy for a reference time horizon.
The initial network (or “base case”) is made up of the existing grid and the projects that have a strong chance of being implemented by the date of the considered scenarios.
The benefits related to these projects are initially evaluated using the “Take Out One at the Time” (TOOT) method [
52], in compliance with the cost–benefit analysis performed in the European context.
Starting from the base case, an iterative approach is adopted. All sections/borders of the power system under study are investigated as development alternatives by the means of the TOPSIS method considering the following decision criteria:
Criterion 1 (
), equal to the number of congestion hours across the
k-th section/border
[h]:
Criterion 2 (
), equal to the
k-th section/border average of absolute market energy hourly price spread in the
i-th iteration and in the
s-th scenario,
[EUR/MWh]:
Criterion 3 (), equal to the marginal investment cost on the i-th transmission capacity unitary increase on the k-th section/border [MEUR/MW];
Criterion 4 (), equal to the “project progress” of the specific network development project considered as a reference for the k-th section/border marginal investment cost in the i-th iteration.
and result from market simulation performed at the beginning of each i-th iteration, while , , and criteria weight values are input data defined by the Decision Maker (DM).
The multi-criteria analysis allows us to assess the alternative performances with respect to all considered criteria in each iteration: a section/border is considered suitable for additional transfer capacity if its performance index
triggers the respective reference threshold, separately defined for external borders (
) and for internal sections and (
):
Once the threshold is triggered on one (or more) section/border, additional transmission capacity is implemented using the “Put IN one at the Time” (PINT) method [
55]: the new transfer capacity
is put on the
k-th section/border of the reference grid in the
i-th iteration and the associated marginal benefit
evaluated. If the “
cost-effectiveness condition” is respected, the following is true:
The additional transfer capacity usefulness is confirmed on the reference grid in the i + 1-th iteration, and a point on the individual section/border marginal cost–benefit curve is depicted.
The iterative process stops when no section/border presents favorable conditions to new transmission capacity increases which means that thresholds are not triggered or, if they are, Condition (4) is not satisfied.
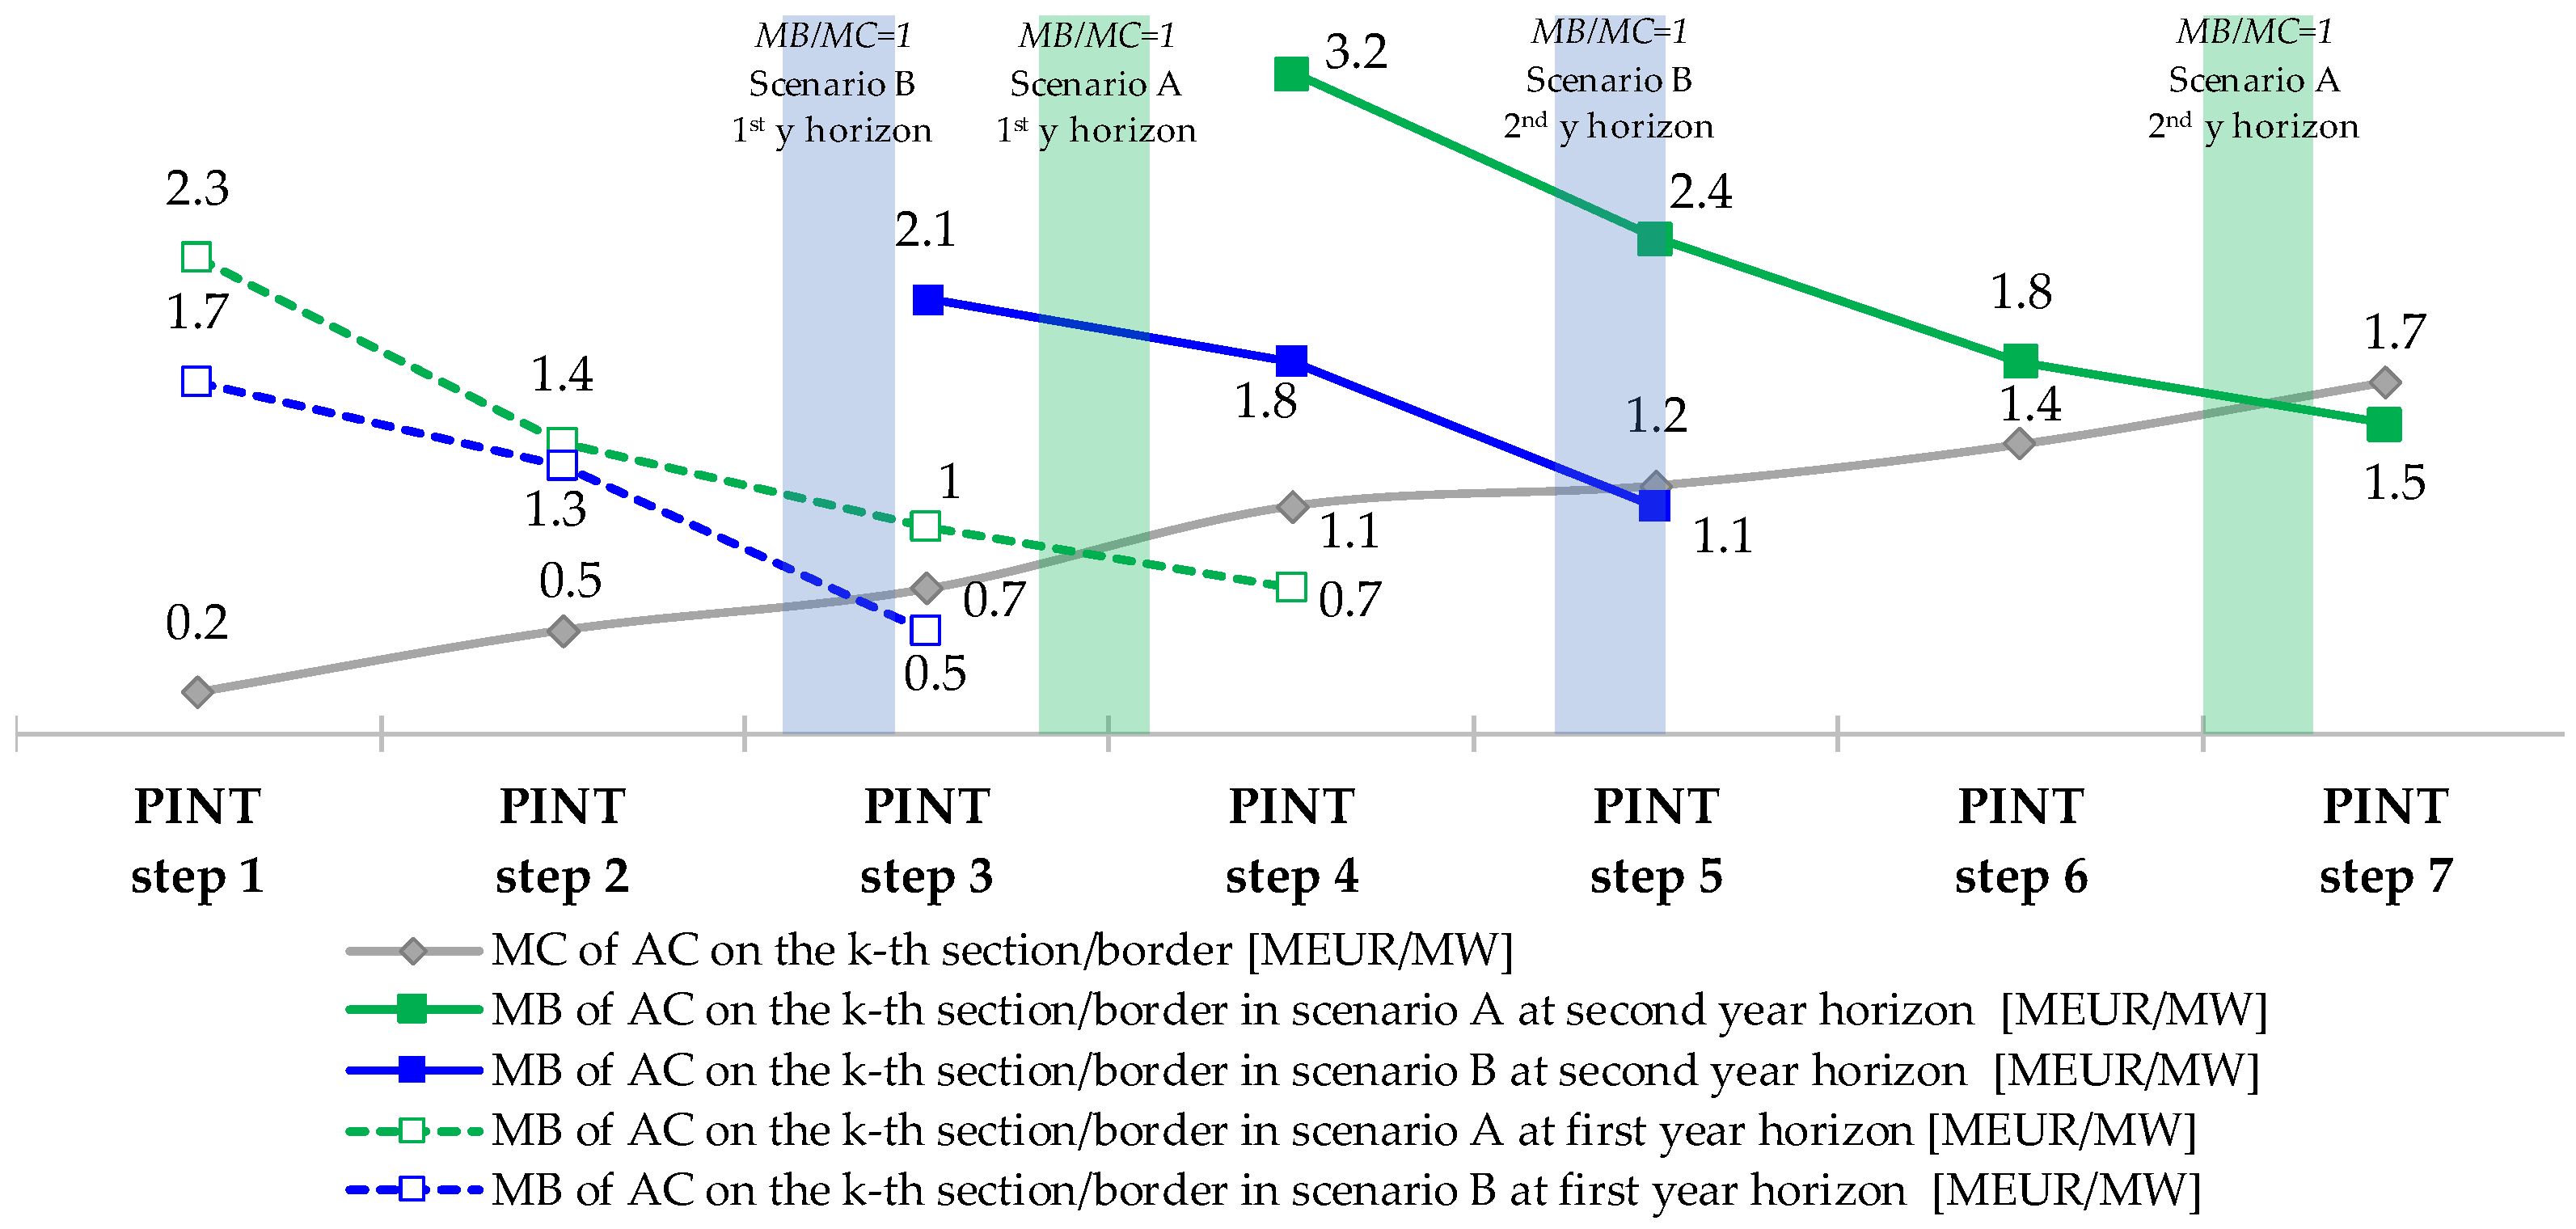
Finally, at each section/border, the marginal cost and benefit curve is enriched with values related to the last iteration. An explicative example of the
k-th section/border marginal cost and benefit curves resulting from the iterative process for two different scenarios and two different time horizons is illustrated in
Figure 1: the target capacity is defined around the intersection of the decreasing marginal benefit and the increasing marginal cost curves, highlighted by the marked green and blue areas for Scenario A and B, respectively. The iteration to identify the development strategy in the second year horizon starts from the last PINT tested in the first ones.
The cost-effective transmission capacity increase for the
k-th section/border in the
s-th scenario,
, is defined around the intersection of the marginal cost and benefit curves, as expressed in (5):
where the following terms are used:
represents the number of iterations for which Condition (4) is satisfied for the i-th transmission capacity increase on the k-th section/border in the s-th scenario ;
is the last transmission capacity increase on the k-th section/border, corresponding to the last iteration in the s-th scenario;
represents the ratio between the marginal benefit and the marginal cost related to the last transmission capacity increase on the k-th section/border in the s-th scenario (i.e., the capacity increase with benefits below costs).
The target capacity is then defined as follows:
where
is the existing transmission capacity in the
k-th section/border.
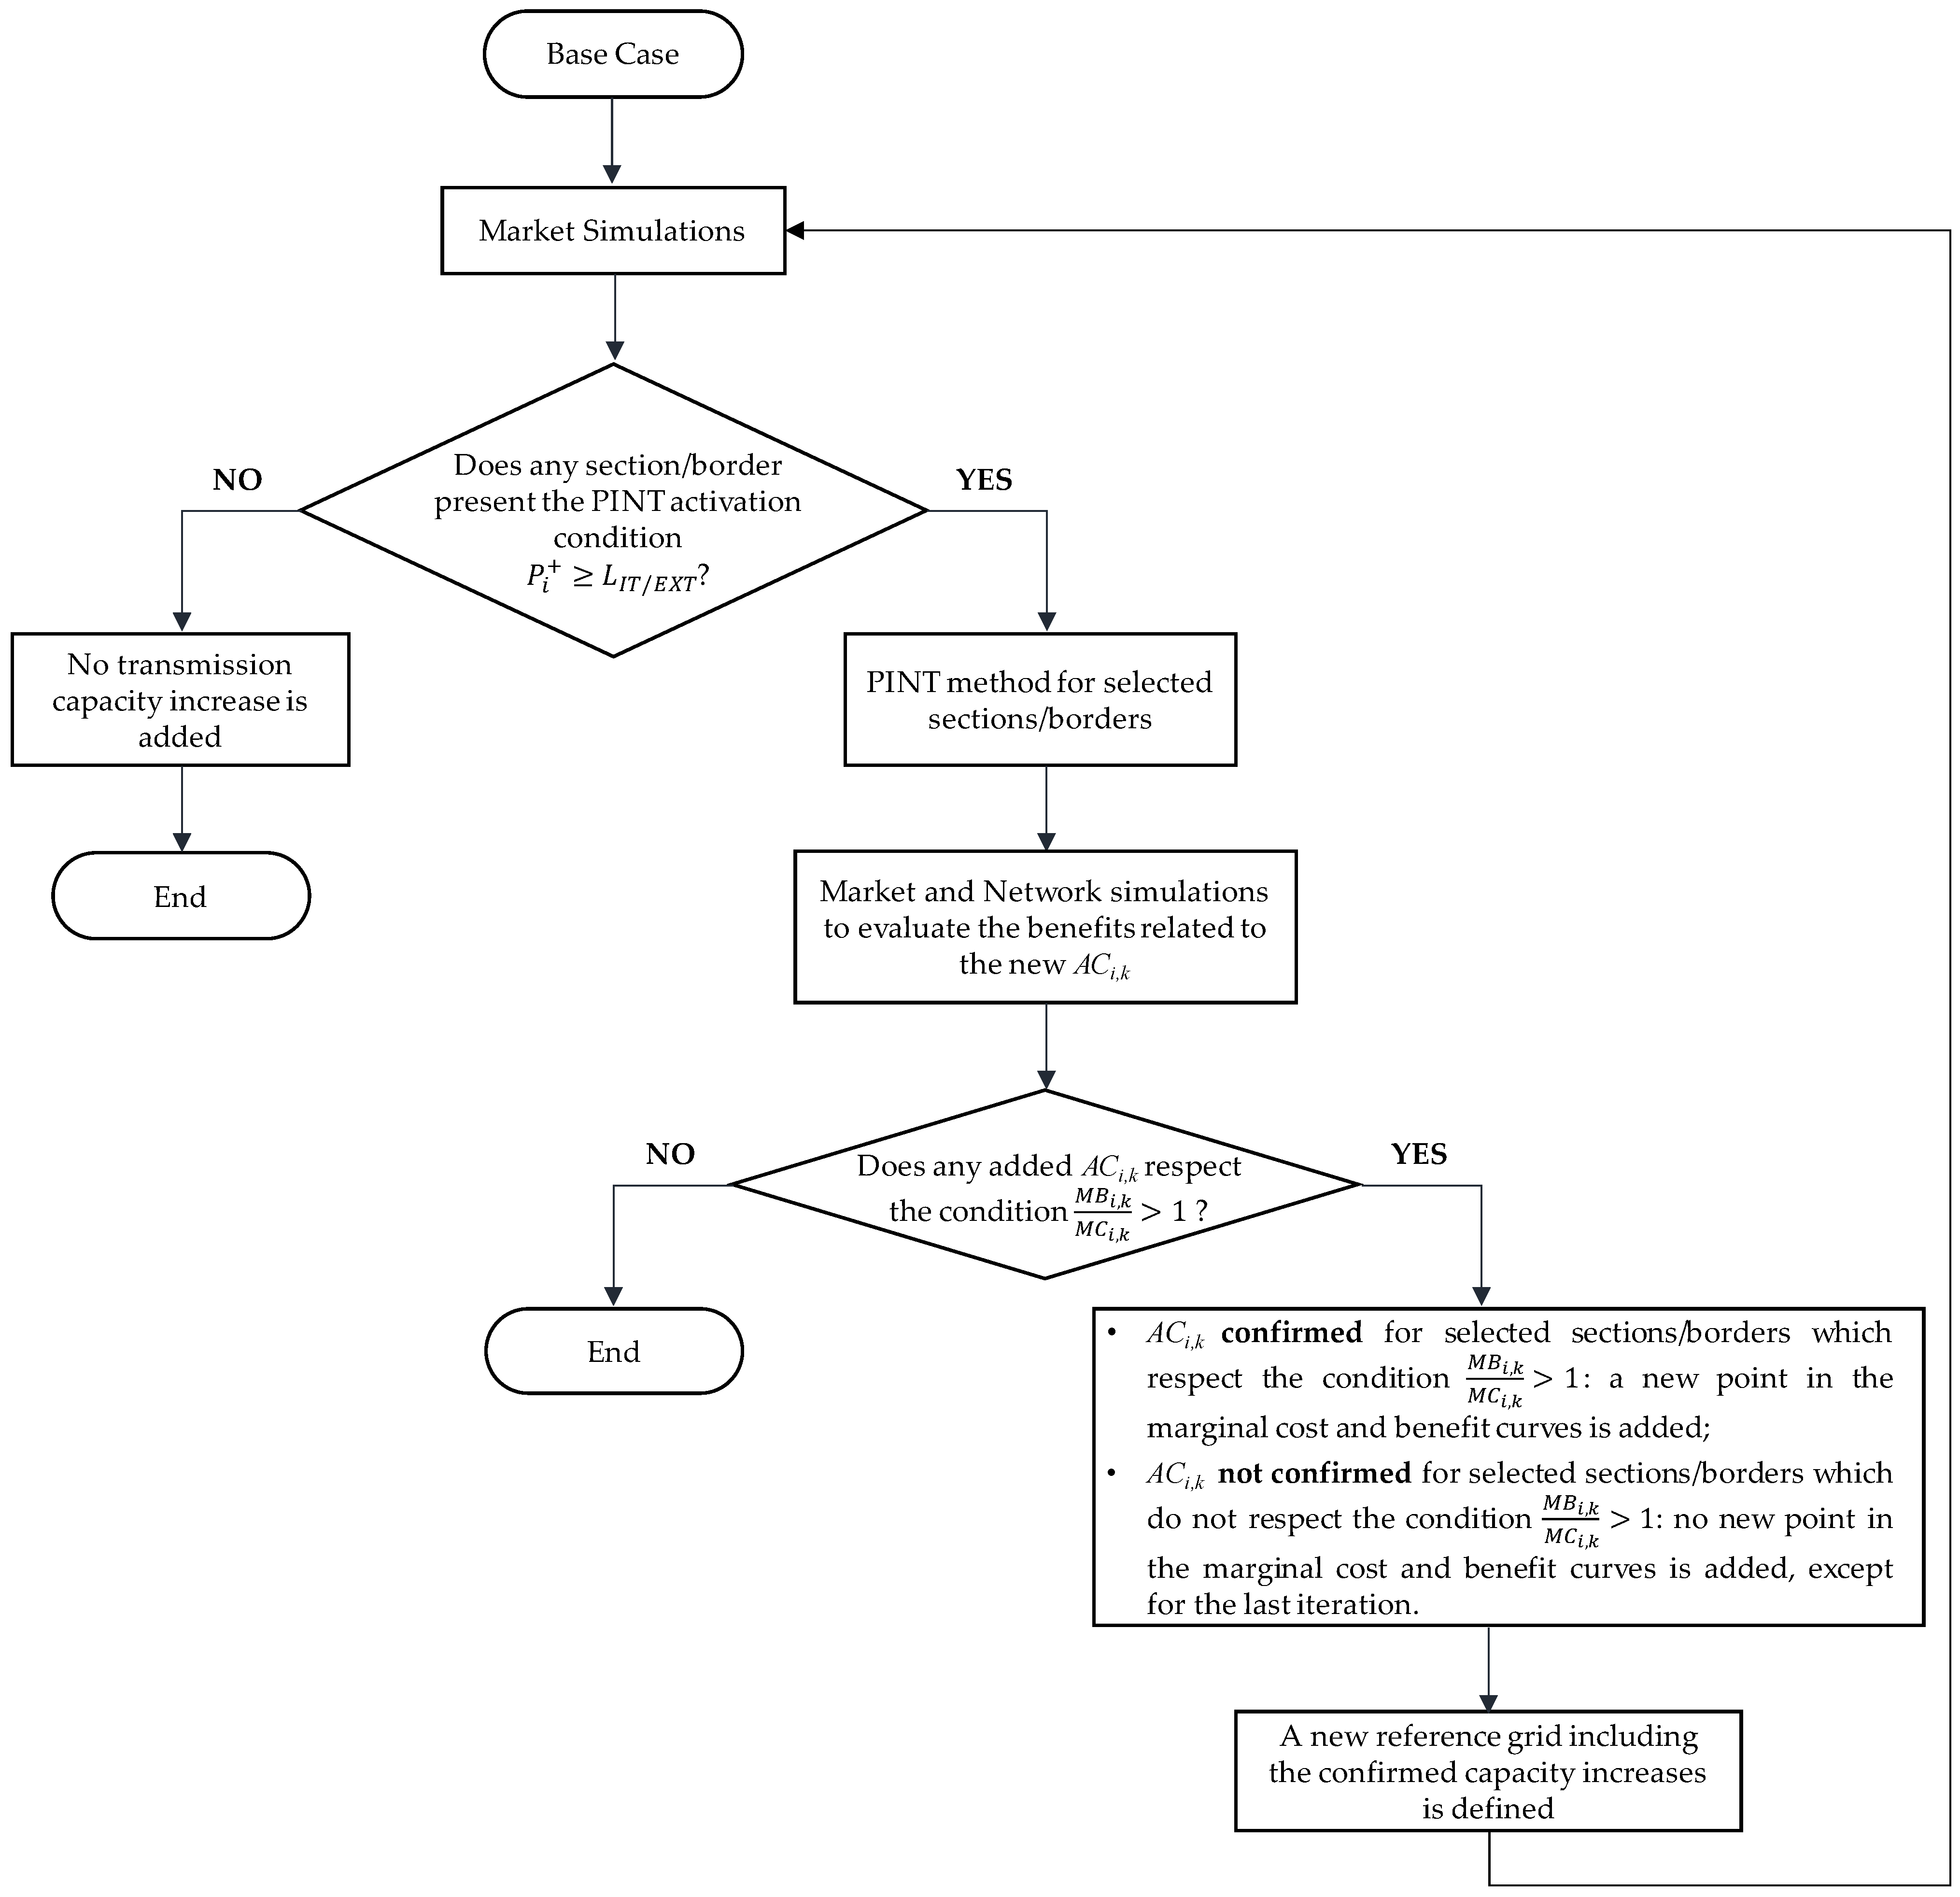
The workflow of the entire iterative process is depicted in
Figure 2.
3.2. Marginal Cost Evaluation
First of all, the evaluation of the marginal cost at each section/border considers the unitary investment costs of already planned projects (included in the NDP). The order in which they are considered depends on the project progress.
If the target capacity needed on the
k-th section/border exceeds those provided by the planned projects, further reference marginal costs must be assumed. It is clear that, in this case, the cost estimation is subject to significant uncertainty without supporting information on the details of the project realization. The report [
56] provides useful reference values for relevant electricity infrastructures (overhead transmission lines, underground and subsea cables, onshore AC substations, and HVDC converters): the information is based on historical data collected under the TSOs and other developer experiences in electricity infrastructure realization.
In the Italian context, Terna developed a new methodology for the assessment of standard investment costs [
57], approved by the regulator in 2017.
With particular reference to the unit investment costs of development projects affecting external borders, it is assumed that Italy covers half of the total cost, in the absence of any other information.
Since the capacity increases are fixed while the transmission capacity increases provided by the projects are case-specific, they can contribute in a different manner to the final target capacity in the subsequent iterations. Given , the set of all the ω-th projects (planned or not) to be considered on the k-th section/border in the i-th iteration, the following different cases could occur:
The weighting factor of the
ω-th project in the set
compared to the needed
i-th additional transmission capacity increase on the
k-th section/border can be expressed as follows:
All the ω-th projects on the k-th section/border contribute to the marginal cost curve definition in an orderly manner as a function of increasing unit investment cost. Once a specific project transmission capacity increase is fully considered up to the i-th iteration, i.e., , it is no longer used in the following iterations.
The marginal cost expression can be generalized as follows:
3.3. Marginal Benefit Evaluation
The benefit categories included in the target capacity assessment and the respective simulators adopted are listed in
Table 1.
The marginal benefit values need to be discounted to the present year, in order to allow the comparison with the expected unitary investment costs. The
i-th transmission capacity unitary increase on the
k-th section/border marginal benefit is defined as follows:
where the following terms are used:
3.4. Least Regret Approach
The developed iterative methodology results in the identification of n development strategies (or “options”), one for each scenario under study: the least regret approach is employed to define the unique set of cost-effective target capacities to aim for. In fact, it allows us to determine the best option as the one that leads to the lowest regret for the DM.
In this context, since the main objective is maximizing the benefit to the system, the net benefit (difference between total benefit and investment costs) is considered as the most significant indicator.
The regret related to the
n-th development strategy in the
s-th scenario,
, can be expressed as follows:
where the following terms are used:
represents the net benefit of the n-th option in the s-th scenario;
represents the net benefit of the reference option, i.e., the development strategy that presents the highest net benefit in the s-th scenario.
Selecting the development strategy with the lowest maximum regret exposes the entire system to the least amount of risk. Therefore, the set of final values of target capacity respects the min-max criterion:
4. Simulation Tools
4.1. Day-Ahead and Ancillary Service Zonal Market Simulators
The electricity market simulations allow for the assessment of a first set of benefits (B1, B18, B19, B8), leaving the evaluation of the remaining benefits (B3, B5, B7) to the network analysis. To this aim, both Day-Ahead spot Market (DAM) and Ancillary Services Market (ASM) studies were sequentially performed, coherently with the sequential order of the real Italian power market sessions.
For DAM simulation studies, the full model of the European electric grid adopted by ENTSO-E for the TYNDP was used. This model represents the European bidding zones using a single branch to characterize the equivalent transmission capacity between interconnected market zones. The model considers a single node for each country, with the exception of Denmark, France, Greece, Italy, Luxembourg, Norway, Sweden, and the United Kingdom.
The DAM studies were performed through the market simulator “Promed Grid”, representing one of the standard tools at ENTSO-E level. Starting from a yearly scenario dataset, hourly profiles of renewable generation and load consumption are stochastically obtained by exploiting typical meteorological years and statistical demand trends. On this basis, the tool carries out an optimal coordinated hydro-thermal planning of the generation portfolio with an hourly time discretization over one year, implementing the day-ahead hourly energy market, characterized by a system marginal price and by congestion management determined through a zonal market-splitting procedure [
47].
The Promed Grid is based on a deterministic model that considers both the economic and technical aspects of the power systems: the simplified market model, the hourly load, thermal generation fleet technical data, costs and constraints associated with different fuel types, thermal unit production constraints, and technical data of the hydro-generation set.
The simulator determines each generating unit hourly output and the flows in the equivalent links between the different bidding zones. It also calculates further indicators pertaining to the environmental impact associated with each market solution, such as the corresponding emissions (CO2, NOX, SOX) and dust emissions.
The DAM simulation is carried out in two different computational phases:
Unit commitment: according to a merit order and considering the system constraints, the on/off state of each thermal power unit is determined;
Dispatching: the coordinated hydro-thermal hourly production scheduling is defined in compliance with system constraints.
The final market solution results from an iterative converging process aimed at a bidding strategy recovering at least each generation unit’s variable costs, revised after each iteration loop. In each loop, the optimal operation generation schedule of the generating system is obtained solving a very large quadratic programming optimization problem. The objective function consists in the total variable generation costs minimization while respecting all the technical constraints.
The Ancillary Services Market (ASM) studies have been carried out by the means of the simulation tool “Modis” [
48], a multi-area market simulator, specifically tailored to the Italian ASM, performing the yearly simulation of the ASM based on a pay-as-bid mechanism. It simulates ASM procurement actions for different services, such as secondary and tertiary reserve margins and real-time balancing, with hourly discretization for a whole year.
Starting from the preliminary schedules of generating units resulting from the DAM simulation, Modis emulates the ASM behavior modifying the generating schedules in order to ensure the appropriate reserve margins in each bidding zone and offsetting the gaps between demand and supply, consequent to simulated unbalances. For this reason, the deterministic model implemented in Modis belongs to the class of “security constrained differential unit commitment problems”, where upward and downward regulation of the controllable variables is conducted starting from an initial status inherited from the DAM solution. The objective function is the minimum rescheduling cost based on the bidding model included in the simulation tool.
4.2. Grid Reliability and Adequacy Simulator
The remaining set of benefits (B3, B5, B7) is assessed through network studies based on a Grid Reliability and Adequacy simulation model, using the Grid Reliability and Adequacy Risk Evaluator (named “Grare”) [
49].
A network model derived from the Italian transmission grid including all the voltage levels (380, 220, 150, and 132 kV) was used. In particular, the nodal network model consists of about 11,000 nodes, 10,000 lines, and 4000 transformers. In addition, the busbar model of the European countries was included, considering the national loads and the generation fleet of each zone in accordance with the TYNDP scenarios, neglecting the internal transmission grid and the related network losses.
The adopted network simulator is able to evaluate large power systems’ reliability level through a probabilistic approach: security, operational, and economic constraints are all processed in a non-sequential Monte Carlo simulation, managing multiple different stochastic variables (i.e., climate conditions, renewable sources generation profiles, network element failure rates, and maintenance constraints).
At the end of each simulation, the two main power systems reliability indicators are evaluated:
The Expected Energy Not Supplied, or “EENS”, (in MWh) is defined as the average value of the annual not supplied demand among the several years simulated;
The Loss of Load Expectation, or “LOLE”, (in h/y) is defined as the expected amount of hours per time period when the available generation capacity is not sufficient to cover the demand.
In each Monte Carlo extraction, the total residual load
RL is computed as follows:
where the following terms are used:
L is the total demand of the system;
R represents the system reserve requirements;
RES indicates the renewable sources output (solar, wind, and hydro);
IG represents the imposed production (e.g., bioenergy and geothermal).
Maintenance, faults, and other power unit constraints (i.e., must-run) are also considered to define the available thermal set.
The system condition is simulated by using weekly sampling, and the initial thermal unit commitment is obtained by the means of a mixed integer method, taking into account the requirements in terms of operational reserve to be satisfied in each bidding zone.
The optimal power unit dispatching is then evaluated by solving a linear problem according to the obtained cross-zonal exchanges, and possible load-shedding events resulting from available generation and import capacity inadequate to meet the demand are identified.
In the output from the simulation, the power production of each power unit and energy source, EENS and LOLE indicators, and power flows are provided. This procedure is replicated and parallelized for all weeks, and the results are weighted on the total test number.
5. Case Study and Results
The proposed methodology was built for real-world applications. The Italian power system case study in two contrasting energy scenarios and in two different year horizons is presented in this section.
5.1. Data and Scenarios
Given the academic independent experts’ indications and the system needs study approach adopted at the European level in the latest TYNDP [
52], the target capacity assessment was performed for both long-term 2030 and very-long-term 2040 horizons in the same relevant planning scenarios adopted in the 2023 NDP cost–benefit analyses [
61] and deeply described in [
28], in particular the following:
The policy scenarios “Fit for 55” in 2030 (“FF55 2030”) and “Distributed Energy” in 2040 (“DE 2040”) in line with CO2 emissions reduction and share of renewables in the total electricity demand in Italy, requiring approximately +70 GW by 2030 and +120 GW by 2040 of new RES capacity;
The technology-driven scenarios “Late Transition” in 2030 and 2040 (“LT 2030” and “LT 2040”) mostly aligned with the less challenging objectives of the previous National Energy and Climate Plan (NECP).
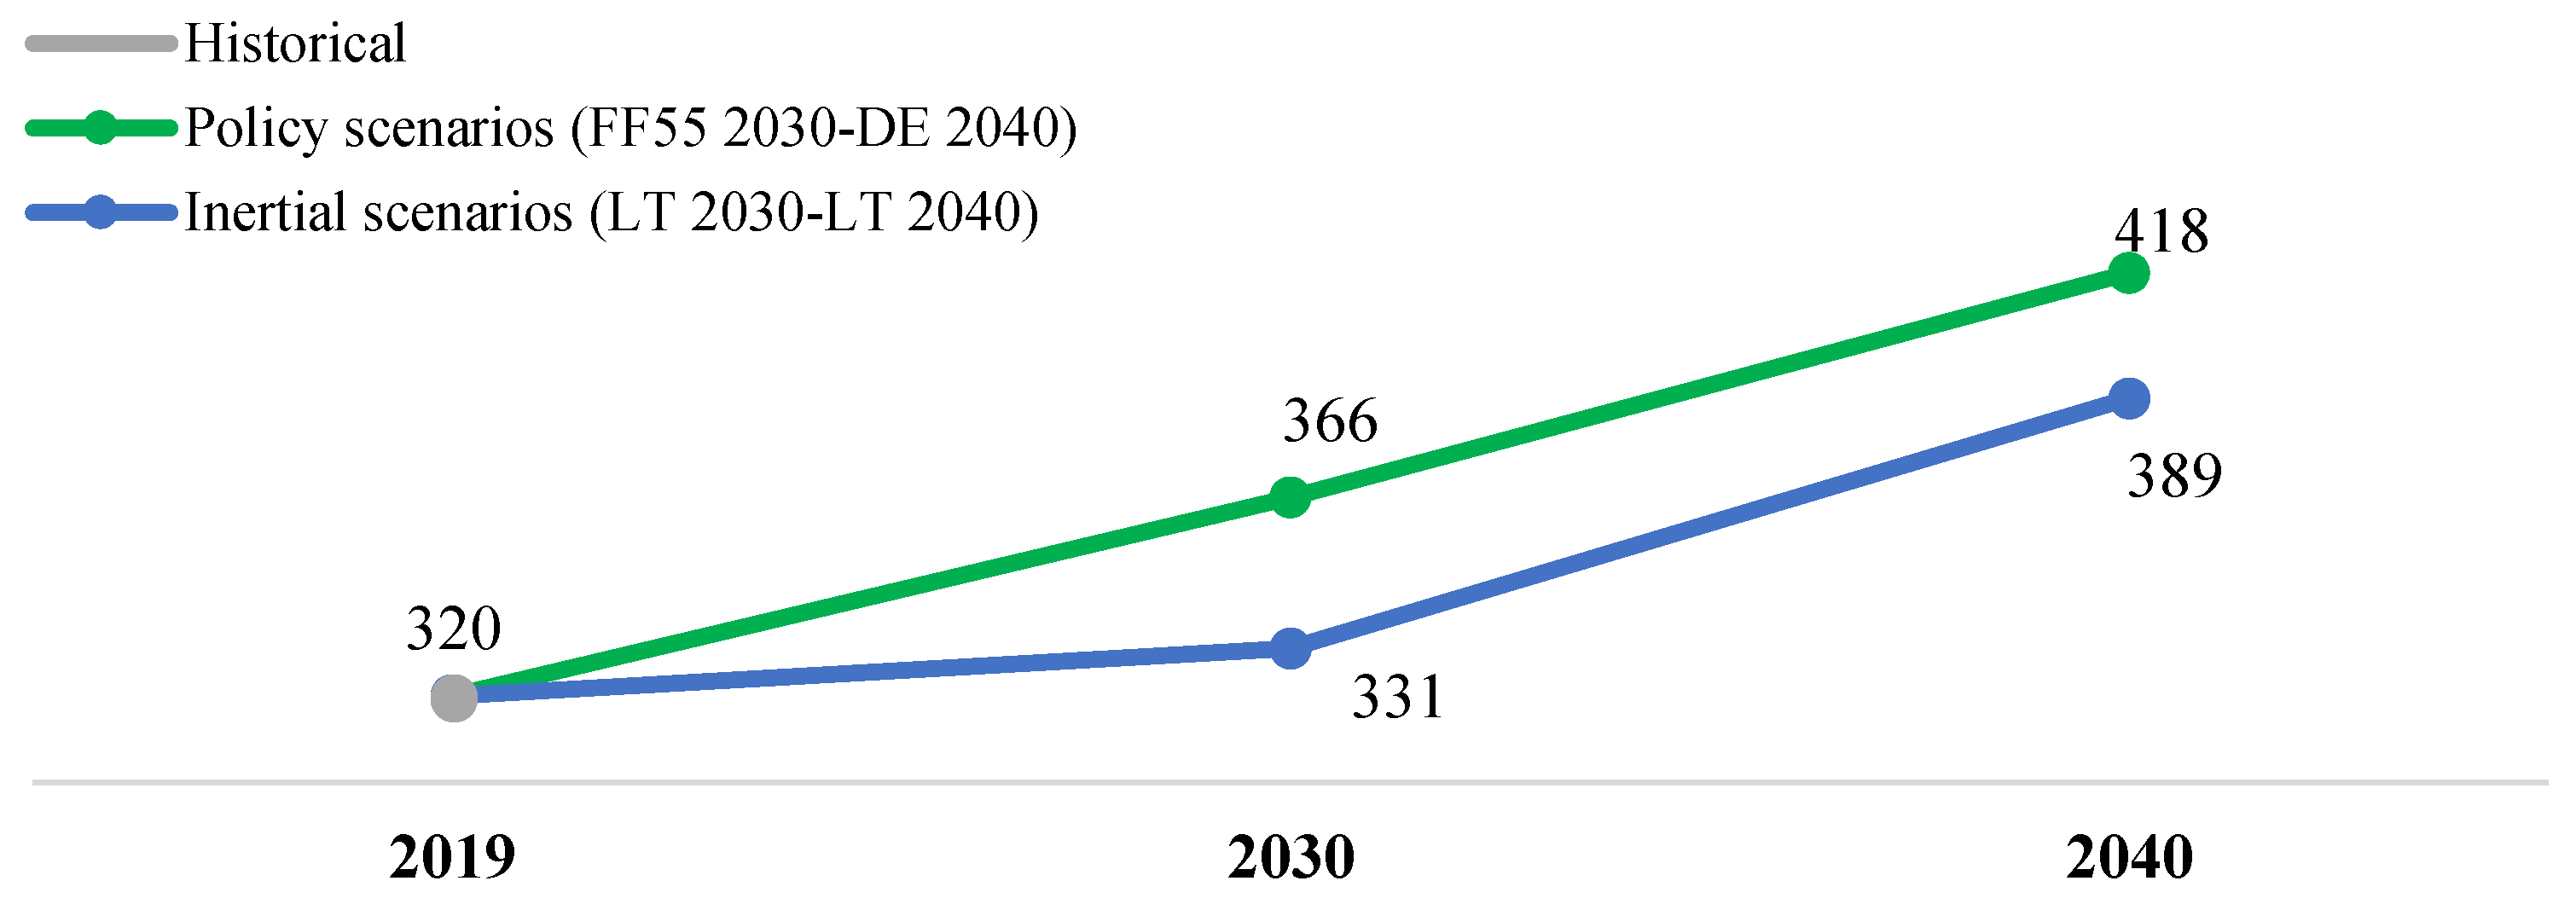
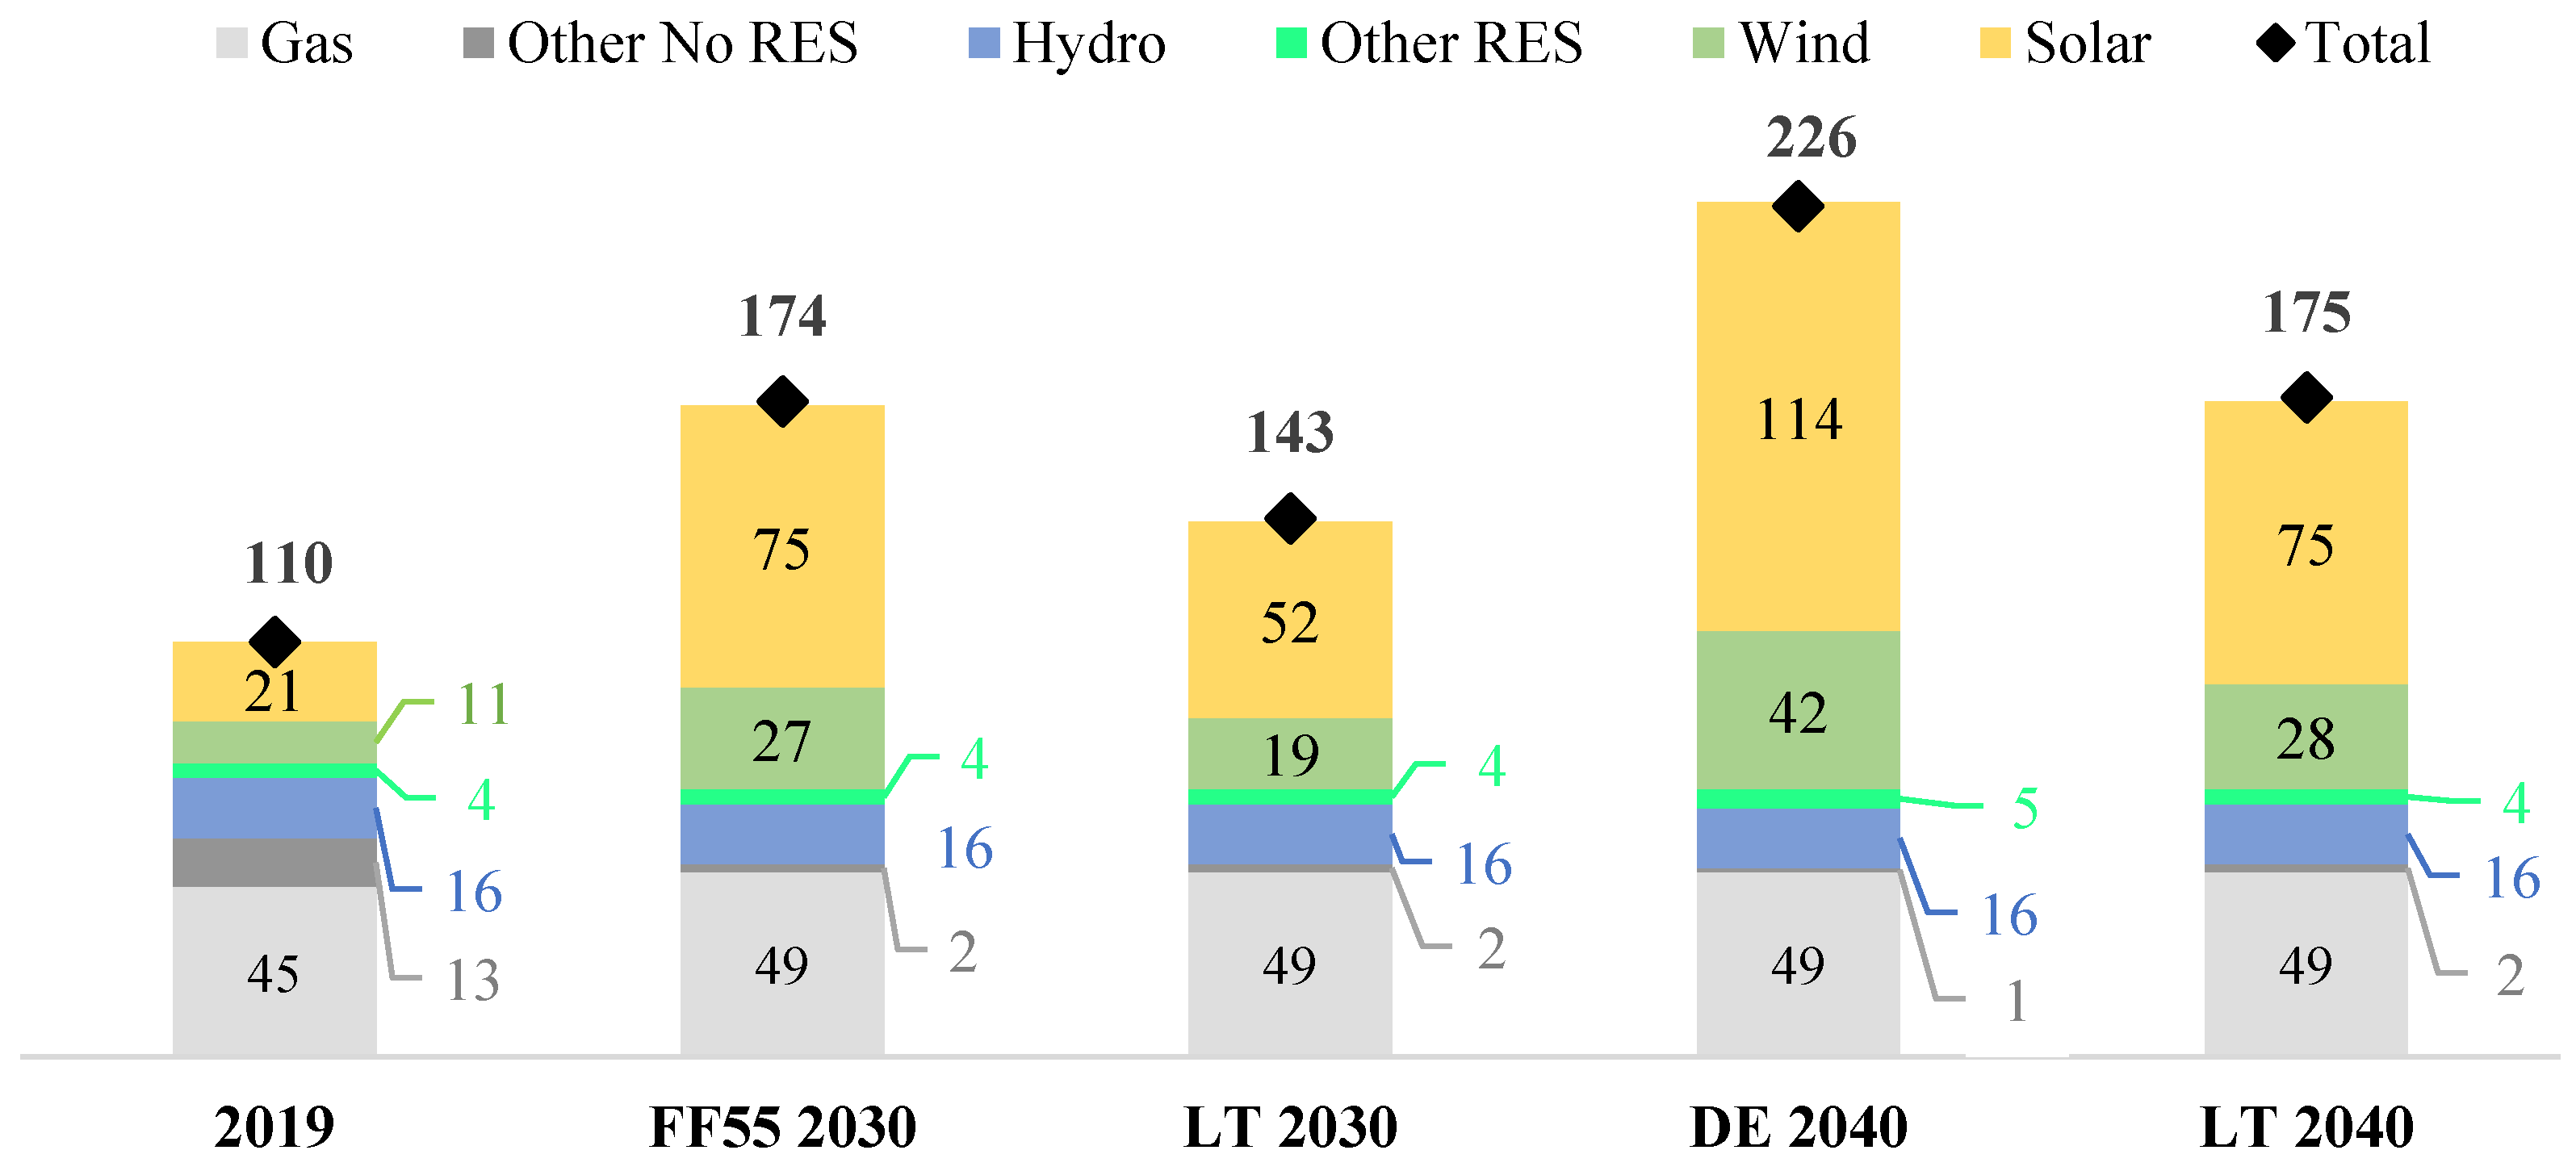
Figure 3,
Figure 4 and
Figure 5 depict the Italian electrical demand trend and the generation and storage capacity evolution in comparison with the final values for the year 2019. As can be seen, the policy scenarios are characterized by a significant increase in electricity demand and installed RES generation. Such challenging scenarios also require significant new storage capacity.
The market structure adopted in the target capacity assessment is depicted in
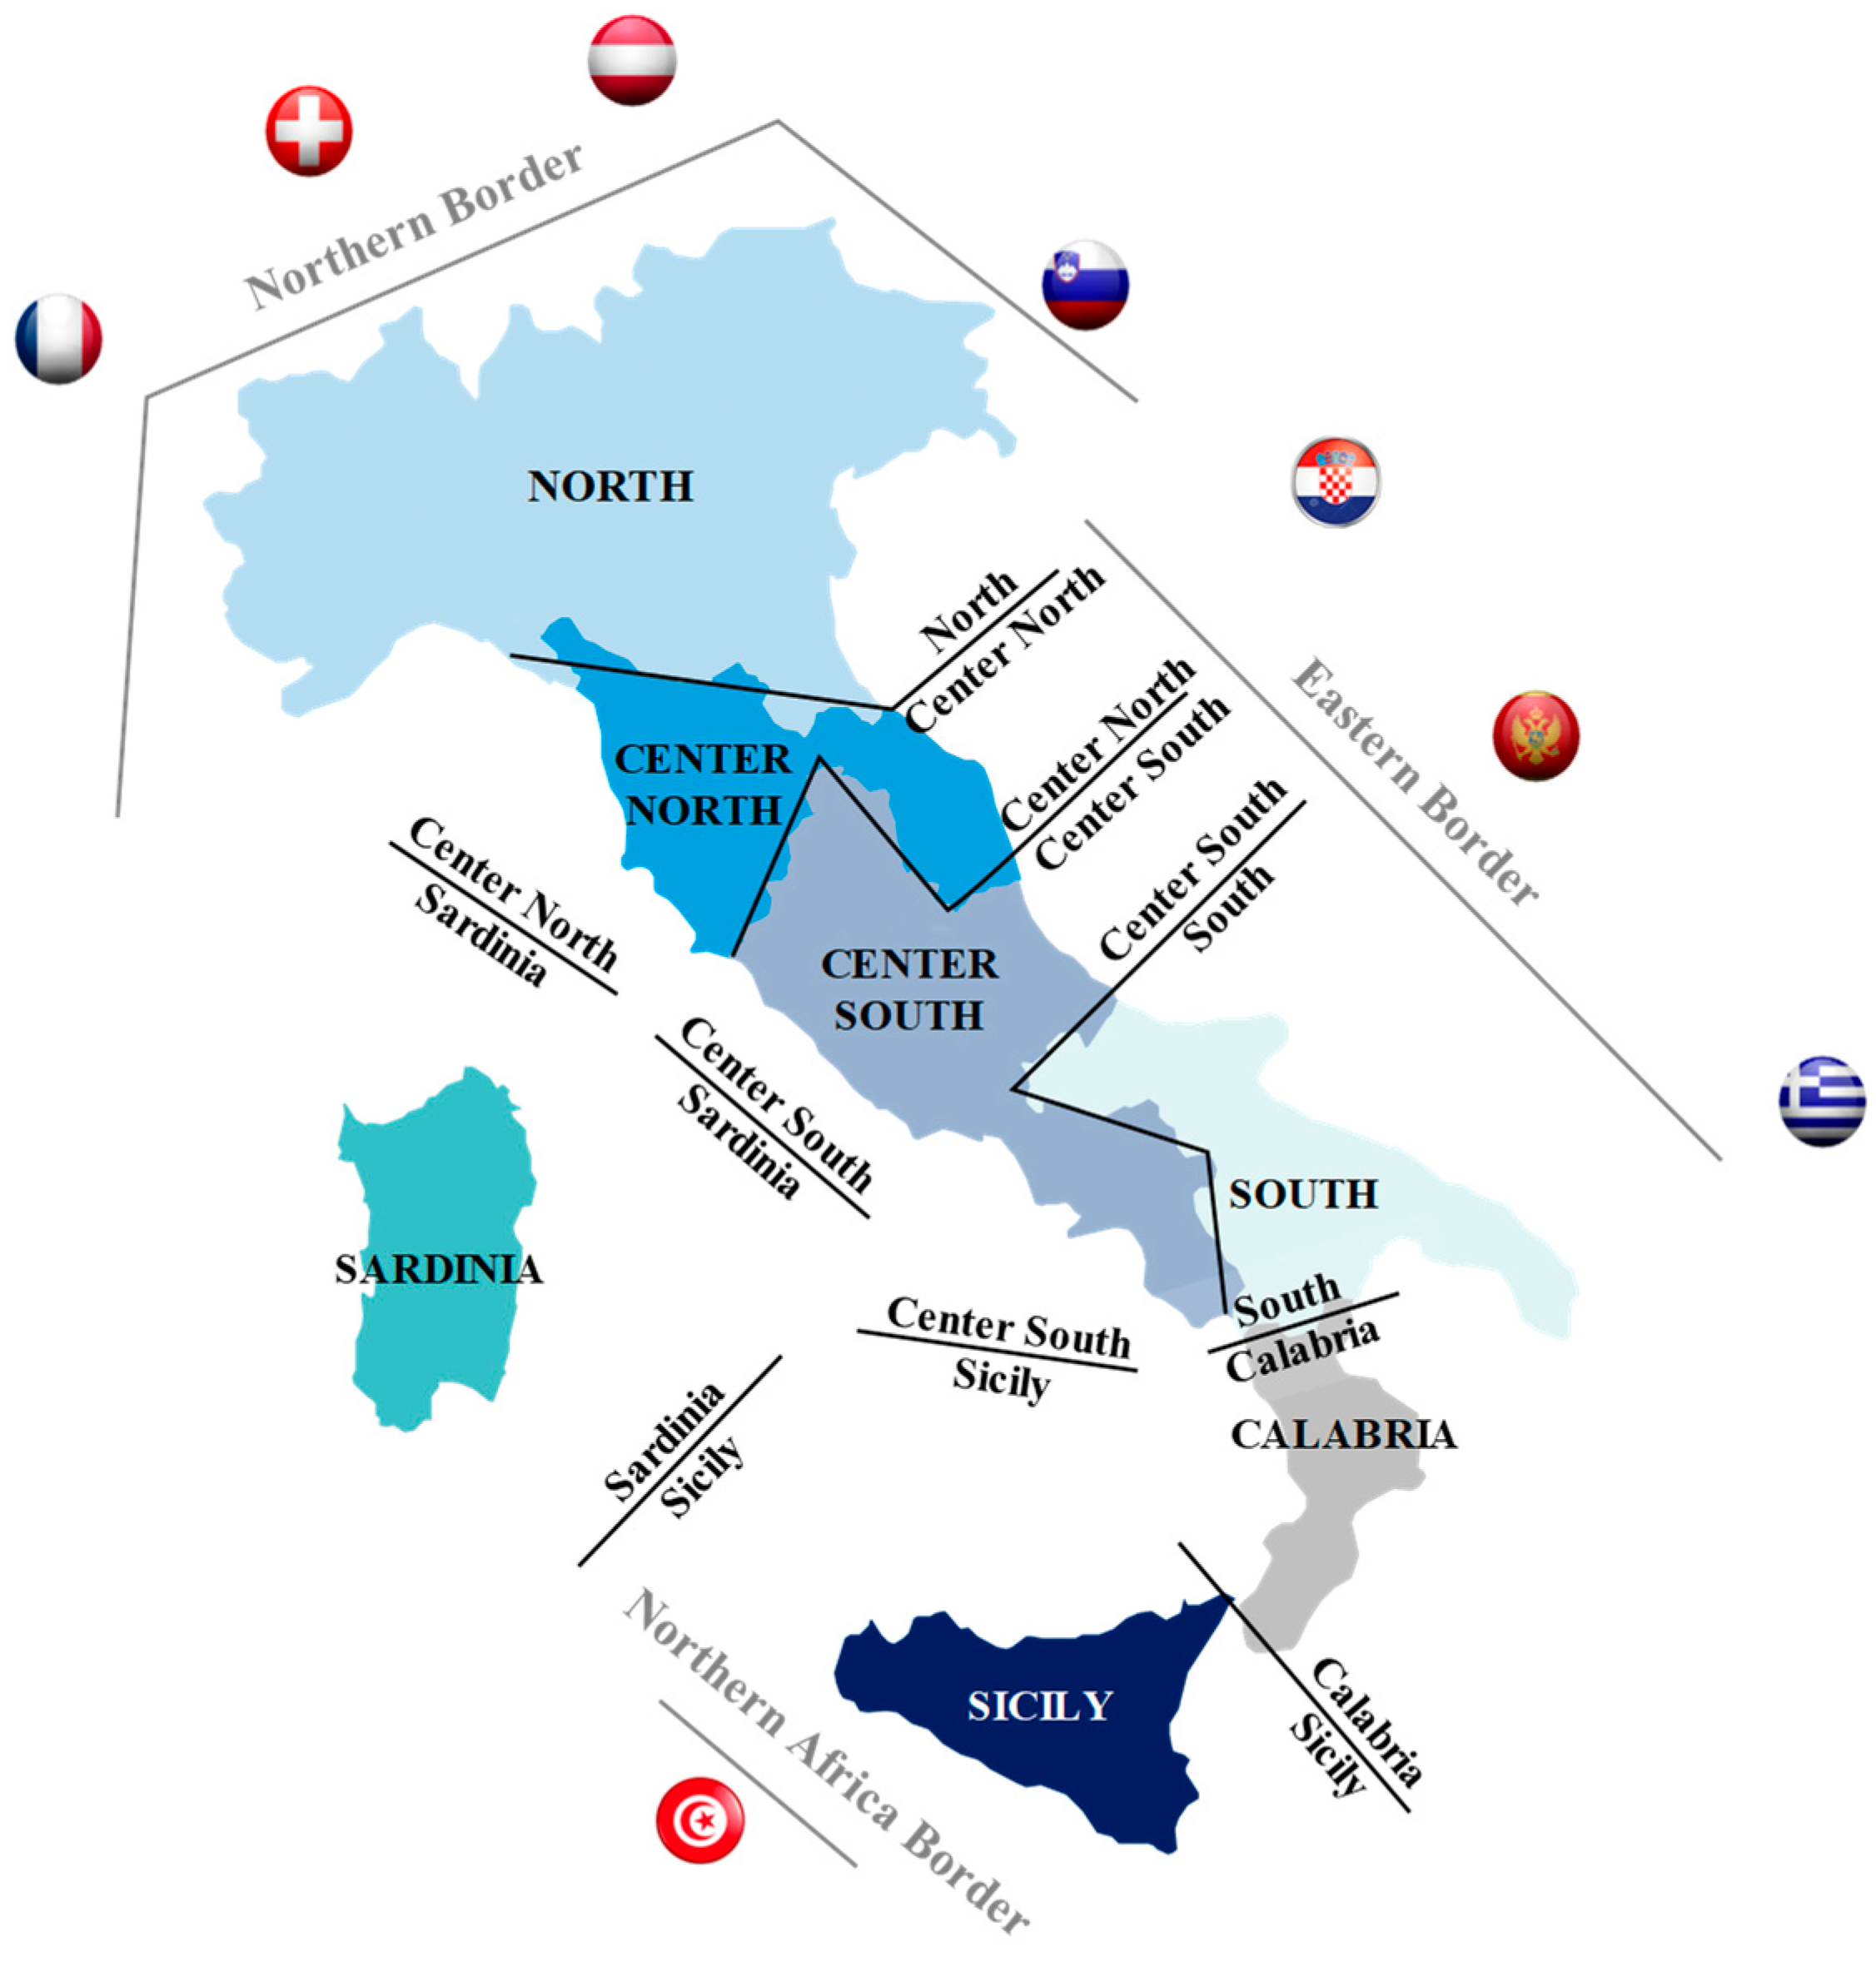
Figure 6: the Italian power system is divided into seven different market zones (North, Center North, Center South, South, Calabria, Sardinia, and Sicily). This structure naturally leads to the individualization of the internal market sections, as represented in the same Figure.
As regards the external boundaries, although the analysis was carried out considering the individual borders, these have been merged in assessing the global potential in terms of transmission capacity increase, according to the following criteria:
The “Northern border” comprises the borders with France, Switzerland, Austria, and Slovenia. Since they are geographically and electrically connected, the transfer capacity is currently evaluated considering the mutual influence in N-1 operational conditions;
The “Balkan border” comprises the borders with Croatia, Montenegro, and Greece, for the same reasons listed above;
The “Northern Africa border” includes the border with Tunisia, the only North African third country involved in a planned project.
Depending on whether the transmission capacity increase involves an internal section or an external border, different sizes for the
ACi,k were defined, as follows:
These values reflect the common sizes of most of the planned or yet in service projects. Then, these sizes were aligned considering +500 MW for both internal sections and external borders for the 2040 horizon due to the higher degree of uncertainty concerning the very long term.
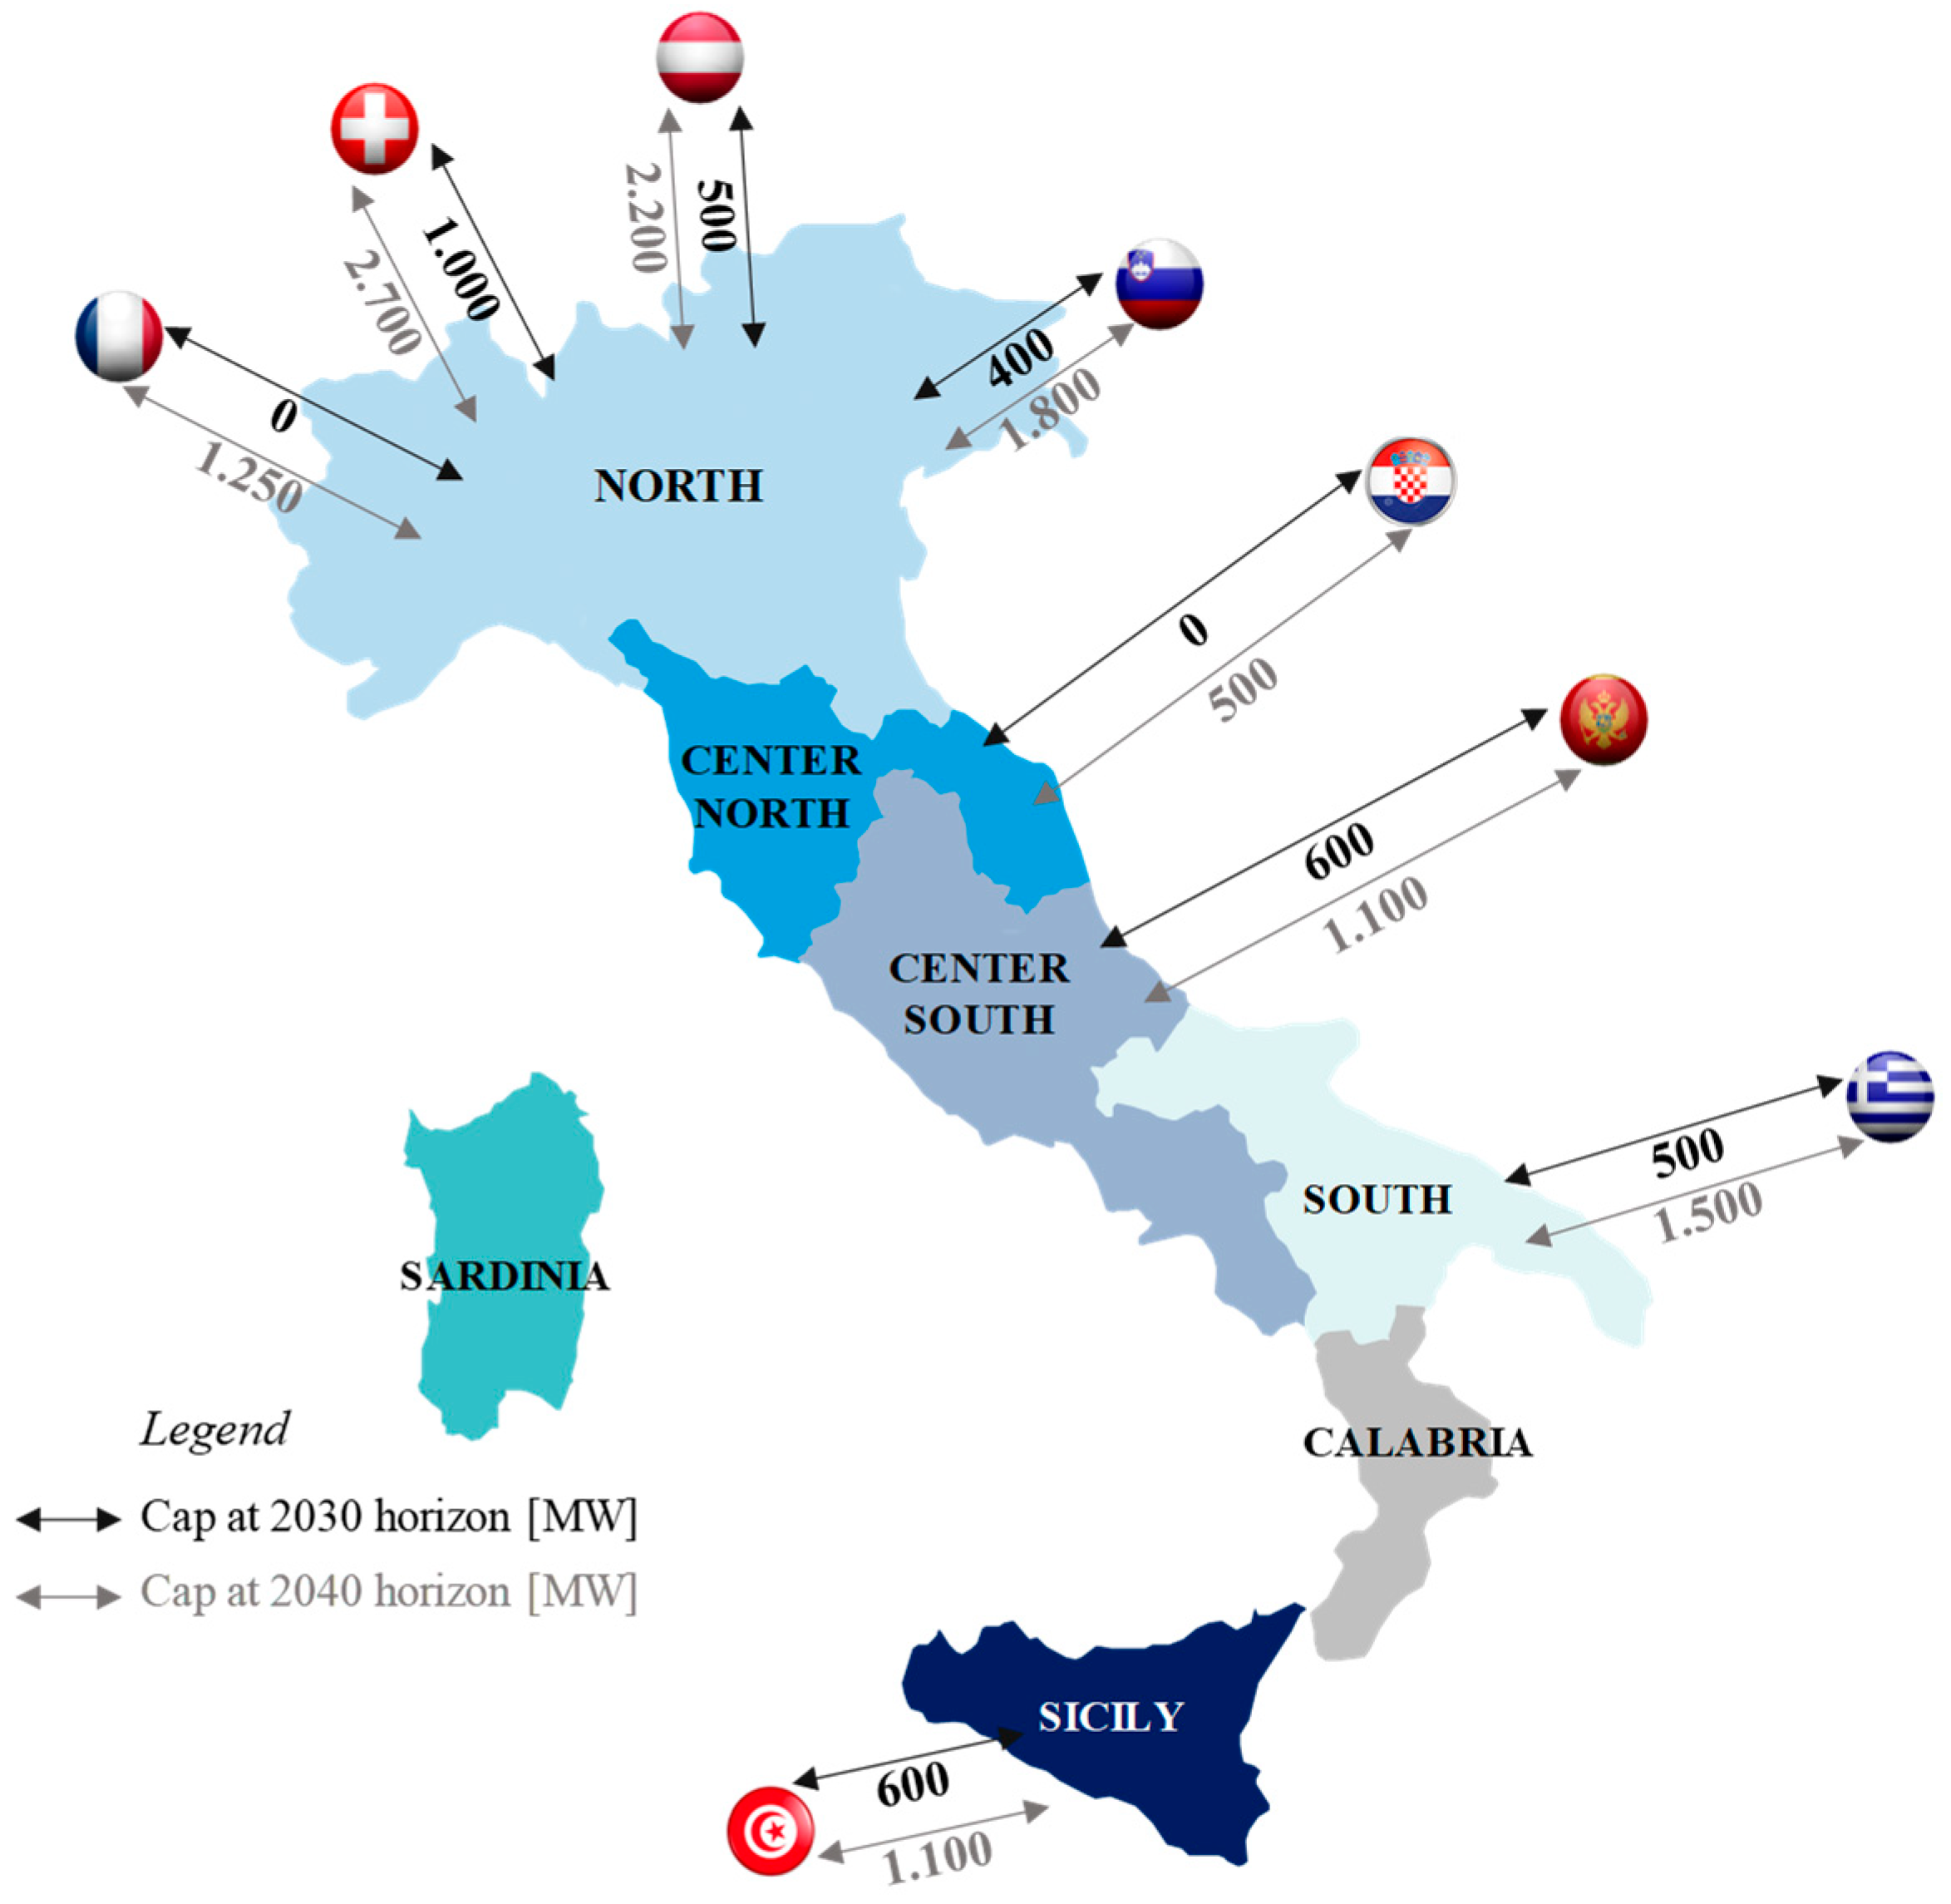
An important novelty introduced in the last edition of the target capacity assessment, approved during the public consultation, is the constraint on the maximum additional capacity that can be reached at external borders: for the 2030 horizon, the constraint has been set equal to the sum of the transmission capacity provided by all planned projects (i.e., already included in the NDP) across each border. For the 2040 horizon, the constraint has been set equal to the 2030 constraint properly increased to take into account the potential new targetable developments in the following decade.
In view of the adopted scenarios characterized by relevant national RES penetration targets, this constraint (or “cap”) was introduced with the aim of prioritizing the use of renewable generation produced at national level. Furthermore, it allows us to integrate into the assessment a criterion of the real feasibility of projects, considering the timing and complexity related to the coordination with EU and non-EU TSOs in implementing interconnections. The maximum additional capacity at each border for the 2030 (black arrow) and 2040 (grey arrow) horizons is detailed in
Figure 7. As expected, the maximum capacity allowed for 2030 is always lower than the one for 2040.
In the TOPSIS method application, the weighting factors of the four selected judgment criteria are the same ( 0.25). Concerning the (project progress), it is a coefficient from 1 to 4, depending on the status of the project defined as a reference in the specific iteration:
= 1 if the project cost is defined based on standard costs;
= 2 if the project cost refers to a planned project;
= 3 if the project cost refers to a designed project;
= 4 if the project cost refers to a project in authorization status.
The threshold values and are equal to the median of the performance indexes, appropriately rounded to have reasonable total computing time, and are differently defined for the internal market sections and for the external borders, depending on criteria values assumed in each iteration.
Finally, the reference grid, or “base case”, consists of the existing grid plus the four projects already authorized and expected to be in service by 2025, as listed in
Table 2.
5.2. Results
The cost-effective transmission capacity increases for each section/border of the Italian power system resulting from the application of the presented methodology for the 2030 horizon are provided in
Figure 8 for each scenario under study.
Given the cap on the maximum additional target capacity achievable at external borders according to the already planned interconnections for the 2030 horizon, the same development strategy was obtained for each border in both the contrasting scenarios simulated. Instead, a significant variation in the assessed transmission capacity increase can be observed where the analysis in the FF55 2030 scenario results in transmission capacity increases of, on average, +50% compared to those obtained in the LT 2030 scenario, basically due to the higher distributed renewable generation to be integrated and the higher load to be supplied. The highest differences were registered for IT North–IT Center North (+88%), IT Calabria–IT South (+83%), IT Center North–IT Center South, and IT Sicily–IT Calabria (+64%) and for IT Center South–IT South and IT Sardinia–IT Center South (+60%).
Let “Option 1” and “Option 2” be the set of transmission capacity increases resulting from the application of the proposed methodology in the FF55 2030 and in the LT 2030 scenarios, respectively, and considering three additional options defined as follows:
“Option 3”: set of transmission capacity increases defined as the average between the development strategies obtained in the FF55 2030 and in the LT 2030 scenarios for each border/section;
“Option 4”: set of transmission capacity increases defined as the average between the development strategies obtained in “Option 1” and in “Option 3” for each border/section;
“Option 5”: set of transmission capacity increases defined as the average between the development strategies obtained in “Option 3” and in “Option 2” for each border/section.
These options can be considered as different investment strategies to be compared with the aim of defining the most cost-efficient set of target capacity values as a reference for the TSO.
The net benefit metric (“NB”) is then used to compute the economic regrets associated with the different development strategies under the two considered scenarios, allowing the DM (TSO) to determine the maximum risk associated with each option across different scenarios and to select the one yielding the lowest maximum regret. The NB and consequent worst and least regrets related to each potential option in the two scenarios under study are evaluated in
Table 3 and
Table 4. Moreover,
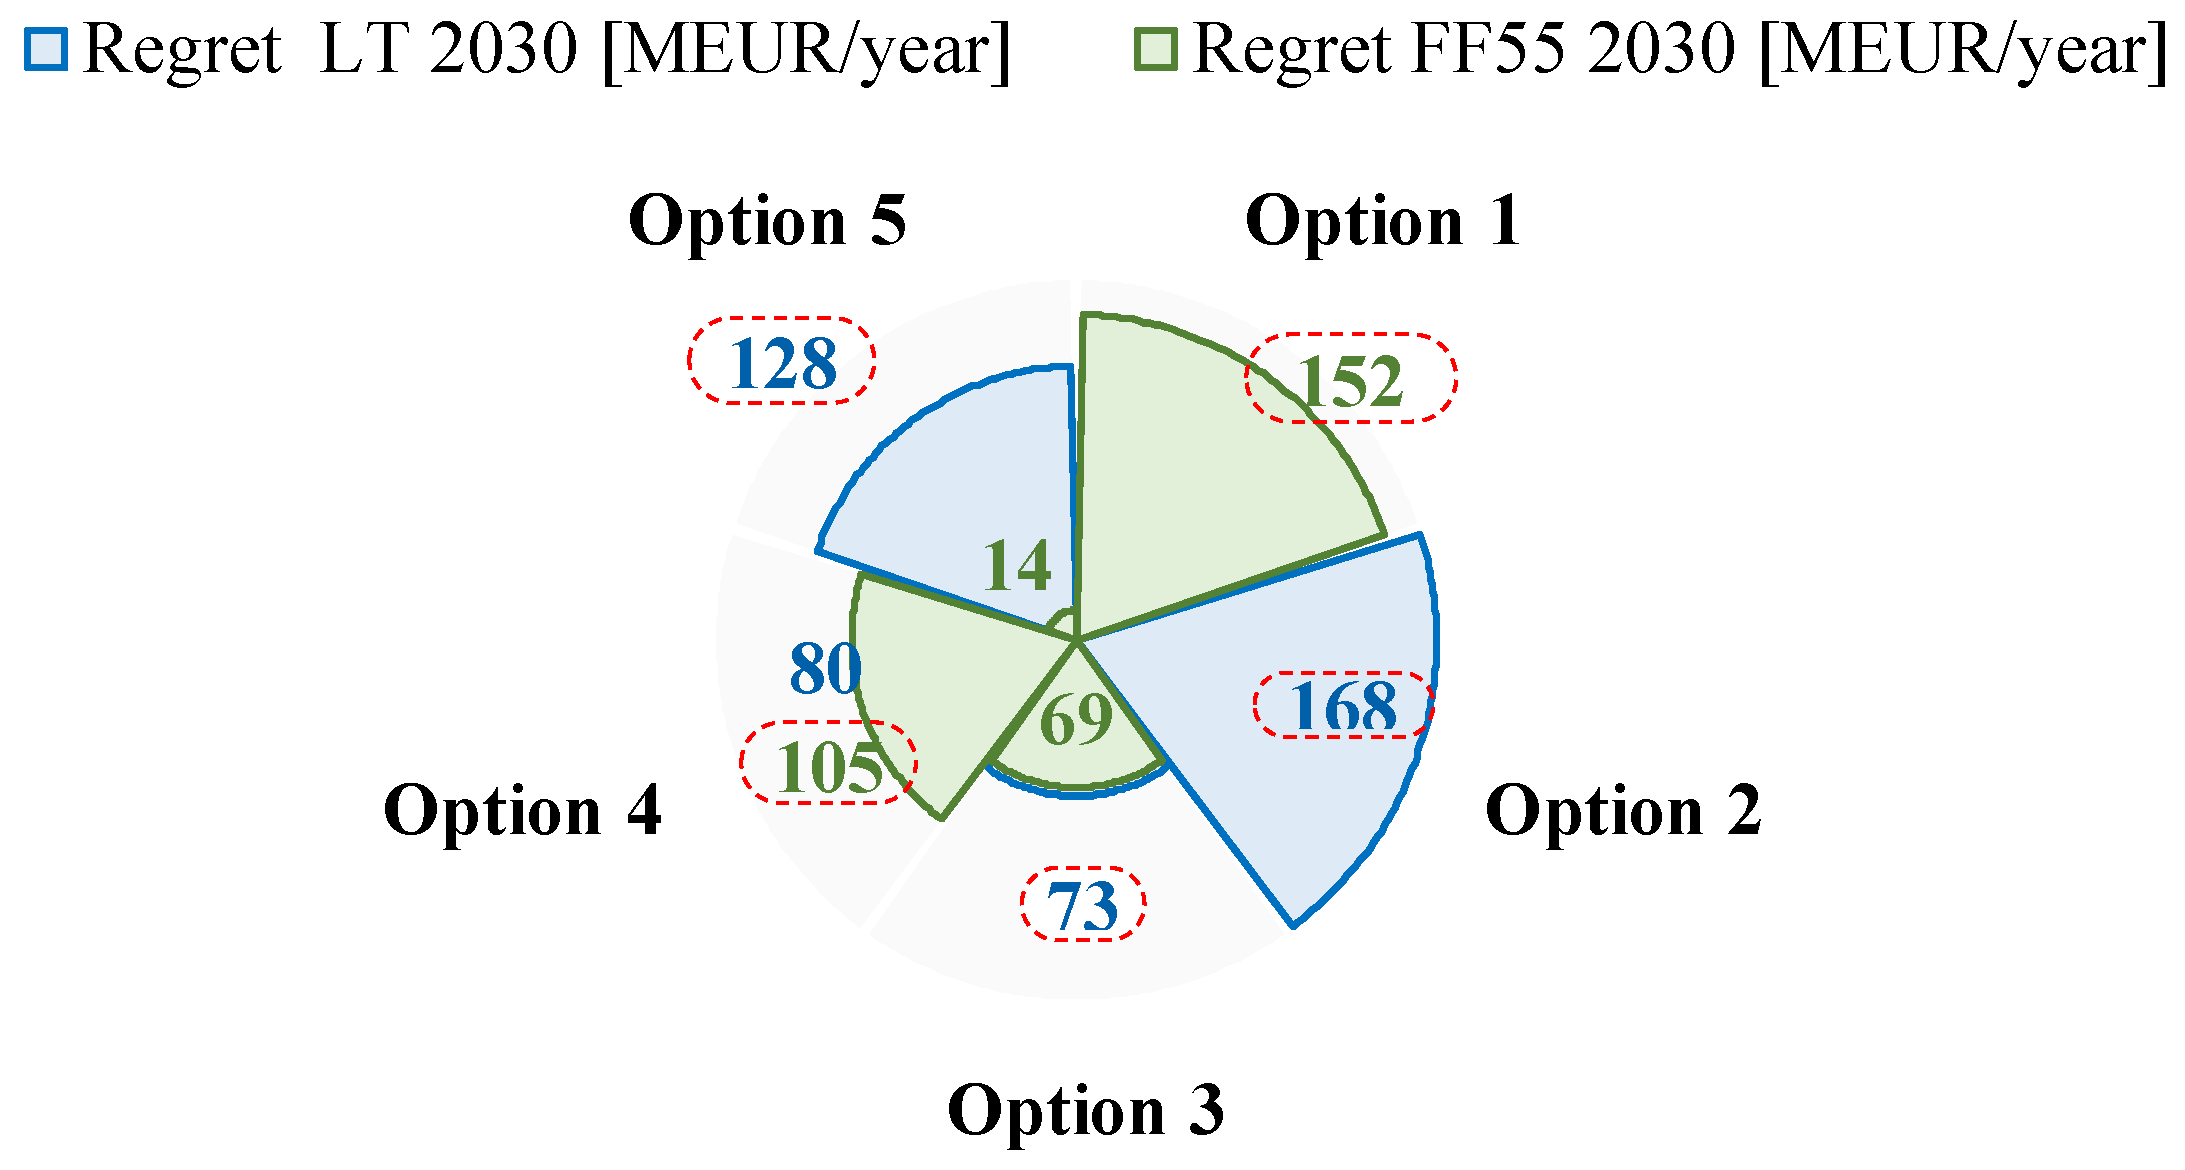
Figure 9 shows the magnitude of regret for each option in each scenario: the dashed red circle highlights the worst regret.
The least regret application leads to the choice of Option 3 as the investment strategy exposing the system to the minimum risk in both considered scenarios.
In order to check the robustness of the results obtained in the very-long-term horizon, accommodating main stakeholders’ and experts’ suggestions, the target capacity was also assessed for the year 2040.
Figure 10 shows the cost-effective transmission capacity increases for each section/border of the Italian power system resulting from the application of the methodology in the DE 2040 and LT 2040 scenarios. Unlike the development strategies found for 2030, the results for 2040 show different values at the borders for the scenarios considered. In particular, the inertial scenario requires higher additional transmission capacity at the Northern border due to the increased import need (lower expected RES capacity installed at national level to cover the load compared with the policy scenario).
In compliance with the proposed methodology, the least regret approach was applied to identify the unique development strategy also for the 2040 horizon. The net benefits related to the following investment strategies were assessed:
“Option 1”: set of transmission capacity increases identified in the DE 2040 scenario;
“Option 2”: set of transmission capacity increases identified in the LT 2040 scenario;
“Option 3”: set of transmission capacity increases defined as the average between Option 1 and Option 2.
Looking at the results summarized in
Table 5 and
Table 6 and
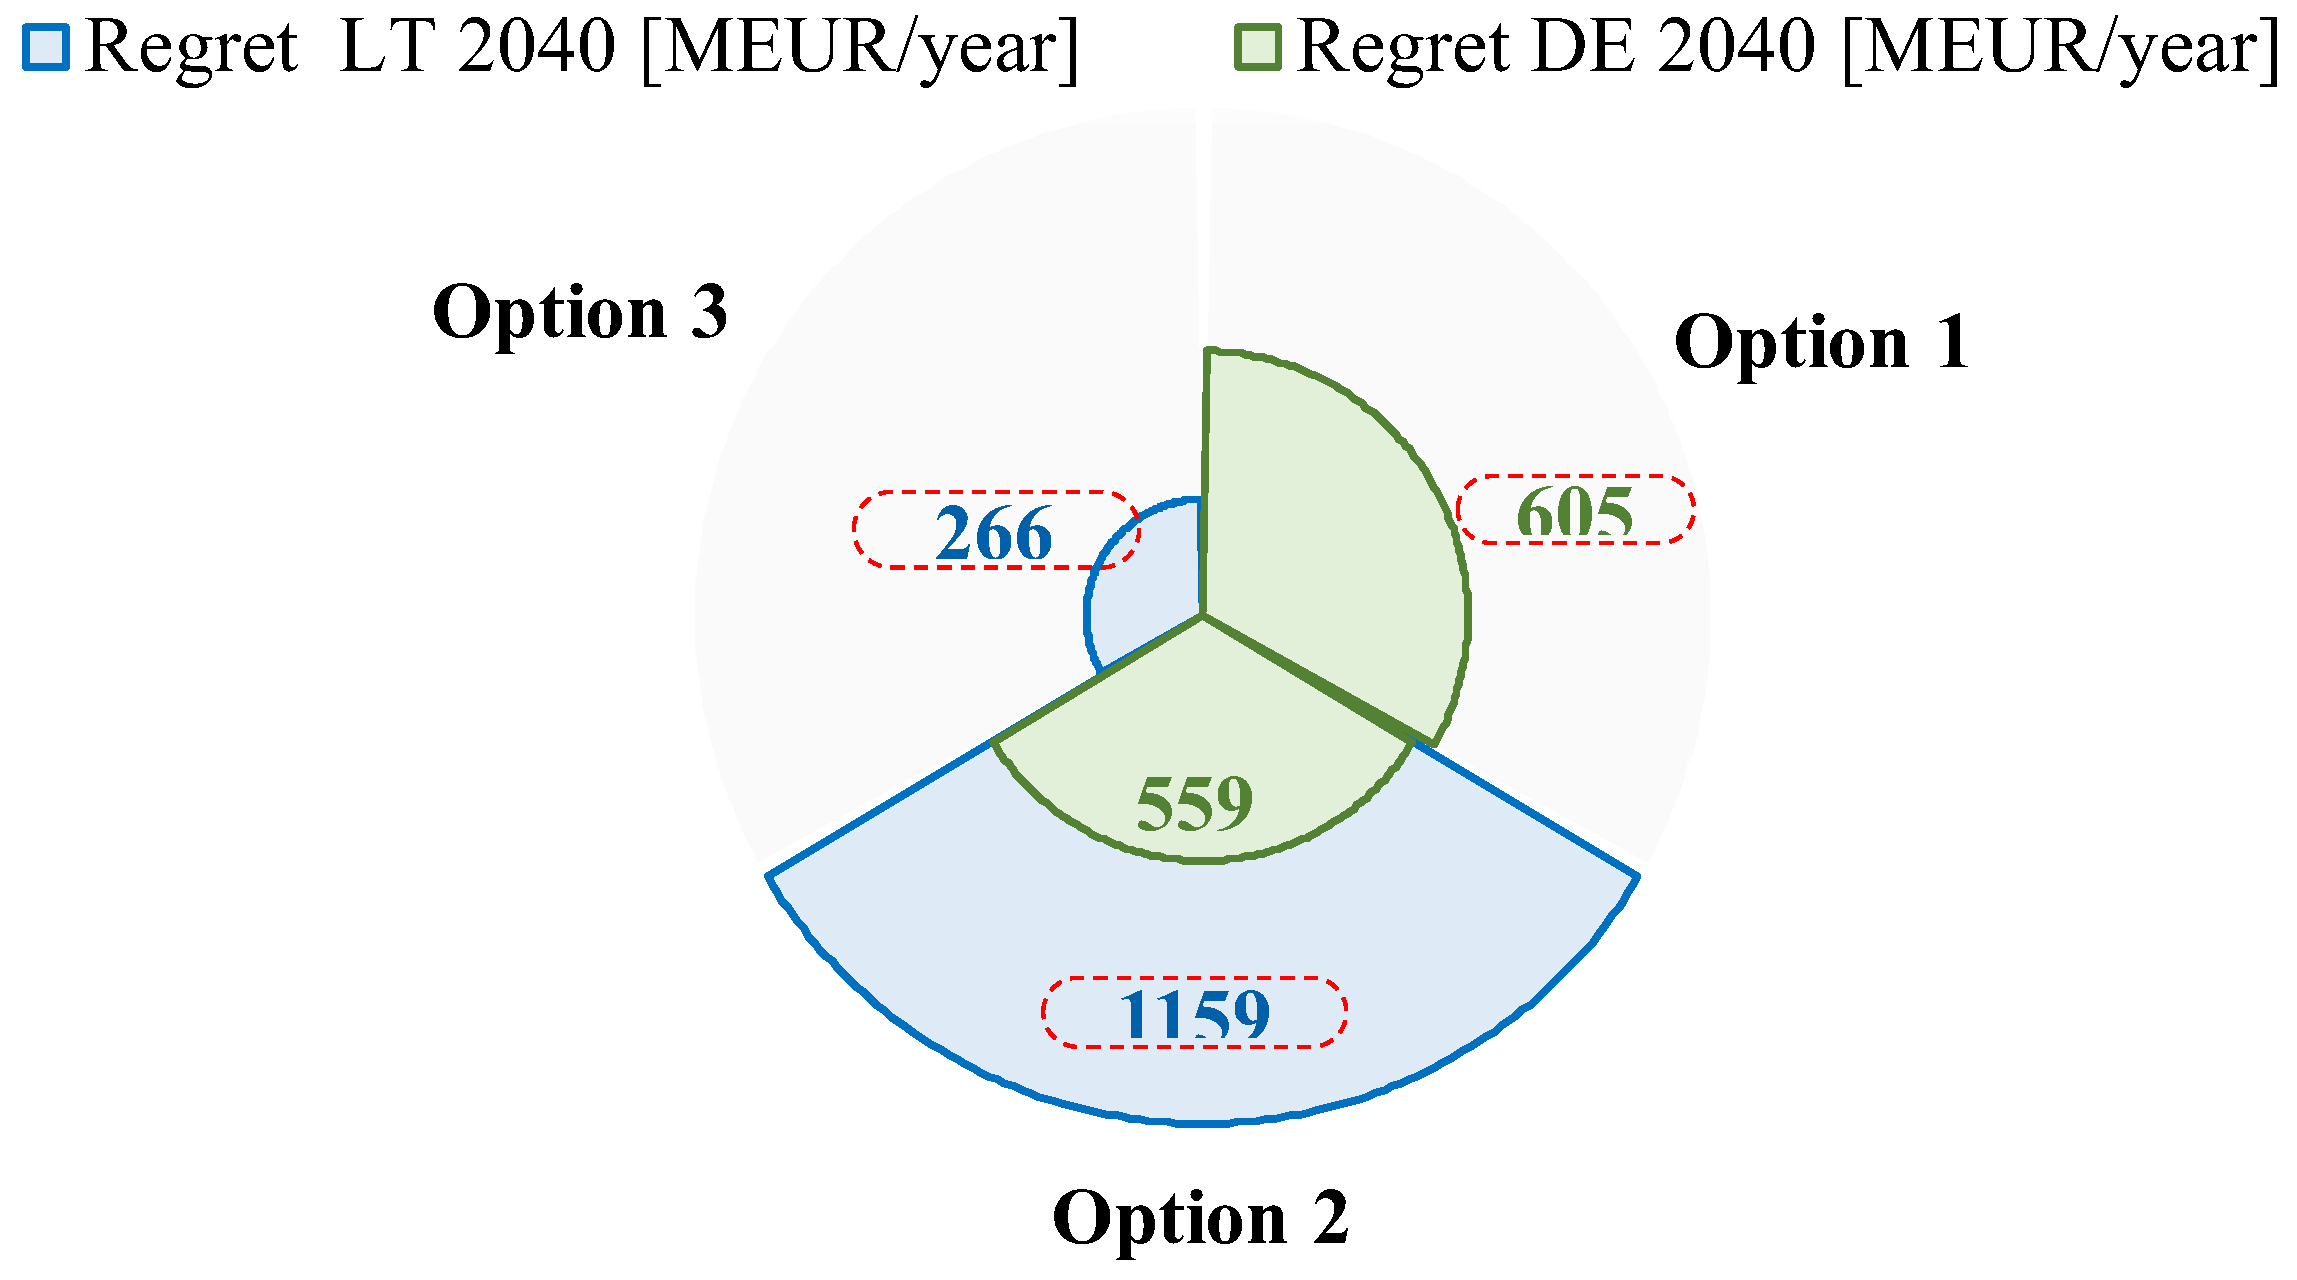
Figure 11, Option 3 turns out to be the best development strategy for the 2040 horizon.
Table 7 lists the final target capacity values [MW] to aim for regarding the 2030 and 2040 horizons, considering the existing “winter peak” transmission capacity,
, in the main direction of power transfers statistically registered, consistent with the TSO objective to make the interconnection capacity available in an efficient way.
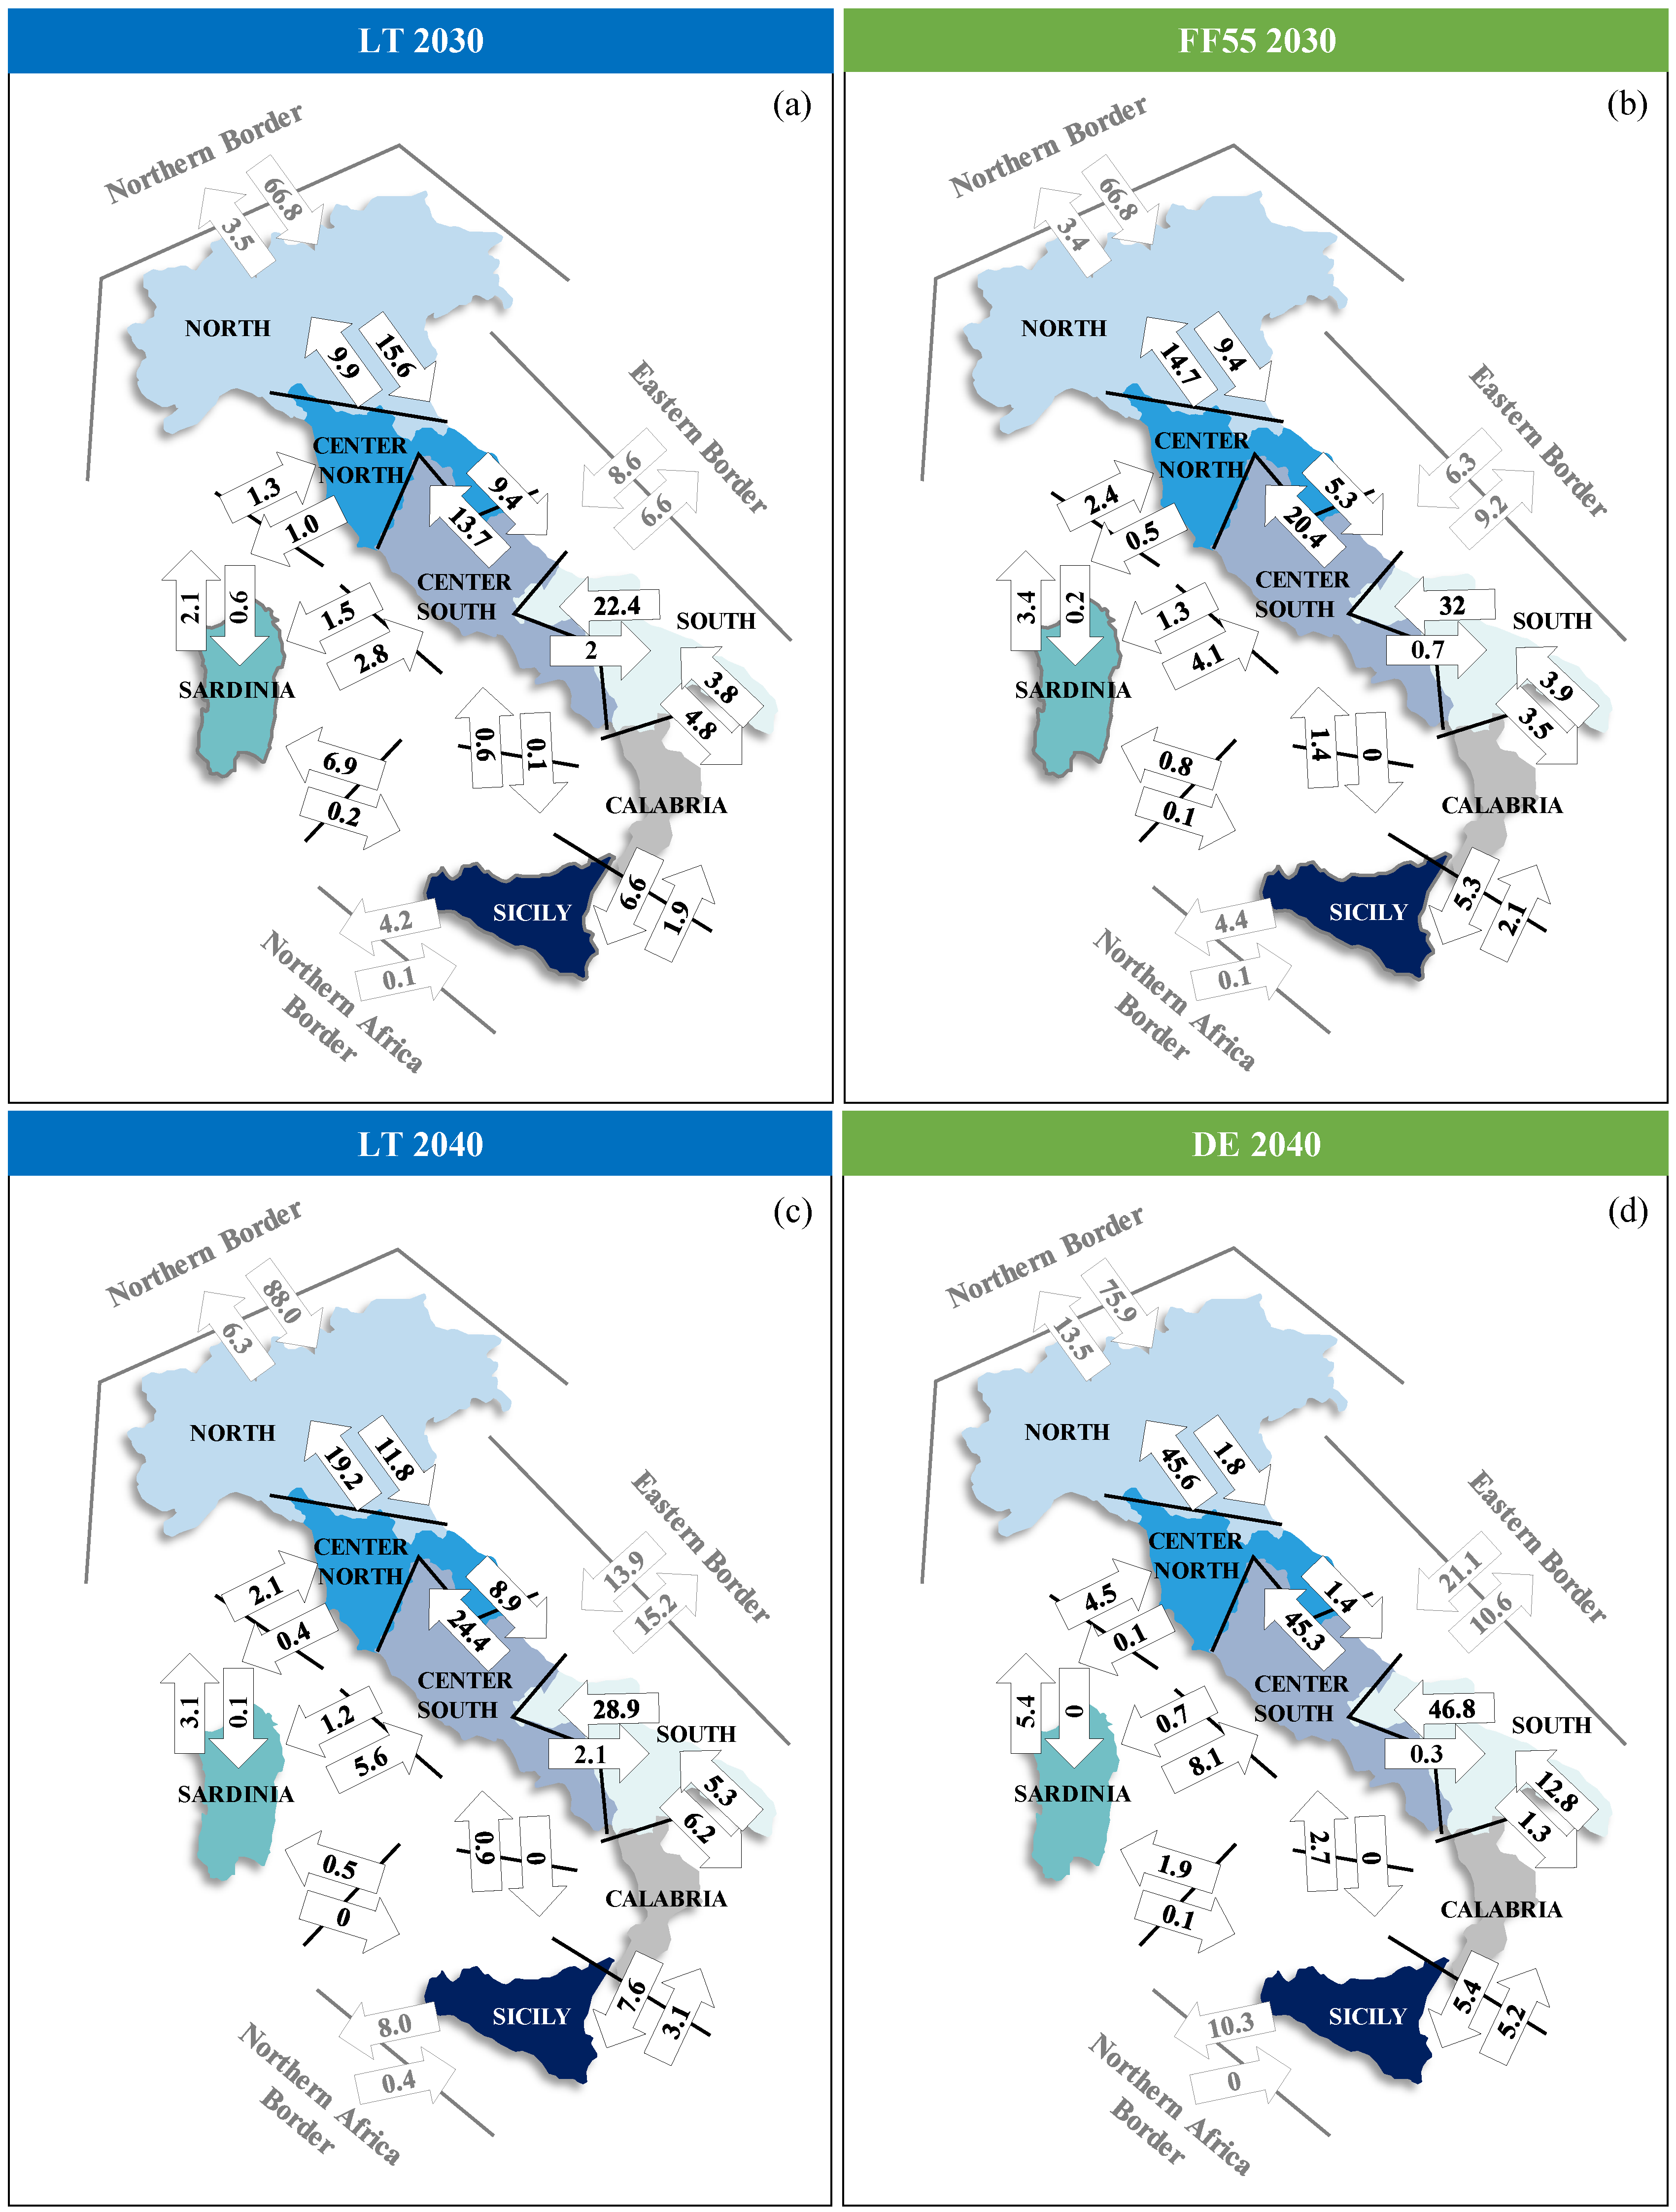
Finally, in
Figure 12, the expected power flows resulting from the implementation of the identified additional target capacity on the base case in LT 2030 (
Figure 12a), FF55 2030 (
Figure 12b), LT 2040 (
Figure 12c), and DE 2040 (
Figure 12d) are shown. It can be observed that the power flows in the policy scenarios are more stressful in the South-to-North direction between internal market zones, due to the higher RES penetration expected.
The power exchanges across external borders are substantially aligned for the 2030 horizon in both contrasting scenarios because of the “cap” on achievable target capacity imposition; instead, for the 2040 horizon, more relevant import power flows from the Northern border are registered in the LT scenario, in front of the lower national RES generation simulated.
5.3. Sensitivity Analyses
Starting from the 2030 development strategies, described in
Section 5.2, additional sensitivity analyses were performed for the policy scenario FF55 2030 to evaluate target capacity variance in the case of relevant input data variation:
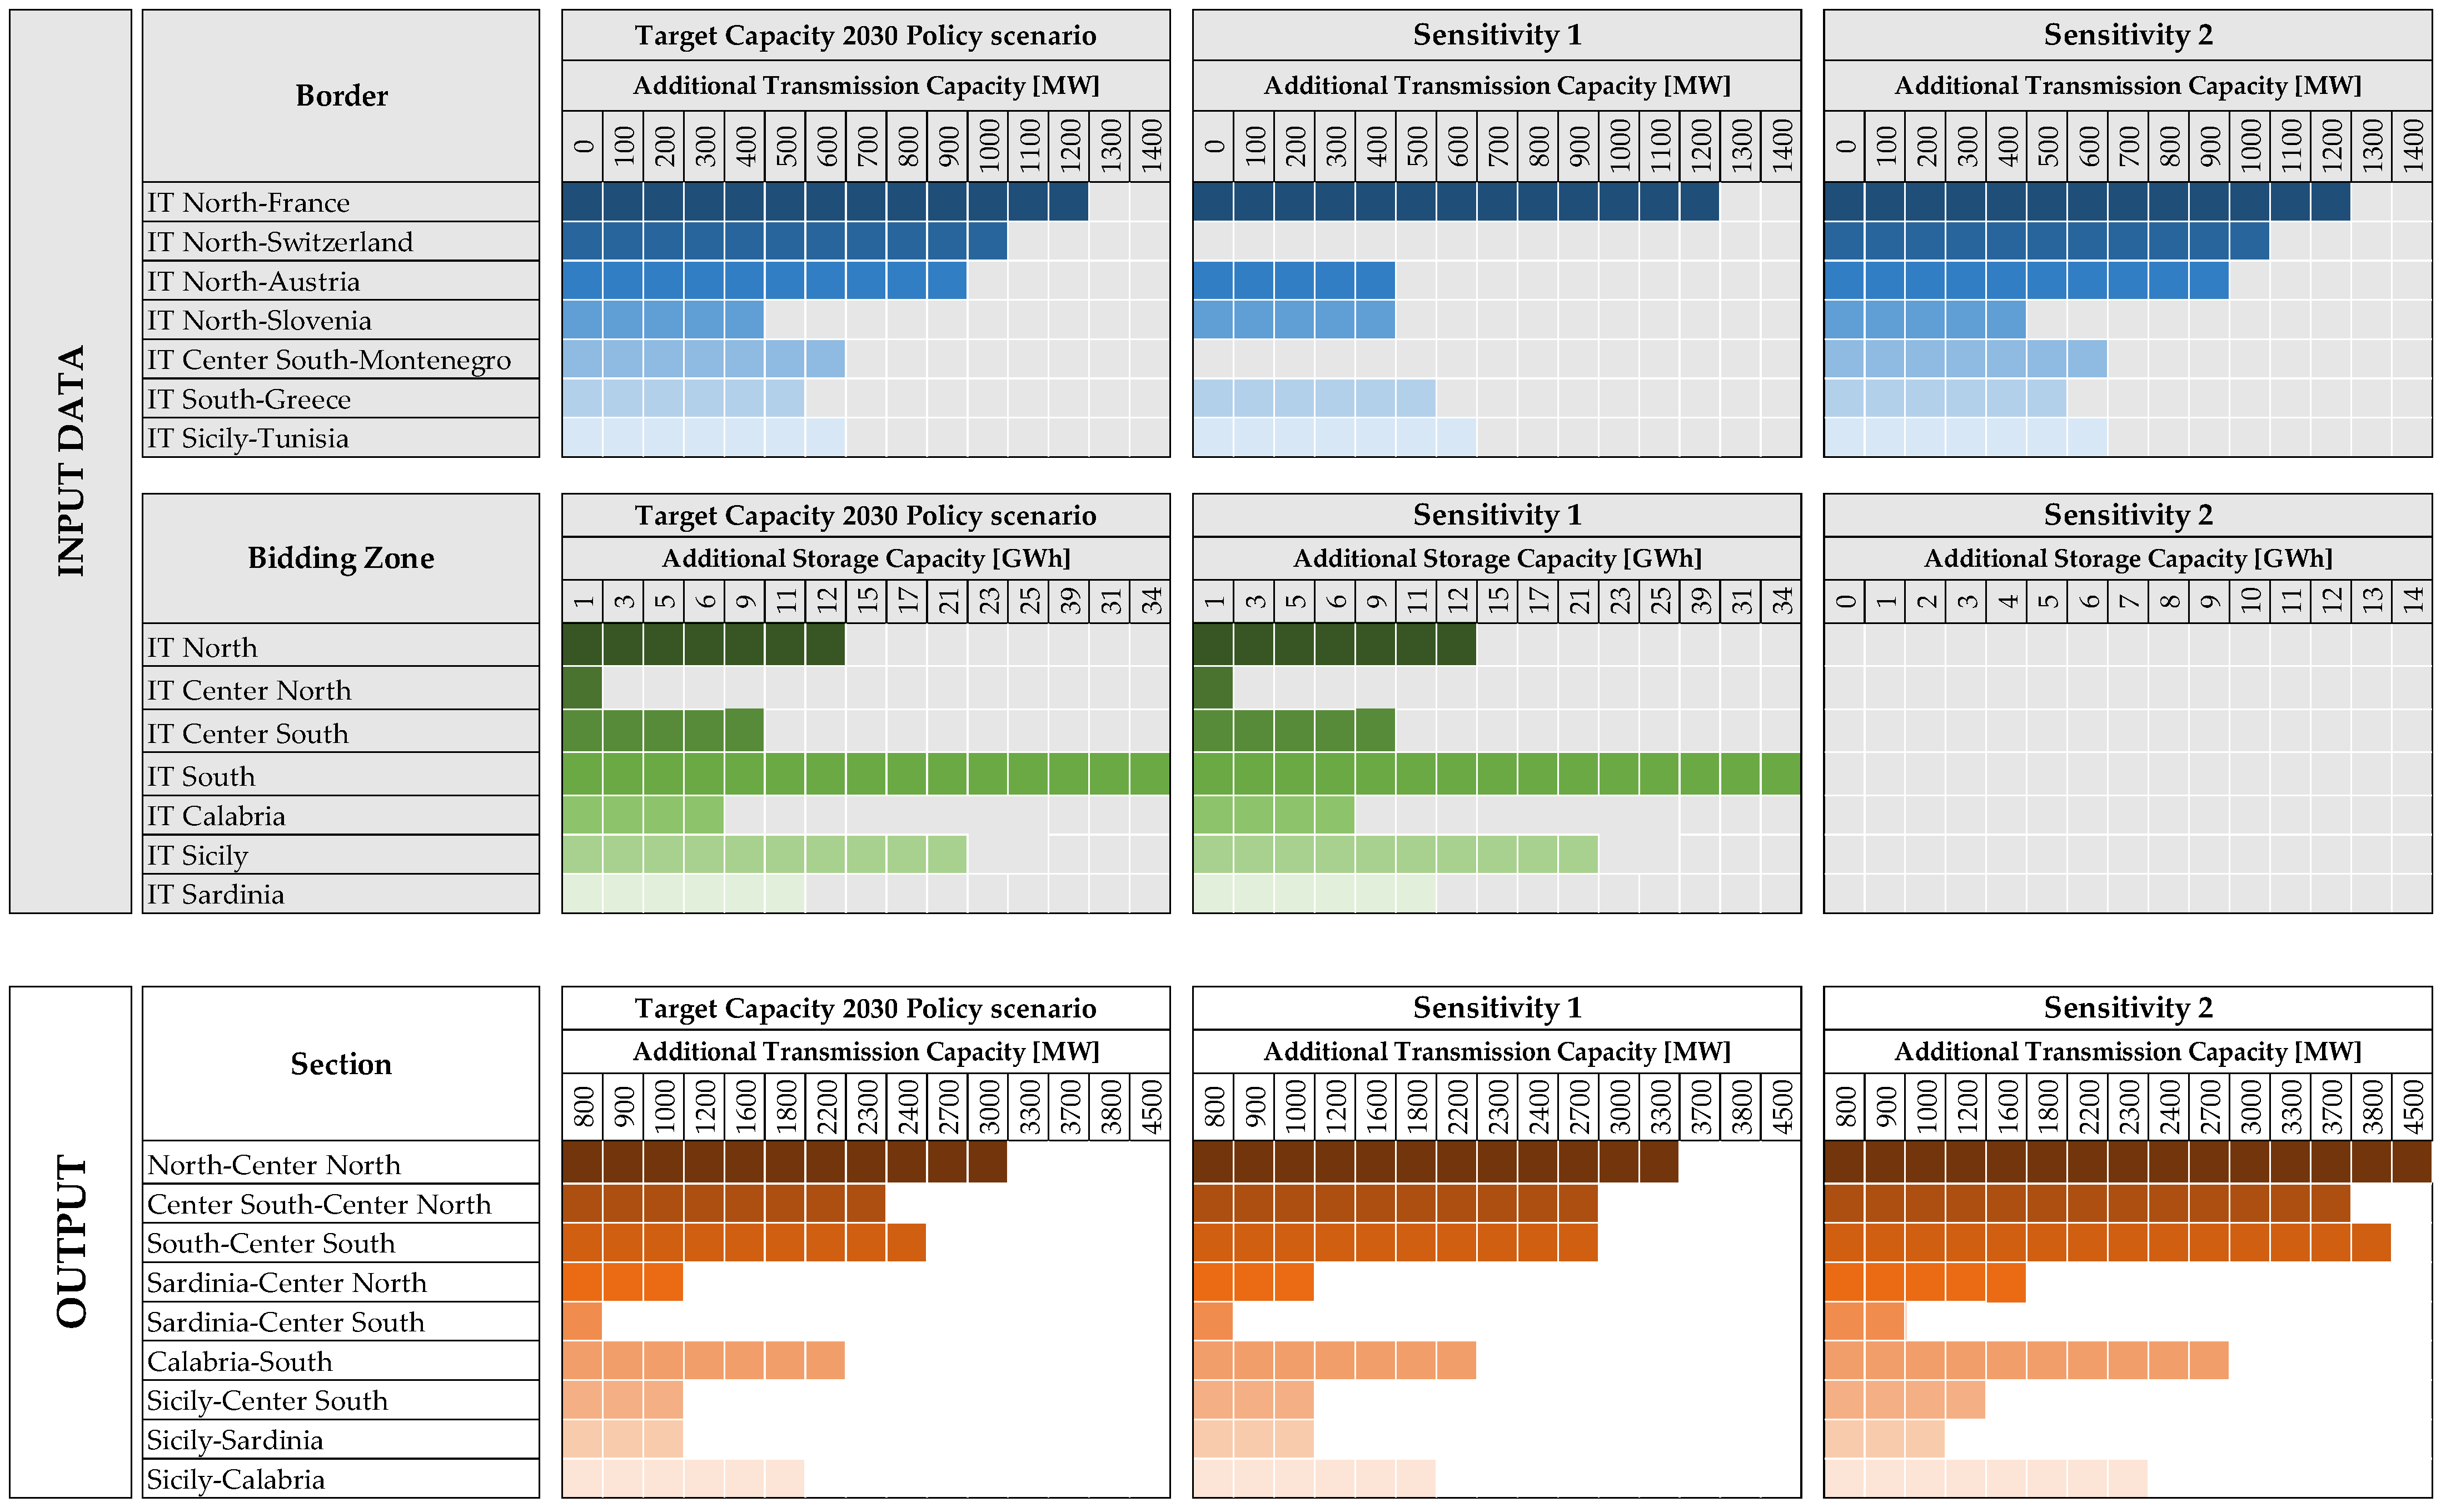
Sensitivity 1 on cross-border additional transmission capacity: a constraint on feasible target capacity in 2030 has been enforced at each border of the Italian power system according to the status of already planned interconnection projects;
Sensitivity 2 on storage installed capacity: additional storage capacity of +95 GWh foreseen in service until 2030 within the policy scenario has been removed, and the analyses were repeated considering just the existing storage capacity.
The sensitivity results are illustrated in
Figure 13: in the upper part of the graph (grey boxes), the input data simulated in each studied case are detailed, while at the bottom (white boxes), the outputs obtained continuing the iterative process from the development strategy originally derived are summarized. The identified additional transmission capacity on internal market sections is needed to cover, on one hand, the lower transmission capacity development on external borders (Sensitivity 1) and, on the other hand, the missing additional storage project concretization (Sensitivity 2). Looking at the results, an additional 1 GW of transmission capacity across internal sections is needed in the case of tight constraints on external borders and +6.2 GW as a result of storage capacity reduction: the greatest impact is registered in the North–C. North, C. North–C. South, and South–C. South market sections.
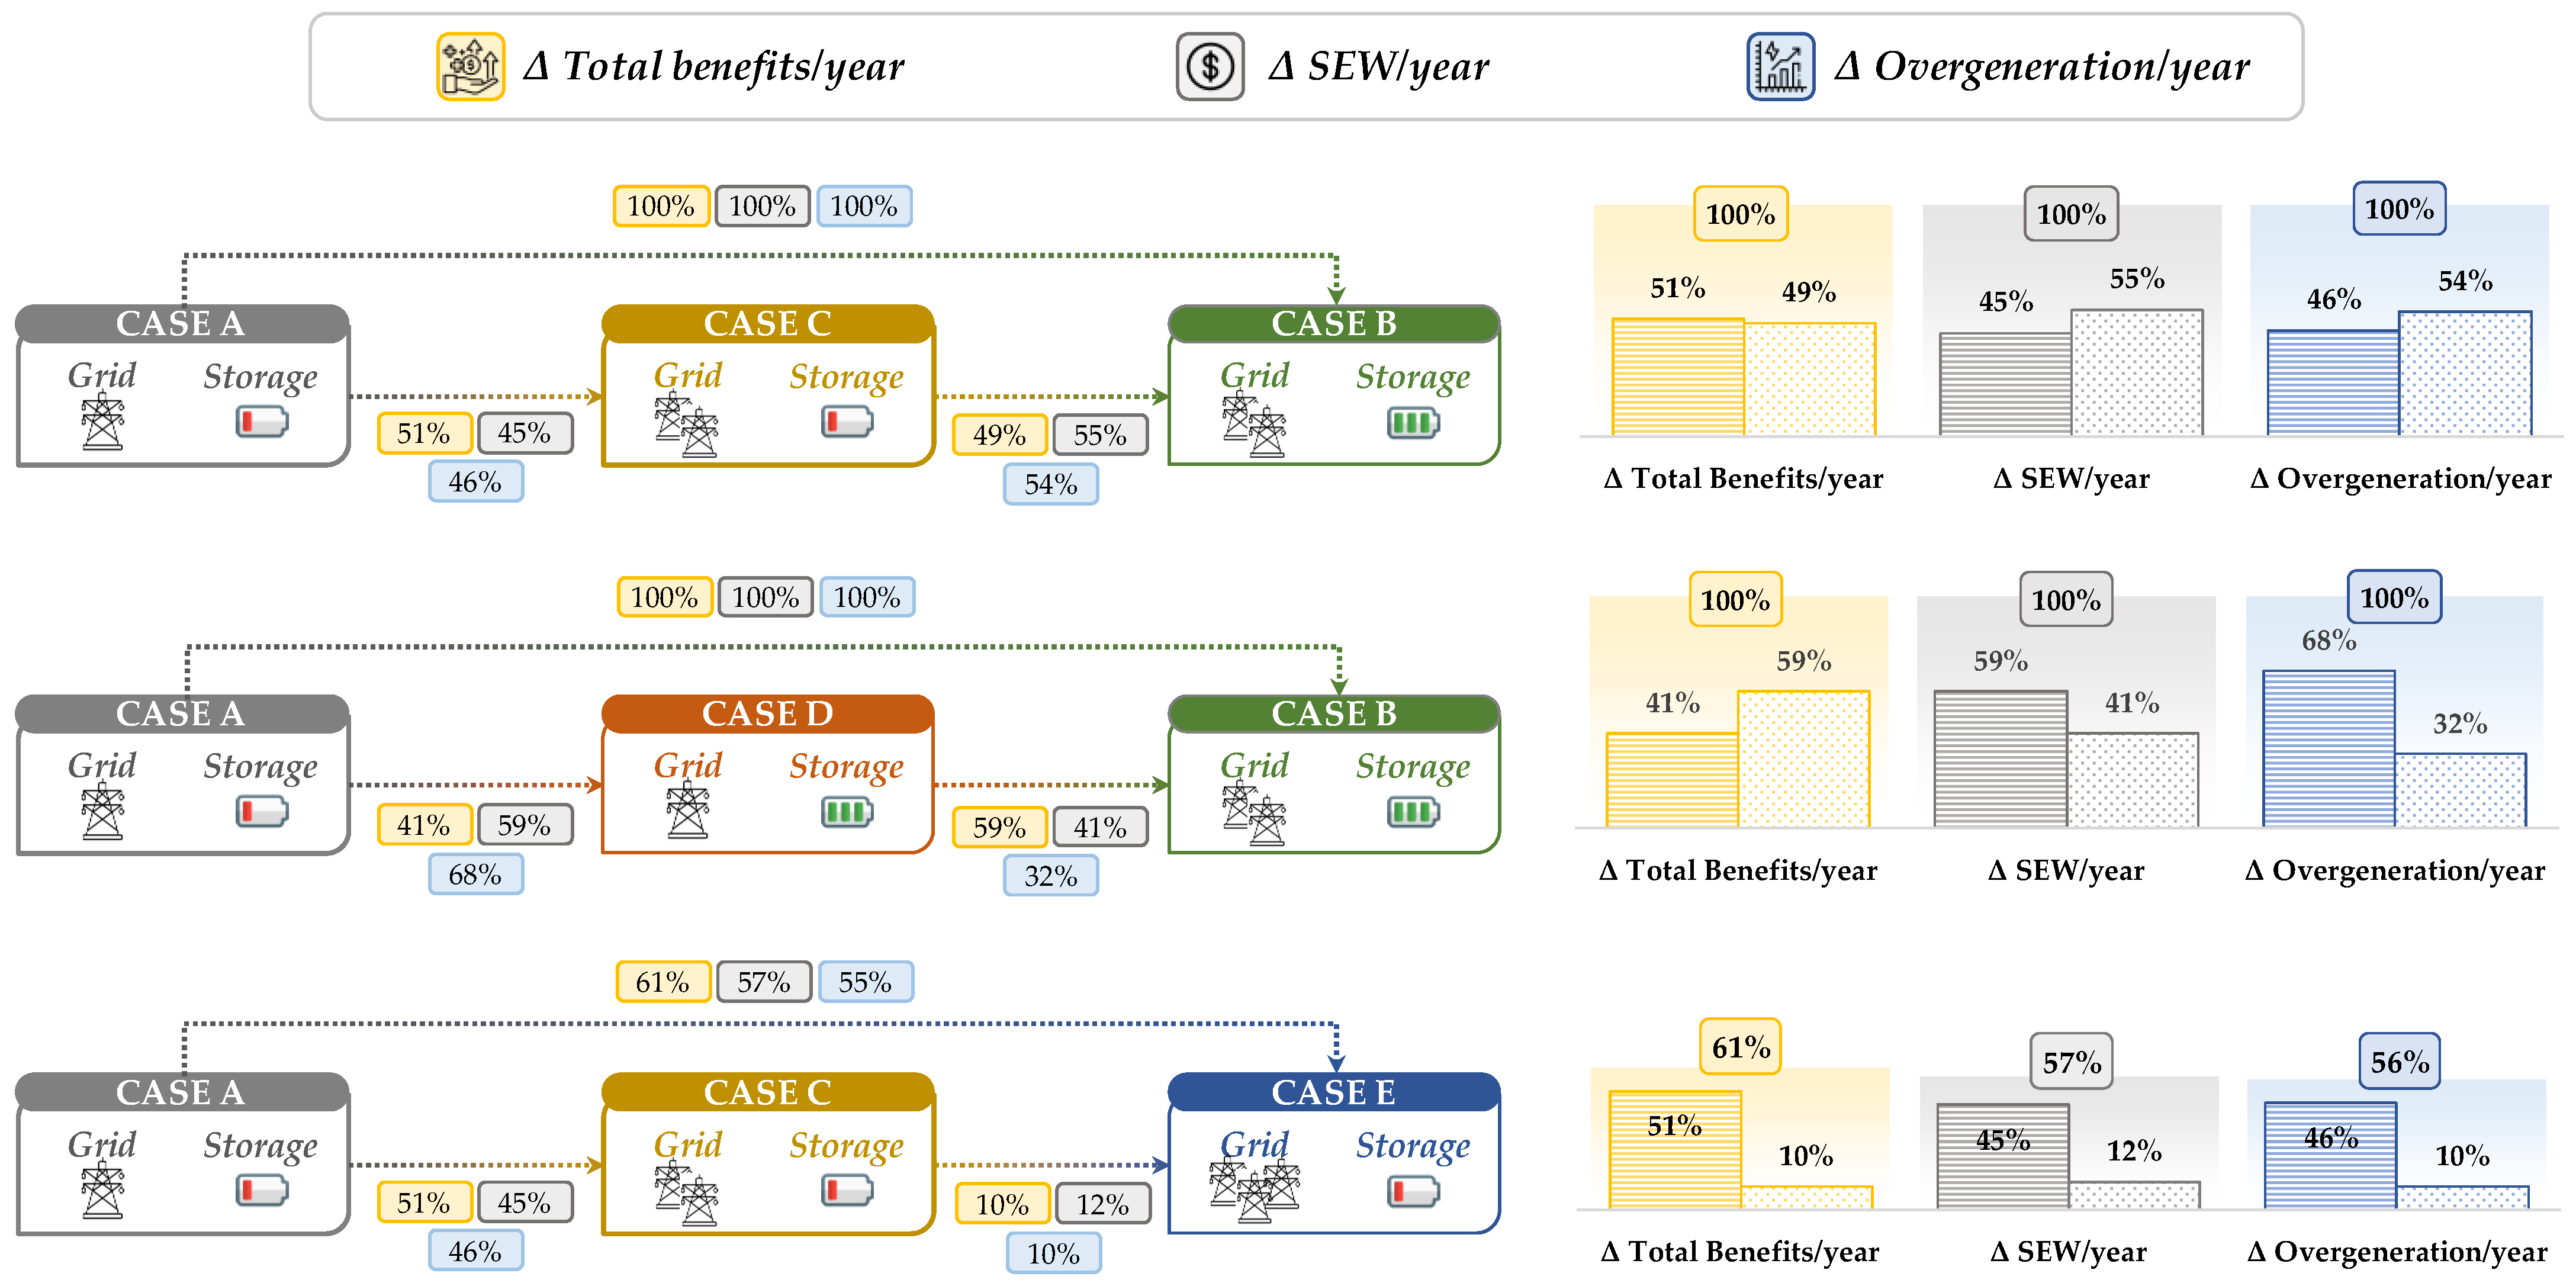
In addition, to further exploit the relevance of transmission and storage capacity synergic development as the most cost-efficient solution maximizing benefits for the entire system, different investment strategies were investigated and related impacts assessed by the means of the most significant indicators (i.e., “Total economic benefits”, “Socio-Economic Welfare” and “Overgeneration”). The cases under study are described in
Figure 14, detailing the simulated grid and storage capacity, while the different strategies compared are represented in
Figure 15, reporting also the indicators’ assessment.
Taking as a reference the incremental benefit obtained between Case B (optimal target capacity in the FF 55 scenario) compared to Case A (initial base case scenario) considering the simultaneous grid and storage capacity development, the benefit variations assessed in intermediate paths separately simulating the transmission network (from Case A to Case C) and the storage capacity (from Case A to Case D) evolutions are significantly lower. This evidence testifies to the importance of synergic and coordinated grid reinforcements and new storage installation combined solutions.
Finally, the investment option covering only the network development, leaving the storage capacity at current installed values, was investigated in the path from Case A to Case C until the transmission capacity values resulting from the target capacity assessment and from Case C to Case E including additional transmission capacity compensating for the absence of future storage systems: the benefit indicators appear significantly lower than the reference ones.
In conclusion, flexible energy storage systems are essential for achieving climate and energy objectives, and new methods are being developed to determine their optimal investment timing [
62].
6. Conclusions
New methodologies capable of designing development strategies in an efficient manner are required to solve the transmission expansion problem in the framework of competitive electricity markets.
This paper presents a novel heuristic methodology developed by the Italian TSO for the assessment of cost-effective target capacity assessment, consistent with regulator directives and main stakeholders’ feedback collected during several consultation rounds. The expansion of each internal section and external boundary of the Italian power system is simultaneously studied on the basis of an iterative process in all relevant mid- and very-long-term planning scenarios in order to identify an optimal development strategy in each scenario. In addition, the least regret approach allows the identification of the reference development strategy for the transmission system.
The outputs of this work are relevant to the policy makers, regulatory authority, and market participants to assess and co-design the power system expansion and transition towards a renewable-generation-based one.
The first application of the methodology dates to the year 2018. After positive opinions expressed by the Italian regulator and independent academic reviewers, the methodology was upgraded and applied in two following editions of the target capacity report in 2020 and 2023. A new (fourth) edition is required by the end of 2024.
